Abstract
A machine learning (ML) model, optimized by the Particle Swarm Optimization (PSO) algorithm, was developed in this study to predict the shear slip load of adhesive/bolt-reinforced corroded steel plates. An extensive database comprising 490 experimental or numerical specimens was initially employed to train the ML models. Eight ML algorithms (RF, AdaBoost, XGBoost, GBT, SVR, kNN, LightGBM, and CatBoost) were utilized for shear slip load prediction, with their hyperparameters set to default values. Subsequently, the PSO algorithm was employed to optimize the hyperparameters of the above ML algorithms. Finally, performance metrics, error analysis, and score analysis were employed to evaluate the prediction capabilities of the optimized ML models, identifying PSO-GBT as the optimal predictive model. A user-friendly graphical user interface (GUI) was also developed to facilitate engineers using the PSO-GBT model developed in this study to predict the shear slip load of adhesive/bolt-reinforced corroded steel plates.
1. Introduction
Many steel structural bridges in coastal areas are confronted with severe corrosion issues, as shown in Figure 1. These corrosion-related challenges decrease the load-bearing capacity and stability of steel components, thereby significantly impacting the overall structural safety of bridges. To mitigate the reduced load-bearing capacity caused by corrosion and wear, localized reinforcement techniques are necessary to enhance the bridge’s load-bearing capacity [1].
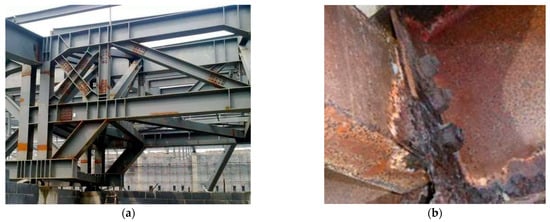
Figure 1.
Steel bridge corrosion. (a) Steel truss corrosion diagram, (b) High strength bolt node corrosion.
Compared to traditional methods like steel plate and FRP sheet reinforcement, the combination of adhesive and high-strength bolt (adhesive/bolt) connections incorporates the advantages of both adhesive bonding and bolted connections. The adhesive facilitates full-contact reinforcement between the steel plate and corroded steel plate interfaces. At the same time, high-strength bolts enhance the peel resistance at these interfaces, effectively increasing their load-bearing capacity. Additionally, the adhesive/bolt reinforcement method exhibits universality and low construction requirements [2,3,4,5,6,7,8,9,10,11].
In practical engineering applications, as shown in Figure 2, adhesive/bolt connections are utilized to enhance the load-bearing capacity of both new and existing structural components, thereby meeting the increasing daily load demands of steel bridges and reducing economic losses. This method is also effective in addressing reduced load-bearing capacities caused by corrosion in steel components, thereby significantly extending the service life of steel bridges. However, the theoretical derivation and calculation of shear load for adhesive/bolt-reinforced corroded steel plates are remarkably complex [12,13,14]. During design, calculations often rely on conservative estimates derived from formulas for high-strength bolt connections, leading to excessively conservative values for adhesive/bolt connections [5,15]. Therefore, further in-depth research is needed to refine the theoretical framework of bolt/adhesive connection reinforcement.
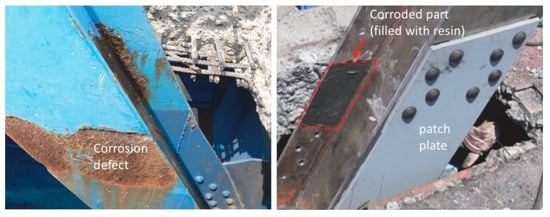
Figure 2.
Examples of repair of defective steel members by patch plate [15].
The thickness of the patch plate, bolt spacing, bolt edge distance, and other geometric factors influence the shear load capacity of adhesive/bolt connections [14]. The type of adhesive and the thickness of the adhesive layer affect the shear load capacity of adhesive/bolt connections by influencing the clamping force of high-strength bolts and the bonding performance of the adhesive layer [11]. For instance, a thicker adhesive layer may lead to the relaxation of clamping forces [3], decreasing shear load under the same conditions [5]. Current experimental research primarily focuses on individual factors’ impact on adhesive/bolt connections’ shear load-bearing capacity. For example, research by Wenbo Gao et al. [2] considered the influence of adhesive layer thickness and plate thickness. Research by Kuanfu Tanaka et al. [4] examined the load-bearing capacity of steel plates under the same corrosion level. Thus, the load-bearing capacity of corroded steel plates reinforced with multiple influencing factors still needs to be studied. Accurately estimating the shear bearing load of adhesive/bolt connections is a crucial step in the design of engineering structural reinforcements. However, existing calculation formulas mainly follow the friction-type high-strength bolt connection calculation formulas, using a conversion slip factor to roughly calculate the slip load instead of the friction coefficient. This approach has certain limitations, as it does not account for the impact of corrosion on the load-bearing performance. This paper aims to use machine learning to more accurately predict slip load values, providing guidance for the design phase of engineering reinforcement.
Machine learning (ML) has garnered significant attention in structural engineering in recent years. ML algorithms analyze and learn from comprehensive real-world engineering data, enabling them to solve complex structural engineering problems [16,17,18]. These algorithms autonomously discern the interconnections among a variety of intricate engineering parameters, including applications such as strength prediction [19,20,21,22,23] and corrosion prediction [24,25,26,27], thereby better understanding the factors influencing the load-bearing capacity of corroded steel plates reinforced with bonding and high-strength bolts. Applying ML models can speed up the prediction process, allowing for the consideration of the impact of different corrosion levels on strength reduction in steel plates during the design phase, thus yielding more reliable results. Therefore, applying ML models to assess the load-bearing capacity of corroded steel plates reinforced with adhesive/bolt connections under multiple factors holds considerable importance.
This study utilized a dataset comprising 45 sets of experimental data and 445 sets of numerical simulation data obtained through finite element analysis using the Abaqus 2021 software, incorporating seven parameter variables. The physical schematic diagram of the parameters is shown in Figure 3. This paper focuses on the development of interpretable machine learning (ML) models for predicting slip loads on steel plates subjected to corrosion using adhesives and bolts for reinforcement. Machine learning models such as Random Forest (RF), AdaBoost, XGBoost, Gradient-Boosting Tree (GBT), Support Vector Regression (SVR), K-Nearest Neighbours (kNN), LightGBM, and CatBoost are used in the study to accomplish the prediction task. Furthermore, the Particle Swarm Optimization (PSO) algorithm was used to construct the PSO-ML model, seeking the optimal combination of hyperparameters. The predictive capabilities of each model are evaluated using various performance metrics, determining the optimal model. Shapley additive explanation (SHAP) analysis was employed to interpret the ML models and identify the impact of each feature on the shear load. A graphical user interface (GUI) was also developed based on this research to predict the shear bearing load of corroded steel plates reinforced with bolt/adhesive connections.

Figure 3.
A physical schematic diagram of the input features.
2. Research Methodology
This study employed the machine learning method to predict the load-bearing capacity of corroded steel plates reinforced with adhesive/bolt connections, and validation was conducted. The PSO technique was used to optimize the parameters of the ML model due to its global search capability. Figure 4 provides a graphical representation of the machine learning (ML) model and the Particle Swarm Optimization (PSO) algorithm.
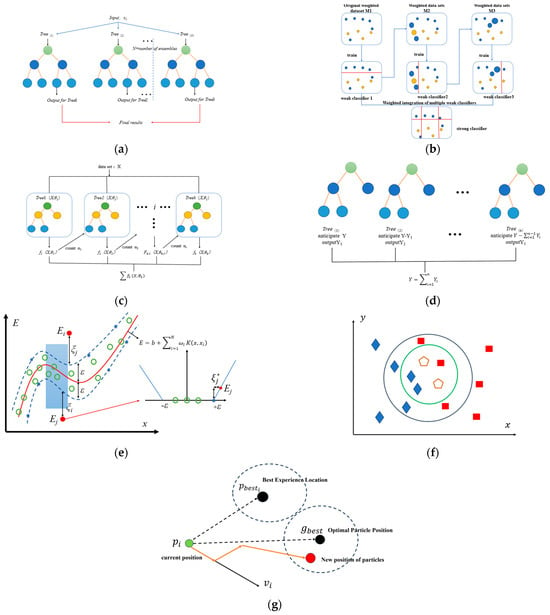
Figure 4.
Graphical representation of the ML model and PSO algorithm used. (a) RF, (b) AdaBoost, (c) XGBoost, (d) GBT, (e) SVR, (f) kNN, (g) PSO [28].
2.1. A Concise Explanation of ML Algorithms
2.1.1. RF
The Random Forest (RF) [28] algorithm is an ensemble learning technique that serves as a choice for classification and regression tasks. This algorithm also helps prevent the model from overfitting [29].
2.1.2. AdaBoost
The Adaptive Boosting algorithm, commonly referred to as AdaBoost, is a well-regarded ensemble method extensively used for tackling both regression and classification challenges. AdaBoost constructs a robust overall classifier by combining the decisions of multiple weak classifiers. As weak classifiers adapt to misclassified samples in each round, AdaBoost achieves a high degree of fit to the training data. However, this adaptability may pose a risk of overfitting, particularly in scenarios with abundant noise or outliers [30].
2.1.3. XGBoost
Extreme Gradient Boosting (XGBoost) [31] is a highly esteemed ML algorithm, celebrated for its superior performance, and it falls under the umbrella of ensemble learning techniques. In this algorithm, each new model strives to reduce the errors generated by the preceding model. Through iterative refinement, XGBoost can develop increasingly stable and reliable models, ultimately achieving high levels of generalization capability.
2.1.4. GBT
Gradient-Boosting Tree (GBT) [32] is a popular machine learning algorithm utilized for regression and classification tasks, belonging to the boosting category of ensemble learning methods. Its fundamental concept involves gradually constructing a strong learner by combining multiple weak learners, typically decision trees. Various techniques are incorporated into GBT to adjust model complexity, including depth restriction, learning rate, and subsample ratio. This progressive optimization strategy renders GBT highly flexible and capable of achieving excellent performance across diverse datasets.
2.1.5. SVR
Support Vector Machines (SVMs) are a set of supervised learning methods used for classification, regression, and outlier detection. Support Vector Regression (SVR) [33] is an extension of the SVM algorithm. Unlike SVM for classification, which focuses on finding a hyperplane that maximizes the margin between classes, SVR aims to find a function that predicts continuous values.
2.1.6. kNN
The K-Nearest Neighbors (kNN) [34] algorithm is indeed a popular and straightforward machine learning technique that can be used for both classification and regression tasks. kNN uses a distance metric, typically the Euclidean distance, to measure the distance between data points. kNN relies on the principle of similarity, where the prediction for a test point is based on the most similar training points. However, it is important to carefully select the value of ‘k’ and consider the impact of feature scaling to ensure optimal performance.
2.1.7. LightGBM
The Light Gradient-Boosting Machine (LightGBM) [35] algorithm utilizes a histogram-based algorithm, which discretizes continuous feature values into discrete bins. Compared to other gradient-boosting frameworks, LightGBM enhances the speed and efficiency of model training while reducing memory usage.
2.1.8. CatBoost
CatBoost [36] is an open-source machine learning library specializing in Gradient-Boosting Decision Tree (GBDT) technology. CatBoost can handle categorical features directly without the need for complex data preprocessing. It constructs models using gradient-boosting methods. By incrementally building decision trees, where each new tree attempts to correct the difference between the sum of the predictions of all preceding trees and the actual results, CatBoost facilitates the learning process of residuals from the previous step. Moreover, it employs symmetric trees to reduce model training time.
2.1.9. PSO
The Particle Swarm Optimization (PSO) algorithm is inspired by the social behavior of biological groups such as bird flocks and fish schools to solve optimization problems by optimizing nonlinear functions through tracking particle behavior. PSO describes particles through three variables: position, velocity, and fitness value. By computing the updated position of particles, PSO determines the optimal solution. Each particle in the system follows a predefined global best path (gbest) and determines its own best path (pbest). The PSO algorithm utilizes random variables and adjusts particle velocity to converge towards pbest and gbest positions in each iteration [37].
In a PSO scenario, the dimensionality of the problem space is denoted by N, and there are M particles searching within this space. The position and velocity vectors of each particle are represented by Xij and Vij, respectively. The velocity vectors are updated using the formulas presented in Equations (1)–(4). Here Ω, cn, and rn represent inertia weights, acceleration coefficients, and random numbers, respectively. Thus, the new location of each particle is determined by summing its existing position with the velocity vector, as illustrated in Equation (4).
2.2. Research Data and Statistical Analysis
This study primarily investigates machine learning (ML) algorithms for predicting the load-bearing capacity of corroded steel plates reinforced with bonding and high-strength bolts. Studying the load-bearing performance of steel components after corrosion reinforcement holds significant importance. The database constructed mainly comprises 45 sets of experimental data and 440 sets of finite element numerical analysis data, as detailed in Table 1. The figures of the experimental and finite element model specimens are shown in Figure 5. The simulation database was established using validated finite element models, and the corresponding slip load values were obtained through parameterization. The finite element model in this study underwent a mesh sensitivity analysis, revealing that when the mesh element size is 5 mm or smaller, the calculation results (such as stress, strain, and displacement) tend to stabilize, with deviations of less than 1%. Selecting a 5 mm approximate element size can ensure calculation accuracy while reducing computation time and cost. To ensure consistent mesh density between the master and slave surfaces, the contact area of the components was meshed uniformly. The final mesh division of the components adopts an approximate element size of 5 mm, with a curvature control maximum deviation factor of 0.1 and a minimum size factor of 0.1. Model validation was conducted by using the commercial finite element software ABAQUS 2021 to create one-to-one models based on 45 specimens. The slip loads of the models were extracted and compared with the experimental values, with an average overall error of 3.53%, indicating the effectiveness of the model. This study aims to establish a predictive model for the load-bearing capacity of adhesive/bolt-reinforced corroded steel plates. The critical variables considered include adhesive layer thickness, bolt spacing, bolt edge distance, adhesive type, patch plate thickness, corrosion width, corrosion ratio, equivalent slip coefficient, and clamping force. The details of input features are outlined in Table 1.

Table 1.
Statistical information from the collected database.
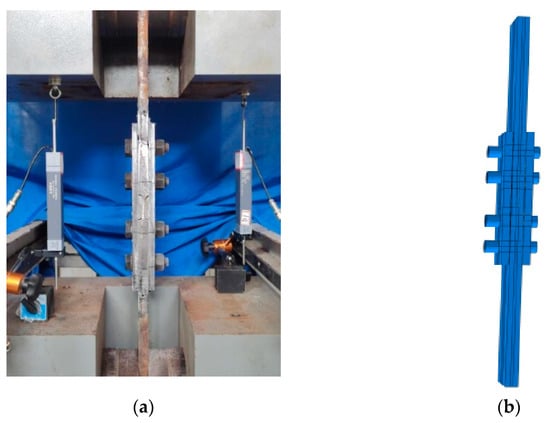
Figure 5.
Tests and finite element simulation. (a) Test device; (b) finite element model.
The Pearson correlation matrix is a tool for assessing the relationships between independent variables. This matrix measures the linear relationship between two variables, ranging from −1 to 1. A value of −1.0 indicates a strong negative correlation between two variables, while 1.0 denotes a strong positive correlation. Values close to 0 suggest no linear relationship between the variables. From Figure 6, it can be observed that the correlation coefficients between input and output features fall within the range of 0 to 1.0. Bolt spacing, bolt edge distance, equivalent slip coefficient, and clamping force weakly correlate with shear slip load; corrosion width and rate demonstrate a strong negative correlation with shear slip load. There is no apparent correlation between the ultimate load and the input features. This study primarily focuses on predicting shear slip load.
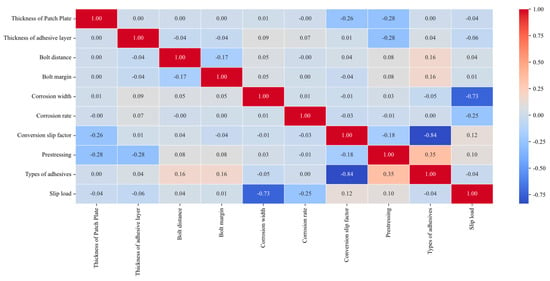
Figure 6.
Matrix of correlation coefficients between input and output features.
2.3. Development of Prediction Models
2.3.1. Basic Framework
The holdout method is employed in this study to divide the database into two mutually exclusive parts, with one being designated as the training set and the other as the test set. In order to ensure the accuracy and reliability of model evaluation results, the samples are allocated for training in the range of 60% to 80%. Consequently, the performance is evaluated based on different training and testing data split ratios of 60% versus 40%, 70% versus 30%, and 80% versus 20%. It is found from the results of machine learning that the model trained with an 80% versus 20% split ratio achieves a performance close to approximately 90%. Lower performance is observed for the other three split ratios compared to the 80% versus 20% model. Therefore, a split ratio of 80% versus 20% is adopted for the ML models utilized in this study. Eight different ML algorithms (RF, AdaBoost, XGBoost, GBT, SVR, kNN, LightGBM, and CatBoost) were selected. The hyperparameters of each model are optimized by a particle swarm algorithm to improve its performance. SHAP analysis was used to elucidate the ML model, aiming to understand the impact of each feature and the interactions among different features on the shear slip load of corroded steel plates reinforced with adhesive and high-strength bolts. Additionally, a GUI has been designed for the convenience of utilizing the ML model developed in this study to predict the shear slip load of corroded steel plates after bolted connection reinforcement.
2.3.2. Data Preprocessing and Setting Hyperparameters
The MinMaxScaler module from the sklearn was utilized to normalize the data, ensuring that different feature values consistently impact the model performance. In this study, the categorical feature “Type of adhesive” is encoded using label encoding, where each category is mapped to a unique integer before normalization of the data. In order to enhance the performance of the ML model, appropriate hyperparameter values must be selected, as these parameters directly influence the model and can be adjusted by the model creator. The PSO algorithm optimized the hyperparameter values and generated the optimal model performance settings [38,39]. Within the PSO algorithm, the particle swarm size was set to 10, with a maximum iteration step of 100, while other hyperparameter values remained at their default settings [40]. Table 2 presents the optimal values obtained through the PSO algorithm for hyperparameter optimization in the PSO-ML model, detailing the type and range of each hyperparameter.

Table 2.
Optimal hyperparameters of ML model obtained using PSO algorithm.
2.3.3. Performance Evaluation Metrics
A range of performance metrics, such as R-squared (R2), Root Mean Square Error (RMSE), Mean Absolute Percentage Error (MAPE), and Mean Absolute Error (MAE), were utilized to evaluate the model’s performance. A higher R2 value indicates better ML model performance, while lower RMSE, MAPE, and MAE values suggest improved model performance. The formulas for these four performance metrics are provided as Equations (5)–(8), respectively.
where yi, yp, ym, and n denote actual, predicted, mean, and number of data points, respectively.
3. Results and Discussion
3.1. Performance of the Forecasting Models
Figure 7 illustrates the performance comparison between the ML models’ test values (Ftest) and predicted values (Fpred). Table 3 provides a thorough assessment of the respective R2, RMSE, MAPE, and MAE values across the training, testing, and entire datasets. In the comparison shown in Figure 7, three fitted curves are presented: y = x, y = 1.2x, and y = 0.8x, where y = x represents the predicted values equaling the test values. More points near the y = x line indicate a stronger predictive capability of the model. As shown in Figure 7, the PSO-ML model on the optimized training set demonstrates that most predicted points closely align with y = x, indicating a robust fitting capability of all developed PSO-ML models. The study reveals that RF, XGBoost, GBT, and CatBoost perform well, while kNN and AdaBoost exhibit relatively poorer performance. Although a few forecasted points from the entire suite of PSO-ML models lie beyond the bounds defined by y = 0.8x and y = 1.2x, the bulk of these forecasts are observed to be nearly aligned with the actual test data.
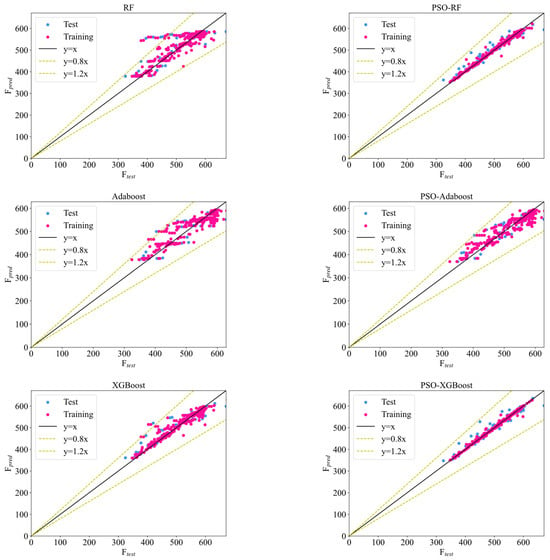
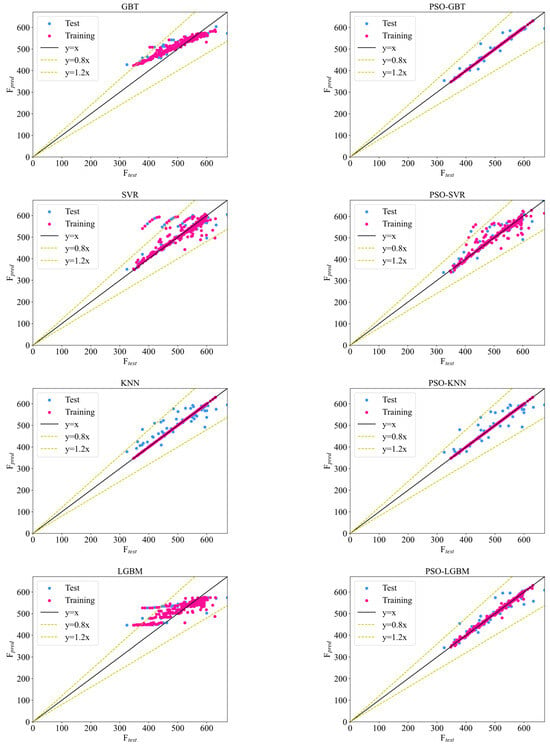
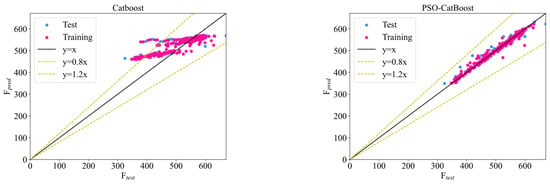
Figure 7.
Scatterplot of test data vs. prediction via ML model.

Table 3.
ML model performance.
From Table 3, it can be observed that PSO-GBT, PSO-CatBoost, PSO-XGB, and PSO-RF perform excellently. The overall R2 values are 0.992, 0.9839, 0.9866, and 0.9871, while the RMSE values are 6.4, 8.115, 8.263, and 9.074. These algorithms are all based on decision tree algorithms, which are capable of detecting complex relationships among the data. Due to the specific features of the dataset, these algorithms can better adapt to dynamic changes and are more robust to outliers in the data, thereby obtaining more reliable results and improving their performance. Table 3 clearly demonstrates that all PSO-ML models have displayed commendable predictive capabilities across both the training and testing datasets. Among them, PSO-GBT performs the best on the training dataset, with an R2 value of 0.99988 and an RMSE value of 0.761; on the testing dataset, its R2 value is 0.9668, and the RMSE value is 14.23. Except for the testing data of PSO-kNN, the R2 values of other testing datasets are all higher than 0.9, indicating good overall predictive performance.
The results show that the optimized PSO-ML model has better prediction ability than the default ML model. In particular, PSO-GBT, PSO-RF, PSO-XGB, and PSO-CatBoost have higher prediction accuracy. These results can offer valuable guidance to researchers in developing the best machine learning prediction models for forecasting the load capacity of corroded steel plates reinforced with adhesive and high-strength bolts.
3.2. Error Analysis
Figure 8 illustrates the error between the ML model predictions and the test results. The PSO algorithm greatly reduces the error of the ML models. Among the eight ML models, PSO-GBT shows the smallest error with a mean error value of 1.247 kN. It shows that the model has high prediction accuracy and performs well in forecasting the shear slip load of corroded steel plates reinforced with adhesive and high-strength bolts. Due to its outstanding predictive accuracy and reliability, PSO-GBT is currently the best choice among these ML models. The sources of error between the predicted and tested values are twofold. First, in the simulation, the electrochemical corrosion depth is averaged over the deepest section in the actual scenario. The validation model’s extracted error is approximately 3.53%, which is related to the simplification of the corrosion area. Second, the simulated section employs a penalty friction form. Ideally, this value should be derived from actual measurements; here, the average value from specimens with the same geometric parameters, obtained through experiments, is used as the equivalent slip coefficient.
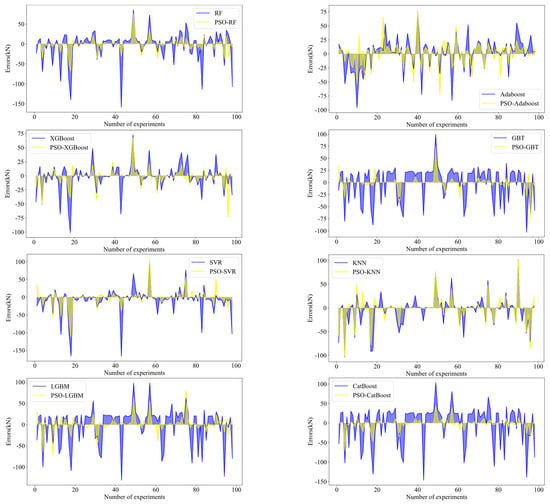
Figure 8.
Error values between ML model prediction results and test results.
3.3. Score Analysis
Score analysis serves as a valuable tool for evaluating the efficacy of various models during both the training and testing phases, thereby facilitating the identification of top-performing as well as underperforming models. In this evaluation, the models are graded according to their performance, with scores being allocated corresponding to their respective rankings. The model with the best results was ranked highest, which is “m” (in this study, “m” was set to 16 to represent the number of all models), while the model with the worst results was ranked lowest, which is “1”. Then, scores for the training and testing stages are calculated separately, and these scores are added together to obtain the final score. Table 4 furnishes an in-depth interpretation of the scoring evaluation, showcasing the respective model scores for both the training and testing phases. From Table 4, it can be observed that PSO-GBT and PSO-CatBoost are the top two models in terms of scores, demonstrating excellent performance in both training and testing.

Table 4.
Analysis of ML model scores.
3.4. Model Interpretation
Machine learning (ML) models frequently earn the moniker of being “black box” models. Machine learning model interpretation has important implications for model transparency and reliability. The significance of features is extensively employed to gauge the influence of various input variables on the outcome target, aiding in the elucidation of the decision-making mechanisms within machine learning models [41]. In recent years, SHAP analysis has become popular in explaining ML models [42]. Lundberg and Lee’s introduction of SHAP (SHapley Additive exPlanations) analysis is indeed a significant contribution to the field of machine learning, particularly in the area of model interpretability. SHAP analysis is a powerful tool for explaining the output of machine learning models, offering both local and global explanations for the role of each feature.
The SHAP explanatory model is defined as follows:
In the formula, , k is the number of features, is a constant, and is the SHAP value of the j-th feature and can be expressed as
where F denotes all features and denotes the input values in the subset S.
The top-performing models, namely PSO-GBT and PSO-CatBoost, were employed for feature importance analysis. Figure 9 illustrates the importance assessment of the input features of the best two ML models based on the SHAP values. Figure 10 summarizes the overall shape of SHAP values. It can be observed from the figures that the two most important features for predicting the shear slip load of adhesive/bolt-reinforced corroded steel plates are corrosion width and corrosion ratio. Figure 10 shows that the performance difference between PSO-CatBoost and PSO-GBT mainly stems from variations in the importance of bolt spacing, adhesive type, and bolt margin. From Figure 9 and Figure 10, it is evident that the two most important features for predicting the slip load of adhesive/bolt-reinforced steel plates are corrosion width and corrosion ratio, consistent across both models. The existing load-bearing capacity formulas for adhesive/bolt connections overlook the impact of the corrosion location on the repaired load-bearing capacity. This omission may be one of the reasons why the current formulas fail to accurately predict the load-bearing capacity.

Figure 9.
SHAP-based feature importance. (a) PSO-GBT; (b) PSO-CatBoost.

Figure 10.
Summary plot of SHAP for PSO-GBT and PSO-CatBoost models. (a) PSO-GBT; (b) PSO-CatBoost.
4. Graphical User Interface
A graphical user interface (GUI) was developed using Python 3.9 to facilitate utilizing the machine learning (ML) models developed in this research. The ML model demonstrates higher accuracy in predicting the shear slip load of adhesive/bolt-reinforced corroded steel plates. Figure 11 illustrates the appearance of the GUI. Creation of a GUI through the Tkinter module that can convert the results into an executable file has passed testing. Consequently, researchers can efficiently predict the shear slip load of reinforced corroded steel plates solely by using this GUI without other programs or tools, thus avoiding multiple expensive and time-consuming experimental tests.
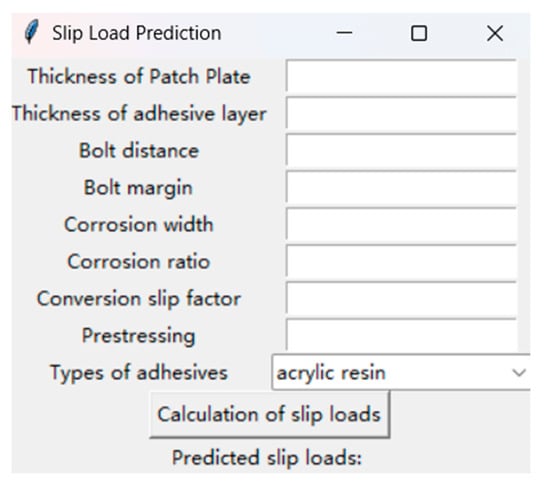
Figure 11.
GUI for slip load values of adhesive/bolt-reinforced corroded steel plates.
5. Summary and Conclusions
This study developed machine learning (ML) predictive models to predict adhesive/bolt-reinforced corroded steel plate shear slip loads. The main conclusions and achievements are as follows:
(1) The PSO-ML model demonstrates outstanding predictive performance compared to traditional ML models, indicating the influential role of PSO in enhancing model performance. The application of PSO on simple algorithms (SVR and kNN) leads to more efficient prediction than tree-based models (RF, for example).
(2) Among all PSO-ML models, PSO-GBT stands out for its excellent predictive performance, with the advantage of lower error and higher accuracy, with a maximum overall score of 118.
(3) The most crucial input parameters affecting adhesive/bolt-reinforced corroded steel plate shear slip load are identified through SHAP-based feature importance analysis, including corrosion width and corrosion ratio. The importance ranking of features is as follows: corrosion width > corrosion ratio > equivalent slip coefficient > clamping force > patch plate thickness > bolt spacing > adhesive type > bolt margin > adhesive layer thickness.
(4) An intuitive graphical user interface (GUI) was designed that takes into account the effects of corrosion to efficiently predict the shear slip load of adhesive/bolt-reinforced corroded steel plates.
(5) This study establishes a GUI for predicting slip load values based on a PSO-GBT trained model, which has certain limitations. The model cannot predict slip load values for adhesives not used in the experiments; corresponding experimental data need to be included for training.
In summary, the outcomes of this study can provide reasonable references for calculating the bearing capacity of adhesive/bolt-reinforced corroded steel plates in practical engineering applications.
Author Contributions
Conceptualization, X.Z. and M.L.; methodology, X.Z. and M.L.; software, X.Z., W.L. and M.L.; validation, X.Z. and M.L.; formal analysis, X.Z. and M.L.; investigation, X.Z. and M.L.; resources, X.Z., Q.L. and M.L.; data curation, X.Z. and M.L.; writing—original draft preparation, X.Z. and M.L.; writing—review and editing, X.Z. and M.L.; visualization, X.Z. and M.L.; supervision, X.Z., G.S. and M.L.; project administration, X.Z. and M.L.; funding acquisition, M.L. All authors have read and agreed to the published version of the manuscript.
Funding
The authors greatly appreciate the financial support from the Postgraduate Research Innovation Program of Jiangsu Province, China (grant number: KYCX23_3339).
Data Availability Statement
The data presented in this study are available on request from the corresponding author. The data are temporarily not publicly available due to involvement with experimental data related to a paper that has not yet been published.
Conflicts of Interest
The authors declare no conflict of interest.
Nomenclature
| dm | Motherboard plate thickness, plate thickness 20 | cn | Acceleration coefficients |
| dj | Thickness of adhesive layer | rn | Random numbers |
| dg | Thickness of patch plate | Ω | Inertia weights |
| ds | Residual plate thickness of corroded section | pbestij | Personal best path |
| cw | Corrosion width | gbestij | Global best path |
| θ | Corrosion ratio, θ = ds/dm | Fpred | Predicted values |
| bm | Bolt margin | Ftest | Test values |
| bd | Bolt distance | Min. | Minimum |
| bc | Distance between bolt centers, value 120 mm | Max. | Maximum |
| fs | Conversion slip factor | Std. | Standard deviation |
| ym | Average data points | yi | Actual data points |
| n | Number of data points | yp | Predicted data points |
| ∣S∣ | Size of subset S | ϕj | SHAP value for the j-th feature |
| ∣F∣ | Total number of features | ||
| Position vector of the i-th particle in the swarm, where j indicates the dimension of the search space. | |||
| Updated position of the i-th particle in the next iteration (t + 1) | |||
| Velocity vector of the i-th particle | |||
| Updated velocity of the i-th particle in the next iteration (t + 1) | |||
| Model output when the features in subset S and the j-th feature are present | |||
| fS () | Model output when only the features in subset S are present | ||
References
- Editorial Department of China Journal of Highway and Transport. Review on China’s Bridge Engineering Research: 2021. China J. Highw. Transp. 2021, 34, 1–97. [Google Scholar] [CrossRef]
- Gao, W.; Wang, W.; Kong, X. Mechanical properties of bolted bonded composite steel joints. China Civ. Eng. J. 2020, 53 (Suppl. S1), 367–370. [Google Scholar] [CrossRef]
- Jun, M.; Yoshiki, T.; Takahito, F. Experimental study on static behavior of bolted connections with epoxy resin fillers. J. Struct. Eng. A 2008, 54A, 563–574. [Google Scholar] [CrossRef]
- Yoshio, T.; Shinya, Y.; Takashi, Y.; Kunitomo, S. Experimental study on patching plate repair with high strength bolts and adhesive subjected to axial force. J. Struct. Eng. A 2015, 61A, 585–596. [Google Scholar] [CrossRef]
- Yoshio, T.; Hiroki, S.; Shogo, F.; Takashi, Y.; Takashi, F.; Hisakazu, H. Experimental study on tensile strength of high strength bolted joints with adhesive applied to inorganic zinc-rich paint surface. J. Struct. Eng. A 2018, 64A, 503–515. [Google Scholar] [CrossRef]
- Ryota, Y.; Toshiyuki, I.; Hideto, K. Study on high-strength bolted connection with bolt holes filled by epoxy resin. J. Struct. Eng. A 2018, 64A, 516–529. [Google Scholar] [CrossRef]
- Toshiyuki, I.; Takuya, I.; Hisakazu, H. Fundamental study on the repair of steel member by mixed joint of adhesive and high-strength bolt friction joints. J. Struct. Eng. A 2021, 67A, 384–397. [Google Scholar] [CrossRef]
- Sae, F.; Takashi, F.; Takashi, Y.; Yasumoto, A.; Shinsuke, A.; Hisakazu, H.; Yoshiki, T. Fundamental study on slip behavior and slip strength of the high strength bolted joints with adhesive for putty lining on the contact face. J. Struct. Eng. A 2022, 68A, 468–480. [Google Scholar] [CrossRef]
- Ikeda, T.; Ishikawa, T.; Horii, H. Load transmission of high-strength bolted patch plate with adhesive joint at the ends. Steel Constr. Eng. 2018, 25, 91–99. [Google Scholar] [CrossRef]
- Toshiyuki, I.; Horii, H. Evaluation of stress transmission on the repair of steel member by the combined joint of adhesive and high-strength bolt joints. J. Struct. Eng. A 2022, 68A, 25–38. [Google Scholar] [CrossRef]
- Boretzki, J.; Albiez, M. Static strength and load bearing behaviour of hybrid bonded bolted joints: Experimental and numerical investigations. J. Adhes. 2023, 99, 606–631. [Google Scholar] [CrossRef]
- Zuo, P.; Ni, Y.; Bi, X.; Chen, X. Research Development on Bonded-bolted Hybrid Joint in Composite Structure. Adv. Aeronaut. Sci. Eng. 2021, 12, 1–12. [Google Scholar] [CrossRef]
- Ma, Y.; Zhang, K.; Zhao, Q. Analysis of bearing capacity of bonded-bolted hybrid composite joints. Acta Mater. Compos. Sin. 2011, 28, 225–230. [Google Scholar] [CrossRef]
- Yuan, H.; Liu, P.; Zhao, Q.; Ma, Y. Research on the influence factors of the bearing capacity for bonded-bolted hybrid joints. FRP/CM 2013, 66–71. [Google Scholar] [CrossRef]
- Ishikawa, T.; Yaegaki, R. Estimation of axial-force sharing of cross-sectional loss in steel members repaired by patch plates with high-strength bolts under axial loading. J. Jpn. Soc. Civ. Eng. Ser. A1 2022, 77, 93–106. [Google Scholar] [CrossRef]
- Ye, M.; Li, L.F.; Yood, Y.; Li, H.H.; Zhou, C.; Shao, X.D. Prediction of shear strength in UHPC beams using machine learning-based models and SHAP interpretation. Constr. Build. Mater. 2023, 408, 133752. [Google Scholar] [CrossRef]
- Alshboul, O.; Almasabha, G.; Al-Shboul, K.F.; Shehadeh, A. A comparative study of shear strength prediction models for SFRC deep beams without stirrups using Machine learning algorithms. Structures 2023, 55, 97–111. [Google Scholar] [CrossRef]
- Rahman, J.; Ahmed, K.S.; Khan, N.I.; Islam, K.; Mangalathu, S. Data-driven shear strength prediction of steel fiber reinforced concrete beams using machine learning approach. Eng. Struct. 2021, 233, 111743. [Google Scholar] [CrossRef]
- Sandeep, M.S.; Tiprak, K.; Kaewunruen, S.; Pheinsusom, P.; Pansuk, W. Shear strength prediction of reinforced concrete beams using machine learning. Structures 2023, 47, 1196–1211. [Google Scholar] [CrossRef]
- Cui, X.N.; Wang, Q.C.; Zhang, R.L.; Dai, J.P.; Li, S. Machine learning prediction of concrete compressive strength with data enhancement. J. Intell. Fuzzy Syst. 2021, 41, 7219–7228. [Google Scholar] [CrossRef]
- Tie, J.H.; Meng, W.Z.; Wei, M.D.; Wu, W. Loading Rate and Mineralogical Controls on Tensile Strength of Rocks: A Machine Learning View. Rock Mech. Rock Eng. 2023, 56, 6119–6125. [Google Scholar] [CrossRef]
- Nassiraei, H. Probability distribution functions for the ultimate strength of X-joints with collar plates in compressive load at room and fire conditions. Structures 2024, 59, 105703. [Google Scholar] [CrossRef]
- Shi, M.; Shen, W.G. Automatic Modeling for Concrete Compressive Strength Prediction Using Auto-Sklearn. Buildings 2022, 12, 1406. [Google Scholar] [CrossRef]
- Ma, S.J.; Du, Y.X.; Wang, S.S.; Su, Y.J. Application of machine learning in material corrosion research. Corros. Rev. 2023, 41, 417–426. [Google Scholar] [CrossRef]
- Coelho, L.B.; Zhang, D.W.; Van Ingelgem, Y.; Steckelmacher, D.; Nowe, A.; Terryn, H. Reviewing machine learning of corrosion prediction in a data-oriented perspective. NPJ Mater. Degrad. 2022, 6, 8. [Google Scholar] [CrossRef]
- Li, Z.; Long, Z.L.; Lei, S.; Liu, X.W.; Yang, L.M.; Zhang, W.; Zhang, T. Evaluating the corrosion resistance of marine steels under different exposure environments via machine learning. Phys. Scr. 2023, 98, 015402. [Google Scholar] [CrossRef]
- Diao, Y.P.; Yan, L.C.; Gao, K.W. Improvement of the machine learning-based Corrosion ratio prediction model through the optimization of input features. Mater. Des. 2021, 198, 109326. [Google Scholar] [CrossRef]
- Ergen, F.; Katlav, M. Investigation of optimized machine learning models with PSO for forecasting the shear capacity of steel fiber-reinforced SCC beams with/out stirrups. J. Build. Eng. 2024, 83, 108455. [Google Scholar] [CrossRef]
- Thai, H.-T. Machine learning for structural engineering: A state-of-the-art review. Structures 2022, 38, 448–491. [Google Scholar] [CrossRef]
- Zhang, J.; Ma, G.; Huang, Y.; Sun, J.B.; Aslani, F.; Nener, B. Modelling uniaxial compressive strength of lightweight self-compacting concrete using random forest regression. Constr. Build. Mater. 2019, 210, 713–719. [Google Scholar] [CrossRef]
- Kaloop, M.R.; Kumar, D.; Samui, P.; Hu, J.W.; Kim, D. Compressive strength prediction of high-performance concrete using gradient tree boosting machine. Constr. Build. Mater. 2020, 264, 120198. [Google Scholar] [CrossRef]
- Feng, D.C.; Wang, W.J.; Mangalathu, S.; Taciroglu, E. Interpretable XGBoost-SHAP Machine-Learning Model for Shear Strength Prediction of Squat RC Walls. J. Struct. Eng. 2021, 147, 3115. [Google Scholar] [CrossRef]
- Zhang, S.; Li, X.C. A comparative study of machine learning regression models for predicting construction duration. J. Asian Archit. Build. Eng. 2023. latest articles. [Google Scholar] [CrossRef]
- Li, K.; Long, Y.P.; Wang, H.; Wang, Y.F. Modeling and Sensitivity Analysis of Concrete Creep with Machine Learning Methods. J. Mater. Civ. Eng. 2021, 33, 3843. [Google Scholar] [CrossRef]
- Kang, M.; Yoo, D.Y.; Gupta, R. Machine learning-based prediction for compressive and flexural strengths of steel fiber-reinforced concrete. Constr. Build. Mater. 2021, 266, 121117. [Google Scholar] [CrossRef]
- Lin, P.F.; Ding, F.; Hu, G.; Li, C.; Xiao, Y.Q.; Tse, K.T.; Kwok, K.C.S.; Kareem, A. Machine learning-enabled estimation of crosswind load effect on tall buildings. J. Wind. Eng. Ind. Aerodyn. 2022, 220, 104860. [Google Scholar] [CrossRef]
- Xu, J.G.; Hong, W.; Zhang, J.; Hou, S.T.; Wu, G. Seismic performance assessment of corroded RC columns based on data-driven machine-learning approach. Eng. Struct. 2022, 255, 113936. [Google Scholar] [CrossRef]
- Ji, Y.; Liew, A.; Yang, L.X. A Novel Improved Particle Swarm Optimization With Long-Short Term Memory Hybrid Model for Stock Indices Forecast. IEEE Access 2021, 9, 23660–23671. [Google Scholar] [CrossRef]
- Ruma, J.F.; Adnan, M.S.G.; Dewan, A.; Rahman, R.M. Particle swarm optimization based LSTM networks for water level forecasting: A case study on Bangladesh river network. Results Eng. 2023, 17, 100951. [Google Scholar] [CrossRef]
- Gad, A.G. Particle Swarm Optimization Algorithm and Its Applications: A Systematic Review. Arch. Comput. Methods Eng. 2023, 30, 3471. [Google Scholar] [CrossRef]
- Feng, D.C.; Liu, Z.T.; Wang, X.D.; Chen, Y.; Chang, J.Q.; Wei, D.F.; Jiang, Z.M. Machine learning-based compressive strength prediction for concrete: An adaptive boosting approach. Constr. Build. Mater. 2020, 230, 117000. [Google Scholar] [CrossRef]
- Zhou, X.Z.; Wen, H.J.; Li, Z.W.; Zhang, H.; Zhang, W.G. An interpretable model for the susceptibility of rainfall-induced shallow landslides based on SHAP and XGBoost. Geocarto Int. 2022, 37, 13419–13450. [Google Scholar] [CrossRef]
Disclaimer/Publisher’s Note: The statements, opinions and data contained in all publications are solely those of the individual author(s) and contributor(s) and not of MDPI and/or the editor(s). MDPI and/or the editor(s) disclaim responsibility for any injury to people or property resulting from any ideas, methods, instructions or products referred to in the content. |
© 2024 by the authors. Licensee MDPI, Basel, Switzerland. This article is an open access article distributed under the terms and conditions of the Creative Commons Attribution (CC BY) license (https://creativecommons.org/licenses/by/4.0/).