Abstract
The accurate assessment of heat transfer via unheated spaces is an important aspect of calculating the heating load of a building and mitigating its energy consumption and carbon emissions. Currently, the majority of international and national standards employ the correction factor method for the calculation of heat transfer via unheated spaces, categorized into three types: detailed temperature correction factors (b), simplified b-values, and a correction factor (a) of thermal resistance. In order to provide an accurate and efficient evaluation of heat transfer through unheated spaces, this paper conducts a comparative analysis of these three methods using on-site measurements, TRNSYS (version 18) simulations, and analytical calculations. The findings indicate that the use of simplified b-values results in inaccurate predictions of correction factors and heat transfer via unheated balconies, yielding relative discrepancies within the ranges of 0.065 to 0.527 and 12.2% to 111.3%, respectively. Detailed temperature correction factors offer a more precise prediction, exhibiting relative discrepancies of −0.161 to 0.11 and 0.1% to 33.5%. However, the complexity of the calculation process, influenced by dynamically changing climates and solar radiation, necessitates a steady-state assumption to streamline calculations. The use of detailed correction factors of thermal resistance yields more accurate predictions, with relative discrepancies ranging from −0.176 to 0.11 and 0.3% to 33.1%, and it is recommended as the main method for predicting heat transfer via unheated spaces. In addition, it is advised to enhance the thermal resistance correction factor method by considering the influence of radiative heat transfer via transparent envelopes.
1. Introduction
The calculation of heating loads in buildings plays an important role in evaluating overall energy consumption and carbon emissions. When the envelope of a heated space is in direct contact with the outdoor environment, the heating load is contingent upon heat transfer through the building envelopes (Q). This transfer can be determined based on the calculated indoor temperature (tn), calculated outdoor temperature (tw), and the thermal characteristics of building envelopes (AU/Hue/R0) [1,2,3,4] (Formula (1)). However, it is noteworthy that most buildings typically feature unheated spaces that may act as a barrier between heated spaces and the external environment, causing heat transfer from heated spaces to the external environment via the unheated spaces. This contributes significantly to the overall heating load. Therefore, the accurate assessment of heat transfer through unheated spaces is crucial for precise heating load prediction.
Numerous methodologies, relying on the temperature correction factor (b), are widely used to estimate heat transfer via unheated spaces [2,3,4,5,6,7,8,9,10,11,12,13,14,15,16,17,18]. Primarily, these methodologies center on calculating the temperature of unheated spaces (th) (Formulas (2) and (3)). As shown in Table 1, the international standards EN ISO 13789 [3] and ASHRAE provide comprehensive analytical calculations for temperatures in various types of unheated spaces. Additionally, many researchers have formulated calculation equations specifically addressing the temperature in unheated balconies [11,12,13].
Table 1.
Methodologies based on temperature correction factor.
Given the temporal variations in the external environment on a daily and seasonal basis, accurately estimating the temperature of unheated spaces poses challenges. Therefore, many analytical calculations operate under the assumption that the temperatures in unheated spaces remain constant and homogeneous. This assumption stems from the notion that non-stationary temperature effects can be adequately compensated for when measurements span extended periods during the heating season. At the same time, several national standards, including those in China and member states of the European Union [5,6,7,8,9,10], present tabulated b-values in order to simplify procedures and reduce calculation complexities. Moreover, certain researchers have contributed simplified tabulated b-values specifically tailored for unheated stairwells.
where Q′ represents the heat transfer of the enclosure structure which occurs when the heated space is separated from the external environment by an unheated space; A represents comprehensive surface area of the enclosure structure separating the heated room from the external environment; U represents the heat transfer coefficient of the enclosure structure that separates the heated room from the external environment; Hiu represents the direct heat transfer coefficient between the heated space and the unheated space in W/K; F represents the comprehensive heat transfer area of the enclosure structure that separates the heating space from the outdoor environment; and R0 represents the comprehensive heat transfer resistance of the enclosure structure separating the heated room from the external environment.
Nevertheless, scholars have raised concerns about the accuracy of simplified b-values. In a study by Vučićvić et al. [19], a comparative analysis of b-values was conducted, encompassing (a) on-site temperature measurements spanning 11 days, (b) detailed calculations based on Standard EN ISO 13789, (c) simplified b-values set by Serbian regulations, and (d) simulations conducted using the TRNSYS software (version 18). Their findings indicate that the simplified b-value is considerably lower than the others. Chiari et al. [20] conducted a study comparing the simplified b-values outlined in the UNI/TS 11300-1 [9] standard with the detailed temperature correction factor (b) calculated through the formula of the same standard. The results revealed significant differences that could impact the analysis of heating loads in buildings. Martins et al. [21] compared the simplified b-values estimated by various standards (EN ISO 13789, RCCTE, REH and DEE, DB-HE, RE2020, and UNI/TS) to values measured on-site in three residences. Their findings indicate that the simplified b-values are significantly higher than the measured results.
There are alternative methodologies based on the correction factor (a) that concentrate on calculating the heat transfer coefficient or thermal resistance instead (Formulas (4)–(6)). As shown in Table 2, calculation equations for the heat transfer coefficient (Hue) between unheated spaces and the external environment, along with the heat transfer coefficient (Hie) between internally heated and unheated spaces, have been proposed by standards [3,9,10] and researchers [22,23]. Additional references provide equations for determining the thermal resistance of unheated spaces (Ru) [24,25,26]. However, the precision and efficiency of these methodologies have been the subject of limited investigation in existing studies.
Table 2.
Methodologies based on correction factor of heat transfer coefficient or thermal resistance.
To accurately and efficiently evaluate the heat transfer through unheated spaces, this study employs on-site measurements and TRNSYS simulations of typical thermal environments in unheated spaces. The study conducts a comparative analysis of three methods, including a detailed temperature correction factor (b), a simplified b-value, and a detailed correction factor of thermal resistance (a). The aim is to explore variations in the prediction of correction factors and heat transfer among these methods.
2. Element Affecting Correction Factor
2.1. Use and Type of Unheated Space
The specification GB50736-2012 [2] and UNI/TS [9] offer correction factor values corresponding to various functions and types of unheated space in residential buildings, as detailed in Table 3. It is evident that function and type play a pivotal role in shaping the space, determining lighting and ventilation conditions, and influencing the characteristics of window openings of the envelope. These factors, in sequence, impact the temperature of the unheated space and its corresponding correction factor.
Table 3.
Correction factor values for different functions and types of unheated spaces.
The RCCTE specification [5] provides correction factor values applicable to various functions and types of unheated spaces in public buildings. Additionally, the specification considers the influence of the envelope area on the correction factor. This includes the combined areas of the envelope that separate heated rooms and unheated rooms (Ai), as well as the combined areas of the envelope that separate unheated rooms and the outdoor space (Ae).
In the context of specific functions and types of unheated spaces, alterations to the geometric scale of the space have a notable impact on its temperature, thereby affecting the correction factor value. Through analytical calculations, Zhang et al. [23] established that the correction factor of a closed balcony varies based on the scales of its recess and protrusion. Additionally, Li [14] and Li Yan et al. [15], based on on-site measurements, noted variation in the correction factor of unheated stairwells in the vertical direction corresponding to the height of the floor.
2.2. Characteristics of Envelopes
The RE2020 specification [8] provides correction factor values corresponding to distinct envelope characteristics, illustrating the impact of the envelope area and thermal performance (Uv,ue), as depicted in Figure 1. The data presented in Figure 1 were obtained from reference [8]. The coefficient Uv,ue represents the normalized air exchange losses of the unheated room with respect to the unit area of the wall. Notably, the Uv,ue values vary for different types of unheated spaces. For example, the Uv,ue for common circulation spaces in a collective house without direct openings to the outside is 0, while for an attic with a poorly ventilated space, it is 0.3. Conversely, Uv,ue for an attic with a strongly ventilated space is 9, and for the garage and cellar in a detached house, it is 3.
Figure 1.
Values for the correction factor set by the RE2020.
Dong et al. [13] studied the correction factor of enclosed balconies in residential buildings. Their findings indicate that utilizing energy-efficient closed windows, such as plastic–steel insulated windows, and insulated balustrade panels leads to a smaller correction factor compared to closed metal windows, such as aluminum windows and steel windows, and standard balustrade panels. In a separate study, Zhang et al. [23] explored the correction factor of enclosed balconies and found that the thermal performance of exterior windows exerts a more pronounced influence on the correction factor than that of exterior walls. Furthermore, Liu [12] highlighted that for closed balconies with identical geometry, a lower heat transfer coefficient of the envelope corresponds to a larger correction factor value, as detailed in Table 4. The data presented in Table 4 were obtained from reference [12].
Table 4.
Correction factors of enclosed balcony with different thermal performance of building envelope.
Biljana et al. [19] conducted simulations on the attic of a high school building in Serbia and found a gradual decrease in the correction factor value as the thermal performance of the roof envelope improved. The study also provides recommended correction factor values for various roof envelope conditions, as presented in Table 5. The data presented in Table 5 were obtained from reference [19].
Table 5.
Correction factors of attics under different building envelopes.
2.3. Ventilation Flow Rate
The national standard DB-HE [10] takes a comprehensive approach to assessing the impact of envelope characteristics in unheated rooms and the ventilation flow rate on the correction factor. The ventilation flow rate is categorized into two cases based on airtightness levels, as outlined in Table 6. Case 1 pertains to poorly ventilated spaces, encompassing areas with airtightness levels 1, 2, or 3, while Case 2 applies to strongly ventilated spaces, including areas with airtightness levels 4 or 5 (Figure 2). The data presented in Figure 2 were obtained from reference [10].
Table 6.
Air renewal rate between non-habitable spaces and the exterior.
Figure 2.
Values for the correction factor set by the DB-HE.
The DEE national standard [7] provides correction factor values based on varying envelope areas and two distinct types of ventilation flow rates for unheated spaces with different volumes. Here, f designates unheated spaces with all connections between elements being well sealed and lacking permanent ventilation openings, while F designates air-permeable unheated spaces characterized by permanently open connections and ventilation openings (Figure 3). The data presented in Figure 3 were obtained from reference [7].
Figure 3.
Values for the correction factor set by the DEE.
Yuan Wei et al. [11] used air changes per hour (ACH) as a metric to quantify the ventilation flow rate. A comparative analysis was conducted on the correction factors for unheated balconies at five ACH values—0.2, 0.4, 0.6, 0.8, and 1.0 h−1. The study revealed that as the ventilation flow rate increases, the thermal environment of the balcony is closer to the outdoor environment, resulting in a corresponding increase in the correction factor. In a separate study, Dong et al. [13] found that in unheated balconies of high-rise buildings, the correction factor exhibits vertical variation between floors due to the differences in the ventilation flow rate of balconies on each floor. The study provides the ventilation flow rate and corresponding correction factor values for each floor in a 20-storey high-rise residential building, as detailed in Table 7. The data presented in Table 7 were obtained from reference [13].
Table 7.
Volume of air leakage and correction factor for balcony on each floor of high-rise residential building.
2.4. Climate and Solar Radiation
In the thermal regulation of unheated spaces, solar radiation stands out as the crucial external factor due to its substantial amount of heat and significant impact on room temperature. This effect becomes particularly pronounced in spaces featuring extensive transparent envelope areas. For example, the inherent room temperature of a south-facing space of a building tends to be compared to that of a north-facing space. Consequently, the correction factor for the south-facing space is often lower than that for the north-facing room. The national standard RE2020 [8] provides correction factor values for unheated balconies and corridors in four orientations, as shown in Figure 4. The data presented in Figure 4 were obtained from reference [8].
Figure 4.
Correction factor values for unheated balcony or enclosed corridor set by the RE2020.
Yuan Wei et al. [11] studied the impact of glass type on the correction factor of enclosed balconies, discovering that different window types lead to differences in solar radiation heat gain and total heat transfer through unheated spaces, thus influencing the correction factor value. In a related study, Zhang et al. [23] examined six representative cities with distinct climates, namely, Urumqi, Harbin, Zhengzhou, Lhasa, Changsha, and Chongqing. The analysis focused on the impact of solar radiation on the correction factor of unheated balconies, revealing regional and orientation disparities caused by varying solar radiation intensity.
Based on the preceding analysis, Table 8 provides a summary of elements identified in various literature studies affecting the correction factor. This encompasses three types of methods for determining the correction factor values. It becomes apparent that the first type, the detailed temperature correction factor (b), is influenced not only by building envelope characteristics, and ventilation flow rate, but also exhibits a close correlation with dynamically changing climates and solar radiation. Thus, the calculation process for the detailed temperature correction factor (b) is relatively complex, necessitating a steady-state assumption to streamline calculations. Similarly, the simplified b-value, belonging to the second type, is influenced not only by the aforementioned three factors but also by the type of unheated space. To simplify the calculation procedure and reduce calculation complexity, the existing literature often adopts a tabular format to present corresponding temperature correction factor (b) values under various conditions of influencing elements. In comparison, the third type, the detailed correction factor (a) of thermal resistance, primarily takes into account the envelope’s characteristics and the ventilation flow rate, with less emphasis on the impact of climates and solar radiation. As a result, the calculation process for this type is simpler than that of the first type.
Table 8.
References regarding correction factor and its affecting elements.
3. Methodology
Building upon the analysis of factors influencing the correction factor, this study focuses on balconies, a widely studied and representative unheated building space in the existing literature. Initially, by integrating on-site measurements and software simulations, this study establishes the correction factor and heat transfer via the unheated balcony under fully overcast conditions on the test day and sunny conditions on the Greater Cold day. Following this, the simulation results are compared with those obtained using three existing correction factor methods. The study introduces a precise and efficient method for predicting heat transfer through unheated spaces.
This paper classifies 16 existing methods for balcony correction factor values into three distinct types: detailed methodologies based on the temperature correction factor (b), simplified methodologies based on the temperature correction factor (b), and detailed methodologies based on the correction factor (a) of thermal resistance (Table 8).
3.1. Case Description
3.1.1. Unheated Spaces
The case building is a 33-storey high-rise residential structure, standing at nearly 100 m in height, located in Xi’an, China. For on-site testing, one apartment on the 16th floor was chosen. As shown in Figure 5, this particular apartment design features two protruding balconies with different orientations, each boasting a floor height of 2.8 m and a depth of 1 m. The balconies are externally separated from the interior by sliding glass doors, with a door opening area of 3.96 m2. In addition, the south-facing balcony has an opening width of 3.6 m and an exterior window area of 7.68 m2, while the west-facing balcony has an opening width of 3.9 m and an exterior window area of 7.26 m2.
Figure 5.
Case building and the floor plan of unheated balcony.
3.1.2. Envelopes
The structure of envelopes of both the south-facing and west-facing balconies in the case building are fundamentally the same. Both balconies feature exterior walls consisting of 200 mm thick block walls complemented by a 55 mm thick external insulation layer. The interior walls are constructed with 200 mm thick block walls. The balcony doors are double-layer glass doors framed with plastic steel, and the exterior windows are double-layer hollow glass windows with plastic steel frames exhibiting a total solar transmittance of 0.75. Table 9 provides details on the heat transfer coefficients of the balcony envelopes. The heat transfer coefficients of the various enclosure structures of the enclosed balcony all comply with the “Design standard for energy efficiency of residential buildings in Xian” (DBJ61-44-2007) [27] in effect at the time.
Table 9.
Heat transfer coefficients of closed balcony envelope.
3.2. Field Measurement
The field measurement took place under fully overcast conditions from January 4 to January 6, with continuous monitoring of the measurement object for 45 h. The setup included a total of one outdoor measurement point and four indoor measurement points. Specifically, the indoor measurement points were located within two unheated balconies and their corresponding heated rooms in the case building. The monitoring point was situated at a height of approximately 1.5 m above the ground, encompassing the typical height range of human activities (Figure 6).
Figure 6.
Test devices in case buildings. Subfigures (a–c) represent the placement of the testing instruments within the test subjects, where the red circles highlight the testing instruments.
The test equipment utilized was a TR-73U temperature and humidity data logger, capable of measuring air temperature within the range of 0 to 50 °C and relative humidity from 10 to 95%. The device exhibits a high accuracy level of ±0.3 °C for temperature and ±5% for humidity, with a 5 min test interval.
Figure 7 presents the test results. The average outdoor temperature recorded was −1.8 °C. In the south-facing heated room, the average temperature was 22.6 °C, while in the west-facing heated room, it was 22.1 °C. On the south-facing unheated balcony, the average temperature measured was 9.5 °C, and on the west-facing balcony, it was 9.4 °C.
Figure 7.
Field test result.
3.3. Thermal Simulation
3.3.1. Weather Data
Using TRNSYS software, models were created for the south-facing and west-facing balconies to simulate the indoor temperature (th) and temperature correction factor (b) on the test day under fully overcast conditions and on the Greater Cold day under sunny conditions.
The model incorporates the outdoor air temperature and relative humidity obtained from the test as the external environmental conditions. Given the fully overcast conditions, the average solar radiation intensity in the south and west directions was 10.4 W/m2. Indoor environmental conditions are determined by the air temperature and relative humidity in the living room and bedroom, both acquired from the test.
The model utilizes the hourly meteorological data for the Greater Cold day in Xi’an, China, sourced from the “China Standard Year Database” [28], to establish the outdoor environmental conditions for that specific day. According to the meteorological data, the average daily solar radiation intensity in the south orientation on the Greater Cold day was 51.2 W/m2, while in the west direction, it was 41.1 W/m2. The selected indoor ambient temperature value was 18 °C, following the specifications outlined in the “National Technical Measures for Design of Civil Construction—Heating, Ventilation and Air Conditioning” (2009).
3.3.2. Ventilation Flow Rate
The heat consumption of cold air infiltrating into the room through door and window gaps is estimated using the ACH (air changes per hour). The specific heat at constant air pressure was 1.01 kJ/(kg·°C), and the air density was 1.29 kg/m3. The ACH in residential buildings is determined according to the national standard CHN GB 50736 [2], where the minimum ACH in heated rooms is 0.5 h−1, and in closed balconies, it is 1 h−1.
3.3.3. Model Validation
Using the TRNSYS model, temperatures of the unheated balconies were calculated for both the test day and the Greater Cold day. Based on this, Figure 8 presents a comparative analysis of the test and simulation results for the two unheated balconies on the test day.
Figure 8.
Comparison of simulation and test results.
The comparison employed statistical tools such as the mean absolute error (MAE) and root mean square error (RMSE), commonly utilized in academic research for their accuracy, especially in conditions without HVAC devices and systems [29]. The model is considered calibrated, and its representation capability is deemed acceptable when the MAE and RMSE values fall within ± 1 °C and ± 0.5 °C, respectively.
The calculations are shown in Formulas (4) and (5):
where n represents the simulation time, which is 24 h; mi denotes the measured air temperature data in °C; and Si represents the simulated air temperature data in °C.
The comparative analysis revealed that the MAE and RMSE values for the south-facing balcony on the test day were 0.35 and 0.39, respectively. Similarly, for the west-facing balcony, the corresponding values were 0.28 and 0.36. In both cases, the results meet the simulation accuracy requirements.
4. Results and Analysis
4.1. Comparison of Temperature Correction Factor
Figure 9 illustrates a comparison between the simulation results and those obtained from established temperature difference correction factor methods. Using simulation calculations, the temperature difference correction factors for the south-facing and west-facing balconies on the test day are determined, measuring 0.535 and 0.532, respectively. Similarly, on the Greater Cold day, the corresponding factors were 0.480 and 0.473. It is noteworthy that a substantial deviation exists between the simplified b-values and the simulation results. In the fully overcast conditions on the test day, the discrepancies between the calculated values and simulated values for the south-facing and west-facing balconies ranged from 0.065 to 0.465 and 0.068 to 0.468, respectively. Meanwhile, in the sunny conditions on the Greater Cold day, the discrepancies ranged from 0.120 to 0.520 and 0.127 to 0.527.
Figure 9.
Correction factor values for enclosed balcony using temperature correction factor.
Detailed temperature correction factors exhibit a relatively close match to the simulation results. In the fully overcast conditions on the test day, the discrepancies between the calculated values and simulated values for the south-facing and west-facing balconies ranged from −0.001 to 0.055 and −0.012 to 0.042, respectively. Notably, the calculated values of method M2 demonstrate the closest alignment with the simulated values. Similarly, under sunny conditions on the Greater Cold day, the discrepancies between the calculated values and simulated values ranged from −0.161 to 0.110 and −0.100 to 0.101, respectively, with the calculated values of method M3 [12,13] being the closest to the simulated values.
Furthermore, upon comparing the two working conditions, namely the test day and the Greater Cold day, a correlation emerged with the simulation results, indicating that the detailed temperature correction factors were higher on the test day than on the Greater Cold day. This discrepancy is attributed to the elevated average outdoor temperature on the Greater Cold day compared to the test day, resulting in a higher temperature for the unheated balcony and subsequent lower correction factors. This observation underscores the significant influence of climate and solar radiation on the existing detailed temperature correction factors.
4.2. Comparison of Thermal Resistance Correction Factors
Figure 10 illustrates the close alignment between the detailed correction factors of thermal resistance and the simulation results. In the fully overcast conditions on the test day, the discrepancies between the calculated values and simulated values for the south-facing and west-facing balconies ranged from −0.098 to 0.071 and −0.176 to 0.053, respectively, with method M13 exhibiting the closest match to the simulated values. Similarly, under sunny conditions on the Greater Cold day, the discrepancies ranged from −0.042 to 0.001 and −0.118 to 0.007, with method M14 displaying the closest proximity to the simulated value for south-facing balconies. Notably, it is evident that the relative discrepancies between the correction factors of thermal resistance and simulation results are generally smaller compared to those of the temperature correction factors.
Figure 10.
Correction factor values for enclosed balcony using resistance correction factor.
Comparing the fully overcast conditions on the test day with the sunny conditions on the Greater Cold day, it is observed that the simulation results reflect that the correction factor on the test day is larger than that on the Greater Cold day, and only the correction factor of method M14 satisfies this phenomenon. However, the correction factor values of thermal resistance for the other methods remain unchanged. This discrepancy arises because none of the thermal resistance correction factor methods account for the impact of outdoor air temperature, and only method M14 considers the increased radiant heat gain through a transparent envelope under sunny conditions. Consequently, the correction factors of thermal resistance decrease on the Greater Cold day. It is evident that detailed correction factors of thermal resistance do not capture the climatic influence, and only method M14 addresses solar radiation [17].
Moreover, the correction factors of thermal resistance for the south-facing balcony are consistently higher than those for the west-facing balcony. This discrepancy can be attributed to the varying opening widths and window areas between the balconies in this case. The south-facing balcony envelope features a bigger proportion of transparent envelopes, resulting in a higher integrated heat transfer coefficient and consequently a bigger correction factor value. It is evident that the existing thermal resistance correction factor method effectively captures the impact space type, envelope characteristics, and ventilation flow rate.
4.3. Comparison of Heating Load
Based on the aforementioned comparison of correction factors, Figure 11 juxtaposes the heat transfer through unheated balconies obtained by simulation methods and the three types of correction factor methods. Notably, the heat transfer quantity derived from simplified b-values significantly deviates from the simulation results, generally yielding higher values, with relative errors ranging from 12.2% to 111.3%. In essence, the national specification employing simplified b-values consistently overestimates heat loss through unheated spaces, imposing excessive thermal resistance requirements on the internal envelope and the heating equipment capacity for adjacent heated spaces. While this approach is advantageous for ensuring the thermal performance and comfort of the building, it results in unnecessary resource and energy waste, hindering the reduction in energy consumption and carbon emission of the building.
Figure 11.
Comparison of heating transfer via unheated balcony.
The heat transfer quantity determined through detailed temperature correction factors closely aligns with the simulation results, exhibiting relative discrepancies ranging from 0.1% to 33.5%. Specifically, the relative discrepancies for the south-facing balcony on the test day and the Greater Cold day range from 0.1% to 10.2% and 23.0% to 33.5%, respectively. For the west-facing balcony, the relative discrepancies range from 0.2% to 7.9% and 18.1% to 21.3%. This method demonstrates greater accuracy in predicting heat transfer. However, it involves a more intricate calculation process, and the results are significantly influenced by climate and solar radiation.
The heat transfer quantity obtained through detailed correction factors of thermal resistance closely approximates the simulation results, yielding relative discrepancies ranging from 0.3% to 33.1%. This method demonstrates enhanced accuracy in predicting heat transfer, and due to its omission of the dynamically changing climate’s influence, the calculation process remains straightforward. Nonetheless, the disadvantage is evident in the form of a relatively large discrepancy in predicting heat transfer for the south-facing balcony, especially under sunny conditions on the Greater Cold day. This suggests the necessity for improvement in the method by considering the impact of radiative heat transfer via transparent envelopes.
5. Conclusions
Accurately assessing heat transfer through unheated spaces is an important aspect of determining the heating load of a building and reducing its energy consumption and carbon emissions. To achieve a more accurate and efficient assessment of heat transfer in unheated spaces, this paper undertakes a comprehensive review of the literature, conducts on-site measurements, and employs TRNSYS simulation and analytical calculations. The ensuing analysis meticulously compares the differences with existing research methods in the calculation of heat transfer via unheated spaces. The following conclusions are drawn:
- (1)
- This paper provides a comprehensive review of the current research status concerning heat transfer through unheated spaces using correction factors. It categorizes existing research methods into three distinct types. The first category includes two national standards, EN ISO 13789 and ASHRAE 17.4, that employ detailed methodologies based on the temperature correction factor (b). The second category involves simplified b-values, a method widely adopted by numerous national standards, including GB 50736, RCCTE, REH, DEE, RE2020, DB-HE, and UNI/TS. The third category encompasses detailed methodologies based on the correction factor of thermal resistance (a), as seen in standards EN ISO 13789, BR 443, and TGD-L and other scholarly works.
- (2)
- There are four main categories of elements affecting the correction factors. The detailed temperature correction factor (b) is influenced by the building envelope characteristics and ventilation flow rate and exhibits a close correlation with dynamically changing climates and solar radiation. Similarly, the simplified b-value is affected not only by the aforementioned three elements but also by the type of unheated space, in the form of various tabular formats. In comparison, the detailed correction factor of thermal resistance (a) primarily takes into account the envelope’s characteristics and the ventilation flow rate, with less emphasis on the impact of climate and solar radiation, which makes the calculation process simpler.
- (3)
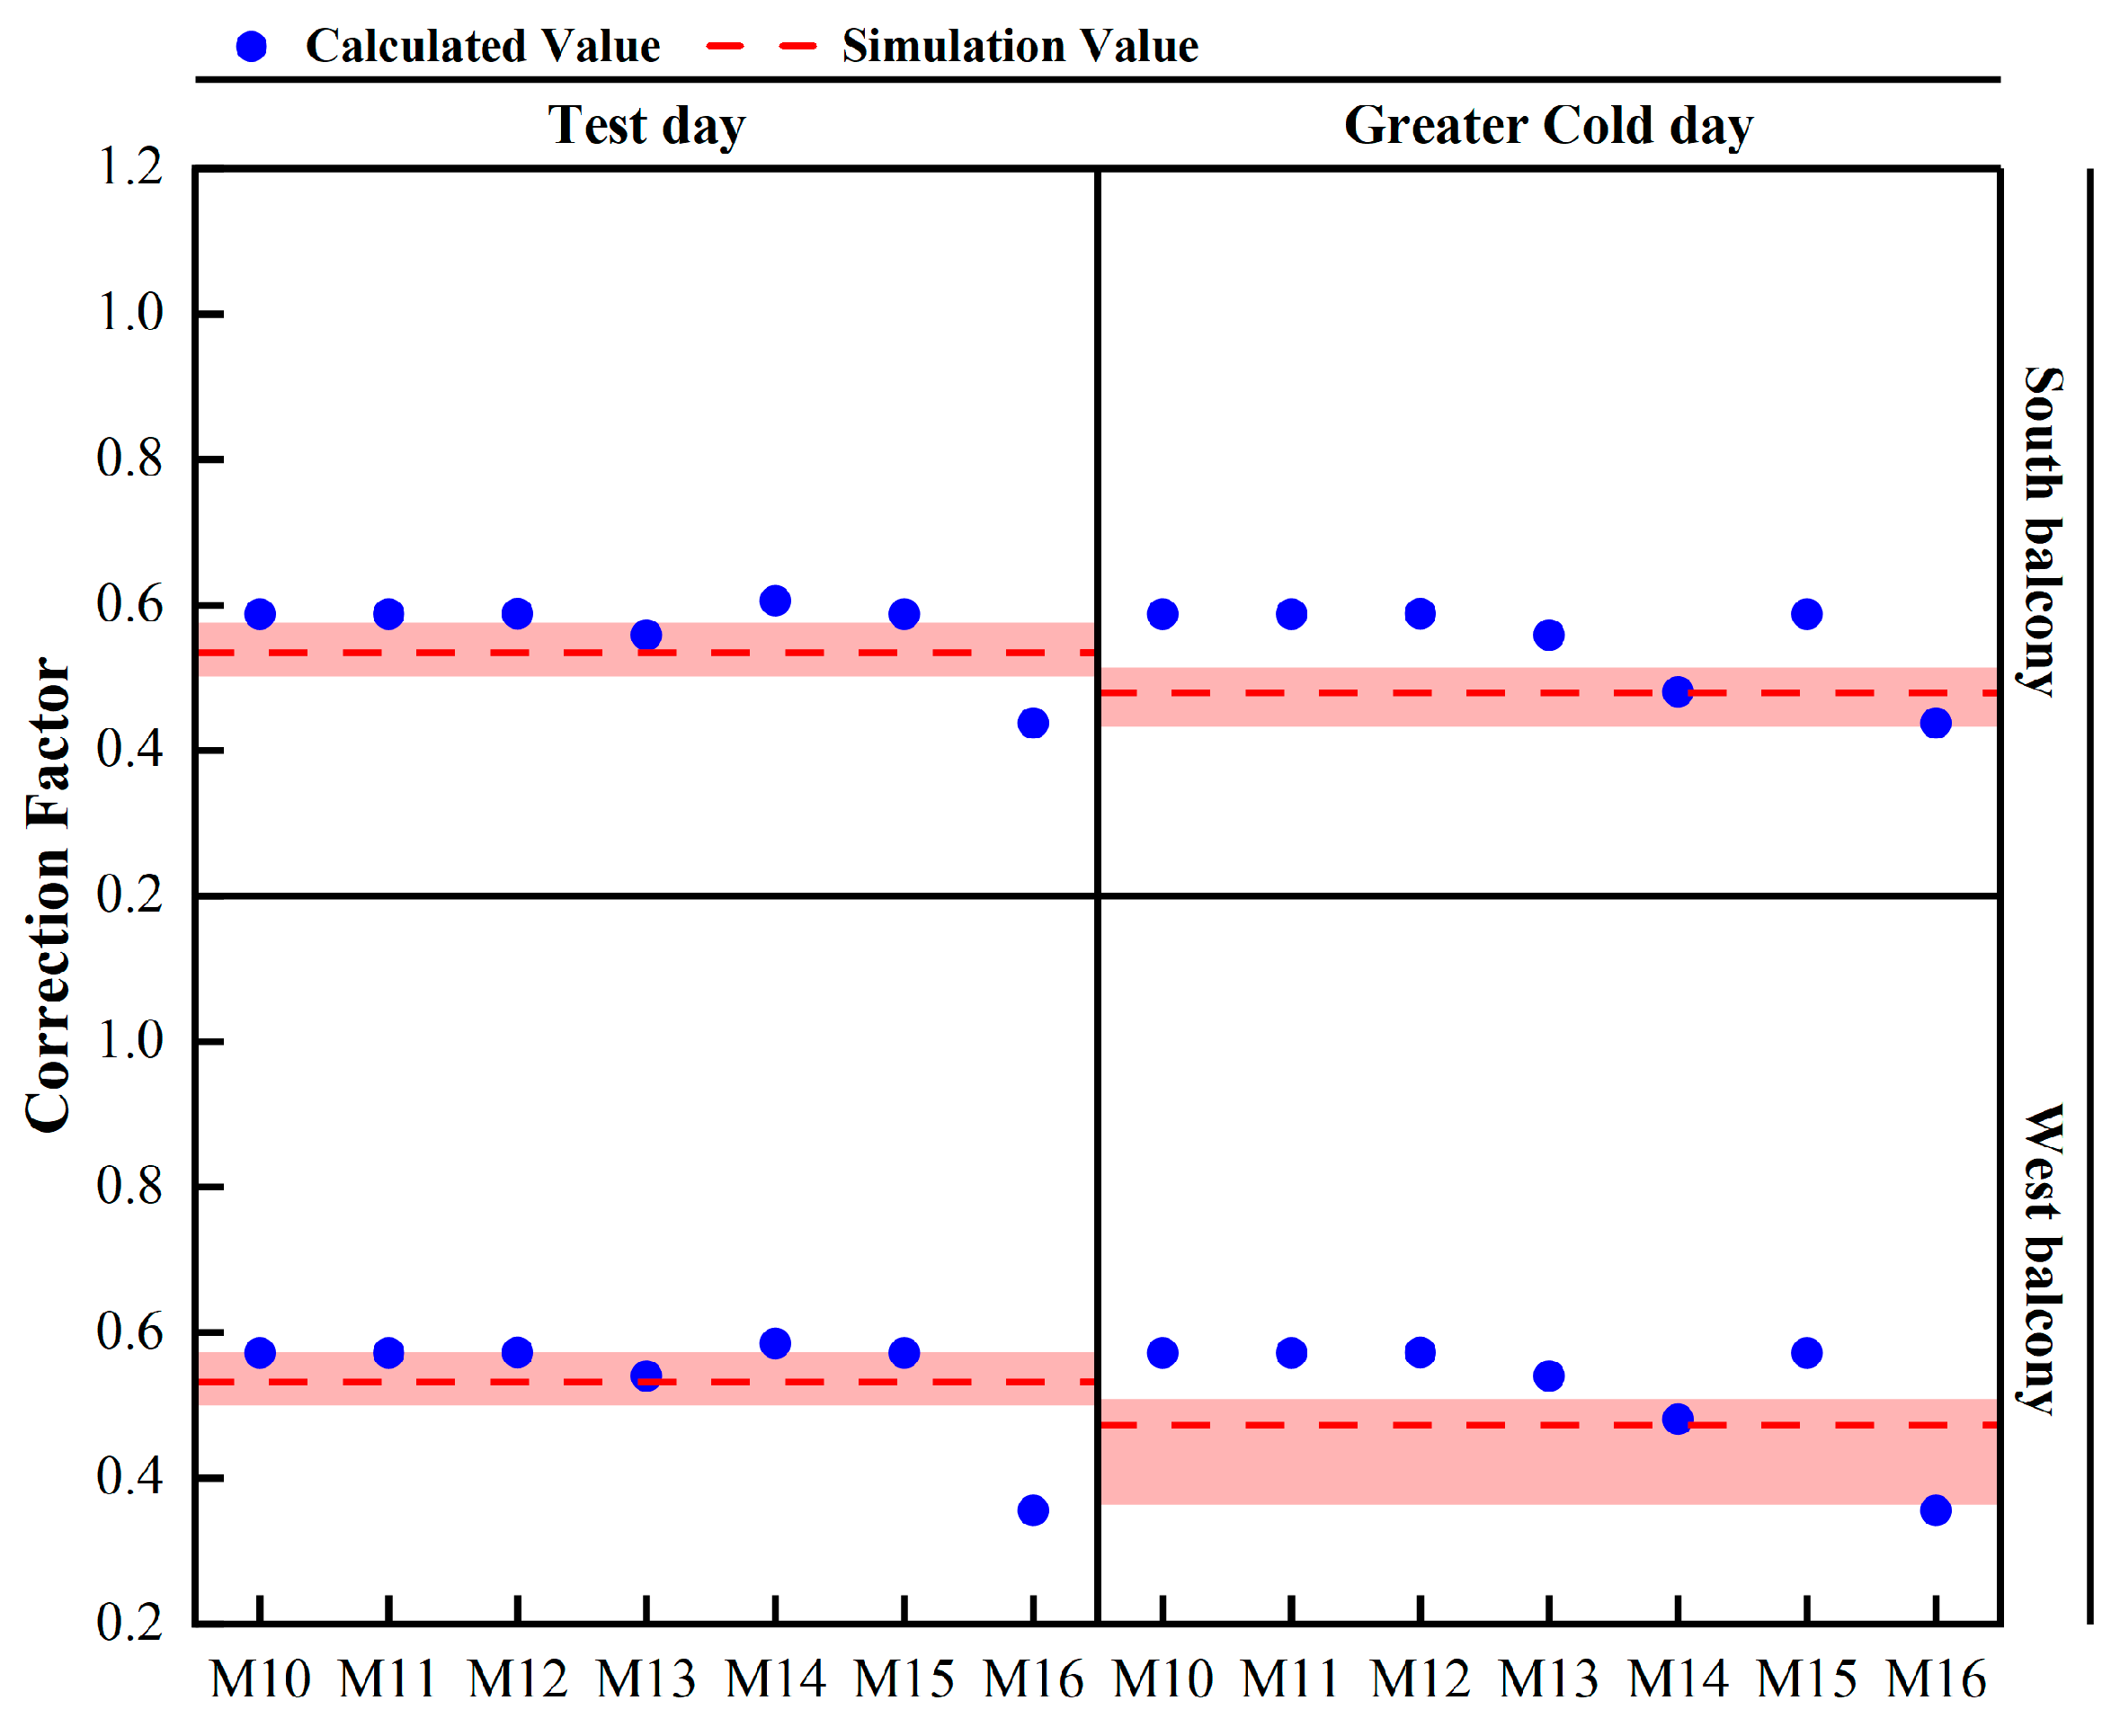
- Upon comparing the calculation results of correction factors obtained from simulations and three types of methods, it is evident that the results derived from simplified b-values exhibit a considerable discrepancy range with the simulation results, spanning from 0.065 to 0.527. Conversely, those determined from detailed temperature correction factors (b) are relatively close to the simulation results but are more susceptible to the influence of climate and solar radiation conditions, showing a discrepancy range of −0.161 to 0.11. In contrast, the results obtained from detailed correction factors of thermal resistance (a) closely align with the simulation results, exhibiting a discrepancy range of −0.176 to 0.11. And, these results are in a steady state and do not reflect the effect of dynamically changing climates.
- (4)
- By comparing the heat transfer quantity obtained from simplified b-values with the simulation, it becomes evident that the relative discrepancy is high, ranging from 12.2% to 111.3%. This indicates a general overestimation of heat transfer via unheated spaces, resulting in an unnecessary waste of resources and energy. Such overestimation is detrimental to the overall goal of reducing energy consumption and carbon emissions in buildings.
- (5)
- The comparison of heat transfer quantity based on detailed temperature correction factors with the simulation results indicates a relatively close alignment, featuring a relative discrepancy range of 0.1% to 33.5%. While this method proves more accurate in predicting heat transfer, it is noteworthy that the calculation results are significantly affected by climate and solar radiation, contributing to a more intricate calculation process.
- (6)
- The results for heat transfer quantity derived from the detailed correction factors of thermal resistance (a) closely align with those obtained through simulation, featuring relative discrepancies ranging from 0.3% to 33.1%. This method demonstrates heightened accuracy in predicting heat transfer, and due to the omission of dynamically changing climate considerations, the calculation results remain relatively stable, contributing to a comparatively straightforward calculation process. However, it is necessary for this method to further incorporate the impact of radiative heat transfer via transparent envelopes.
Author Contributions
Conceptualization, D.W.; Methodology, W.H.; Software, S.Z.; Validation, S.Z.; Formal analysis, Z.W.; Investigation, Z.W.; Data curation, W.H.; Writing—original draft, S.Z.; Writing—review & editing, Z.W.; Project administration, W.H. All authors have read and agreed to the published version of the manuscript.
Funding
This research received no external funding.
Data Availability Statement
The raw data supporting the conclusions of this article will be made available by the authors on request.
Acknowledgments
All the participants are sincerely acknowledged in this research.
Conflicts of Interest
The authors declare no conflict of interest.
References
- GB50176-2016; Thermal Design Code for Civil Building. China Architecture & Building Press: Beijing, China, 2016.
- GB50736-2012; Design Code for Heating Ventilation and Air Conditioning of Civil Buildings. China Architecture & Building Press: Beijing, China, 2012.
- EN ISO 13789: 2017; Thermal Performance of Buildings—Transmission and Ventilation Heat Transfer Coefficients—Calculation Method. CEN: Brussels, Belgium, 2017.
- ASHRAE. Residential Cooling and Heating Load Calculations. In ASHRAE Handbook—Fundamentals; American Society of Heating, Refrigeration and Air-Conditioning Engineers, Inc.: Atlanta, GA, USA, 2021; Chapter 17. [Google Scholar]
- Decree-Law 80/2006 of de 4 de Abril. Regulation of Thermal Behavior Characteristics of Buildings; Ministério das Obras Públicas, Transportes e Comunicações: Lisbon, Portugal, 2006.
- Decree-Law 118/2013. Regulation on the Energy Performance of Residential Buildings; Ministério da Economia e do Emprego: Lisbon, Portugal, 2013.
- Manual SCE. Technical Manual for the Assessment of Energy Performance of Buildings; v.1; Direção Geral de Energia e Geologia: Lisbon, Portugal, 2021. [Google Scholar]
- Méthodes et Procédures Applicables au Diagnostic de Performance Energétique et aux Logiciels l’Etablissant. Available online: https://www.legifrance.gouv.fr/jorf/id/JORFTEXT000043353381 (accessed on 12 September 2023).
- UNI/TS 11300-1:2014; Energy Performance of Buildings—Part 1: Determination of the Thermal Energy Needs of Buildings for Heating and Cooling. Ente Nazionale Italiano di Unificazione (UNI): Milan, Italy, 2014.
- DA-DB-HE1; Support Document to Basic Document DB-HE Energy Saving, Section HE1, Conditions to Control the Energy Demand, Technical Building Code. Ministerio de Transporte, Movilidad y Agenda Urbana: Madrid, Spain, 2020.
- Yuan, W.; Zhang, X.; Shi, P. Closed balcony temperature difference correction factor for residential buildings in the Northern. Heat. Vent. Air Cond. 2014, 44, 71–76. (In Chinese) [Google Scholar]
- Liu, Y. Correction Coefficient of Temperature Deviation for Structure with Enclosed Balcony. Gas Heat 2000, 2, 65–67. (In Chinese) [Google Scholar]
- Dong, Z.; Li, Y. Determination of temperature difference correction factor of closing balcony for residential buildings in Northern China. Heat. Vent. Air Cond. 2007, 12, 97–100. (In Chinese) [Google Scholar]
- Li, Z. Measurement and analysis of temperature difference correction factor for residential stairwell. Heat. Vent. Air Cond. 2003, 1, 38–40. (In Chinese) [Google Scholar]
- Li, Y.; Deng, Z.; Zhang, S. Simulation analysis of temperature field and temperature difference correction coefficient in residential stairwells. In Proceedings of the China Conference on HVAC&R 2006; Harbin Institute of Technology, Yanshan University: Harbin, China, 2006; pp. 264–268. (In Chinese) [Google Scholar]
- Jiang, Y.; Liu, X. Discussion on the practical application of temperature difference correction factor. In Proceedings of the China Conference on HVAC&R 1994; Jinan Housing Construction and Development Corporation: Jinan, China, 1994; pp. 12–15. (In Chinese) [Google Scholar]
- Li, Y. Research on Correction Coefficients of Temperature Difference in Unheated Building Spaces. Master’s Thesis, Harbin Institute of Technology, Harbin, China, 2002. (In Chinese). [Google Scholar]
- Zhang, J.; Du, J.; Liu, S.; Zheng, X.; Chen, Y.; Mao, B.; Li, X. Analysis of Heat Transfer in Unheated Stairwells of Multi-Story Residential Buildings. Tianjin Constr. Sci.Technol. 2005, 6, 21–23. (In Chinese) [Google Scholar]
- Vučićević, B.S.; Jovanović, M.P.; Turanjanin, V.M.; Bakić, V.V.; Radivojević, D.S. Temperature correction factor simulation over the heating period. Therm. Sci. 2018, 22 (Suppl. S4), S1083–S1093. [Google Scholar] [CrossRef]
- Stefano, B.; Anna, C. Heat Transfer via Unconditioned Spaces: The Influence of the Adjustment Factor Evaluation Method. Tec. Ital. Ital. J. Eng. Sci. 2019, 63, 386–392. [Google Scholar] [CrossRef]
- Nepomuceno, M.C.; Martins, A.M.; Pinto, H.A. A Comparison between On-Site Measured and Estimated Based Adjustment Factor Values Used to Calculate Heat Losses to Unconditioned Spaces in Dwellings. Buildings 2022, 12, 146. [Google Scholar] [CrossRef]
- Liu, J. Method of defining the heat-transfer coefficient for the balcony closed with window glass. J. Xi’an Univ. Archit. Technol. Nat. Sci. Ed. 1995, 1, 16–19. (In Chinese) [Google Scholar]
- Ma, M.; Zhang, H. Value of temperature difference correction factor of closed balcony and its influence on heating design. Acta Energiae Solaris Sin. 2022, 43, 303–310. (In Chinese) [Google Scholar]
- Anderson, B. Conventions for U-Value Calculations: Report BR 443, 2006 ed.; BRE Press: Berkshire, UK, 2006. [Google Scholar]
- Building Regulations, Technical Guidance Document L 2021, Conservation of Fuel and Energy—Dwellings; Government of Ireland: Dublin, Ireland, 2021.
- Sun, G.; Sun, T. The Method of Calculating Heating Load for Domestic Residential Room with Closed Balcony. J. Qingdao Univ.Technol. 1995, 1, 48–53. (In Chinese) [Google Scholar]
- DBJ61-44-2007; Design Standard for Energy Efficiency of Residential Buildings in Xian. The Office of Architectural Standard Design in Shaanxi Province: Xi’an, China, 2007.
- China Meteorological Administration. China Meteorological Data Service Center. Available online: http://data.cma.cn/site/index.html (accessed on 21 September 2023).
- Huerto-Cardenas, H.E.; Leonforte, F.; Aste, N.; Del Pero, C.; Evola, G.; Costanzo, V.; Lucchi, E. Validation of dynamic hygrothermal simulation models for historical buildings: State of the art, research challenges and recommendations. Build. Environ. 2020, 180, 107081. [Google Scholar] [CrossRef]
Disclaimer/Publisher’s Note: The statements, opinions and data contained in all publications are solely those of the individual author(s) and contributor(s) and not of MDPI and/or the editor(s). MDPI and/or the editor(s) disclaim responsibility for any injury to people or property resulting from any ideas, methods, instructions or products referred to in the content. |
© 2024 by the authors. Licensee MDPI, Basel, Switzerland. This article is an open access article distributed under the terms and conditions of the Creative Commons Attribution (CC BY) license (https://creativecommons.org/licenses/by/4.0/).