Article

Establishment of Safety Management Measures for Major Construction Workers through the Association Rule Mining Analysis of the Data on Construction Accidents in Korea

1
Department of Occupational Safety & Housing Management, Cyber Hankuk University of Foreign Studies, Seoul 02450, Republic of Korea
2
Department of Architecture and Architectural Engineering, Seoul National University, Seoul 08826, Republic of Korea
3
Department of Civil and Environmental Engineering, Gangneung-Wonju National University, Gangneung 25457, Republic of Korea
4
Department of Safety Engineering, Incheon National University, Incheon 22012, Republic of Korea
*
Authors to whom correspondence should be addressed.
Buildings 2024, 14(4), 998; https://doi.org/10.3390/buildings14040998
Submission received: 20 February 2024 / Revised: 29 March 2024 / Accepted: 3 April 2024 / Published: 4 April 2024
(This article belongs to the Special Issue The Impact of Construction Projects and Project Management on Society)

Abstract

:
Despite increasing industrial advancements, fatal and severe accidents, such as “Falls”, “Struck-by”, “Hit by an object”, “Be crushed”, and “Caught-in/between” accidents, persist in developed countries, including Korea. Various methods, including risk assessment, monitoring systems, technology improvements, and safety education, are being implemented to reduce accidents. However, only a few studies have revealed the causes of accidents and their interrelationships; these studies are based on limited data. Korea recently published accident data using national statistical systems, including the construction safety management integrated information (CSI), enabling the analyses of major accident types. Here, we selected various representative accident cases to minimize the duplication of the data published from 2019 to 2023 and applied the Material, Method, Machine, or Man (4M) analysis method, a risk assessment technique, to perform an accident-type-based association rule mining (ARM) analysis of the accident factors. Through the ARM analysis, we quantitatively identified complex correlations for major accidents. Based on the 4M factors derived through this analysis, we improved a 2–4 model for accident causation and proposed safety management measures for each construction entity.

1. Introduction

Severe and fatal accidents persist in the fourth industrial revolution era, which is characterized by more advanced, sophisticated, and complex industrial systems. Advanced countries, such as the United States (U.S.) and Europe, have established and implemented various industrial accident reduction measures to substantially reduce industrial accidents and ensure safe workplaces for workers [1]. The construction industry represents one of the most dangerous industries in most countries, and most construction accidents are caused by falls, bumps, hits, crushing, pinching, and electric shocks [2]. In the U.S., approximately 10,000 construction workers died from on-the-job injuries between 2011 and 2021. Among them, 65.5% were due to four main accident types: fall, struck-by, caught-in, and electrocution accidents. Further, falls accounted for more than half (53.5%) of the four main accident types, as well as 35.0% of all fatal injuries during construction (Figure 1) [3]. In Korea, construction accidents follow similar trends to those in the U.S., accounting for more than 50% of all industry-related fatalities, and the accident types include “Falls”, “Struck-by”, “Caught-in/between”, “Hit by an object”, and “Be crushed” accidents [4]. Notably, the U.S. does not record secondary accidents caused by electrocution, whereas Korea considers secondary accidents caused by electrocution as direct accidents; therefore, the same accidents are grouped under different types of accidents in both countries.
In 2022, the construction industry accounted for 402 (46.0%) fatalities in Korea, followed by the manufacturing, 184 (21.1%); service, 150 (17.2%); and transportation, warehousing, and communication industries, 104 (11.9%). Construction and manufacturing are considered high-risk industries, accounting for over 70% of all annual fatalities [4]. When considering the number of fatalities in the construction industry in 2022 based on the accident type, “Falls” accounted for 215 (53.5%), followed by “Struck-by”, 48 (11.9%), “Hit by an object”, 22 (5.5%), “Be crushed”, 22 (5.5%), and “Caught-in/between”, 21 (5.2%) accidents. Furthermore, the number of fatalities between 2018 and 2022 based on the accident type reveals that “Falls”, “Struck-by”, “Hit by an object”, “Be crushed”, and “Caught-in” accidents accounted for most fatalities (Figure 2).
The annual report on industrial accidents published by Korea’s Ministry of Employment and Labor reveals that the number of fatalities in the construction industry accounts for half of the total number of industry-related fatalities and that the accident fatality rate in the construction industry is more than four times higher than that those of all other industries [2].
The most advanced countries have established systems and promoted guidance, training, and supervision following legislative amendments and voluntary on-site safety activities; however, they have not successfully reduced the number of major accident types in the construction industry. To reduce construction-related accidents, various efforts have been made to establish safety monitoring systems [5], improve materials and equipment [6], improve technology [7], and strengthen safety education [8]; additionally, related studies have been conducted, although with less-than-expected effectiveness. Conversely, an approach that considers the exploration of the causes of construction accidents and their interrelationships can facilitate comprehensive and efficient safety management [9], as it offers detailed information about the occurrences and causes of accidents, as well as direct information for accident analysis and prevention. Thus, the various causes inherent to past events must be identified so that actionable mitigation strategies can be implemented to prevent the occurrence of similar mistakes in the future.
Accident causation models (ACMs) play a crucial role in this study, as they highlight the logical relationships between various causal factors. Numerous ACMs have been proposed in the safety field, and several typical models abound in the literature. These include Greenwood and Woods’ accident probability model [10], Heinrich’s domino ACM [11], the bird loss causation model [12], Rasmussen’s accident risk management framework (AcciMap) [13], the Swiss cheese model (SCM) [14], Wiegmann and Shappell’s human factors analysis and classification system (HFACS) [15], and Leveson’s systems theory accident modeling and process model (STAMP) [16]. As each ACM employs a unique approach to analyzing accidents, defining the causes of accidents and their respective levels through accurate comparison would be challenging. Therefore, a common drawback emerges in that they cannot effectively prevent accidents [17].
However, numerous studies and literature reviews on construction safety have emphasized the technical and organizational complexities of construction projects [18]. In construction, it is necessary to manage the interests and influences of stakeholders, ensure compatibility between the elements that constitute a facility, and manage and coordinate the activities of various workforces and trades. To ensure these, workers, materials, and equipment must be in constant motion [19]. To account for this technical and organizational complexity, a systematic accident occurrence framework must be developed for the built environment, and the interrelationship between the causes of construction accidents and neighboring factors must be studied. Hale et al. developed a framework for determining the root causes of fatal construction accidents, opining that accidents are due to the concentration of basic factors related to inadequacies in planning and risk assessment, competency assurance, hardware design, purchase and installation, and contracting strategies [20]. Khosraviet et al. explored 56 extant studies to determine the variables that influence unsafe behaviors and accidents on construction sites, confirming the high association of organizational factors, such as safety climate/culture, information management, policy/plan, commitment/support, management style, and review/feedback, with construction safety management [21]. Tong et al. proposed a modified ACM for highway construction (accident cause analysis), although it used data from 426 accidents within a limited period and exhibited a limited ability to specifically demonstrate the relationship between major accident factors [22].
Recently, research has been conducted on accidents in the construction industry. Chellappa conducted a comprehensive analysis of the causes of falls within the Indian construction sector to identify the immediate conditions, formative factors, and underlying effects of accidents. However, this research is limited by its reliance on only 10 accident cases [23]. Awolusi and colleagues made use of leading and lagging indicators of safety performance on construction sites to identify crucial variables for predicting construction accidents. They pinpointed seasonal factors and the unsafe use of equipment for specific tasks as significant variables for accident prediction and analyzed these conditions using simple regression and statistical analysis [24]. Li and their team applied natural language processing (NLP) to the unstructured text of accident reports to extract keywords and analyze the main causes of fall accidents using this information. Nonetheless, their analysis was confined to a simple word cloud analysis through word extraction, and they only evaluated the accuracy level using commercial deep learning (DL) and machine learning (ML) models. This approach also limits the derivation of safety management measures for general contractors by focusing solely on an overview of accident occurrences [25]. Recent studies have also aimed to derive safety management measures for general contractors through limited data, statistical analysis, and the application of deep learning. Therefore, there is a need to expand these efforts to include safety management for each construction entity.
In this study, we revealed the development of accidents and determined the classification and specific contents of major accident causes based on the existing ACM (the 2–4 model) to further optimize the logical relationship and theoretical framework. In Korea, most major accidents are uploaded to the system using CSI, and the data are publicly accessible. Therefore, we explored 19,511 industrial accidents registered in CSI between 2023 and 2024 and analyzed the causes of fatal accidents through association rule mining (ARM) analysis using the 4M (Men, Machine, Media, Management) technique (a risk analysis technique), focusing on major accident types, such as falls, collisions, being hit by objects, crushing, and pinching. Finally, we refined the accident causation framework by specifying the causal relationship of each accident type. Thereafter, we proposed safety management measures for each construction entity.

2. Theoretical Background

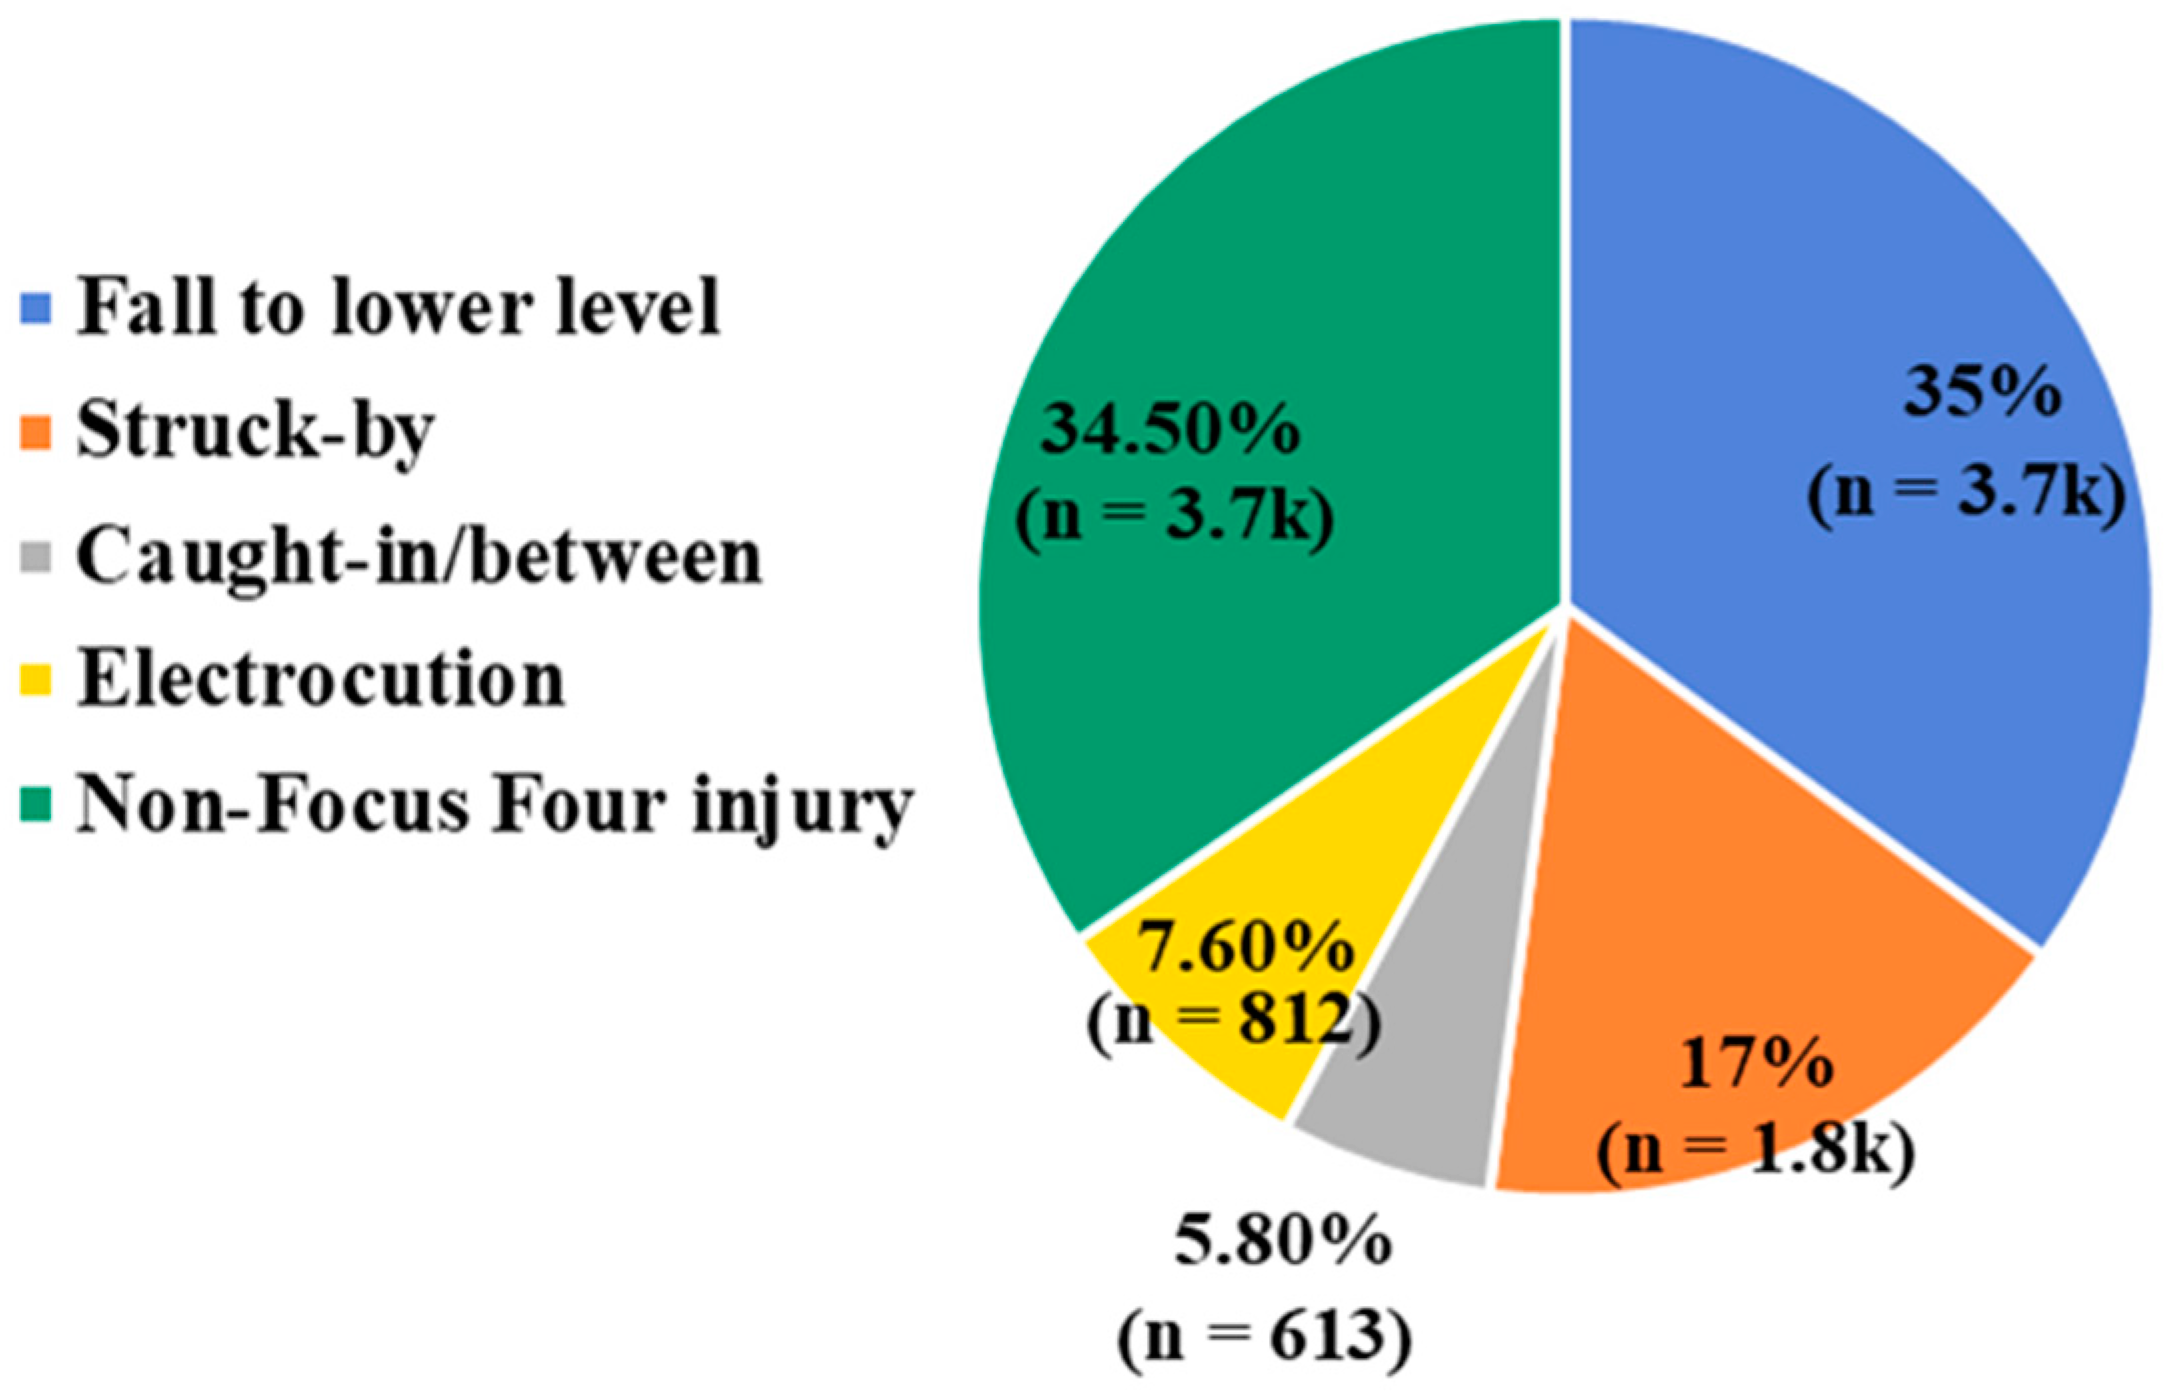
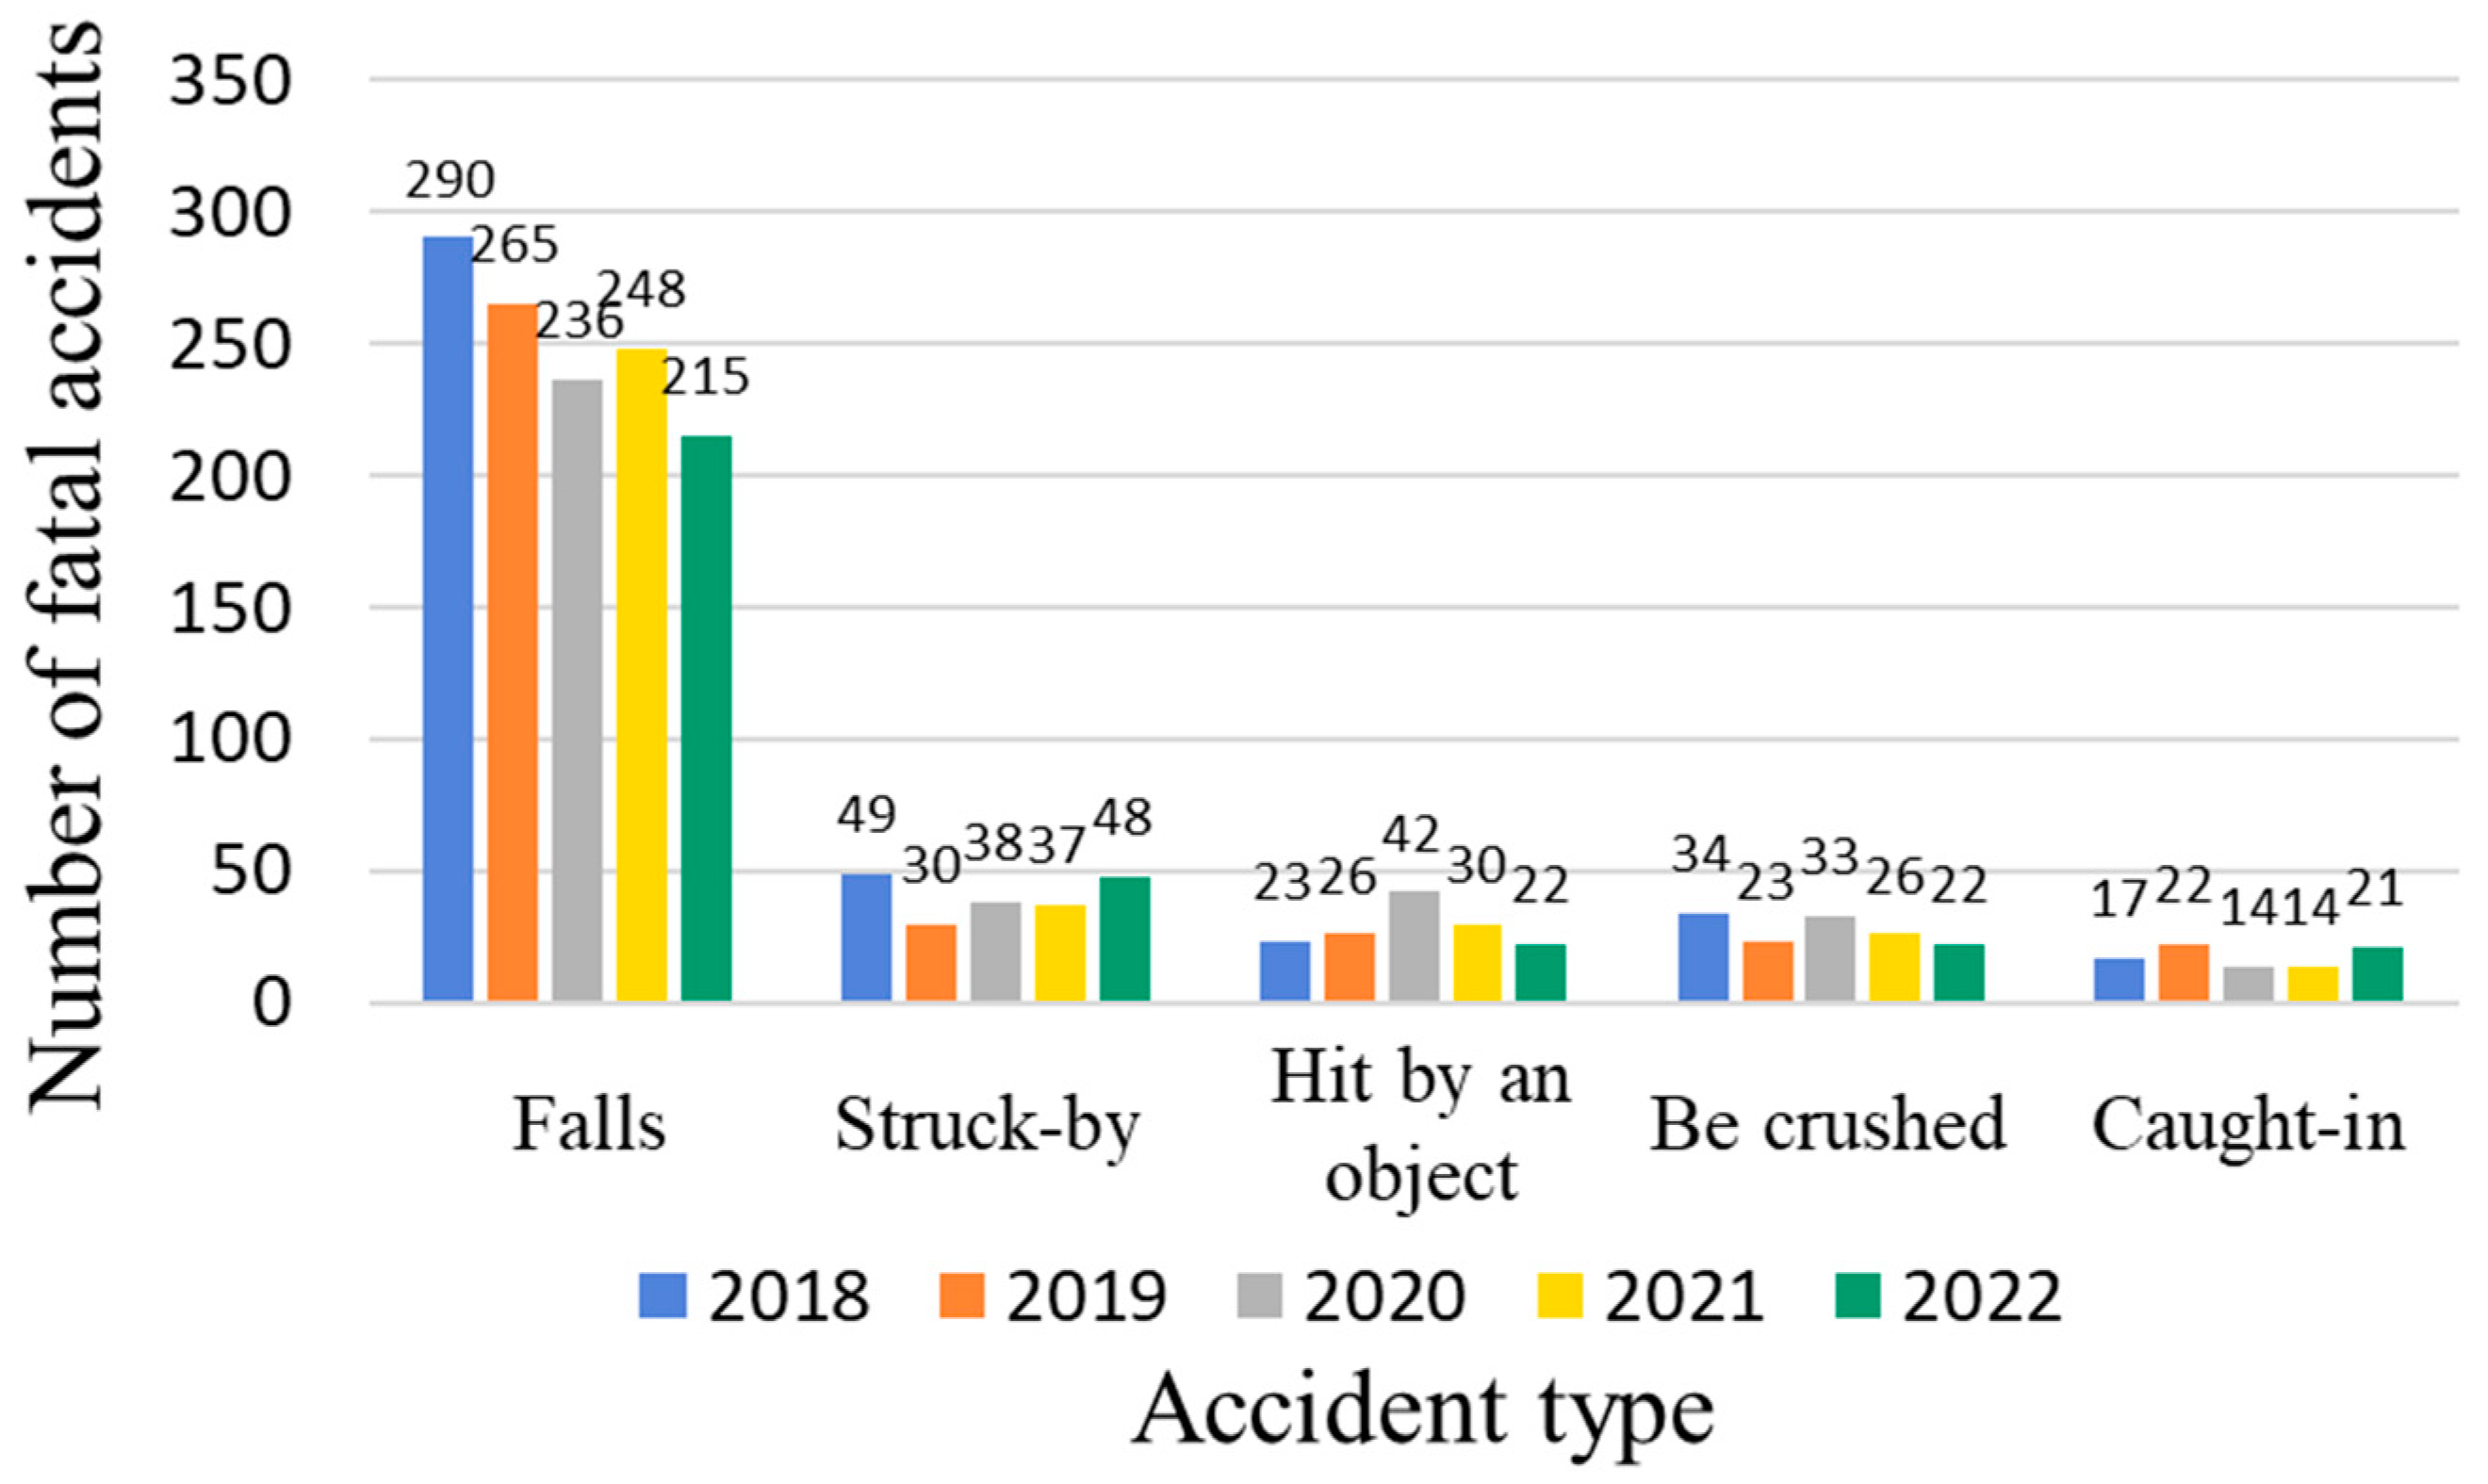
2.1. Definition of the Major Accident Types

An accident/disaster type is a phenomenon related to how an accident or disease occurs or the cause of a worker’s injury. The major accident types are presented in Table 1 [26].
Dissimilar to other accident types, these major ones have no subtypes that can be forewarned or mastered through experience. Accidents that are completely unexpected or caused by mistakes are most often severe, disabling, or fatal. In particular, fall accidents, which cause death or severe injuries, account for the most fatal accidents in the construction industry. Although these accidents occur in all industries, the construction industry accounts for the highest rate.
The Korea Occupational Safety and Health Agency (KOSHA) has described the characteristics of these major accident types (Table 2) and proposed prevention measures [27]. These major accident types are mainly characterized by small-scale sites lacking safety management plans, safety facilities, and safety managers. Therefore, a good starting point for accident prevention would be the development and implementation of a safety management plan.

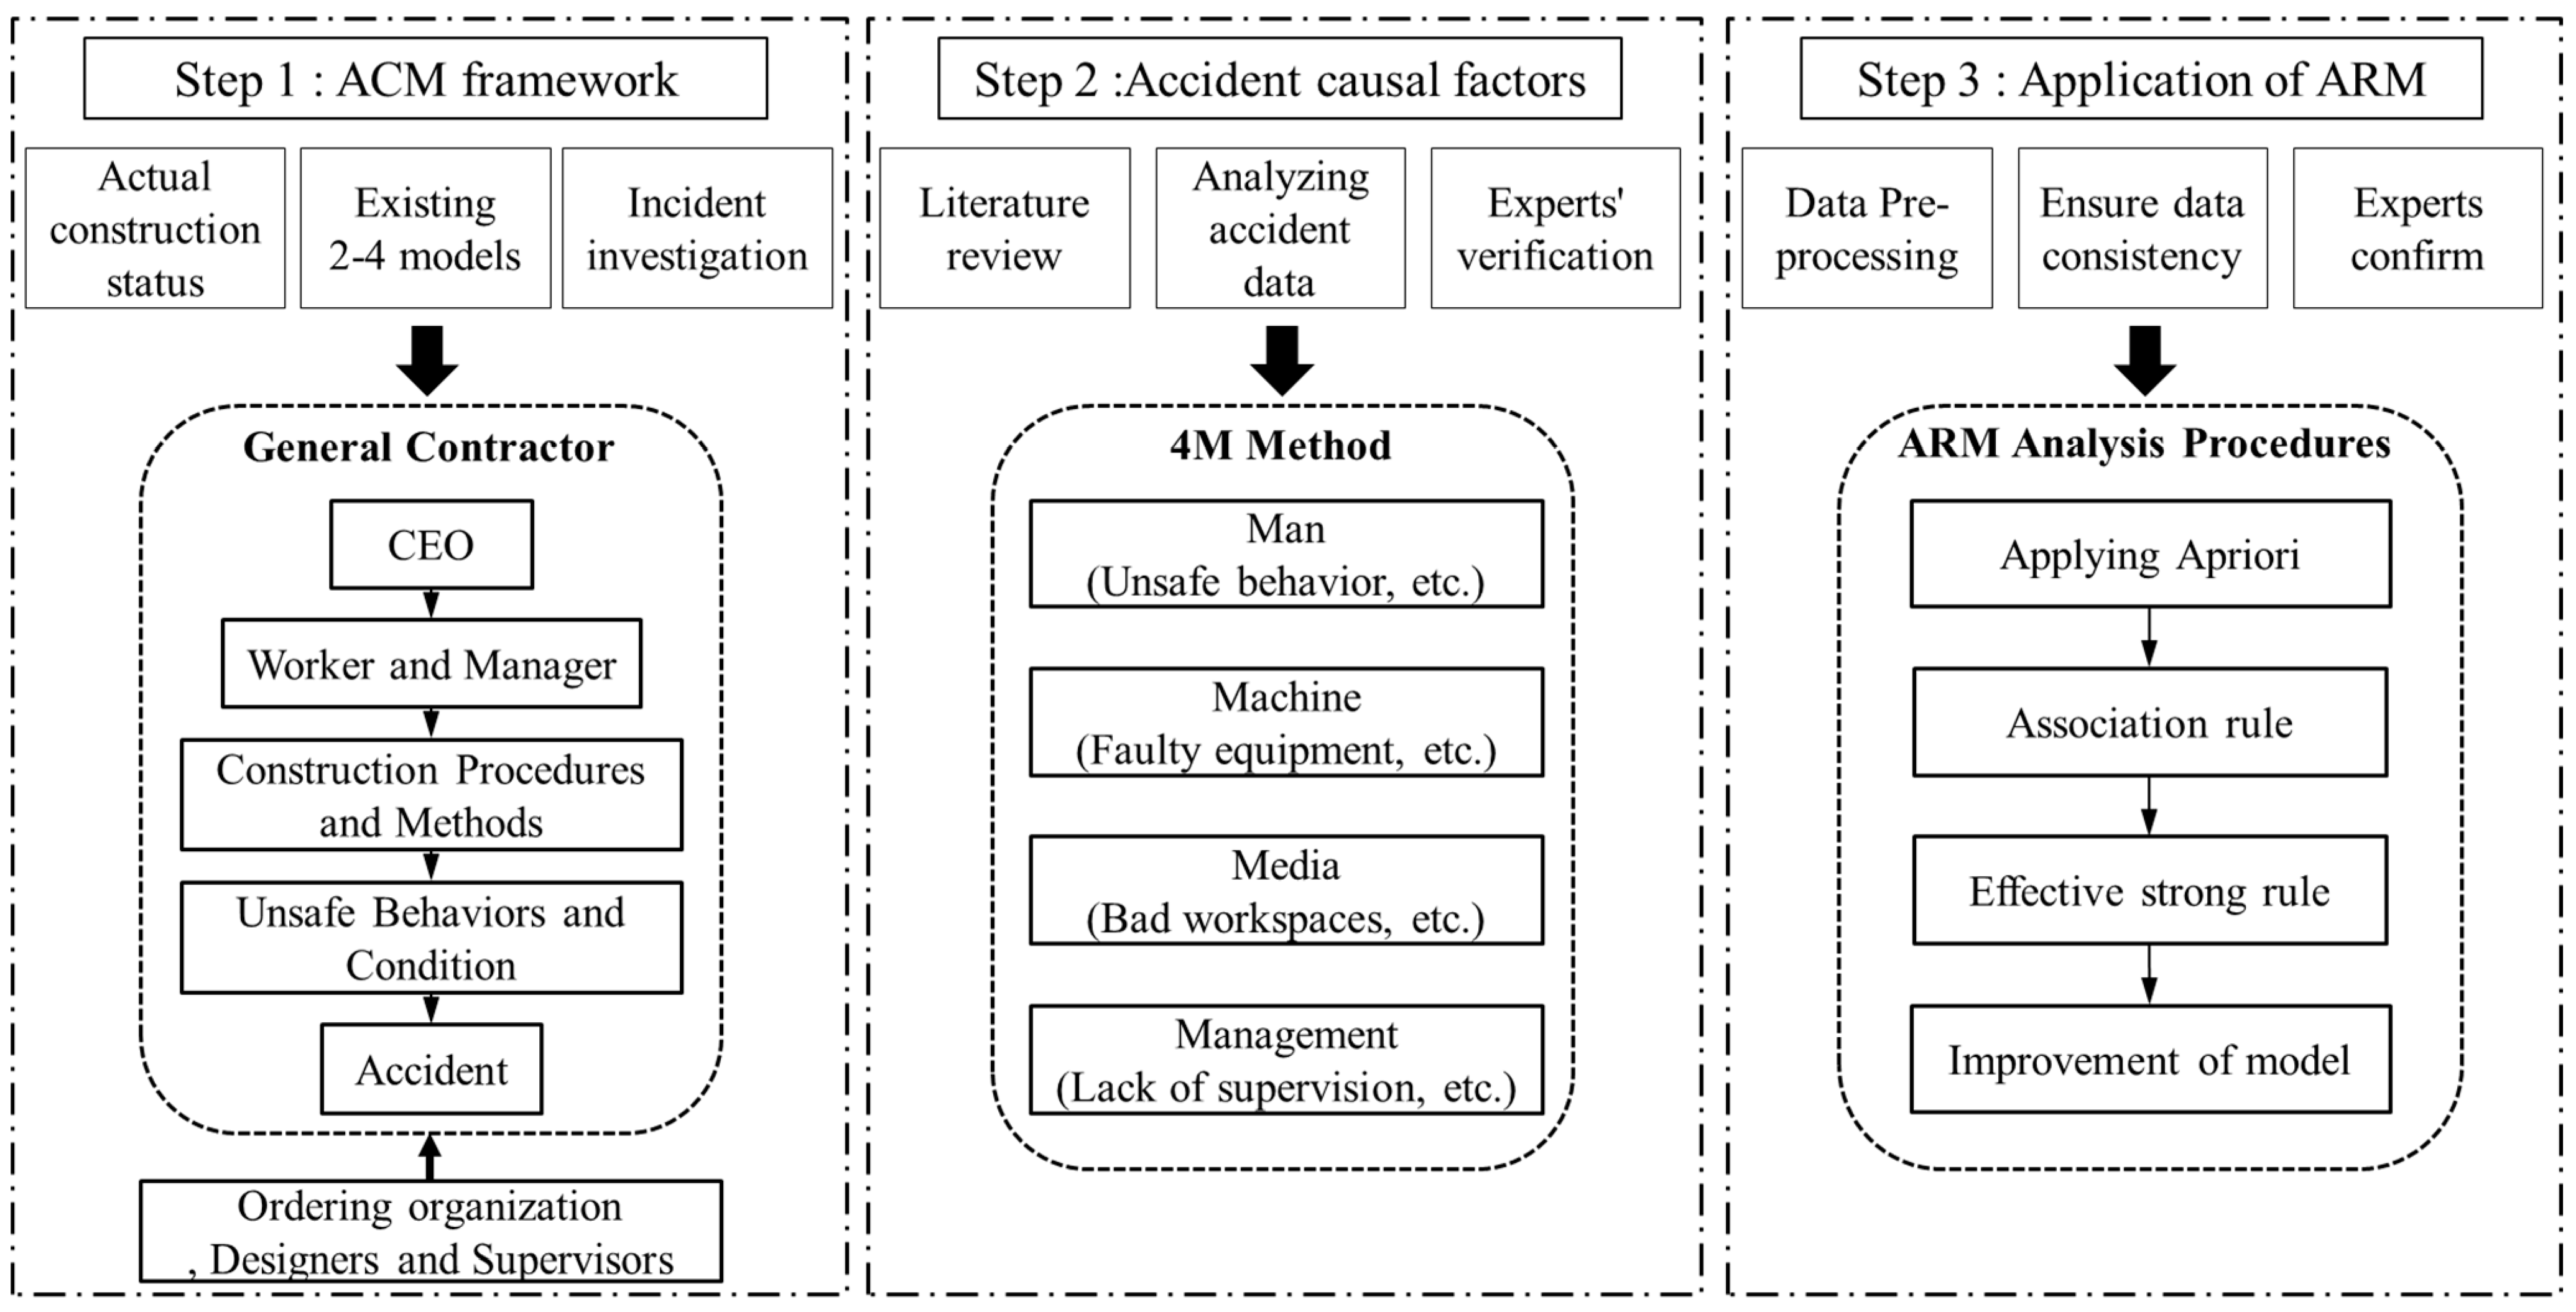
2.2. Risk Analysis Using the Man, Machine, Media, and Management Method

The 4M risk analysis method is designed to minimize the possibility of accidents by analyzing the risk factors of possible industrial workplace accidents. This method identifies potential hazards within the to-be-analyzed process or task using four factors, Man, Machine, Media, and Management, and proposes measures for eliminating risks.
Risk assessment represents a rational analysis method that identifies hazardous factors in the to-be-evaluated task and establishes measures for minimizing the possibility of the hazardous factors that develop into accidents, as well as deriving the root cause of the issue by classifying the range of causes into 4Ms. The “Man” factors are unsafe behaviors that are attributable to worker characteristics. The “Machine” factors are defects that are attributable to protective devices and safety shoes. The “Media (material and environmental)” factors are defects in the workplace (workplace and structure). The “Management” factors are managerial defects that cause accidents, such as the absence of education, training, or regulations and manuals [28].
In a 4M study in Korea, Cho emphasized that when applying the 4M technique to the factors of fall fatalities, the human factor corresponds to safety awareness and human error, as well as mistrust between supervisors and workers, even though they consider safety critical [29]. Jeong categorized the human causes of accidents into technical, managerial, and educational causes. However, the results of Jeong’s study revealed that educational causes, which are due to a lack of safety awareness and knowledge, accounted for most of the causes [30]. Kang analyzed the human error-related factors in fatal accidents and argued that adequate risk management can reduce the accident rate in the long run [31].

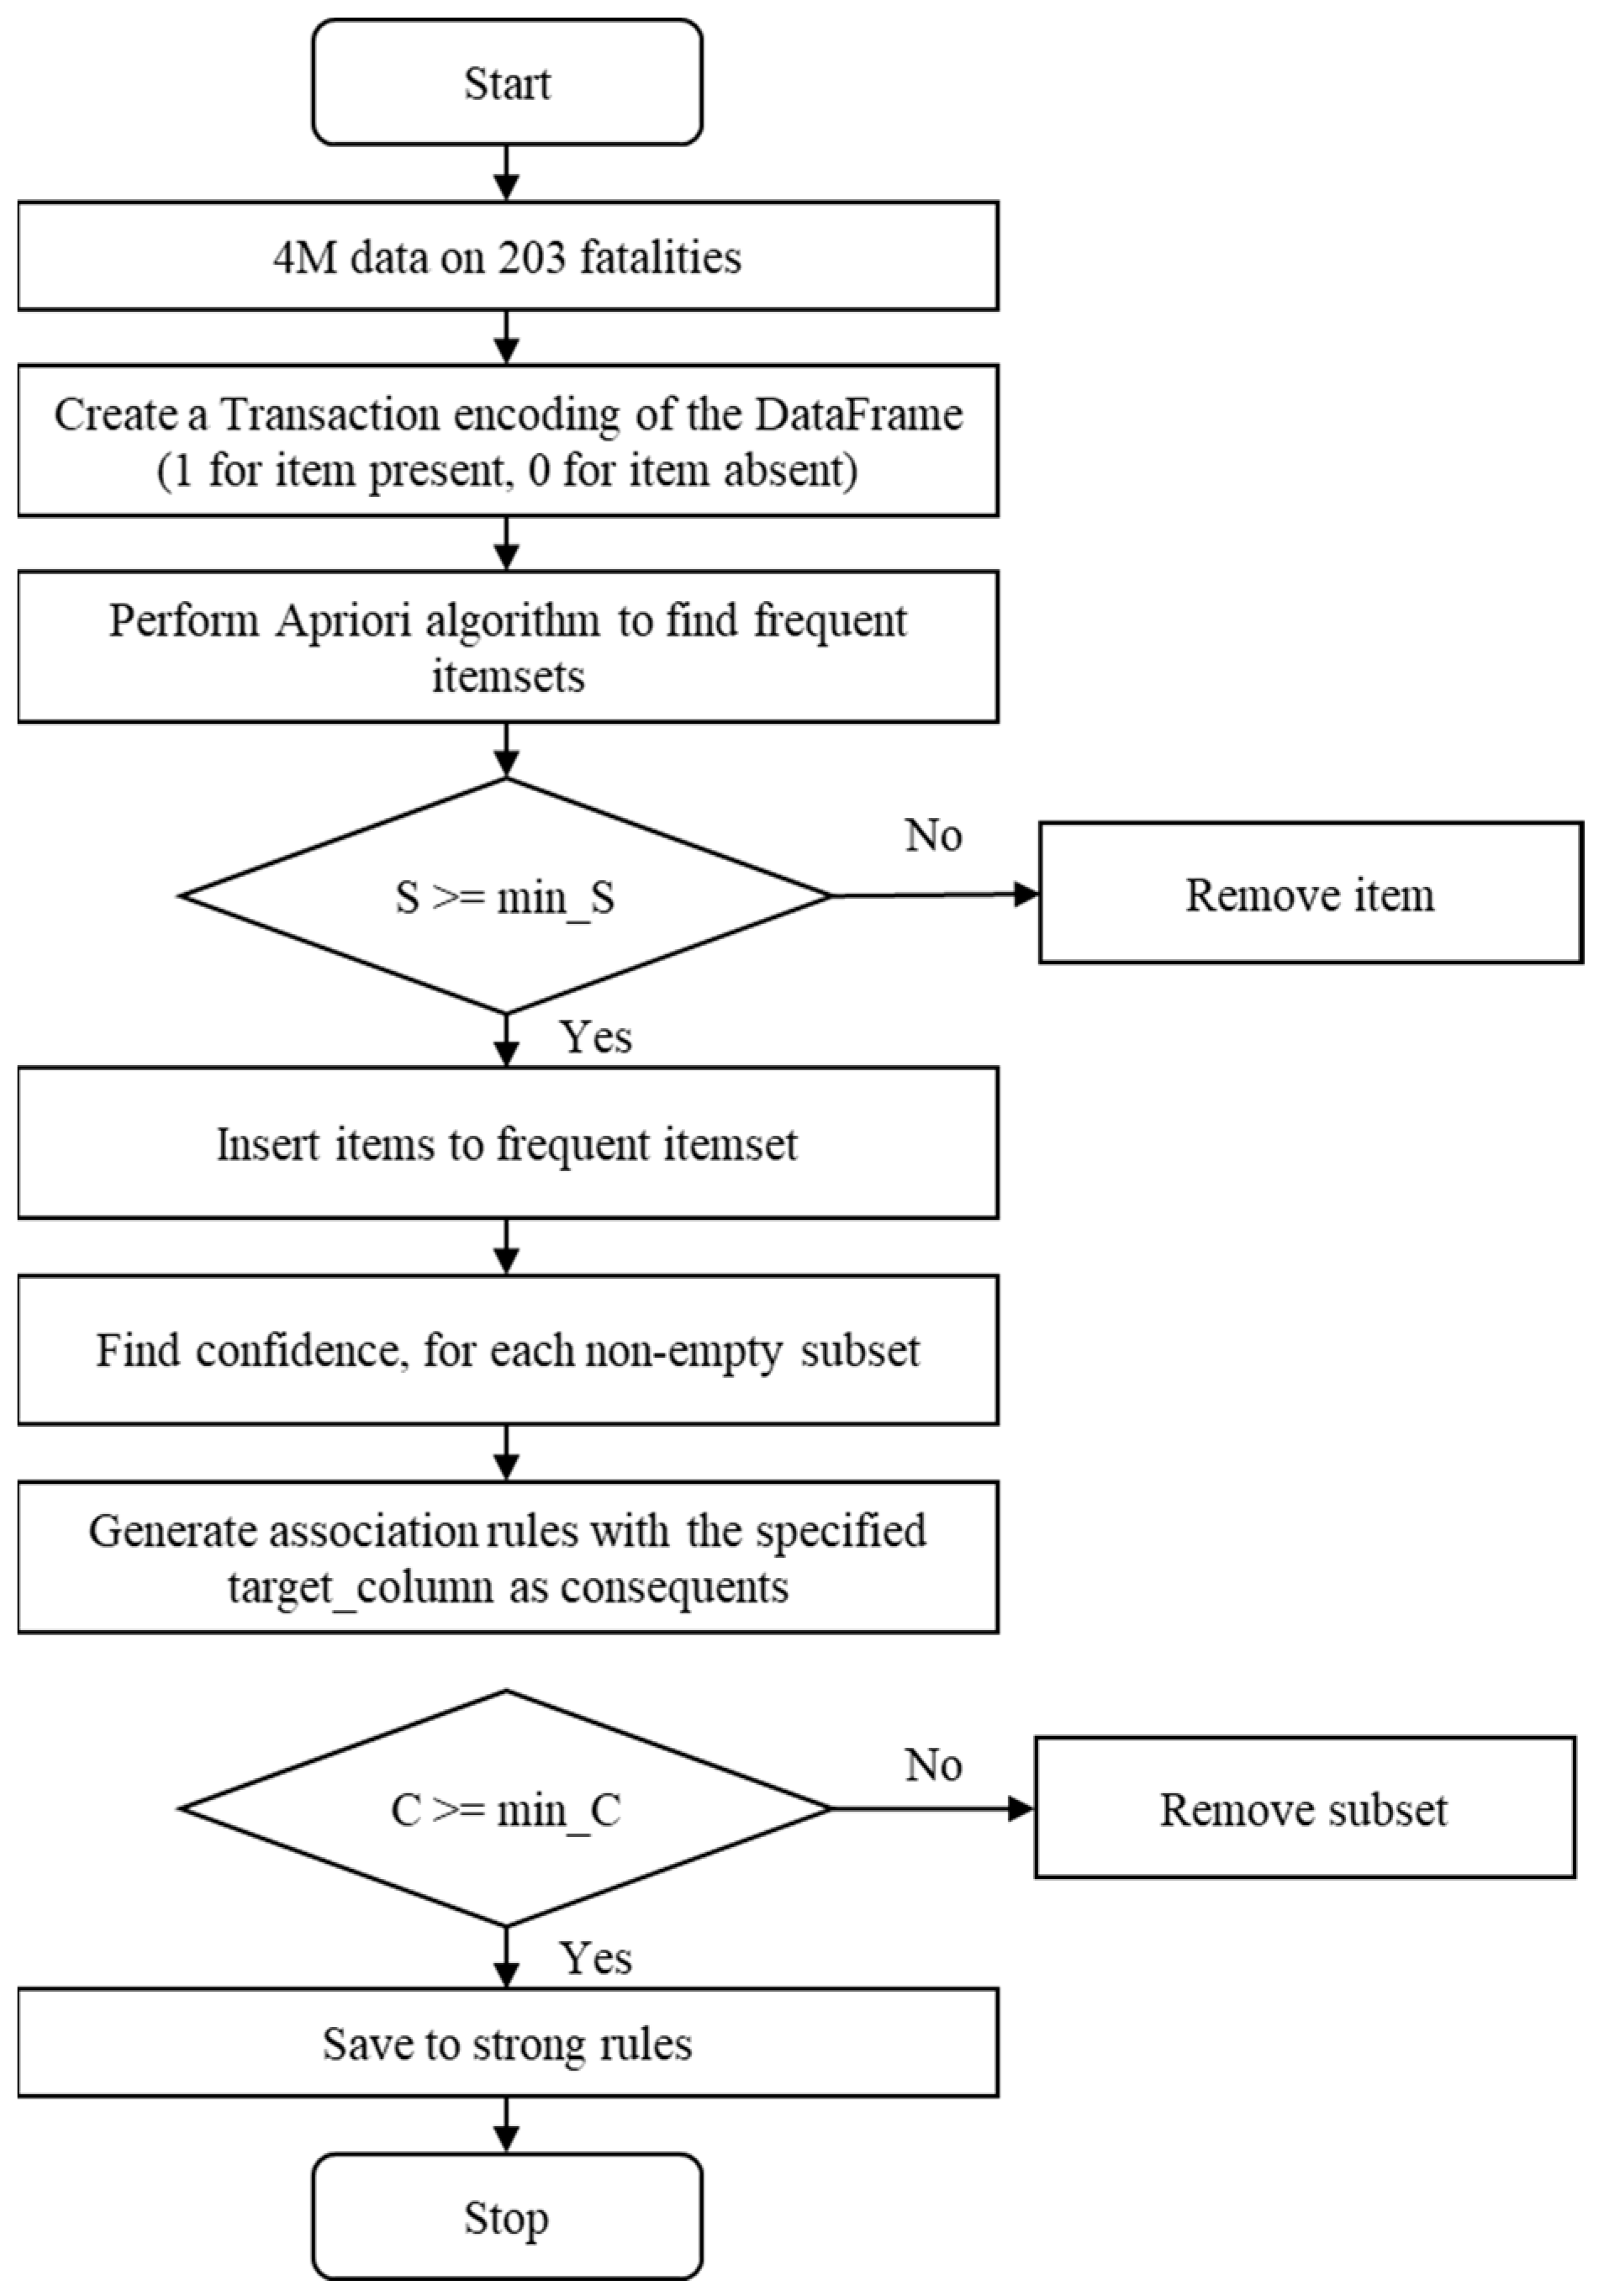
2.3. Apriori Algorithm

The Apriori algorithm utilizes support (frequency), confidence (probability), and enhancement (correlation) to create association rules [32]. Figure 3 shows a more detailed description of each step. First, we converted the data obtained from the 4M classification of the 203 deaths into transactions, and each transaction was represented as a set of items. For example, in the incident data, one transaction could represent all 4Ms categorized in a fall incident. Second, a frequent item set was generated based on a support map. The support map indicates the frequency at which a particular item set appears in all transactions. It searches for item sets above a certain threshold. For example, if the item “human error” is frequently applied, a set of items containing “human error” might be considered a frequent item set. Third, association rules were generated based on the frequent item sets. The Apriori algorithm sets the form of the rule as {A} => {B} and evaluates the rule using metrics such as support, confidence, and improvement. The resulting rules represent the interrelationships among specific incident types and the 4M classifications.
  • Rule form: {A} => {B};
  • Support: percentage of all transactions in which {A, B} occurs;
  • Confidence: probability of {B} appearing when {A} appears;
  • Lift: probability of {A} and {B} occurring simultaneously/(probability of {A} occurring × probability of {B} occurring).
Finally, the generated rules were evaluated and filtered.
Rules were applied based on the thresholds of support, confidence, and improvement set in this study. Among the derived rules, only those with a confidence level of >1 were selected and sorted in decreasing order by support level to analyze the causes of accidents.

3. Statistics and Interpretation

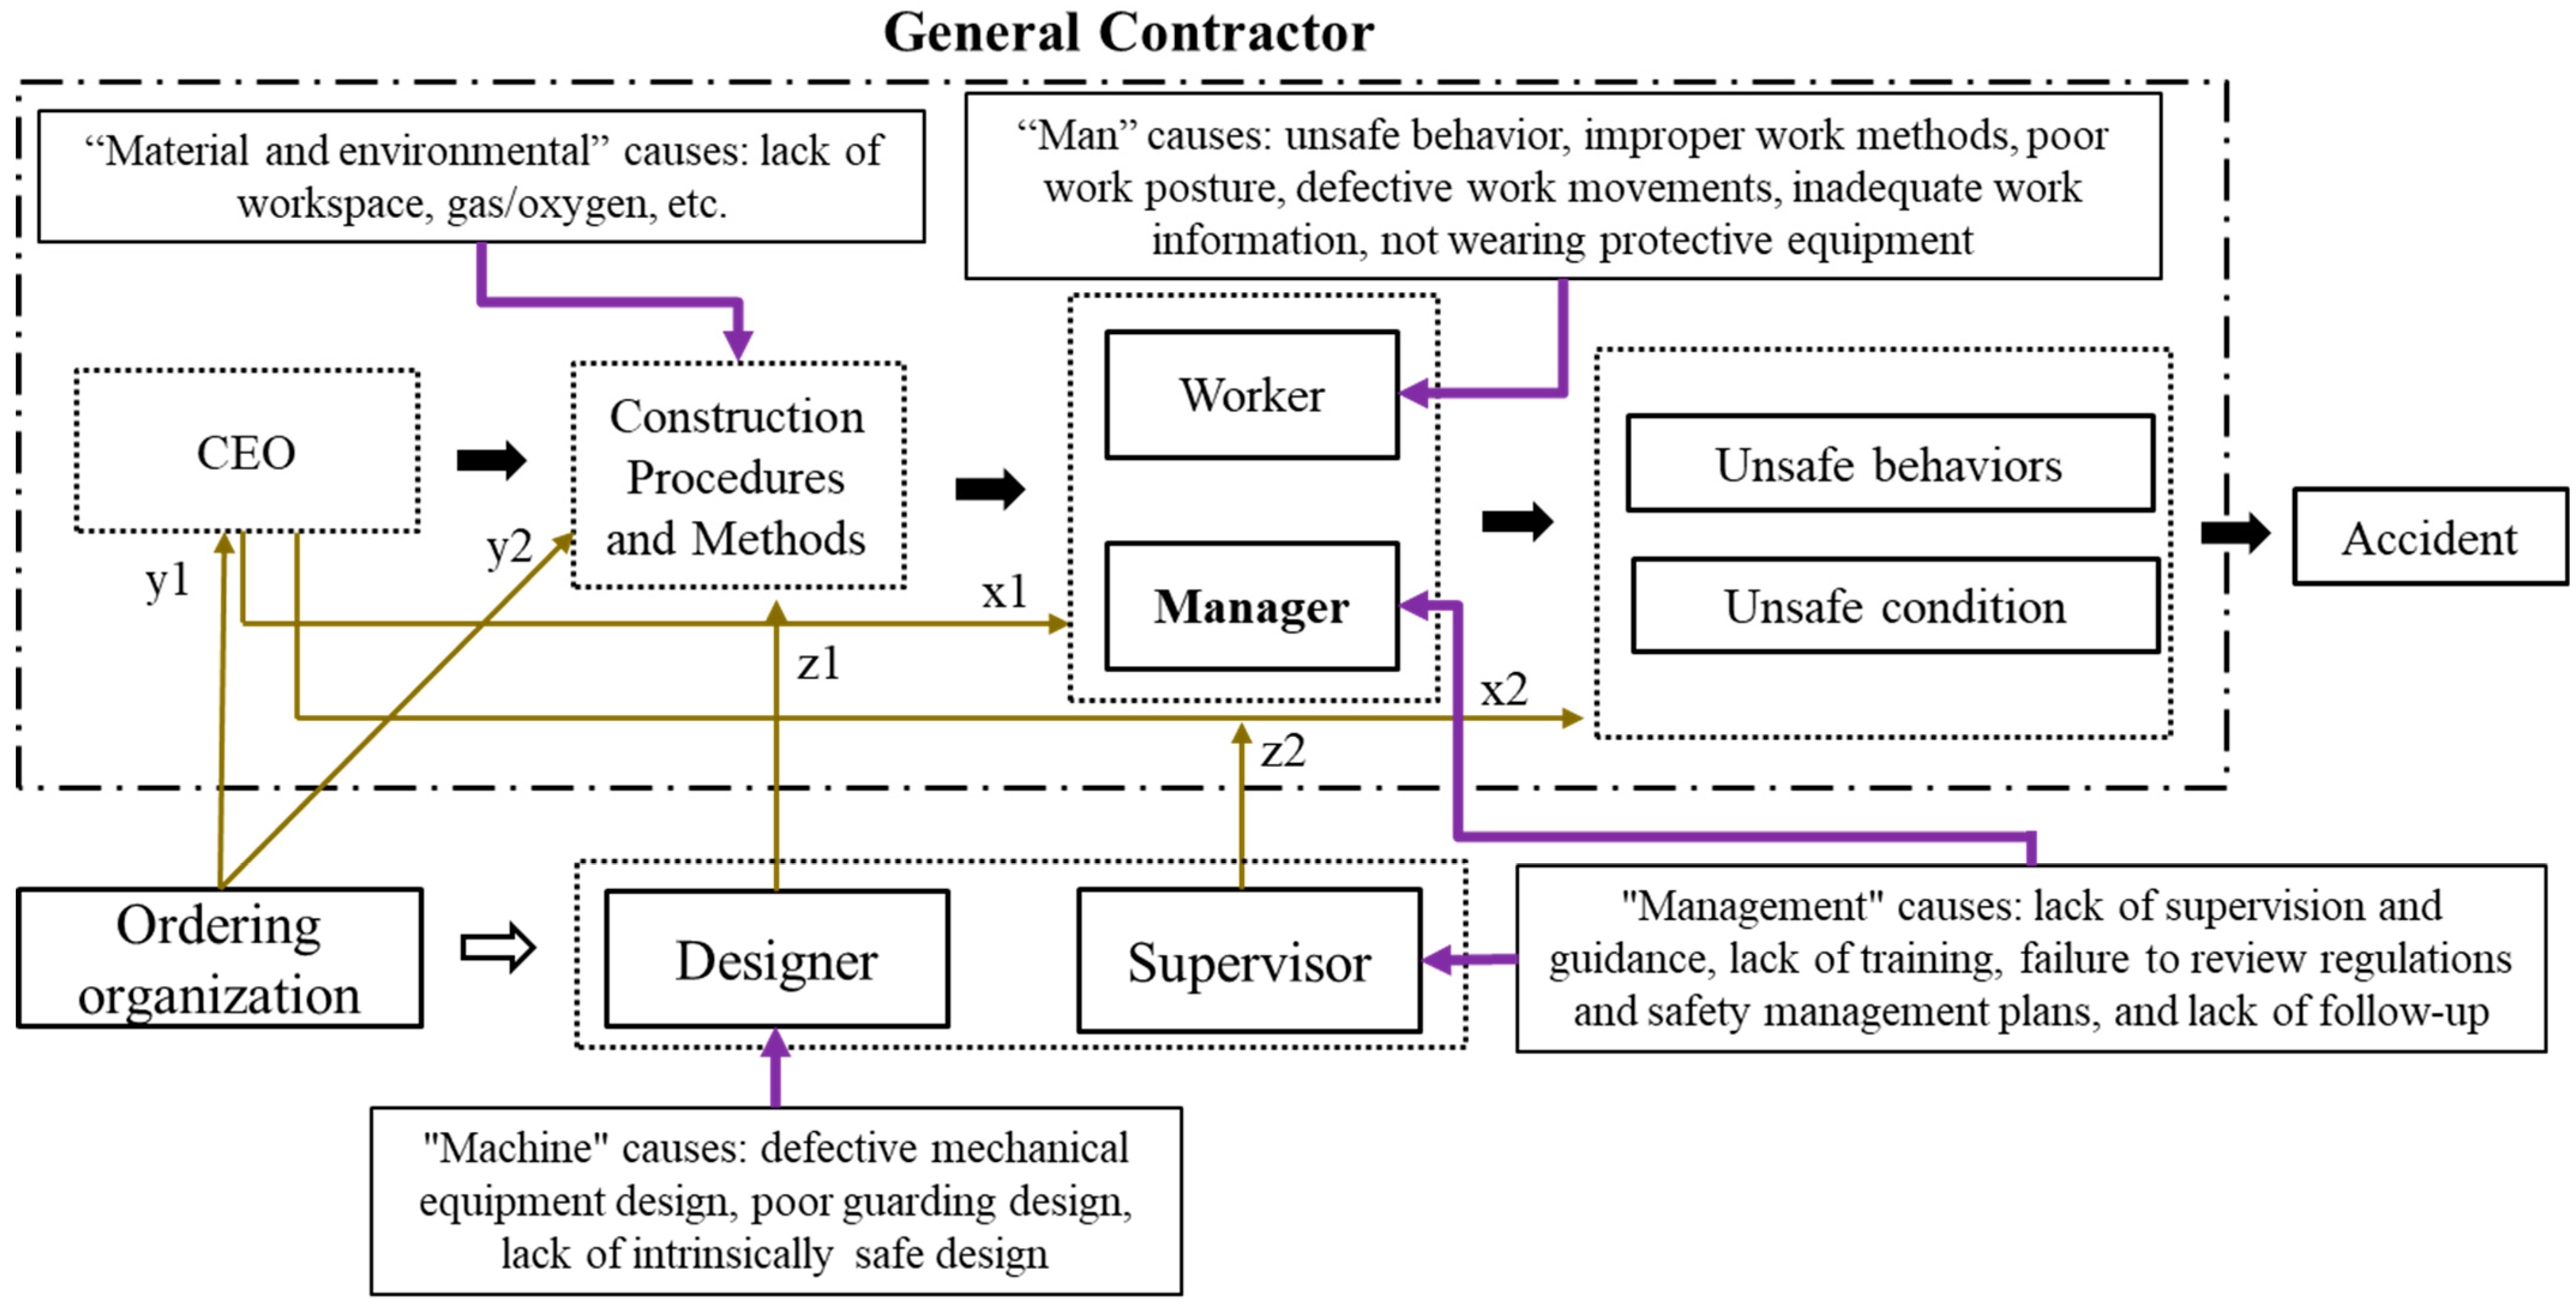
3.1. Building an Incident Overview Model Based on the 2–4 Model

In this study, we attempted to build a cause–effect model to explain the causes, sequences, and mechanisms of the major fatal accident types in Korea and presented the construction process (Figure 4). First, an accident cause model framework was built based on the 2–4 model [33], and the causes of accident types were extracted using the 4M method. Thereafter, ARM was introduced to analyze the data from accident investigation reports and obtain interrelationships between causes. The framework was improved based on the results of the above three steps, after which the final model was built.
The 2–4 model (Figure 5) was systematically proposed based on the accident causal chain of the domino model and SCM, as well as the perspectives of Wigglesworth, Bird, Loftus, and Stewart [34]. In the 2–4 model, accident causes were divided into two levels (individual and organizational levels) and attributed to four levels (direct cause (DC), indirect cause (IC), radical cause (RAC), and root cause (ROC)). DCs represent unsafe behaviors and conditions, and ICs represent individual factors in an adverse environment. Safety management system deficiencies or miscommunications are considered RACs. ROC is a positive safety culture that promotes broad organizational commitment, motivation, and individual identification to improve the safety performance of the entire system. Safety culture is considered an ROC.
The occurrence of accidents is influenced by the contractor, as well as the design and supervisors associated with the contractor. These stakeholders influence the contractor’s internal safety management by overseeing the construction process and providing technical and financial support. The CEO of the contractor determines the safety management behavior and the ability to improve the safety culture, ultimately influencing the safety performance of the construction project, which is considered an ROC [35]. Deficiencies in construction procedures and technical planning can readily expose frontline workers to hazardous working conditions that are considered RACs. ICs result in more dangerous behaviors and conditions in construction sites due to the lack of safety supervision and the poor individual factors attributed to frontline workers. Unsafe behaviors and conditions directly cause accidents and are considered DCs [36].

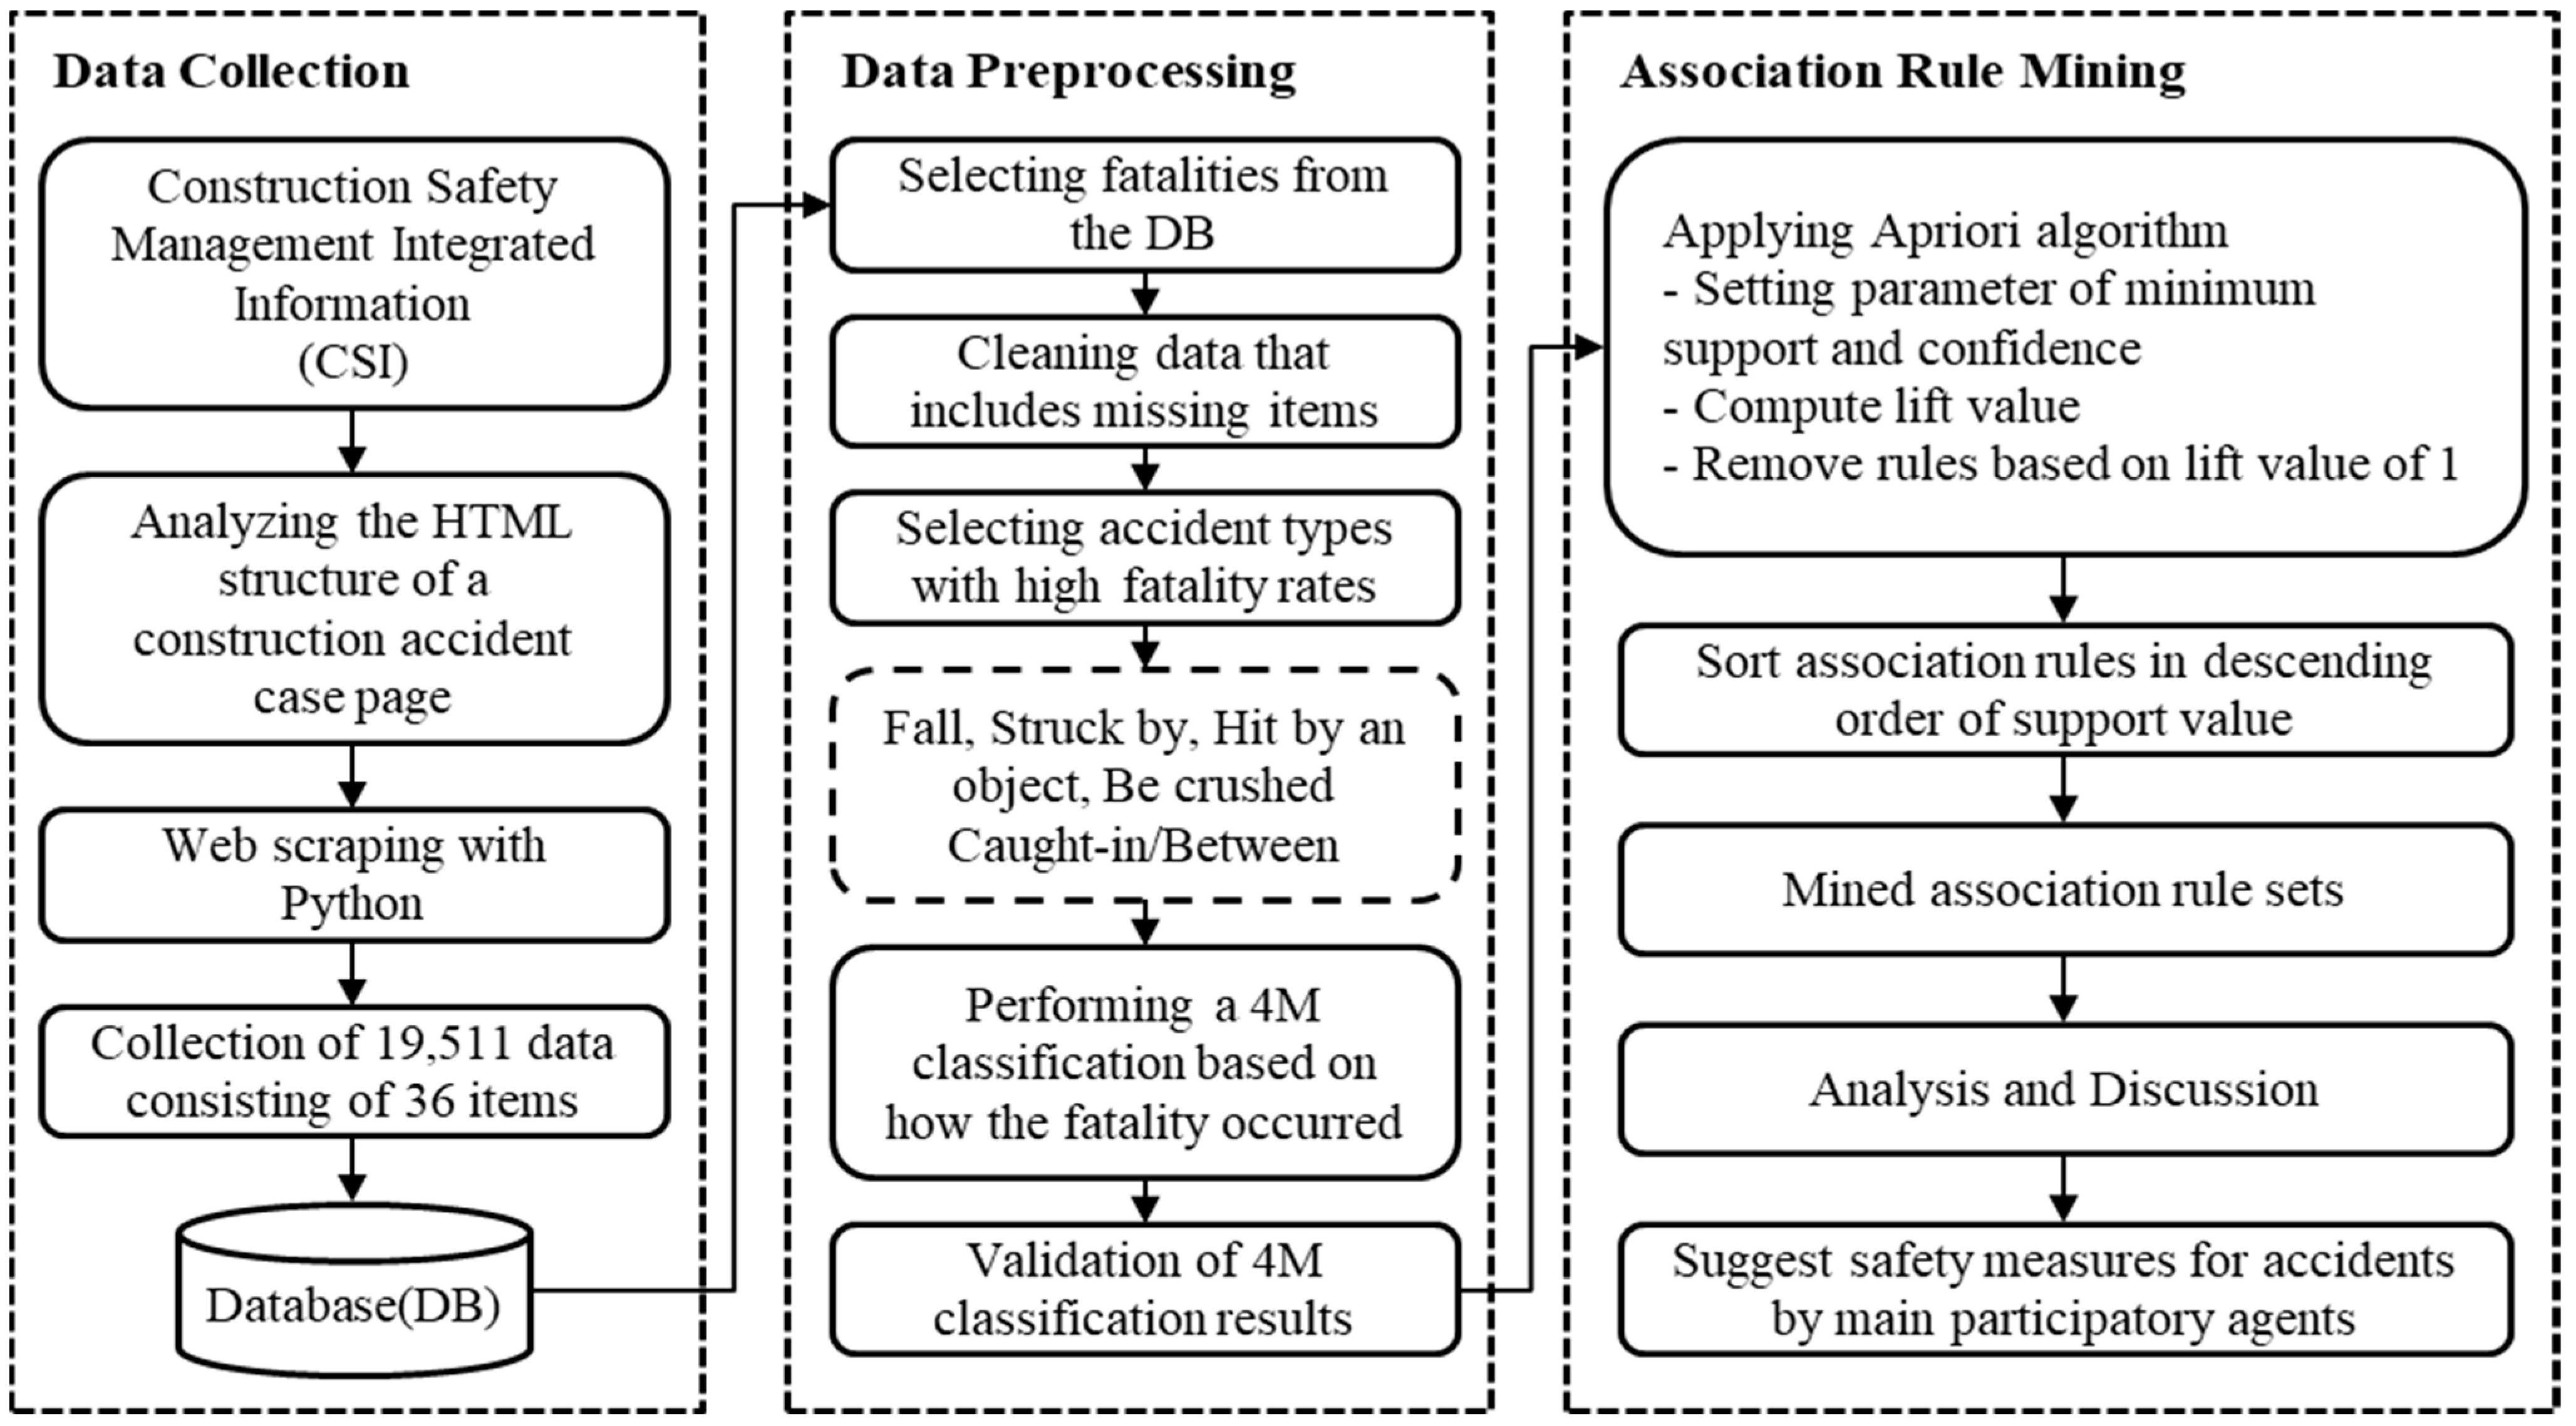
3.2. Data Collection and Analysis

To determine the main causes of accidents in construction sites, a three-step procedure was implemented for accident cases reported to the government-operated CSI network (Figure 6).
First, web scraping was applied to the accident cases reported to CSI. CSI provides an application programming interface, although it has a daily usage limit. Therefore, we applied web scraping using Python by analyzing the HTML structure of CSI web pages; thereafter, the collected data were only used for public research purposes. Next, the data were preprocessed and categorized. We extracted accident records with a minimum of one fatality from the collected data and excluded the cases with NAN cells from the 36 categories. Thereafter, we selected five accident types with high fatality rates (fall, hit, crushed, hit by an object, and entanglement) and performed the 4M classification based on the data provided by Korean safety-related public organizations and cross-validated by researchers to ensure the reliability of the classification results. Finally, ARM was deployed to identify the accident causes, after which the results were analyzed, followed by the proposition of safety measures for each subject.

3.3. Elements of the Man, Machine, Media, and Material Model

The lack of regulations and manuals in the CSI data limited the accident investigation data. Additionally, some items categorized as material accidents and diseases were not included in the human-accident type. Therefore, the classification criteria and abbreviations of the data collected in this study based on the items used in the general 4M could be summarized, as shown in Table 3.

4. Results and Discussion

4.1. Preprocessing the Data and Building Analytics Datasets

Here, 19,511 accident data points were collected from CSI, and the data were organized into 36 categories, including accident name, accident circumstances, number of fatalities, number of injuries, and future action plans. The collected data comprised registered data for injury accidents (from 18 January 2019 to 19 July 2023) and fatal accidents (from 3 July 2019 to 14 July 2023). Among them, 958 accidents with a minimum of one fatality occurred. Table 4 presents the specific accident types.
The types of accidents that occurred in Korean construction projects were mainly falling, crushing, bumping, being hit by objects, and getting stuck, with falling accidents accounting for the most fatalities. As obtaining overseas data was challenging, we used Korean data. However, the construction accident types in the U.S. and Korea were similar to those published by CPWR, an organization that specializes in construction safety. In the CSI data, collapse and fire accidents were categorized as material causes, whereas other types of accidents included illnesses, unclassifiable, traffic accidents, suffocation, and electric shock. Five main types of human causes were observed: falling, being crushed, being struck, being hit by an object, and being pinched. The total number of analyzed accidents was 763. In the analysis, we excluded some missing information or ambiguous data, excluded duplicate cases, and identified more accurate accident types by adopting representative cases. Therefore, 203 cases were extracted, focusing on the data that specifically recorded the accident circumstances. Table 5 presents the data composition. After analyzing the accident history, 4M classification was conducted and cross-validated based on the specific classification criteria in Table 3; thereafter, it was used as data for ARM analysis.

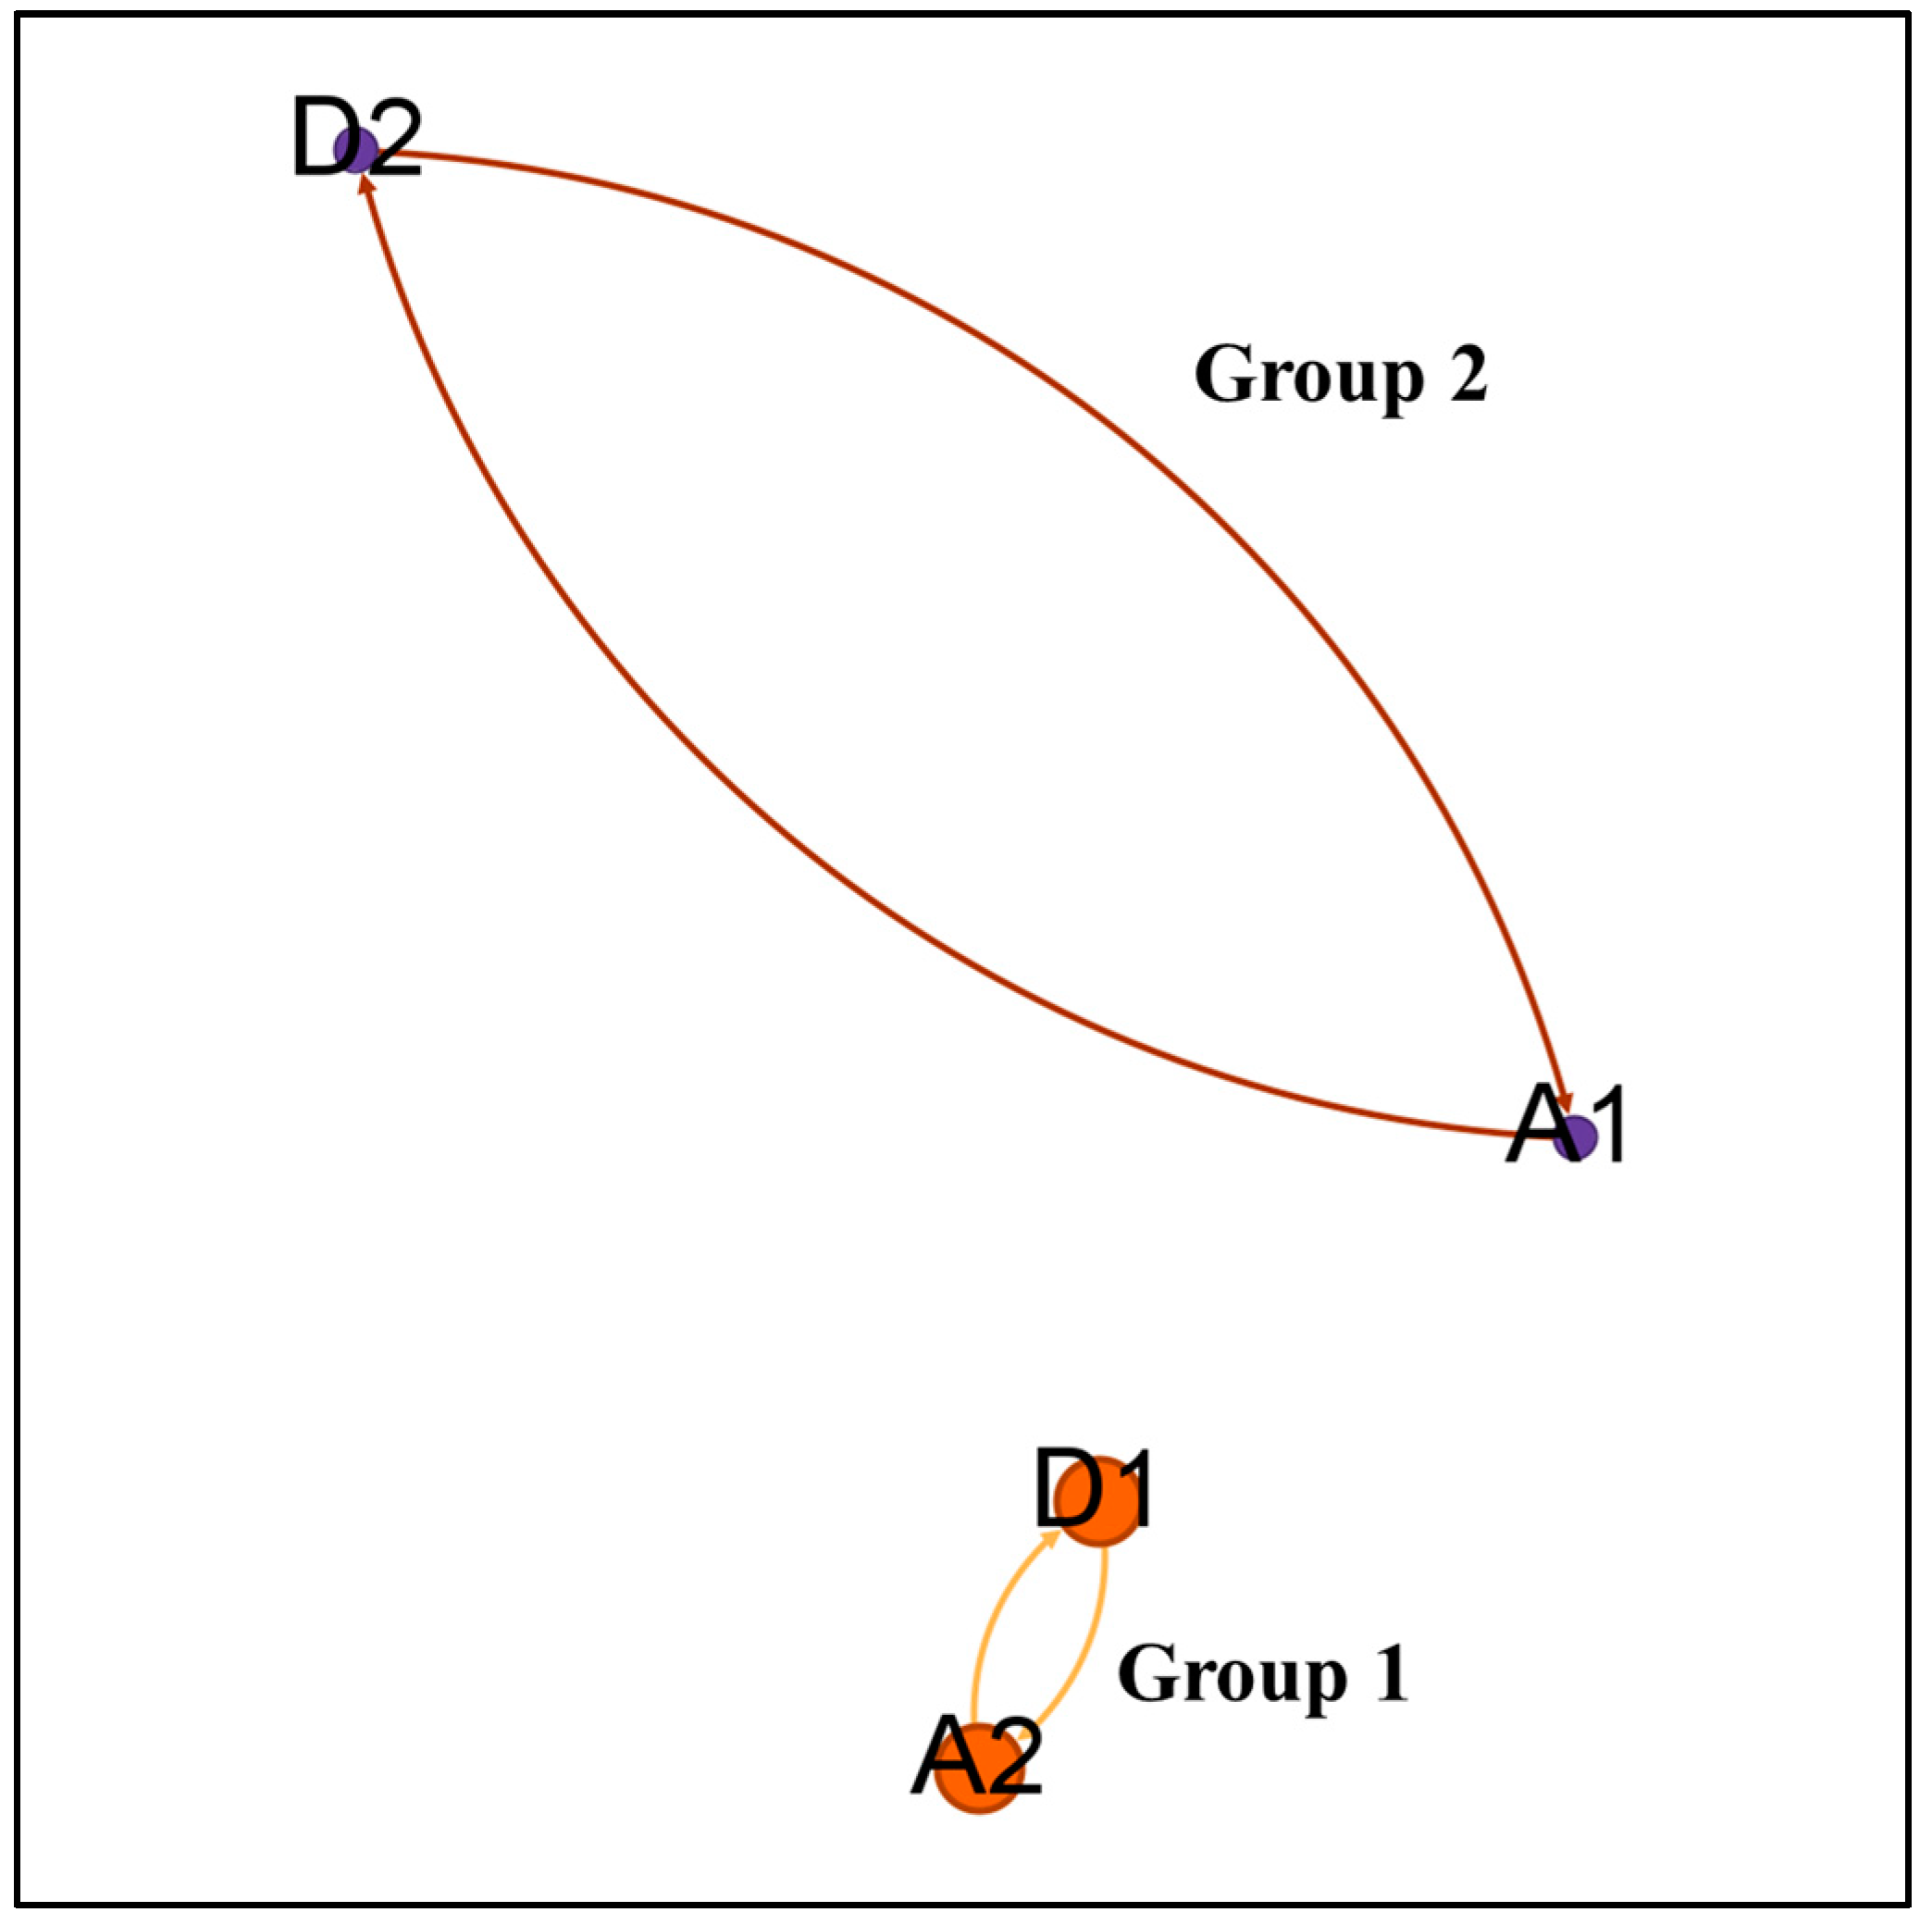
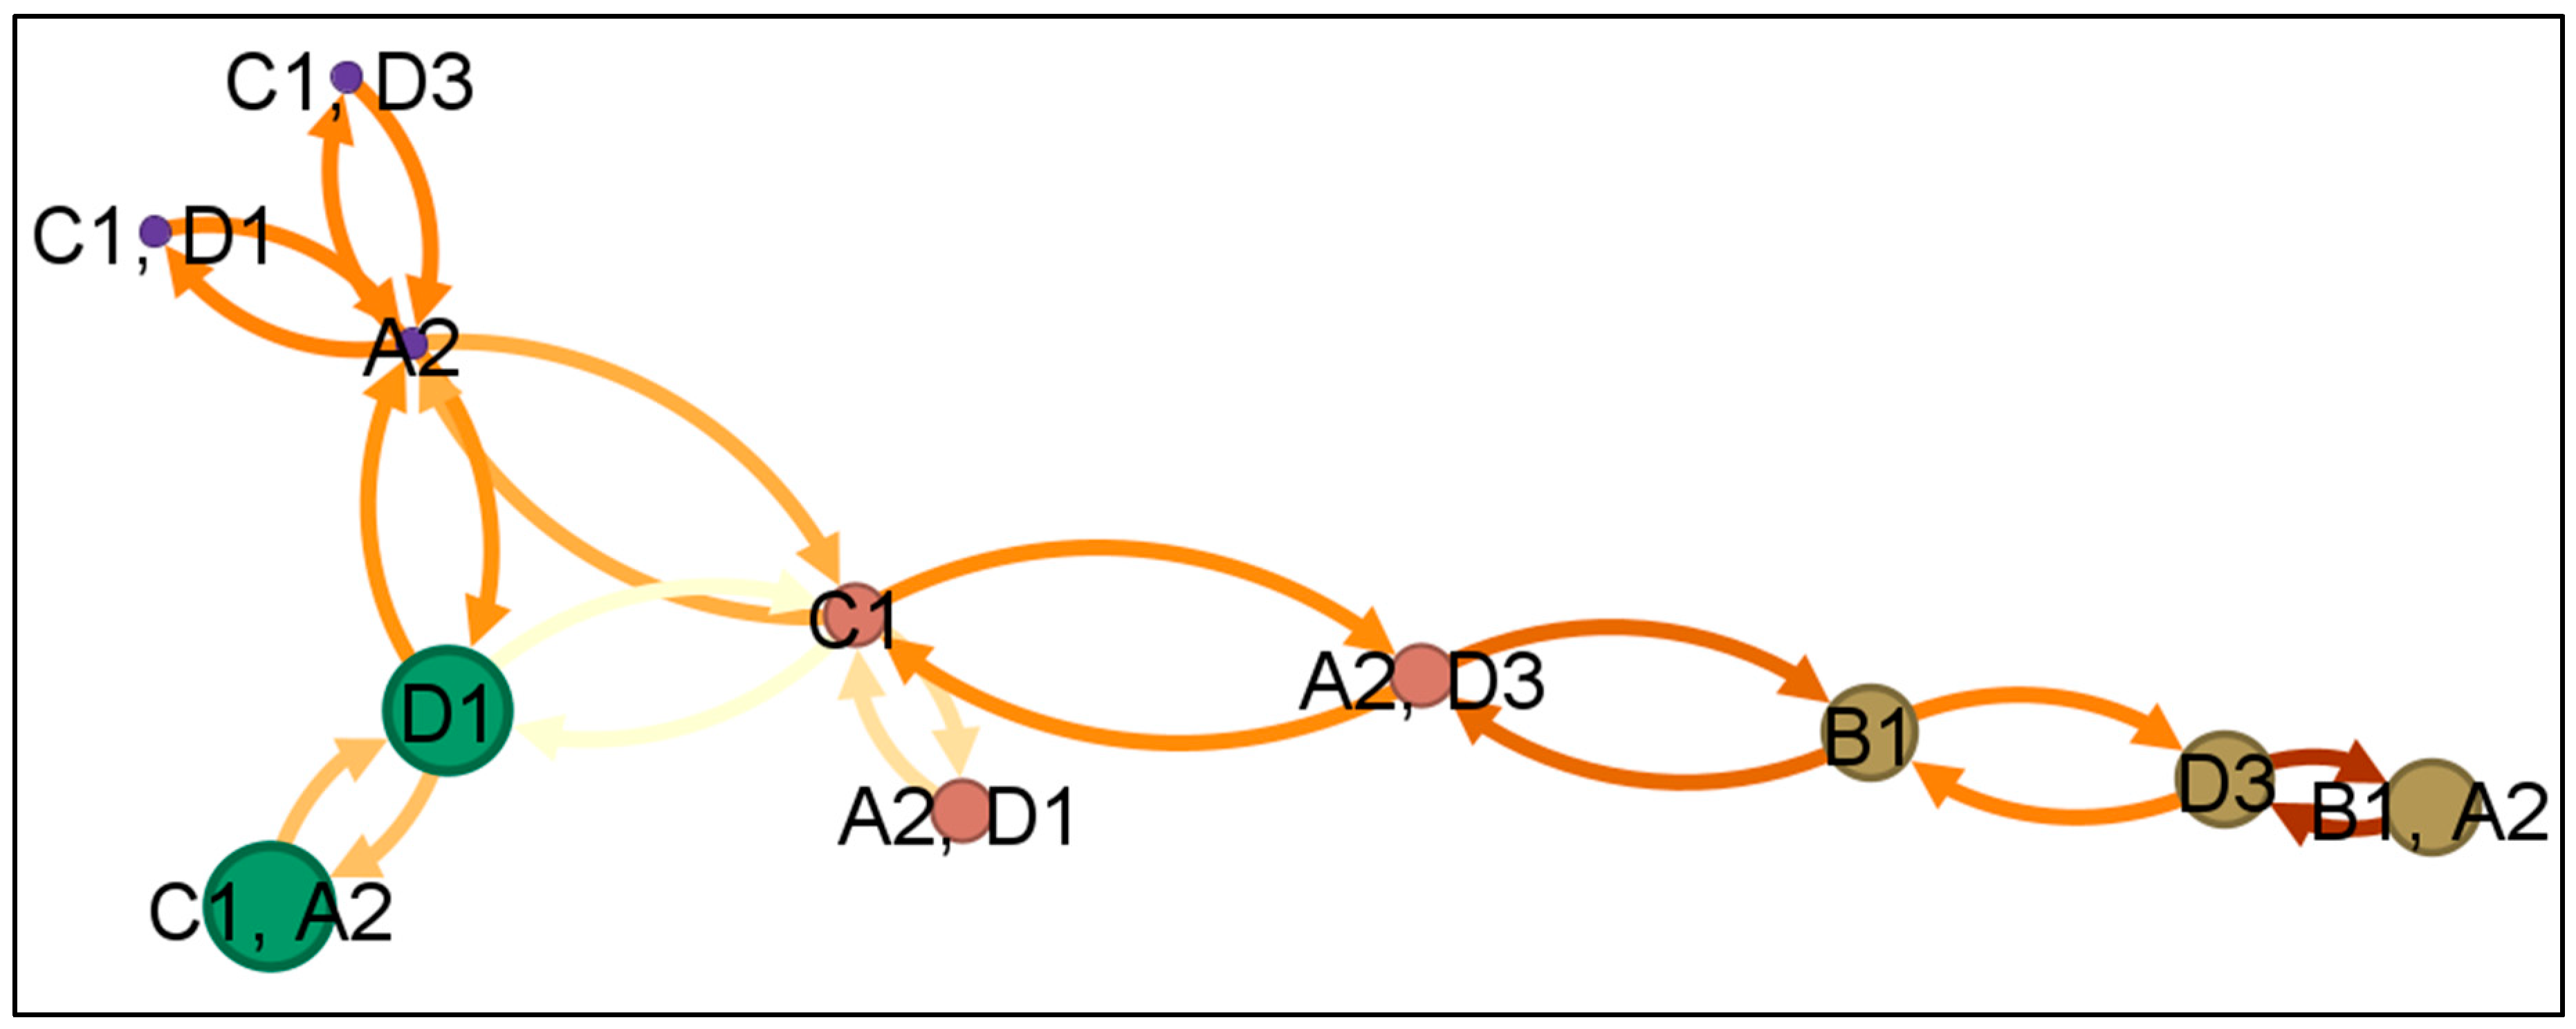
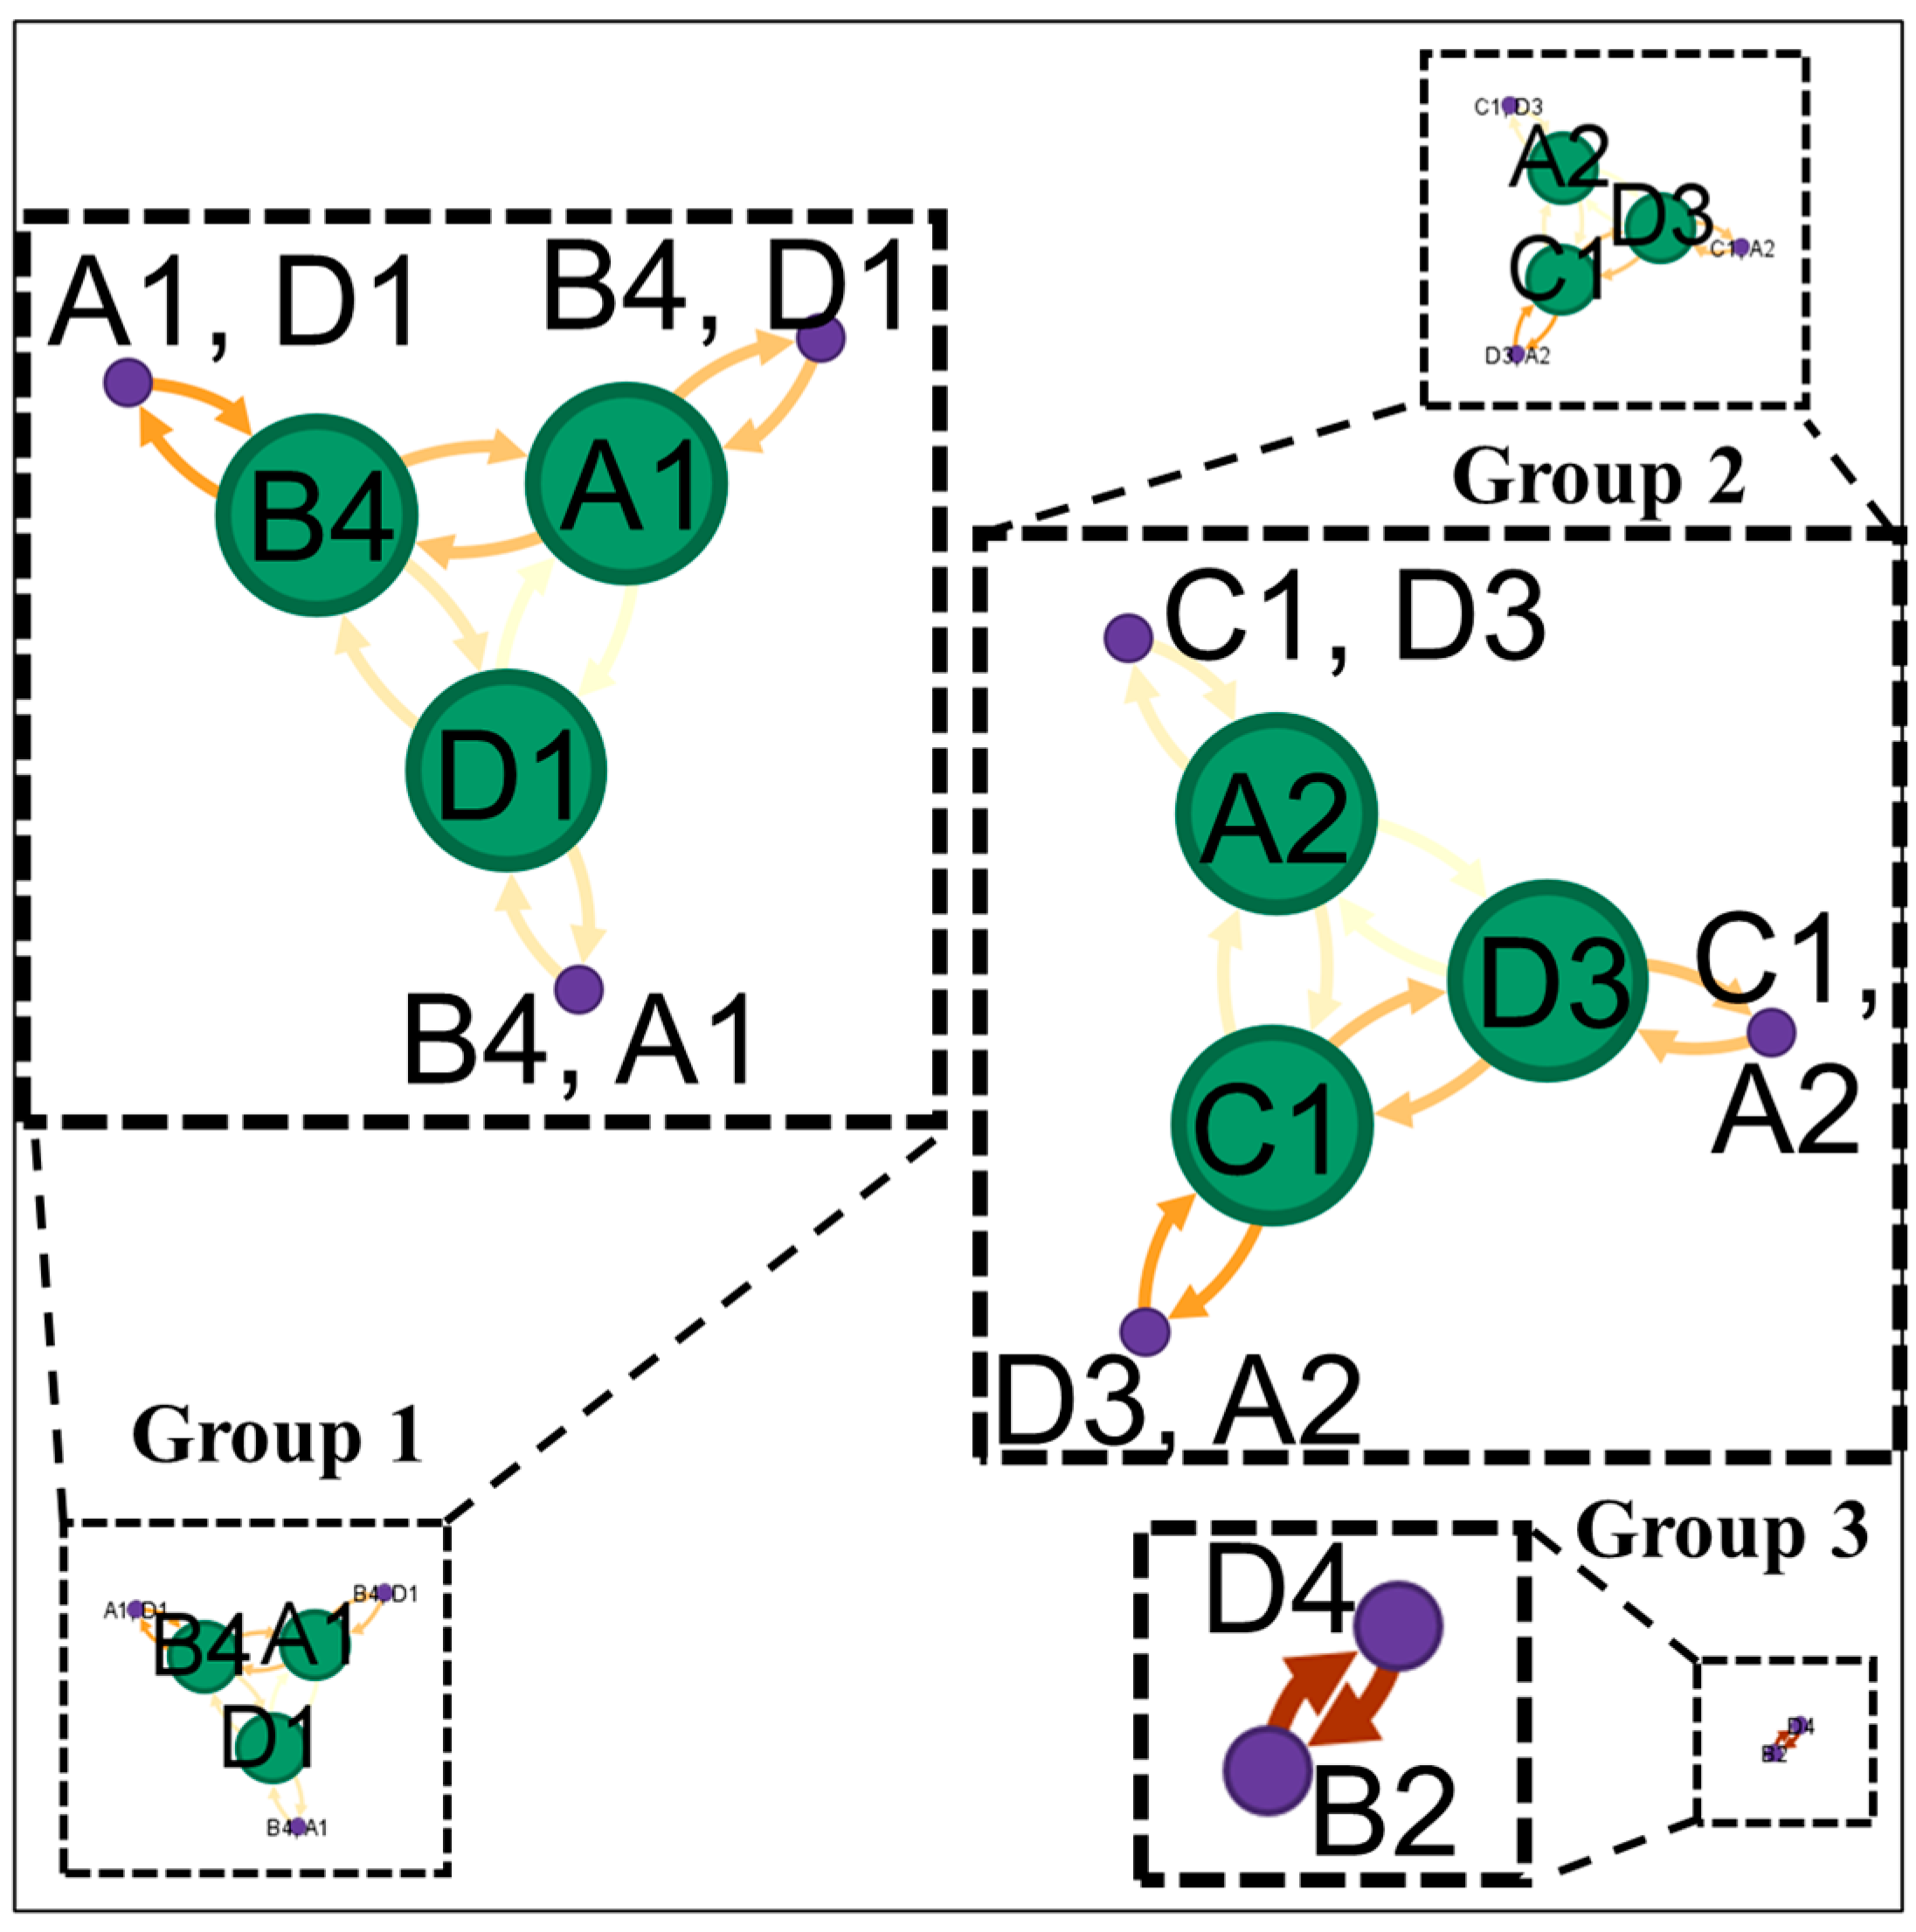
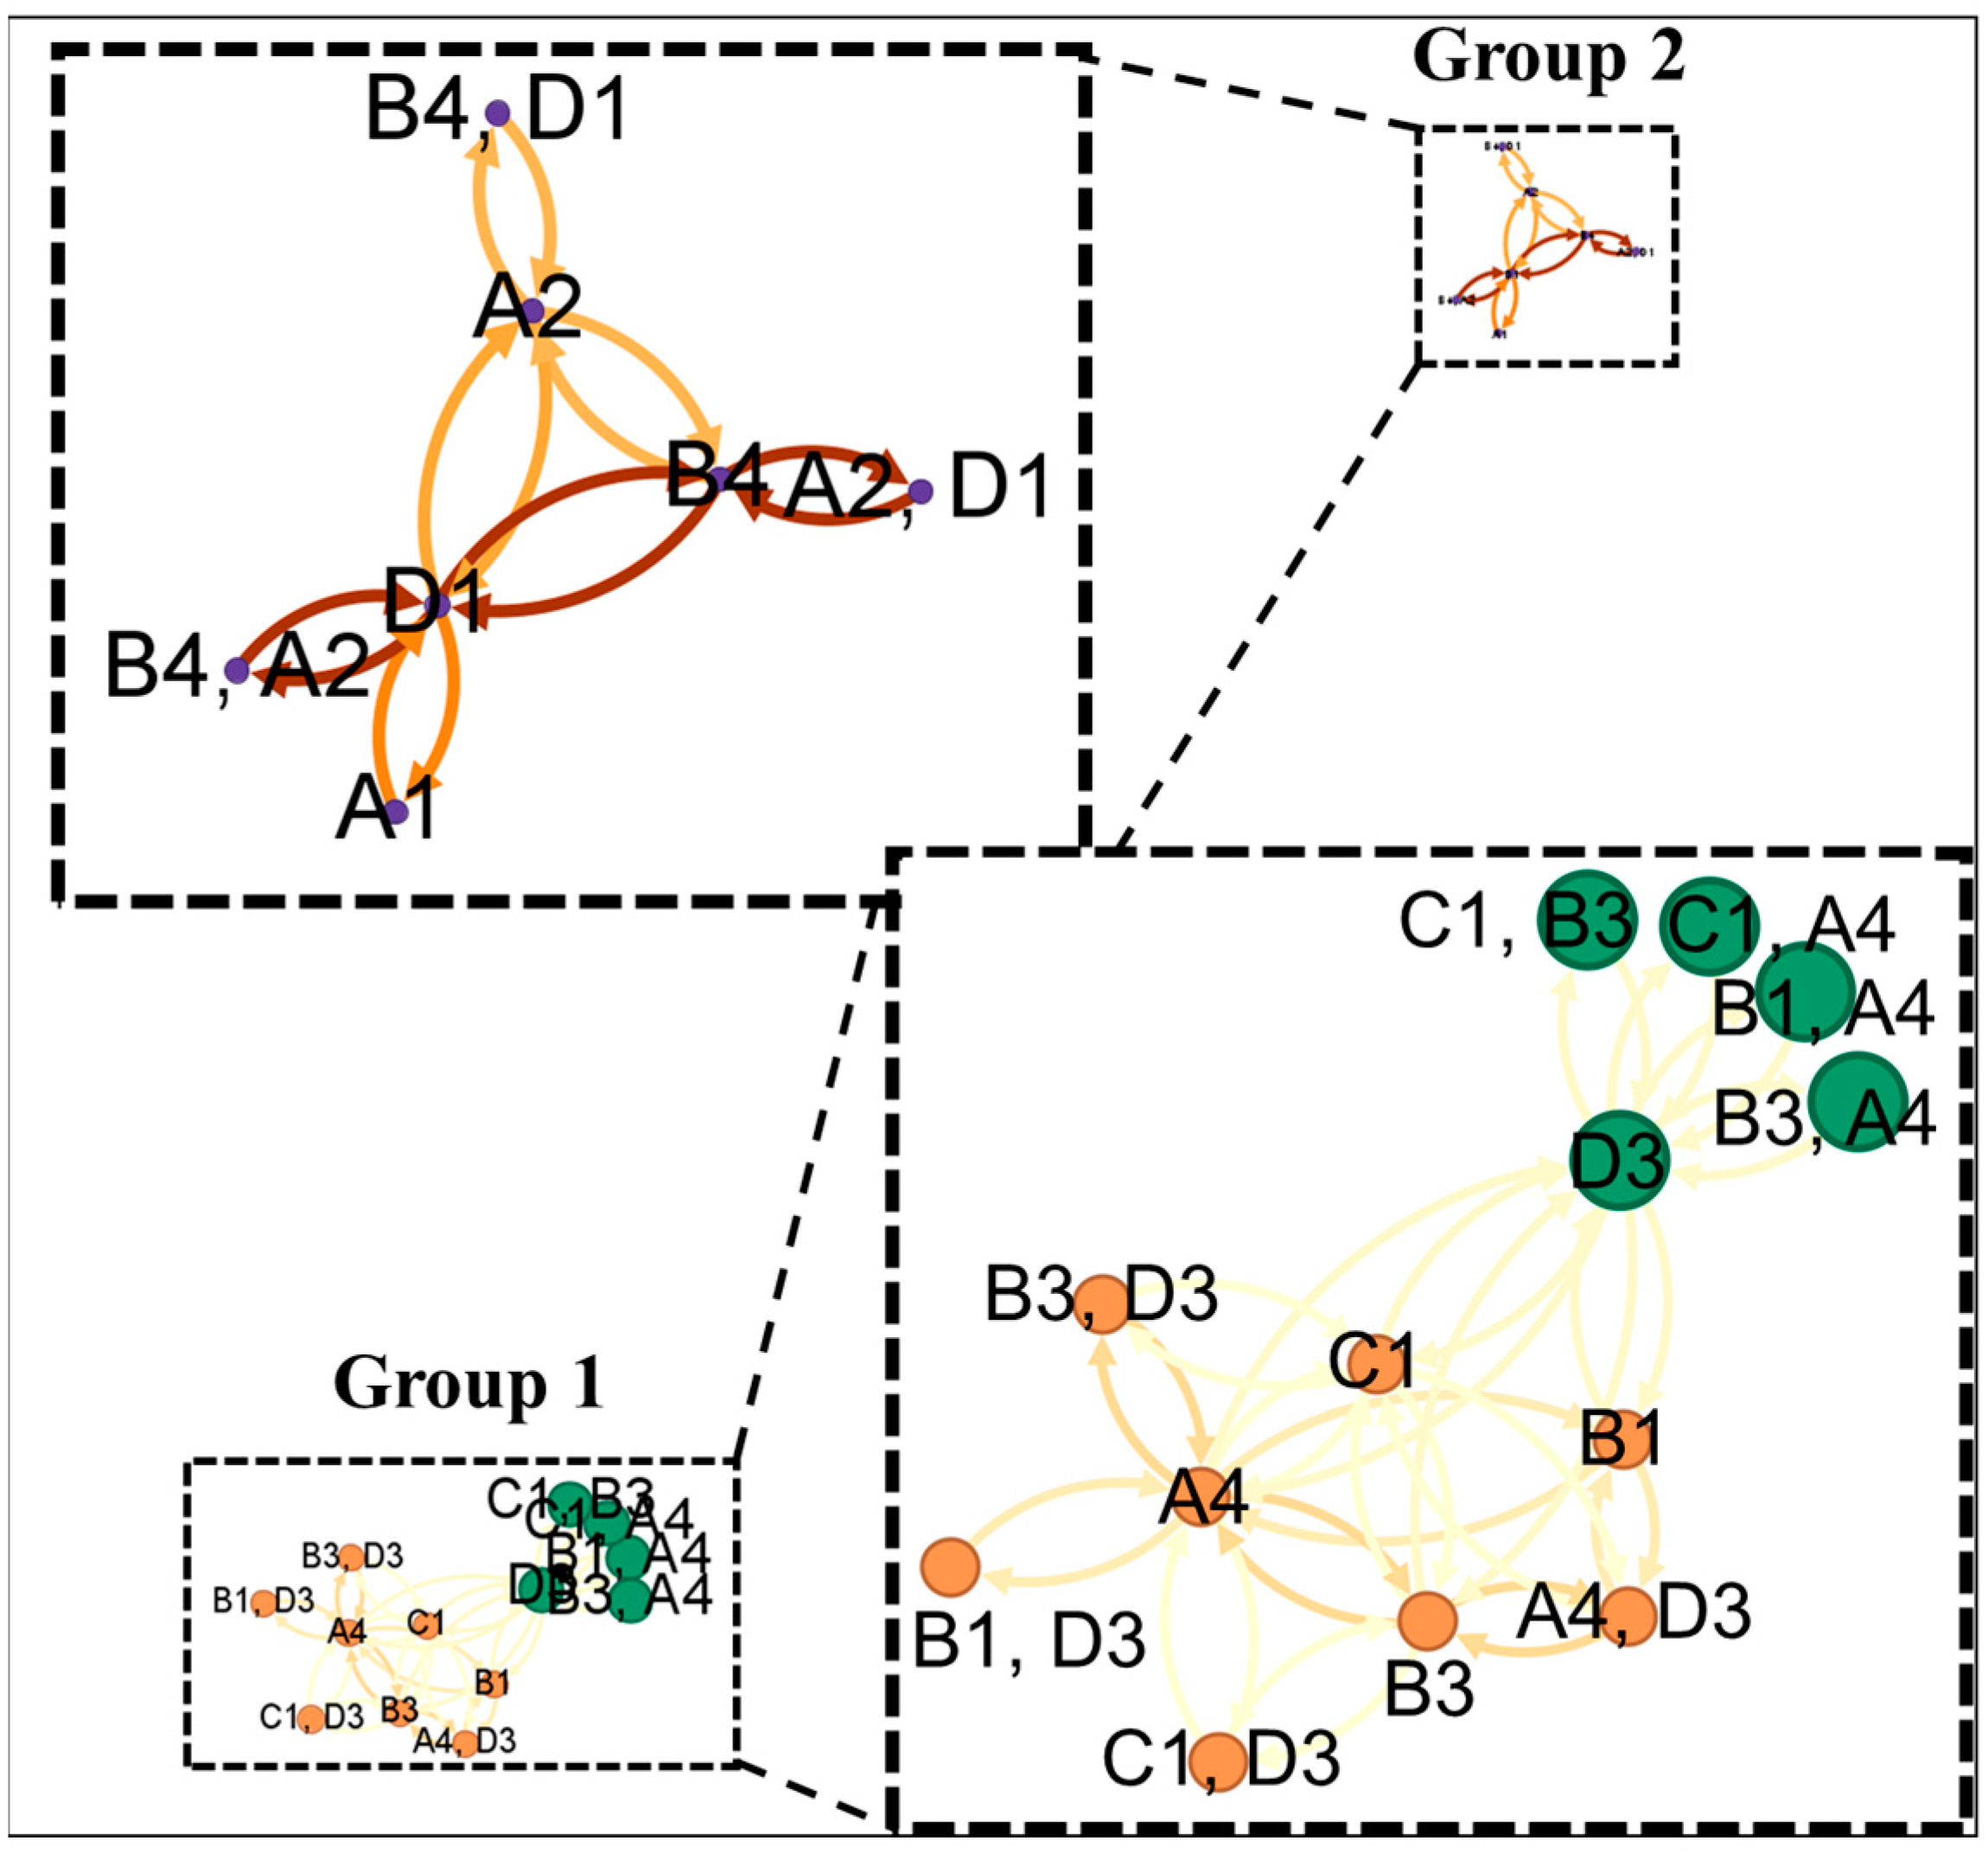
4.2. Accident Analysis by Type Using Association Rule Mining

We performed ARM analysis on the final 203 accident data points based on the procedure shown in Figure 3, and the association rules between the causes of each accident were analyzed according to the main accident types: “Falls”, “Struck-by”, “Hit by an object”, “Be crushed”, and “Caught-in/between”. The minimum support value and confidence were set to analyze the rules for various causes; the derived rules were sorted by the support value, except when the lift value was ≤1.
Table 6 presents the results of the ARM analysis for falling accidents. Four rules with a lift value of ≤1 were excluded from the 18 association rules. The analysis of the causes of “Falls” accidents revealed that a “Media (C)” event triggered a “Management (D)” event in ~49.51% of the data. The confidence in this case was 72.86%, indicating the high probability of a “D” event under the “C” condition. The lift was 1.03, indicating a positive correlation between “C” and “D”. As the lift value was >1, it was assumed to represent an association between the two events. Specifically, a “Poor workspace (C1)” corresponded to “C”, and a “Lack of safety management plan (D3)” corresponded to “D”, indicating that safety handrails and fall-protection nets, etc., must be installed to prevent fall accidents and that a safety management plan must be adequately prepared and implemented in advance. Additionally, the two-way confidence value indicated that the probability of a poor workplace increases when the safety management plan is insufficient; therefore, creating a safety management plan is critical. The next most frequent accident causes are “C” and “Man (A)”. Among them, the relationship between C1 and human error (A1) was analyzed, and the confidence of A1 and workplace defects was the highest at 0.83. This indicates the criticality of installing safety facilities in the workplace, as A1 (unattached safety hooks, openings) accounts for falls due to carelessness while moving, etc. The analyses of the following factors reveal that the falls due to A1 are causally related to the lack of a safety management plan. In the first ranking, we found that A1 occurs because of the lack of a safety management plan and low management level, such as the installation of safety facilities in the workplace. Thus, establishing and implementing the initial safety management plan represent the most critical factors. Rankings 4–6 confirmed that the three factors contributed the most to fall accidents, as derived from the analysis of the relationships between individual causes in Rankings 1–3. The seventh ranking corresponds to mechanical and administrative factors, and fall accidents occur because of structural defects caused by insufficient inspections of mechanical equipment, such as the fall of the tower crane master and the breakage of the moon scaffold rope, which are caused by insufficient work plans (including preinspection) for mechanical equipment in the safety management plan. Therefore, prework inspections must be strengthened.
When analyzing ARM results in a table, the association rules between two causes can be analyzed, although there would be some limitations in identifying the rules related to other factors. Therefore, we analyzed the interrelated rules between causes based on the accident types using a network graph. In this graph, each node was proportional to the size of its support and was colored green, orange, or purple. The edges were based on their lift values and were colored brown, orange, and yellow. Figure 7 shows the network graph of the ARM results for the fall incidents. The main causes of fall accidents were analyzed and categorized into one group, and the incidents can be analyzed as a combination of different causes. In particular, “D3” was linked to other major causes; therefore, a thorough safety management plan must be developed and implemented.
Table 7 presents the ARM results for the “Struck-by” accidents, excluding the six association rules with lift values of ≤1. The analysis of the causes of “Struck-by” accidents revealed that ~46.66% of the cases in the data involved a “D” factor occurring alongside an “A” factor. The confidence in this case was 87.5%, indicating the high probability of a “D” event occurring under “A”. The lift value was 1.19, indicating a positive correlation between “A” and “D”. “A” triggered “Improper work methods (A2)”, and “D” caused “D1”. Most “Struck-by” accidents occur between vehicle-based construction machinery (forklifts, cranes, dump trucks, etc.) and workers. In detail, these accidents are caused by blind spots owing to the lack of signals/guides and occur when working around vehicle-based construction equipment owing to D1. Therefore, signals must be posted, and supervisors must be assigned to prohibit work and access by unauthorized persons. Next, “A1” and a “Lack of training (D2)” were related to managerial factors. As a countermeasure, the proper qualifications of the drivers must be ascertained, and they must be pretrained in site features, as “Struck-by” accidents are caused by the inexperience and mistakes of vehicle-based construction equipment drivers.
Figure 8 shows the network graph of “Struck-by” accidents. As “Struck-by” accidents are categorized into two groups, the major cause per group must be managed.
Table 8 presents the ARM results for the “Be crushed” accidents, revealing that 14 of the 56 association rules exhibited lift values of ≥1. The analysis of the cause of “Be crushed” accidents revealed that “A” and “D” and “Machine (B)” and “A” were related. The specific factors included “Inadequate work information (A4)” and “D3;” moreover, accidents caused by these factors statistically accounted for 50% of the collected accident data. “Be crushed” accidents are often caused by the burying of workers by collapsing earth and falling materials, which are attributable to “A4” and “D3”, such as inadequate ground reinforcement, lack of soil-covering facilities, and inadequate material loading management. Additionally, inadequate safety measures for vehicle-based construction machinery (such as the installation of outriggers and checking of ground conditions) can cause the machine to tip over and crush; thus, it is necessary to establish a safety management plan. Next, “D3” and the “Lack of an intrinsic safety design (B3)” were analyzed, yielding a confidence value of 1, which means that the design was not properly considered in the safety management plan. As the type of accident corresponds to the collapse of the retaining wall and soil, the safety management measures through the safety review of the design must be reflected in the safety management plan and confirmed.
Figure 9 shows the network graph of “Be crushed” accidents. “Be crushed” accidents are divided into two groups, and each group is attributed to various causes. Group 1 was identified as the main factors that cause crush accidents, and as accidents are caused by the same relationships between two or more causes, the main causes must be eliminated through the management of the main factors.
Table 9 presents the ARM results for the “Hit by an object” accidents, revealing that 22 of the 32 association rules exhibited a lift value of ≥1. The analysis of the causes of “Hit by an object” accidents revealed the relationships between “A” and “D” and between “B” and “A”. Regarding the specific factors, “A2” and “D1” were confirmed as the most significant factors. Specifically, with “D1”, workers performed inappropriate tasks, which caused many accidents. This is because simultaneous up-and-down work is prohibited in principle, but after analyzing accident cases, we observed the lack of checks and measures. Furthermore, when transporting materials with vehicle-based construction machinery, it is necessary to check the binding of materials, prohibit lower work, set a danger radius, and prohibit access. Next, “Defects in the structure of mechanical equipment (B1)” and “D3” were highly related, and accidents occurred because of falling accessories or materials owing to the insufficient inspection of the ropes, hooks, etc., of vehicle-based construction equipment, which was found to be caused by insufficient safety checks in the safety management plan. Therefore, prework permits, etc., must be properly reviewed and implemented. Additionally, “C1” and “A2” exhibited high frequencies, and accidents occurred because of up-and-down work and the insufficient installation of falling-object-prevention nets. Therefore, this accident type can be prevented by supervising up-and-down work or installing falling-object-prevention nets. To prevent “Hit by an object” accidents, rules are important, and organizing the workspace is a necessary basic requirement.
Figure 10 shows the network graph of “Hit by object” accidents. These accidents were analyzed as one group where all causes are related. Therefore, the causes with the highest support values, i.e., “C1” and “A2”, can be controlled by supervision.
Table 10 presents the ARM results for the “Caught-in” accidents, revealing that 26 of the 28 association rules exhibited a lift value of ≥1. The main causes of these accidents were “A2”, “D3”, and “C1;” the highest support, confidence, and lift values were obtained by linking the three factors. Thus, “A2” can be due to “D3”, e.g., not placing the number of signals and not setting up prohibited access areas when working with vehicle-based construction machinery; moreover, these accidents are due to narrow workspaces. Next, “A1” and “Defective safety devices in case of emergency (B4)” were identified as the main factors, and the accidents occurred even when the priority was well managed, which highlights the low risk awareness of workers. However, even when workers barely recognize risks, emergency safety devices should be activated to prevent accidents; however, this accident type occurred because of the insufficient installation and disabling of emergency safety devices. Therefore, accidents must be prevented even with A1 by prohibiting workers from disengaging safety devices during an emergency.
Figure 11 shows the network graph of “Caught-in” accidents. These accidents can be classified into three main groups. Group 1 represents accidents caused by vehicle-based construction equipment owing to “D1” and “A1” from drivers; thus, such accidents can be prevented by placing signal lights. Group 2 refers to accidents that are mainly caused by “A2” owing to “C1; thus, it must be reflected in the safety management plan. Group 3 refers to an accident caused by “Defective protective devices (B2);” it can be managed by posting “Safety rules and signs (D4)” in the workplace.

4.3. Subconclusion

This study further identified associations between “Man”, “Machine”, “Media (Material, Environment)”, and “Management” factors by main accident types. Many causal factors, such as construction site environment, supervisory staffing, and inspections, are related to safety management planning and execution. Their importance has been emphasized in previous studies [37,38]. Based on the ARM and network graph analyses, we summarized the safety management directions for each major accident type. The implications of the ARM results and network analysis for “Falls” accidents are that “D3”, “C1”, and “A1” are highly related; thus, countermeasures should be implemented to reduce “A1” by securing the safety of the workspace through the establishment and implementation of a thorough safety management plan. Previous studies have indicated that the incorrect use of personal protective equipment (PPE) can increase the risk of accidents [39], focusing solely on worker error. However, in this study, we found that not wearing PPE was associated with managerial factors and poor workspaces. The main causes of “Struck-by” accidents are classified into two groups, namely “A2” due to “D1” and “A1” owing to “D2”. Therefore, such accidents can be prevented by placing signals or supervisors when using vehicle-based construction machinery, as well as checking the drivers’ qualifications. “Be crushed” accidents are categorized into two main groups. In the first group, the main causal factor of accidents is “C1”, owing to the failure to reflect the initial design and safety measures in the safety management plan. This means that “Be crushed” accidents due to earth collapse are greatly influenced by the working environment at the construction site [40]. In addition, complex geological conditions and bad weather can increase the probability of collapse [41]. In this study, other causes of these problems besides working environment conditions were identified: “Lack of an intrinsically safe design” during design and “Insufficient safety management plan” during construction, which leads to the unsafe behavior of workers. This suggests the need for subject-specific management. In the second group, similar accidents must be prevented by assigning supervisors. “Hit by an object” accidents are accidents caused by various interrelated factors in one group. In broad terms, a worker at the lower part of a lifting object could be hit by a falling object due to synchronous work. In detail, it refers to accidents caused by falling objects owing to “A” and “B”. Therefore, such accidents must be prevented by assigning supervisors, prohibiting simultaneous up-and-down work, and prohibiting access to the lower part of the lifting object. “Caught-in” accidents are categorized into three groups. Group 1 refers to accidents caused by vehicle-based construction machinery and can be prevented by measures such as establishing a no-access zone or an emergency stop device when workers approach. Group 2 includes accidents caused by working in a narrow workspace owing to insufficient safety management plans; it is necessary to identify and improve possible risk factors in advance through on-site checks. Group 3 refers to accidents caused by being pinched by an end, etc.; they can be prevented by installing covers over openings or posting safety rules.
Table 11 shows the relationships between the 4M factors by accident type. According to the summarized results, it was found that the 4M factors are different for each type of accident, suggesting that customized management is required. Therefore, it is necessary for the general contractor to go beyond safety management to include the attention and participation of the ordering organization, designer, and supervisor in safety management.

Improving the Role Framework of Various Actors for Accident Overviews

To reflect the importance of accident causal factors and their interrelationships, the ACM framework established through previous influence-path and importance analyses must be improved. The influence-path analysis was performed using the accident case analysis, and the importance analysis was performed using the ARM results.
Construction projects exhibit complex interinfluence relationships, and many key factors influence other factors to impact the safety performance of the project. The number of times the former and latter factors coexist determines the importance of the former, and the strength of the rule in which the former is located determines the importance of the latter. If the rule containing the outcome is valid and strong, the outcome would be a critical factor (Table 12). We improved the ACM framework using the results of the importance analysis (Figure 12).
The contractor must maintain the safety of the construction structure by determining the appropriate construction period and cost based on the relevant laws, although it may ignore safety management owing to the lack of safety management role and responsibility for workers. Therefore, it must meet with the CEO of the construction company and discuss construction procedures and methods. Designers must carefully decide on construction procedures and methods, such as the period and cost of installing safety facilities, and supervisors must thoroughly manage safety for on-site managers and workers, such as constructing stop orders and work permit systems, as they are in a position to detect risks first. The enhanced 2–4 model, incorporating insights from the 4M analysis, highlights the roles of the ordering organization, designer, supervisor, and general contractor. Moreover, in Korea, when a fatal accident occurs, experts in construction safety—including government officials, professors, and engineers (specializing in design, supervision, and construction)—undertake a comprehensive on-site investigation. This is to pinpoint the accident’s cause, develop safety measures, and document them in the CSI database. Table 13 displays the safety management strategies by subject and type of accident. The safety management measures for the five accident types are compiled by merging “recurrence prevention measures” and “future action plans” from the CSI-compiled accident data with the detailed categorization from the results of the 4Ms and ARM. It is significant that safety management has extended from the general contractor to the ordering organization in construction projects, promising to enhance accident prevention through coordinated safety management efforts.

5. Conclusions

In this study, we applied the 4M-based accident cause analysis to the ACM framework and analyzed the association between accident causes by accident types using ARM. Specifically, we collected reliable data on construction industry accidents managed by the government through web scraping and refined the influencing factors of the existing 2–4 model by analyzing the accident history and 4M classification. Next, based on the ARM accident cause analysis for each of the five main construction industry accident types, we analyzed the relationship between single and multiple causes through network graphs, deriving the dominant accident causes and safety management measures according to the accident type and group. Through a series of processes, we proposed an improved ACM framework based on the accident cause analysis and proposed safety management measures for each construction work subject. The results of our study are summarized as follows:
  • Although the previous studies performed generalized analysis with limited data on specific accidents, we used most of the recent data released by the government and conducted ARM analysis with a clear division of 4M.
  • We modified the 2–4 model to fit the Korean context and improved it by applying mathematical and statistical techniques to the treatment of the accident data.
  • The 4M classification and ARM analysis could quantitatively confirm the differences in the dominant causes of each type of accident and recommend safety management measures for each entity.
  • We established safety management measures for the general contractor, designer, and supervisor rather than simply focusing on the general contractor.
  • As construction accidents are not caused by problems attributable to a single entity, it is necessary to improve comprehensive safety management measures and processes based on the timing of various entities.

Author Contributions

Y.-G.Y. conceived and designed the experiments; Y.-G.Y. and T.K.O. performed the experiments and analyzed the data; C.R.A. and S.-G.Y. contributed to the formal analysis; Y.-G.Y. and T.K.O. wrote the manuscript. All authors have read and agreed to the published version of the manuscript.

Funding

This research was supported by the Basic Science Research Program through the National Research Foundation of Korea (NRF) funded by the Ministry of Education (No. 2021R1I1A2050912 and NRF-2022R1I1A1A01061658).

Institutional Review Board Statement

Not applicable.

Data Availability Statement

The datasets used and/or analyzed during the current study are available from the corresponding author on reasonable request.

Conflicts of Interest

The authors declare no conflicts of interest.

Nomenclature

ACMAccident causation model
AcciMapAccident risk management framework
ARMAssociation rule mining
CSIConstruction safety management integrated information
CPWRThe Center for Construction Research and Training
DCDirect cause
DLDeep learning
HFACSHuman factors analysis and classification system
ICIndirect cause
KOSHAKorea Occupational Safety and Health Agency
NLPNatural language processing
MLMachine learning
PPEPersonal protective equipment
RACRadical cause
ROCRoot cause
SCMSwiss cheese model
STAMPSystems theory accident modeling and process model
4MMaterial, Method, Machine, or Man

References

  1. Musarat, M.A.; Alaloul, W.S.; Irfan, M.; Sreenivasan, P.; Rabbani, M.B.A. Health and safety improvement through Industrial Revolution 4.0: Malaysian construction industry case. Sustainability 2023, 15, 201. [Google Scholar] [CrossRef]
  2. Davim, J.P. Engineering Education for Sustainability; River Publishers: Aalborg, Denmark, 2019; pp. 107–108. [Google Scholar]
  3. U.S. Bureau of Labor Statistics. 2011–2021 Census of Fatal Occupational Injuries; U.S. Bureau of Labor Statistics: Washington, DC, USA, 2022.
  4. Ministry of Employment and Labor. Annual Industrial Accident Statistics; MOEL: Sejong, Republic of Korea, 2022; pp. 1–653. [Google Scholar]
  5. Lee, U.-K.; Kim, J.-H.; Cho, H.; Kang, K.-I. Development of a mobile safety monitoring system for construction sites. Autom. Constr. 2009, 18, 258–264. [Google Scholar] [CrossRef]
  6. Kumar, C.N.A.; Sakthivel, M.; Elangovan, R.K.; Arularasu, M. Analysis of material handling safety in construction sites and countermeasures for effective enhancement. Sci. World J. 2015, 2015, 742084. [Google Scholar]
  7. Ho, C.-L.; Dzeng, R.-J. Construction safety training via e-learning: Learning effectiveness and user satisfaction. Comput. Educ. 2010, 55, 858–867. [Google Scholar] [CrossRef]
  8. Hosseinian, S.S.; Torghabeh, Z.J. Major theories of construction accident causation models: A literature review. Int. J. Adv. Eng. Techonol. 2012, 4, 53–66. [Google Scholar]
  9. Abdolhamidzadeh, B.; Hassan, C.R.C.; Hamid, M.D.; FarrokhMehr, S.; Badri, N.; Rashtchian, D. Anatomy of a domino accident: Roots, triggers and lessons learnt. Process Saf. Environ. Prot. 2012, 90, 424–429. [Google Scholar] [CrossRef]
  10. Greenwood, M.; Woods, H.M. The Incidence of Industrial Accidents upon Individuals with Specific Reference to Multiple Accidents; Report No. 4; Industrial Fatigue Research Board: London, UK, 1919. [Google Scholar]
  11. Heinrich, H.W.; Petersen, D.; Roos, N.R. Industrial Accident Prevention: A Safety Management Approach, 5th ed.; McGraw-Hill Companies: New York, NY, USA, 1980. [Google Scholar]
  12. Bird, F.E.J.; Germain, G.L. Practical Loss Control Leadership; International Loss Control Institute: Loganville, GA, USA, 1985. [Google Scholar]
  13. Rasmussen, J. Risk management in a dynamic society: A modelling problem. Saf. Sci. 1997, 27, 183–213. [Google Scholar] [CrossRef]
  14. Reason, J. Human Error; Cambridge University Press: Cambridge, UK, 1990. [Google Scholar]
  15. Wiegmann, D.A.; Shappell, S.A. A Human Error Approach to Aviation Accident Analysis—The Human Factors Analysis and Classification System; Ashgate Publishing: Burlington, NJ, USA, 2003. [Google Scholar]
  16. Leveson, N.G. A new accident model for engineering safer systems. Saf. Sci. 2004, 42, 237–270. [Google Scholar] [CrossRef]
  17. Salmon, P.M.; Cornelissen, M.; Trotter, M.J. Systems-based accident analysis methods: A comparison of Accimap, HFACS, and STAMP. Saf. Sci. 2012, 50, 1158–1170. [Google Scholar] [CrossRef]
  18. Pinto, A.; Nunes, I.L.; Ribeiro, R.A. Occupational risk assessment in construction industry—Overview and reflection. Saf. Sci. 2011, 49, 616–624. [Google Scholar] [CrossRef]
  19. Lingard, H. Occupational health and safety in the construction industry. Constr. Manag. Econ. 2013, 31, 505–514. [Google Scholar] [CrossRef]
  20. Hale, A.R.; Walker, D.; Walters, N.; Bolt, H. Developing the understanding of underlying causes of construction fatal accidents. Saf. Sci. 2012, 50, 2020–2027. [Google Scholar] [CrossRef]
  21. Khosravi, Y.; Asilian-Mahabadi, H.; Hajizadeh, E.; Hassanzadeh-Rangi, N.; Bastani, H.; Behzadan, A.H. Factors influencing unsafe behaviors and accidents on construction sites: A review. Int. J. Occup. Saf. Ergon. 2014, 20, 111–125. [Google Scholar] [CrossRef]
  22. Tong, R.; Zhao, H.; Zhang, N.; Li, H.; Wang, X.; Yang, H. Modified accident causation model for highway construction accidents (ACM-HC). Eng. Constr. Archit. Manag. 2021, 28, 2592–2609. [Google Scholar] [CrossRef]
  23. Li, J.; Wu, C. Deep Learning and Text Mining: Classifying and Extracting Key Information from Construction Accident Narratives. Appl. Sci. 2023, 13, 10599. [Google Scholar] [CrossRef]
  24. Awolusi, I.; Marks, E.; Hainen, A.; Alzarrad, A. Incident Analysis and Prediction of Safety Performance on Construction Sites. Civil Eng. 2022, 3, 669–686. [Google Scholar] [CrossRef]
  25. Chellappa, V. Fatal fall incidents in the Indian construction industry: A case study analysis. Proc. Inst. Civ. Eng.—Forensic Eng. 2022, 175, 87–92. [Google Scholar] [CrossRef]
  26. Korea Occupational Safety and Health Agency (KOSHA). KOSHA Guide G-83: Guidelines for Recording and Classifying Industrial Accidents; KOSHA: Incheon, Republic of Korea, 2016; Volume 2016. [Google Scholar]
  27. Korea Occupational Safety and Health Agency (KOSHA). Construction Industry Voluntary Risk Assessment Guidelines; KOSHA: Incheon, Republic of Korea, 2018. [Google Scholar]
  28. Lee, J.; Lim, M. Analysis on the degree of risk according to the causes of accidents in construction projects in Korea. Int. J. Appl. Eng. Res. 2017, 12, 2821–2831. [Google Scholar]
  29. Cho, J.-H. A Study on the Safety Awareness and Safety Education of Construction Workers and the Causal Effect of Industrial Accident. Ph.D. Dissertation, Department of Engineering, Dongguk University, Seoul, Republic of Korea, 2009. [Google Scholar]
  30. Jeong, K.-H. A Study on the Improvement of Safety and Health Education System in Small and Medium-Sized Construction Sites. Doctoral Dissertation, Department of Engineering, Kyunggi University, Suwon, Republic of Korea, 2016. [Google Scholar]
  31. Kang, Y.-T. A Study on the Establishment of a Fall Hazardous Site Calculation System for the Prevention of Fall Accidents. Doctoral Dissertation, Department of Engineering, Myongji University, Seoul, Republic of Korea, 2005. [Google Scholar]
  32. Chen, Z.; Cai, S.; Song, Q.; Zhu, C. An improved apriori algorithm based on pruning optimization and transaction reduction. In Proceedings of the 2nd International Conference on Artificial Intelligence, Management Science and Electronic Commerce (AIMSEC), Zhengzhou, China, 8–10 August 2011; Volume 2011, pp. 1908–1911. [Google Scholar] [CrossRef]
  33. Wu, Y.; Fu, G.; Wu, Z.; Wang, Y.; Xie, X.; Han, M.; Lyu, Q. A popular systemic accident model in China: Theory and applications of 24Model. Saf. Sci. 2023, 159, 106013. [Google Scholar] [CrossRef]
  34. Fu, G.; Yang, C.; Yan, W.; Dong, J. Extended version of behavior-based accident causation “2–4” model. J. China Coal Soc. 2014, 39, 994–999. [Google Scholar]
  35. Li, M.; Zhai, H.; Zhang, J.; Meng, X. Research on the relationship between safety leadership, safety attitude and safety citizenship behavior of railway employees. Int. J. Environ. Res. Public Health 2020, 17, 1864. [Google Scholar] [CrossRef] [PubMed]
  36. Simanjuntak, R.S.; Ginting, C.N.; Nasution, A.N. Factors related to unsafe behaviour among construction workers: An update literature review. J. Aisyah 2023, 8, 2039. [Google Scholar] [CrossRef]
  37. Soeiro, A. The importance of design in the prevention of accidents in construction. In The Pre-Fabrication of Building Facades; Springer: Berlin/Heidelberg, Germany, 2017; pp. 33–35. [Google Scholar] [CrossRef]
  38. Shao, L.; Guo, S.; Dong, Y.; Niu, H.; Zang, P. Cause analysis of construction collapse accidents using association rule mining. Eng. Constr. Architect. Manag. 2023, 30, 4120–4142. [Google Scholar] [CrossRef]
  39. Wong, T.K.M.; Man, S.S.; Chan, A.H.S. Critical factors for the use or non-use of personal protective equipment amongst construction workers. Saf. Sci. 2020, 126, 104663. [Google Scholar] [CrossRef]
  40. Gharaie, E.; Lingard, H.; Cooke, T. Causes of fatal accidents involving cranes in the Australian construction industry. Constr. Econ. Build. 2015, 15, 1–12. [Google Scholar] [CrossRef]
  41. Gaosheng, Y.; Xiuyun, L. Importance evaluation of construction collapse influencing factors based on grey correlation analysis. In Proceedings of the 2012 International Conference on Information Management, Innovation Management and Industrial Engineering, Sanya, China, 20–21 October 2012; IEEE: Piscataway, NJ, USA, 2012; Volume 3, pp. 436–441. [Google Scholar] [CrossRef]
Figure 1. Fatal injuries in construction from 2011 to 2021 [1].
Buildings 14 00998 g001
Figure 2. Fatalities in Korea based on the top five accident types (2018–2022).
Buildings 14 00998 g002
Figure 3. ARM analysis procedure using the Apriori algorithm.
Buildings 14 00998 g003
Figure 4. ACM building process.
Buildings 14 00998 g004
Figure 5. Construction accident in a 2–4 model.
Buildings 14 00998 g005
Figure 6. Data collection and analysis.
Buildings 14 00998 g006
Figure 7. Network graph of the ARM results for the 4M classification of “Falls” accidents.
Buildings 14 00998 g007
Figure 8. Network graph of the ARM results in the 4M classification of “Struck-by” accidents.
Buildings 14 00998 g008
Figure 9. Network graph of the ARM results for the 4M classification of “Be crushed” accidents.
Buildings 14 00998 g009
Figure 10. Network graph of the ARM results for the 4M classification of “Hit by an object” accidents.
Buildings 14 00998 g010
Figure 11. Network graph of the ARM results for the 4M classification of “Caught-in” accidents.
Buildings 14 00998 g011
Figure 12. Improved ACM framework with accident cause analysis.
Buildings 14 00998 g012
Table 1. Major accident types and their definitions.
Disaster TypeDefinition
FallA person falls from an elevated point, such as a building, structure, temporary structure, tree, or ladder, under the influence of gravity.
Struck-byA victim is struck or bumped by an object because of the victim’s motion, or the object is struck or bumped by the victim’s motion without the dislodgement of the object from its fastening.
Hit by an objectWhen an object that is fixed to a structure, machine, etc., deviates from its fixation under gravity, centrifugal force, inertial force, etc., or when a material is ejected from a piece of equipment, etc., and strikes a person.
Be crushedWhen a leaning or standing object falls and crushes a person.
Caught-in/between
(pinching)
It is caused by the movement of two objects and refers to the case of being pinched between linearly moving objects, pinched between rotating parts and fixed objects, bitten between rotating objects (such as rollers), or wrapped around the circumference of rotating objects.
Table 2. Characteristics and safety measures for the major accident types.
TypesCharacteristicsSafety Measures
Fall
-
Small sites, no or poorly written safety management plans, and lack of worker awareness;
-
Lack of safety facilities (no safety railings, fall-protection nets) and no protective equipment, such as harnesses;
-
Many cases of workers falling from heights while doing their jobs quickly, with no on-site supervisor and safety facilities.
Safety management plans, safety facilities, protective equipment, worker awareness
Struck-by
-
Collisions with equipment, such as dump trucks, that move rapidly or barely see blind spots;
-
Collisions with equipment;
-
Accidents usually occurring in areas with no signaling, guides, or safety fencing;
-
Work zones and worker paths not being marked.
Signaling/guidance, safety fence, absence of supervisors
Hit by an object
-
Falling tools, bricks, and other materials when working at heights;
-
Workers injured when materials fall owing to insufficient ropes, breaks, or overturned equipment when moving materials with cranes, etc.
Prohibition of simultaneous work up-and-down, fall-protection net, rope and line check, work plan for handling heavy materials
Be crushed
-
Workers crushed by falling accidents caused by the insufficient installation of outriggers for mobile cranes, mobile workbenches, vehicle-type aerial work platforms, etc., and inadequate ground reinforcement;
-
Workers crushed by falling heavy temporary structures, materials, etc.
Outriggers, ground reinforcement, work plan
Caught-in/between
-
Accidents caused by the rotation of booms, such as backhoes, moving forklift trucks, and pinching of workers by pillars, walls, etc.;
-
Accidents where a person’s body is sucked into equipment or machinery
Signalman/director, safety fence, supervisor, work plan
Table 3. Taxonomy items of 4M and their contents.
4M DivisionDetailsContentsAbbreviation
ManHuman errorNot wearing a safety gear, etc.AA1
Improper work methodsNot following the work orderA2
Working posture and movementsUnreasonable behaviorA3
Inadequate work informationInformation about the task is different from what is obtainableA4
Unsafe behaviorSudden actionA5
MachineDefects in the structure of the mechanical equipmentDefects in machinery equipment (rope breakage, missing parts, broken boom, etc.)BB1
Defective protective equipmentSafety facilities are not installedB2
Lack of an intrinsically safe designInsufficient structural review (ground, etc.)B3
Safety-device defects in case of an emergencyFailure to install/malfunction of safety devices in vehicle-construction equipmentB4
Vehicle defectDefective truck lightsB5
Utility faultFire due to a defect, etc.B6
Media
(Material, Environment)
Poor workspaceFailure to install safety facilities, Failure to take action on openings, insufficient organization, insufficient soil clearance, etc.CC1
Generation of gas, steam, dust, etc.Machinery explosionC2
ManagementLack of supervision and guidanceNo supervisor assigned for high-risk tasks, salvage work, etc.DD1
Lack of education and trainingPoor driving, poor expertise, etc.D2
Insufficient safety management planNot reflected in plan, nonimplemented, etc.D3
Safety rules and signs not postedOpening rules/no signs posted, etc.D4
Table 4. Number of fatality data collected from CSI based on accident type.
TotalFallStruck-ByHit by an ObjectBe CrushedCaught-In/betweenTrippedCut LightCollapseFireOther
95844233961544574Material Causes177
Table 5. Final dataset organization by the fatality type.
TotalFallStruck-ByHit by an ObjectBe CrushedCaught-In/between
20310330302515
Table 6. ARM results for fall accidents.
4M ClassificationDetailsResults
AntecedencesConsequencesAntecedencesConsequencesSupportConfidenceLift
{C}{D}{C1}{D3}0.4950.7291.028
{D}{C}{D3}{C1}0.4950.6991.028
{C}{A}{C1}{A1}0.4760.7001.222
{A}{C}{A1}{C1}0.4760.8311.222
{A}{D}{A1}{D3}0.4370.7631.076
{D}{A}{D3}{A1}0.4370.6161.076
{C}, {D}{A}{C1}, {D3}{A1}0.3590.7251.267
{A}{C}, {D}{A1}{C1}, {D3}0.3590.6271.267
{A}, {D}{C}{A1}, {D3}{C1}0.3590.8221.210
{C}{A}, {D}{C1}{A1}, {D3}0.3590.5291.210
{C}, {A}{D}{C1}, {A1}{D3}0.3590.7551.065
{D}{C}, {A}{D3}{C1}, {A1}0.3590.5071.065
{B}{D}{B1}{D3}0.1071.0001.411
{D}{B}{D3}{B1}0.1070.1511.411
Table 7. ARM results for “Struck-by” accidents.
4M ClassificationDetailsResults
AntecedencesConsequencesAntecedencesConsequencesSupportConfidenceLift
{A}{D}{A2}{D1}0.4670.8751.193
{D}{A}{D1}{A2}0.4670.6361.193
{D}{A}{D2}{A1}0.1000.7501.875
{A}{D}{A1}{D2}0.1000.2501.875
Table 8. ARM results for “Be crushed” accidents.
4M ClassificationDetailsResults
AntecedencesConsequencesAntecedencesConsequencesSupportConfidenceLift
{A}{D}{A4}{D3}0.5001.0001.429
{D}{A}{D3}{A4}0.5000.7141.429
{B}{D}{B3}{D3}0.3331.0001.429
{D}{B}{D3}{B3}0.3330.4761.429
{C}{D}{C1}{D3}0.3001.0001.429
{D}{C}{D3}{C1}0.3000.4291.429
{A}{B}{A4}{B3}0.2670.5331.600
{B}{A}{B3}{A4}0.2670.8001.600
{A}, {D}{B}{A4}, {D3}{B3}0.2670.5331.600
{B}, {D}{A}{B3}, {D3}{A4}0.2670.8001.600
{A}{B}, {D}{A4}{B3}, {D3}0.2670.5331.600
{B}{A}, {D}{B3}{A4}, {D3}0.2670.8001.600
{A}, {B}{D}{A4}, {B3}{D3}0.2671.0001.429
{D}{A}, {B}{D3}{A4}, {B3}0.2670.3811.429
Table 9. ARM results for “Hit by an object” accidents.
4M ClassificationDetailsResults
AntecedencesConsequencesAntecedencesConsequencesSupportConfidenceLift
{A}{D}{A2}{D1}0.2800.5381.346
{D}{A}{D1}{A2}0.2800.7001.346
{B}{D}{B1}{D3}0.2400.7501.442
{D}{B}{D3}{B1}0.2400.4621.442
{C}{A}{C1}{A2}0.2400.6671.282
{A}{C}{A2}{C1}0.2400.4621.282
{C}{D}{C1}{D1}0.1600.4441.111
{D}{C}{D1}{C1}0.1600.4001.111
Table 10. ARM results for “Caught-in” accidents.
4M ClassificationDetailsResults
AntecedencesConsequencesAntecedencesConsequencesSupportConfidenceLift
{A}, {D}{C}{A2}, {D3}{C1}0.3331.0003.000
{C}{A}, {D}{C1}{A2}, {D3}0.3331.0003.000
{A}{B}{A1}{B4}0.3330.8332.500
{B}{A}{B4}{A1}0.3331.0002.500
{C}{D}{C1}{D3}0.3331.0002.500
{D}{C}{D3}{C1}0.3330.8332.500
{C}, {A}{D}{C1}, {A2}{D3}0.3331.0002.500
{D}{C}, {A}{D3}{C1}, {A2}0.3330.8332.500
{C}{A}{C1}{A2}0.3331.0001.875
{A}{C}{A2}{C1}0.3330.6251.875
{C}, {D}{A}{D3}{A2}0.3331.0001.875
{A}{C}, {D}{A2}{C1}, {D3}0.3330.6251.875
{A}{D}{A2}{D3}0.3330.6251.563
Table 11. Relationship of key 4M factors by accident type derived from ARM analysis.
Accident TypesKey 4M Factors
ManMachineMediaManagement
FallHuman error-Poor workspaceInsufficient safety management plan
Struck-byImproper work methods--Lack of supervision and guidance
Hit by an objectImproper work methods-Poor workspaceLack of supervision and guidance
Be crushedUnsafe behaviorLack of an intrinsically safe designPoor workspaceInsufficient safety management plan
Caught-in/betweenHuman errorSafety-device defects in case of an emergency-Lack of supervision and guidance
Table 12. Impact factors of the improved ACM framework by subject.
FactorsInfluencing Factors
x1Individual factors of the general contractor CEO determine the overall attitude toward safety management.
x2The general contractor CEO can provide defective materials and dangerous working conditions if they ignore safety management.
y1The ordering organization must organize meetings with general contractors to emphasize the importance of safety and invest in it.
y2The ordering organization must be involved in construction procedures to reinforce safety accountability.
z1Designers must actively incorporate safety and quality into the planning and design phases of construction.
z2Supervisors must ensure that construction proceeds safely and according to the design, ensuring that hazardous work is strictly controlled.
Table 13. Presentation of the safety management measures by various actors for the major accident types.
TypesOrdering OrganizationDesignerGeneral ContractorSupervisor
Fall
-
Provide adequate construction duration and cost
-
Increase safety management costs
-
Planning to minimize aerial work
-
Reflect safety facility installation period and cost in design
-
Design to minimize aerial work
-
Changing construction methods, such as mounting after factory production
-
Thoroughly prepare a safety management plan
-
Direct the installation of safety facilities
-
Exclusion of work in case of violation of worker safety obligations
-
Thoroughly review the safety management plan
-
Inspect safety facilities
-
Expand the right-to-return stop work orders
-
Work permit system
Struck-by
-
Increased safety management fee
-
Reflected in the design of safety facilities
-
Reflected in the design of movement aisles, etc., considering the work environment
-
Installation of a no-access-zone fence
-
Installation of facilities to separate work and travel zones
-
Arrangement of traffic signals/supervisors
-
Check the safety management plan
-
Confirmation of prohibited areas and transportation corridors
-
Check the deployment of monitoring personnel
Hit by an object
-
Increased safety management Fee
-
Design to substantially avoid openings
-
Incorporate fall-protection netting into the design
-
Close all openings and gaps
-
Install falling-object-protection nets
-
Prohibit simultaneous up-and-down works
-
Organize portable tools, etc.
-
Check site organization
-
Check the installation of safety facilities
-
Enforce the principle of prohibiting up-and-down works
Be crushed
-
Increasing the budget for design changes due to different ground conditions
-
Check the ground conditions yourself
-
Thoroughly design earthen facilities
-
Review structural design safety
-
Redesign if site conditions change
-
Conduct construction considering the ground conditions
-
Prevent knots or falling when placing materials
-
Request design changes in case of problems during construction
-
Review the site for conformity with the plans
-
Check safety measures at the material loading dock
-
Actively pursue design changes
Caught-in/between
-
Setting the standard for construction equipment with e-Stop
-
Designing the working radius of construction machinery
-
Check safety features when introducing vehicle-based construction equipment
-
Conduct driver qualification tests
-
Placement of traffic signals
-
Install no-access-zone fences
-
Review vehicle-based construction equipment capabilities and operator competency
-
Verify the placement of traffic signals
-
Verify fence installation
Disclaimer/Publisher’s Note: The statements, opinions and data contained in all publications are solely those of the individual author(s) and contributor(s) and not of MDPI and/or the editor(s). MDPI and/or the editor(s) disclaim responsibility for any injury to people or property resulting from any ideas, methods, instructions or products referred to in the content.

