Abstract
To investigate the impact of various compartment partition plate connection methods within a shield utility tunnel on the mechanics behavior of the connecting nodes and the overall structural integrity, this study examines and simulates three distinct connection approaches in a laboratory. These approaches include a steel corbel and rear expansion anchor bolt connection, an embedded part and steel corbel welding connection, and a reinforced concrete corbel connection. The objective in selecting the above three connection methods was to gain insights into how they influence the mechanical properties of the connections and the tunnel structure itself. The failure criteria of the structure dictate that neither the steel bar nor the steel plate should exceed their respective yield strength. Furthermore, the concrete damage zone surrounding the anchor should not exhibit any connectivity. The findings of our study indicate that: (1) The weak link in the steel truss-rear expansion anchor bolt connection scheme is centered within the connection section. With six rear expansion anchor bolts, the load capacity reached 180 kN. Conversely, when employing nine rear expansion anchor bolts, the reduced spacing between the bolts led to premature concrete breakage, decreasing the bearing capacity to 170 kN. (2) Arranging the six anchor bolts into two rows and three columns enhanced the load-bearing capacity, yet one must be cautious to prevent damage from incorrect bolt spacing. According to the conditions outlined in this study, the ideal bolt spacing fell within the range from 66.7 mm to 100 mm. Additionally, it is worth noting that the bolt deformation was concentrated within 5 cm and 6 cm around the bolt. (3) The connection scheme of the embedded part and steel corbel demonstrated impressive load-bearing capabilities, showing the ability to withstand a load of 220 kN within the elastic stage. Notably, the deformation of the anchor bar was concentrated primarily within a 5 cm radius around the corbel. (4) In the reinforced concrete corbel connection scheme, the load-bearing capacity reached 240 kN. The key factor influencing this capacity was the presence of cracks. Initially, these cracks appeared symmetrically on both sides of the corbel, and gradually extended to the width and height of the corbel structure.
1. Introduction
As the construction volume of utility tunnels continues to rise, the construction environment grows progressively more intricate. The extensive operation of open-cut utility tunnel construction exerts a substantial influence on the traffic and environment of the surrounding areas, ensuring that the quality of the on-site concrete pouring becomes a formidable challenge [1].
Adopting the shield method for utility tunnel construction has become a pivotal development trend, especially in densely populated central and old urban areas. These areas feature tightly packed buildings, intricate road networks, dense underground pipelines, and complex surroundings. There are also challenges to existing pipeline relocation during open-excavation construction. In such contexts, the shield method stands out as the optimal choice for construction. Employing the shield method for utility tunnel construction means dividing the tunnel effectively to cater to the distinct requirements of various pipelines. The thoughtful subdivision and design of the internal structural components hold significant practical value in ensuring the safe and swift realization of the construction of utility tunnels.
Scholars have mainly focused on the mechanical properties of the prefabricated assembly method when analyzing the integrated pipe gallery structures in utility tunnel structures. Huang [2] researched the horizontal and vertical seismic responses of the upper and lower sections of split prefabricated utility tunnel. Fan [3] examined the evolution of the vertical cracks and stress distribution along the side wall of a rectangular double-compartment utility tunnel. Mao [4] delved into the mechanical properties of joints in rectangular double-compartment prefabricated utility tunnels through model testing and numerical simulations. Zhu [5] analyzed the pros and cons of employing the shield method versus the open-cut method for constructing a comprehensive utility tunnel on Chemical Road in the old city of Harbin. Chen [6] investigated the internal structural support system of utility tunnels and conducted a comparative analysis of five different schemes, including a precast concrete corbel, an aluminum alloy corbel, column support, a cast-in-place concrete secondary lining, and a precast concrete secondary lining. Li [7] explored the influence of lining segment dislocation on the mechanical properties of tunnel structures by creating a tunnel model with a secondary lining and partitions.
The research into the mechanical properties of shield and utility tunnels has primarily focused on conducting comprehensive mechanical analyses of the tunnel segments and assessing the impact of joints between these segments. The traditional models for calculating the internal forces within these segments encompass the homogeneous ring model (both the standard and modified versions) [8], the multi-hinged ring model [9], the beam-spring model [10], and the shell-spring model [11,12], among others. The distinctions between these methods lie in their approaches to handling the joints and the units chosen to simulate the tunnel segments. In recent years, numerous scholars have conducted in-depth theoretical analyses of the mechanical properties of bolts and joints in tunnel construction. Dong [13] investigated the mechanical failure behavior of shield segment joints featuring inclined bolts and no liner structure under high-load conditions. Dong also proposed a simplified analytical model for assessing the failure process of such segment joints. Wang et al. [14] divided the compression process of the longitudinal joint of a segment into four distinct stages. They introduced an influence coefficient related to the height of the outer concrete compression zone. They formulated a theoretical, analytical equation for calculating the entire compression process of the longitudinal joints in segment bolt connections within shield tunnels. Liu et al. [15] developed an analytical model to simulate the stress progression of a longitudinal joint of a segment, building upon the experimental data. They further analyzed the longitudinal joint’s mechanical performance and ultimate bearing capacity. Additionally, Yu et al. [16] deduced an analytical solution for the longitudinal bending stiffness of segment lining, making assumptions about the linear elasticity of the bolts and rubber gaskets, with the bolts primarily under tension and the rubber gaskets primarily under compression.
The substantial enhancement in the computing power of computers and the evolution of large-scale commercial computing software have ushered in a new era of profound and detailed research into the mechanical properties of segments. This progress has led to the development of increasingly refined modeling techniques. Some scholars have introduced innovative approaches, such as the local stiffness correction method for segment joints and methods to determine correction parameters. In addition, the impact of ring seams and the mechanical properties of joint sealing gaskets in calculating joint stiffness should be considered [17,18,19]. Li et al. [20] introduced a sophisticated three-dimensional numerical model for the segment joints. This model employed solid elements to replicate the joint concrete, inclined bolts, sleeves, gaskets, and other structural components while using beam elements to represent the steel bars. Zeng et al. [21] and Liu et al. [22] demonstrated that the bending stiffness of the segment joints varied with respect to the load changes. Although the axial forces bolstered the bending stiffness, the bending moments weakened it. Xu et al. [23] accounted for the nonlinear characteristics of the joint bending stiffness by creating a shell-spring-contact-stratum model. In this model, the bending stiffness of the joint was iteratively adjusted based on the segment forces, yielding results closer to the real-world composite stratum conditions. Tian et al. [24] developed a three-dimensional numerical model of the shield tunnel segments, incorporating the initial surface cracks and the simulating crack propagation under fatigue loads. Epel et al. [25] proposed a simplified simulation method for the EPB shield tunneling, which involved the segment joint process, grouting pressure, and slurry hardening. They investigated the variations in a segment lining load via an EPB shield tunneling. Although the solid elements are valuable for a detailed structural analysis (e.g., bolts and joints), using them excessively could increase the computational costs significantly. As a result, the solid elements can be better suited to an in-depth joint analysis rather than evaluating the overall segment forces [26]. The choice of calculation method depends on the specific research objectives and the size of the model under investigation.
In summary, the recent literature on utility tunnels predominantly focuses on two areas: (1) the prefabricated assembly utility tunnel structures and (2) the mechanical properties of shield tunnel segments. However, connection forms and subdivision structures are still under research. This study is centered on a utility tunnel project in the central urban area of Guangzhou, which involves the implementation of a horizontal partition within the utility tunnel. The utility tunnel is divided into two compartments: the upper compartment is designated for cables while the lower one is for water pipe communication integration. The mechanical properties of three connection schemes are examined in this research: (1) the steel corbel and rear expansion anchor bolt connection, (2) the embedded part and the steel corbel welding connection, and (3) the reinforced concrete corbel connection. Both laboratory tests and numerical simulations are performed to indicate the structural deformations and internal forces. In addition, practical design considerations on construction are also included in this study.
2. Engineering Background and Connection Scheme
2.1. Engineering Background
The utility tunnel project in Guangzhou’s central urban area is a joint construction project involving a giant utility tunnel and a subway. This extensive utility tunnel stretches for an impressive 45.7 km, encompassing a network of forty-four working wells. Ten of the wells are seamlessly integrated with subway stations. The average spacing between these working wells is approximately 1.04 km. For constructing the pipe gallery’s working shaft, an open excavation method is employed to create the tunnel using robust C50 segments. These segments feature an outer diameter of 6 m, an inner diameter of 5.4 m, and a thickness of 0.3 m. For further illustration, please refer to Figure 1, which provides a cross-sectional view of the utility tunnel.
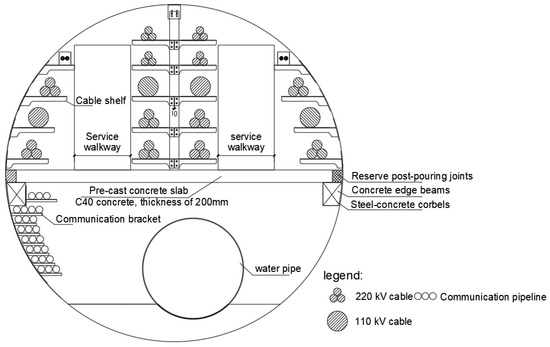
Figure 1.
Utility tunnel section.
2.2. Introduction of Connection Scheme
2.2.1. Steel Corbel and Rear Expansion Anchor Bolt
The connection scheme involving the steel corbel and rear expansion anchor bolts necessitates the initial fabrication of the steel corbel, followed by welding it onto a steel plate. The anchor plate measures 33 cm × 37 cm with a thickness of 14 mm. The upper and lower plates have dimensions of 20 cm × 25 cm, with a thickness of 10 mm. Similarly, the side plate measures 20 cm × 20 cm, also with a thickness of 10 mm. All these components, including the anchor plate, top plate, side plate, and bottom plate, are constructed from Q355 steel. After the shield tunnel is formed, holes are drilled at the designated installation points on each ring segment’s left and right sides, where the steel corbels are attached using post-expanded anchor bolts. Figure 2 and Figure 3 provide the detailed dimensions and the component diagrams of the steel corbel, respectively.

Figure 2.
Steel bracket size(mm); (a) front view of steel bracket; (b) A-A section details.

Figure 3.
Steel corbel.
Each ring segment has a steel corbel on its left and right side. These steel corbels on each side are intricately linked with longitudinal steel bars running along the tunnel’s axis. Concrete is poured to shape the longitudinal beam once the binding steel bars and formwork are in place. To ensure robust bonding between the steel corbels and the cast-in-place concrete bolts, they are welded onto the outer surfaces of the top plate, bottom plate, and on both sides. Once the longitudinal beam achieves its designated strength, the installation of prefabricated partition boards commences establishment of the subdivision structure of the pipe gallery.
2.2.2. Embedded Part and Steel Corbel
The embedded parts are fabricated using Q355 steel plates and HRB400 steel bars, where the steel bars serve as anchoring components, as shown in Figure 4a. The upper steel bar experiences significant tensile forces, necessitating the inclusion of a hook to fortify the anchorage. In contrast, the lower part primarily undergoes compressive stress and thus employs straight anchor bars. A total of four curved anchors and six straight anchors are strategically arranged within this embedded part. During the segment production phase, the embedded parts are pre-positioned in the corresponding locations of the segments. Subsequently, the steel brackets are welded on-site after forming the shield tunnel, as illustrated in Figure 4b. Similar to the connection method used for the steel corbels and rear expansion anchor bolts, it is crucial to link the steel corbels on each side with steel bars. Figure 5 shows the detailed dimensions and component diagrams of the steel corbel. Upon completion of binding steel bars and formwork erection, concrete is poured to shape the longitudinal beam.

Figure 4.
Structural diagram of embedded parts. (a) Embedded part schematic; (b) embedded part and steel corbels.
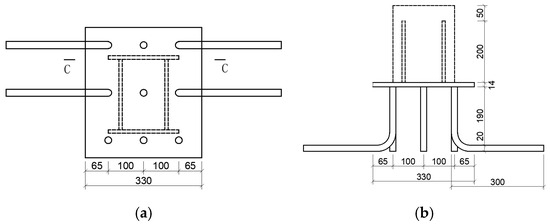
Figure 5.
Embedded part size (mm). (a) Front view of embedded part; (b) C-C section details.
2.2.3. Reinforced Concrete Corbel
This scheme can design the reinforced concrete corbel while preparing the segment (as shown in Figure 6). The segment and the reinforced concrete corbel are prefabricated synchronously. After the segment assembly is completed, the prefabricated subdivision partition is directly installed on the reinforced concrete corbel, which can realize complete prefabrication. Although a high construction accuracy is required by this scheme, it brings the advantages of reduced costs and construction time. After the shield tunnel is formed, on the premise of ensuring the anchoring performance, the steel bar can also be implanted into the segment. It can be bound on the spot, and the cast-in-place reinforced concrete corbel structure can be cast in place by employing the planting steel bar. The reinforcement planting scheme exhibits low requirements for construction accuracy and ample adjustment space in the later stage; however, the construction progress could be significantly affected by the large amount of on-site work.
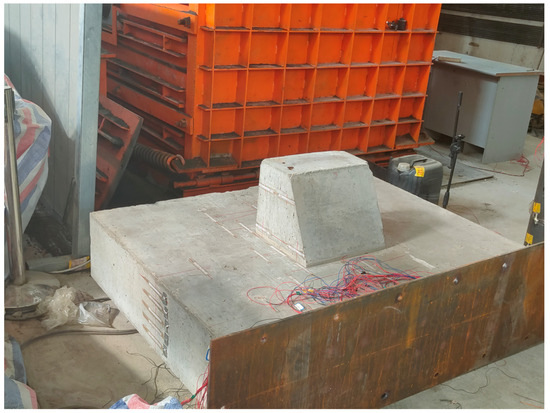
Figure 6.
Reinforced concrete corbel.
3. Experimental and Numerical Simulation Design
3.1. Experiment Design
In the segment’s actual state, the segment experiences an eccentric stress distribution, as depicted in Figure 7. Considering a burial depth of 10 m and a ground overload of 20 kPa, it was determined that the axial force and the bending moment (at 90° and 270° segments) amounted to N = 1100 kN and M = 88 kN·m, respectively. The specimen exhibited the dimensions of 1.5 m in width, 0.3 m in thickness, and 1.2 m in height. Its base was firmly constrained, and a 10 mm thick steel plate was embedded at the base during the specimen’s pouring. The bottom steel plate was tightly connected to the base of the loading bench during the test using twelve bolts. This connection effectively restricts the translational and rotational degrees of the base section, resulting in fixed constraints. During the test, a local eccentric force was initially applied to the top of the specimen with an eccentricity of 8 cm. The process can be summarized as follows: within the top 14 cm width range of the segment, a sturdy steel beam (8 cm thickness, 14 cm width, and 1.5 m length) behaved like a distribution beam. Then, two 200-ton jacks were utilized to apply the eccentric force. After the force was applied to limit the displacement of the top section during the loading process, a 200-ton jack was employed to restrict displacement without impeding its rotational freedom. The boundary conditions can be visualized as shown in Figure 8. Following the application of these boundary conditions, the graded loading can be conducted on either steel corbels or reinforced concrete corbels, depending on the test configuration. The test apparatus is illustrated in Figure 9 as a reference.
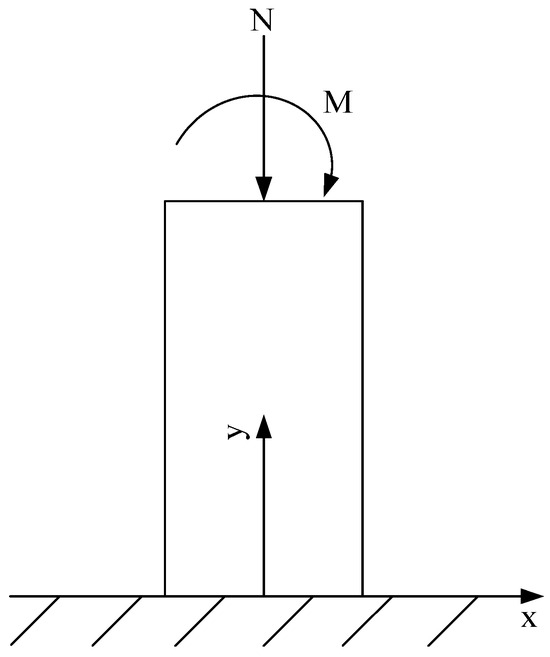
Figure 7.
Stress state.

Figure 8.
Boundary conditions.
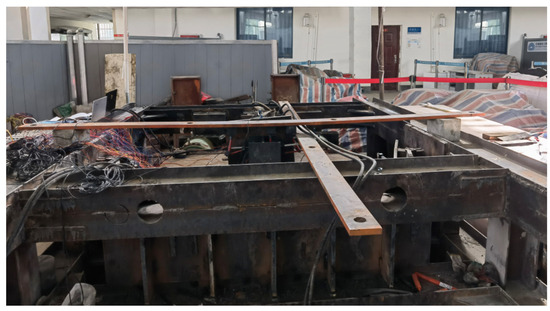
Figure 9.
Test device.
3.1.1. Test Conditions
We organized four sets of model tests in alignment with the three distinct connection schemes. Each specimen was methodically numbered from 1 to 4, as indicated in Table 1. Specimen No. 1 demonstrated the connection between the steel corbel and the concrete, accomplished through six rear expansion anchor bolts. For Specimen No. 2, the steel corbel and concrete were interconnected with the support of nine rear expansion anchor bolts. Specimen No. 3 was exclusively designed with embedded parts as its connection method. In terms of Specimen No. 4, the reinforced concrete corbel and the concrete slab were poured simultaneously, with the concrete slab supported to emulate the structure of an actual segment. These specimens allow us to comprehensively assess the mechanical properties of various connection approaches.

Table 1.
Test information.
3.1.2. Experimental Materials
The M16 rear expansion anchor bolt was selected in a single-tube configuration, and the expansion mechanism was activated by tapping the sleeve. The M16 anchor bolt boasts a 16 mm diameter, with the outer casing measuring 22 mm. Moreover, it provides an adequate anchorage depth of 13 cm. A fully assembled rear-reamed anchor bolt comprises a screw, a casing, a washer, and a nut, as visually depicted in Figure 10.
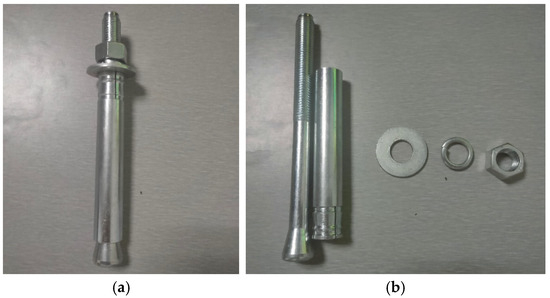
Figure 10.
Anchor bolt. (a) M16 rear expansion anchor bolts; (b) detailed structure.
The steel corbel anchor plate used in the test featured no curvature. It comprised a 14 mm thick Q355 steel plate, with the remaining steel plates being 10 mm thick Q355 steel. Welding was executed using E50 electrodes, employing a bilateral angle welding technique, resulting in an adequate welding bead size of 8 mm.
The anchor plate used in the embedded part was also constructed from a 14 mm thick Q355 steel plate, with the additional steel plates measuring 10 mm wide, all welded together using E50 electrodes. Bilateral fillet welding was applied, achieving an adequate welding bead size of 8 mm. On the other hand, the anchor bar utilized HRB400 steel with a 20 mm diameter, and the weld bead size measured 12 mm.
3.2. Numerical Simulation Design
This study employed the finite element numerical simulation software ABAQUS(2021) to construct solid models encompassing four distinct connection schemes for analysis. These schemes included steel corbel connections with six and nine rear expansion anchor bolts, an embedded part, a steel corbel connection, and a reinforced concrete corbel connection. These models were meticulously designed to explore their mechanical properties and stress characteristics. Furthermore, different arrangements of anchor bolts were considered to provide a comprehensive understanding of their behavior. Figure 11 provides a visual representation of these four numerical models.


Figure 11.
Model representation. (a) Steel corbel and 6 rear expansion anchor bolts connection; (b) steel corbel and 9 rear expansion anchor bolts connection; (c) embedded parts and steel corbel connection; (d) reinforced concrete corbel connection.
Within the numerical model, all specimens shared consistent dimensions, measuring 1.2 m in height, 1.5 m in width, and 0.3 m in thickness. The load conditions mirrored the physical tests, with an eccentric load of 1100 kN applied at an eccentricity of 8 cm. The bottom section was subjected to fixed constraints to accurately replicate the experiment conditions. A visual representation of the model’s load application and boundary conditions can be found in Figure 12.
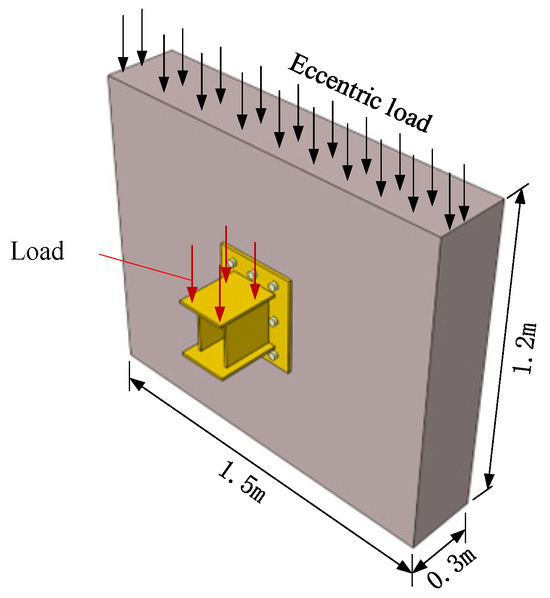
Figure 12.
Model load application and boundary conditions.
In our numerical model, we employed a plastic damage constitutive method for concrete, and the specific parameter values were derived from laboratory tests, as depicted in Figure 13. On the other hand, steel was characterized using a double broken line model, with the corresponding calculation parameters detailed in Table 2.
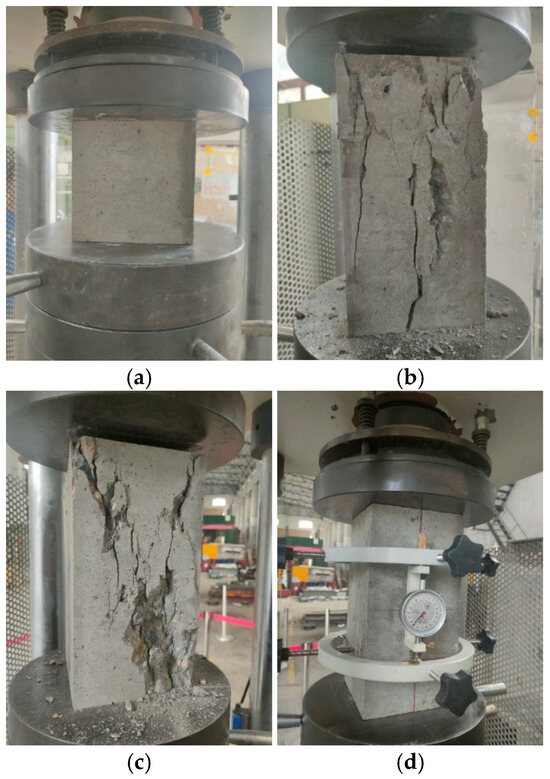
Figure 13.
Test of mechanical properties of concrete. (a) Cube compressive strength test; (b) axial compressive strength test-1; (c) axial compressive strength test-2; (d) elastic modulus test.
Table 2.
Steel calculation parameters.
In terms of the models using steel corbel and rear expansion anchor bolts, the primary source of anchoring force is the lock key at the tail of the bolt, necessitating solid elements to represent the anchor bolt. We established the surface contacts between the lock key and the concrete to ensure accurate interactions. In this configuration, a ‘hard contact’ was applied in the expected direction, while a radial friction coefficient of 0.5 was implemented. Additionally, we set up surface contacts between the bolt and the concrete, the bolt, and the screw hole, as well as the nut and the anchor plate [27,28].
In the embedded part and steel corbel model, we utilized T3D2 elements to simulate the steel bar, incorporating the ‘embedded’ interaction type within the concrete. Meanwhile, the anchor bar was represented using solid elements, with the surface contact interactions established between the anchor bar and the concrete. In this scenario, the ‘hard contact’ was specified for the expected direction. At the same time, a friction coefficient of 0.9 was assigned in the radial direction to ensure an accurate representation of the mechanical behavior.
4. Analysis of Experimental and Numerical Simulation Results
4.1. Steel Corbel and Six Rear Expansion Anchor Bolts
4.1.1. Analysis of Steel Corbel
During the loading process, the steel corbel primarily experiences two displacement directions. Firstly, the bolt undergoes shear deformation due to the shear force acting on it, causing the steel bracket to slide along the concrete surface. Secondly, with the influence of the bending moment, the anchor plate starts to separate from the concrete surface. The deformation pattern of the steel corbel is visually represented in Figure 14. Notably, the deformation characteristics of the steel corbel closely align with the experimental observations and numerical simulations. The corbel’s displacement followed a general sequence throughout the process: initially, it exhibited a slight movement along the concrete surface. As the load intensified, the lower bolt inclined, causing the upper portion of the anchor plate to detach from the concrete surface. In the meantime, the lower section of the anchor plate became progressively tighter against the concrete surface. Ultimately, the bolt shears and concrete cracking occurred.
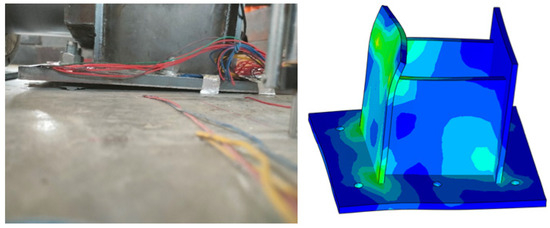
Figure 14.
Steel corbel deformation.
The displacement monitoring points for the corbel are depicted in Figure 15. Precisely, the W1 points illustrate the vertical displacement of the upper plate of the corbel, the W2 points indicate the vertical displacement of the bottom edge of the anchor plate, the W3 points show the separation distance between the anchor plate and the concrete surface, and both the W4 and W5 points measure the displacement of the sides of the plate. In Figure 15, the term ‘splaying amount’ denotes the cumulative displacement of W4 and W5. The displacement curves for each monitoring point are presented in Figure 16.
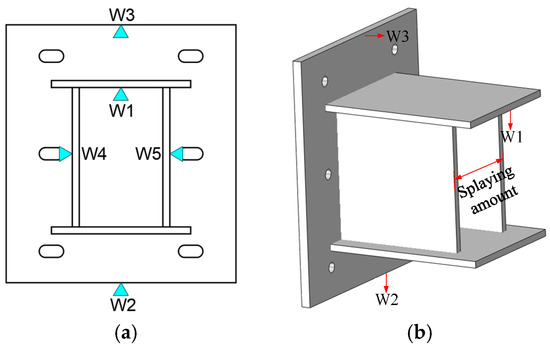
Figure 15.
Displacement monitoring scheme. (a) Displacement monitoring points; (b) splaying amount indicates.
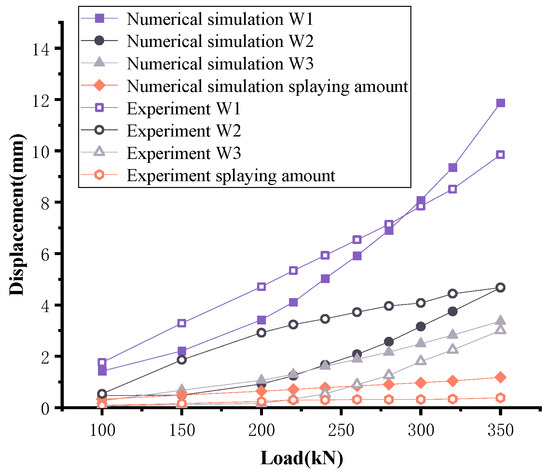
Figure 16.
Displacement curve of steel corbel.
Overall, there is a minimal disparity between the displacement measurements at each monitoring point in the steel corbel experiment and those in the numerical simulation. This alignment underscores the reliability of the numerical simulation presented in this paper. However, it is worth noting that the displacement values at each monitoring point in the numerical simulation are slightly larger than those observed in the experiment. This discrepancy could be caused by the fact that steel corbel deformations are in the millimeter range, and the vibrations generated during the application of top load by the jack in the experiment could lead to monitoring inaccuracies. It is essential to highlight that the maximum displacement value exhibits a mere 17% error, deemed acceptable for this paper.
In both the experimental and the numerical simulation, when the load was below 150 kN, the deformation of the steel plate remained minimal. However, the displacement of point W1 exhibited a rapid growth trend, primarily because there was no support on the lower side of point W1, resulting in the most significant displacement. When the load reached 300 kN, the displacement at point W1 reached 8.08 mm. The stress distribution in the steel corbel is depicted in Figure 17, and the red and blue lines in the figure represent the yield strength and tensile strength of the steel plate, respectively. By correlating the data from Figure 16 and Figure 17, it is indicated that as the load reaches 300 KN, the increase in displacement at the W1 point undergoes a significant upsurge as the steel plate meets its ultimate tensile (compressive) strength.

Figure 17.
Stress of steel corbel.
Conversely, the displacement at the W2 point remains relatively small. It reaches 2.92 mm when the load is below 200 kN, and the displacement progress becomes slower when the load increases further. At a 300 kN load, the displacement only reaches 4.08 mm.
The anchor plate maintains a minimal gap from the concrete surface, with a maximum distance of 3.37 mm. The side plate exhibits a minor opening, with a maximum of 1.18 mm. There is a substantial bending deformation in the middle section of the anchor plate. In summary, the upper portion of the anchor plate experiences a significant deformation, while the lower portion exhibits a minimal deformation.
The steel plate’s maximum and minimum principal stress increase as the load increases. When the load reaches 300 kN, the maximum principal stress reaches 505.8 MPa, reaching the material’s ultimate tensile (compressive) strength. Stress concentration becomes apparent at the front end of the contact area between the upper plate and the side plate and at the edges of the welded region between the upper plate and the anchor plate, where the maximum tensile and compressive stresses are manifested.
4.1.2. Analysis of the Anchor Bolt
In Figure 18, the failure patterns and stress displacement distribution of the anchor bolts are shown. Upon completion of the loading, the distinct failure patterns emerge among the three rows of anchor bolts, collectively falling into three categories: drawing failure, screw shear failure, and sleeve failure.
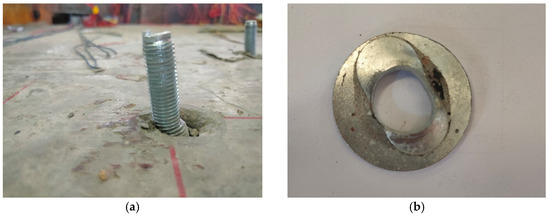
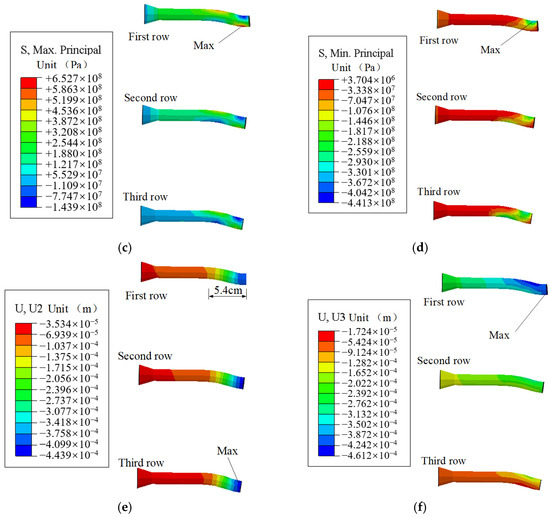
Figure 18.
Failure pattern and stress displacement distribution of anchor bolts. (a) Bolt shear failure; (b) gasket deformation; (c) maximum principal stress; (d) minimum principal stress; (e) vertical displacement; (f) horizontal displacement.
In the first row of anchor bolts, subjected to substantial shear forces and tension, the bolts undergo shearing and bending while experiencing axial elongation. The second row of the bolts exhibits the most significant shear deformation, resulting in severe bolt distortion. The substantial shear deformation in this row leads to casing tearing. The third row of bolts primarily experiences shearing and tilting, causing varying degrees of deformation in all casings. In the middle row, the bolt casings have been torn, and each bolt gasket exhibits considerable deformation.
Figure 19 and Figure 20 show the stress and displacement curves, and the red and blue lines in the figure represent the yield strength and tensile strength of the anchor bolt, respectively.

Figure 19.
Stress curve of anchor bolt.

Figure 20.
Displacement curve of anchor bolt.
At a load of 180 kN, the maximum principal stress has surged to 646.4 MPa, pushing the bolt into the yield stage. Subsequently, the maximum principal stress experiences gradual increments. When the load reaches 300 kN, the minimum principal stress exceeds the compressive strength of the anchor bolt, resulting in a partial damage to the bolt. The peak stress on the anchor bolt occurs at the contact area between the bolt and the anchor plate. The upper side bears compressive stress, while the lower side faces tensile stress. The first row experiences the highest force among the rows of anchor bolts, whereas the third row endures the lowest force.
Before reaching a load of 200 kN, the maximum vertical displacement of the anchor bolt remains at 0.44 mm. Subsequently, the vertical displacement accelerates and ultimately reaches 1.08 mm. The horizontal displacement of the anchor bolt exceeds vertical displacement before the load reaches 200 kN. Horizontal displacement increases at a slower pace and eventually reaches 0.75 mm. The displacement cloud diagram of the anchor bolt reveals that the first row of anchor bolts experiences the most significant horizontal displacement.
In contrast, the third row of anchor bolts exhibits the highest vertical displacement. The area with the most pronounced deformation of the anchor bolt is concentrated within a 5.4 cm range near the side of the steel corbel, with minimal displacement and stress observed elsewhere. This underscores the importance of maintaining an adequate anchorage depth.
4.1.3. Analysis of Concrete Damage
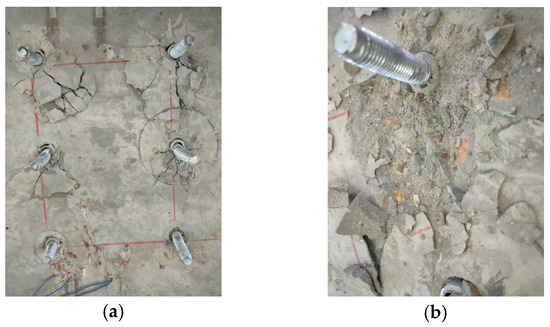

Figure 21.
Failure pattern of concrete. (a) Cracking of concrete; (b) crushing of concrete; (c) compression damage of concrete (300 kN); (d) tensile damage of concrete (300 kN).
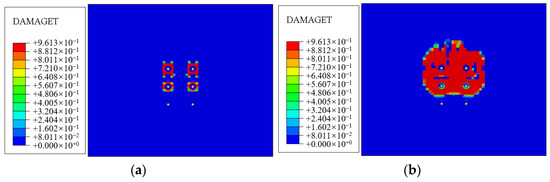
Figure 22.
Internal tensile damage of concrete. (a) Load 200 kN; (b) load 300 kN.
Both the experimental and numerical simulation exhibit the same concrete failure pattern. The concrete surrounding the anchor bolt indicates varying degrees of cracking, as illustrated in Figure 21a. The first row of anchor bolts exhibits the most severe concrete cracking, primarily concentrated on the lower side of the anchor bolts. The maximum width of the failure zone spans 8.8 cm with a depth of approximately 7 mm, as depicted in Figure 22b. Analysis reveals that the first row of anchor bolts is subjected to substantial shear forces and bending moments. As the bolts and casing undergo shear deformation, the relative displacement between the bolts and concrete occurs due to tension. The combination of friction between the casing and the anchor bolt hole, along with the bolt shear forces, leads to significant cracking on the lower side of the concrete.
In comparison, the second row of anchor bolts experiences less severe cracking around them, with the maximum width of the cracking zone reduced to 5.4 cm. Concrete damage around the third row of bolts is minimal, displaying only slight indications of damage near the anchor bolt holes, of a very shallow depth. Concrete failure areas are distributed in a fan-shaped pattern, with the first row’s fan-shaped area being the largest, followed by the second row, and the smallest in the third row. In the test, the distance between the left and right anchor bolts is 20 cm, and 14 cm between the upper and lower anchor bolts. Under these dimensions, the cracking areas around each anchor bolt are not connected. The concrete failure pattern shows that the first and second rows of bolts experience the most significant force and deformation, resulting in substantial damage to the surrounding concrete. In contrast, the third row exhibits minimal deformation and the least concrete damage.
Following elastic design principles, the steel corbel can be considered to meet its ultimate bearing capacity when the stress in the corbel steel plate or the anchor bolt stress reach their corresponding yield strengths. However, at this moment, it is expected that microscopic cracks inside the concrete have already occurred. The experimental results demonstrate that even when subjected to a load of 300 kN, the bracket still retains its bearing capacity. It is unreasonable to demand the absence of cracks in the surrounding concrete. If the concrete damage area around the anchor bolt is penetrated, it could be even worse with further load increases. Therefore, it can be deemed acceptable for the concrete around the anchor bolt to be damaged, but not to the extent of penetration.
Based on the tests and numerical simulations conducted in this study, the bearing capacity criterion is defined such that the steel bar and steel plate are not exceeding their yield strength, effectively keeping the structure within the elastic working stage, and the concrete damage areas around the anchor rod should remain unconnected. As a result, the bearing capacity of the steel corbel and six rear expansion anchor bolts can reach up to 180 kN.
4.2. Steel Corbel and Nine Rear Expansion Anchor Bolts
4.2.1. Analysis of Steel Corbel
The testing procedure for the steel corbel and nine rear expansion anchor bolts scheme mirrors that of the steel corbel and six rear expansion anchor bolts scheme. The deformation in the steel corbel is indicated in Figure 23, and the displacement curves for each monitoring point are presented in Figure 24.
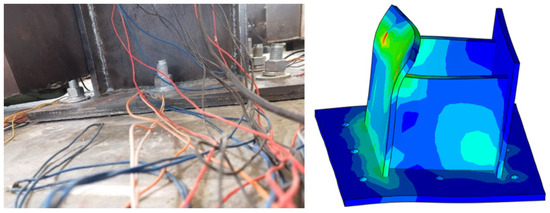
Figure 23.
Steel corbel deformation.
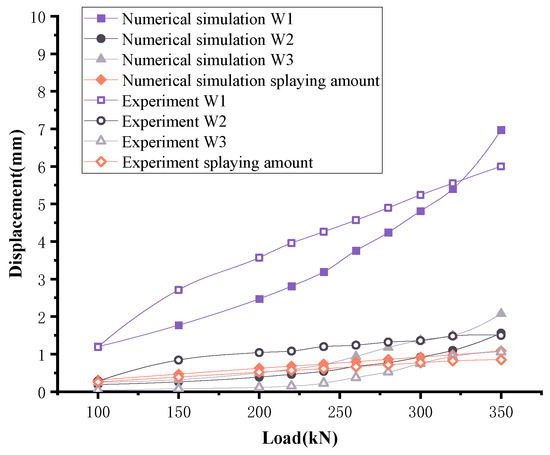
Figure 24.
Displacement curve of steel corbel.
The displacement of the upper edge of the corbel is affected by two factors: the material deformation of the corbel steel plate itself and the overall displacement of the steel corbel resulting from the deformation of the anchor bolt. Compared to the connection scheme utilizing a steel corbel and six rear expansion anchor bolts, the steel corbel deformation in this scheme is relatively minor.
As depicted in Figure 24, the maximum displacement error between the experimental and the numerical simulation is 13.9%, which is acceptable in this paper. In the experiment, during the initial loading stages (ranging from 100 kN to 150 kN), when each component experiences compression, the bolt leg makes a complete contact with the anchor bolt, resulting in significant displacement changes. The displacement at the W1 point increases to 2.71 mm. From the perspective of displacement, the W1 point exhibits the highest displacement in the numerical simulation. When loaded to 300 kN, the displacement reaches 5.24 mm. Compared to the previous connection scheme, this displacement is reduced by 35.1%.
In the experiment, point W2 was positioned at the bottom of the anchor plate. When loaded to 200 kN, the vertical displacement of the W2 point underwent rapid growth, reaching 1.04 mm due to the compression of the existing gap. On the other hand, the W3 point was located on the upper part of the anchor plate, monitoring the displacement of the upper section of the anchor plate from the concrete surface. Before the load reached 260 kN, the anchor plate separation was minimal, with a maximum of 0.38 mm. In the numerical simulation, the displacement of the W2 point was small, with a maximum of only 1.56 mm. Meanwhile, the maximum displacement of the W3 point was 2.08 mm, and the side plate opening was minimal, with a maximum of only 1.09 mm.
In summary, increasing the number of anchor bolts enhanced the constraint on the steel plate and reduced the deformation of the anchor plate.
The stress of the steel corbel is depicted in Figure 25. When the load is less than 220 kN, the stress of the steel plate experiences a rapid growth. At 220 kN, the steel plate enters the yield stage, and the stress curve remains relatively flat beyond that point. Upon reaching 300 kN, the minimum principal stress of the steel plate reaches the compressive strength. Stress concentration occurs at the front end of the contact part between the upper plate and the side plate, and the edge of the welding part between the upper plate and the anchor plate.
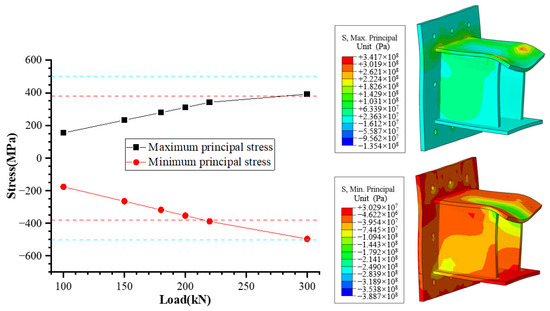
Figure 25.
Stress of steel corbel.
4.2.2. Analysis of Anchor Bolt
During the loading process, the bottom bolt was noticeably tilted and elongated when the load reached 350 kN. Upon completing the loading, the contact part between the bolt and the steel plate exhibited clear signs of yielding, with the threads becoming flattened. Additionally, the gasket underwent significant deformation. The failure pattern and stress displacement distribution of anchor bolts are presented in Figure 26, while the stress curve and displacement curve can be observed in Figure 27 and Figure 28, respectively.
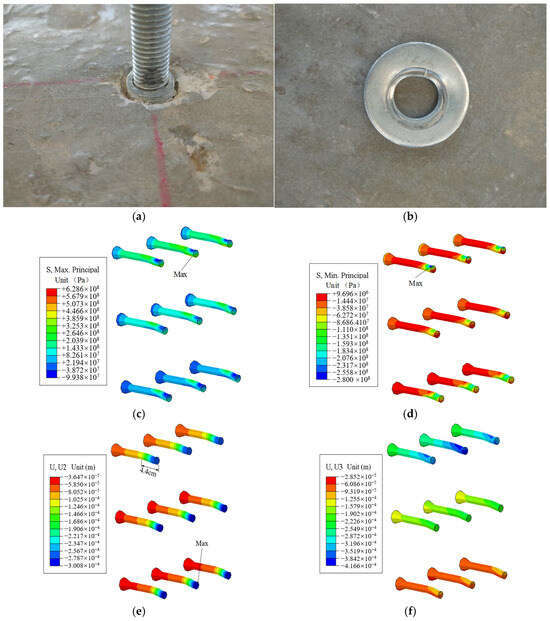
Figure 26.
Failure pattern and stress displacement distribution of anchor bolts. (a) Bolt shear failure; (b) gasket deformation; (c) maximum principal stress; (d) minimum principal stress; (e) vertical displacement; (f) horizontal displacement.

Figure 27.
Stress curve of anchor bolt.
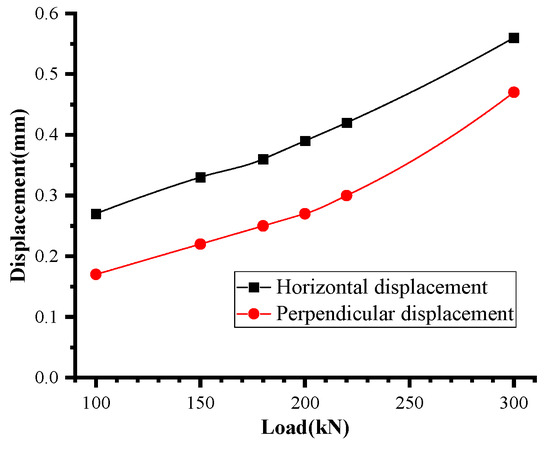
Figure 28.
Displacement curve of anchor bolt.
When the load reaches 220 kN, the maximum principal stress in the anchor bolt reaches 639.0 MPa, indicating that it is approaching the yield stage. The anchor bolt completed reaches the yield stage in Figure 26c, yet no damage has occurred. The maximum stress is concentrated in the contact area between the anchor bolt and the anchor plate, with the upper side experiencing compression and the lower side undergoing tension. Among the anchor bolts, the first row bears the highest force, while the third row bears the lowest force.
When the load reaches 300 kN, the maximum vertical displacement of the anchor bolt is 0.47 mm. Notably, the horizontal displacement of the anchor bolt is greater than the vertical displacement, eventually reaching 0.56 mm. A closer look at the displacement cloud diagram reveals that the first row of anchor bolts experiences the most significant horizontal displacement. In contrast, the third row of anchor bolts has the most significant vertical displacement. These findings align with the test results, as shown in Figure 29. It should be noticed that the most severe deformation area of the anchor bolt is concentrated within a 5.4 cm range near the steel corbel, with minimal displacement and stress observed in the remaining areas.
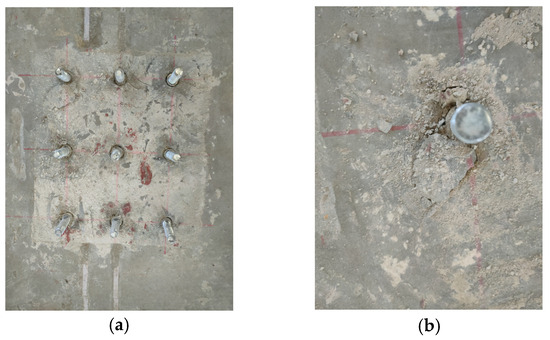
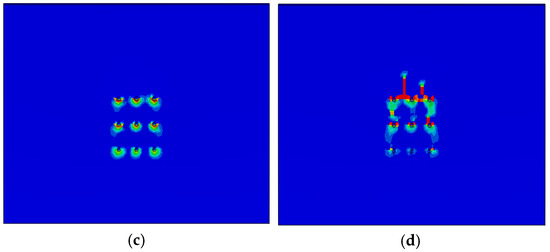
Figure 29.
Failure pattern of concrete. (a) Cracking of concrete; (b) crushing of concrete; (c) compression damage of concrete (300 kN); (d) tensile damage of concrete (300 kN).
4.2.3. Analysis of Concrete Damage
The damage to the concrete is depicted in Figure 29, while Figure 30 provides a view of the internal damage within the concrete.
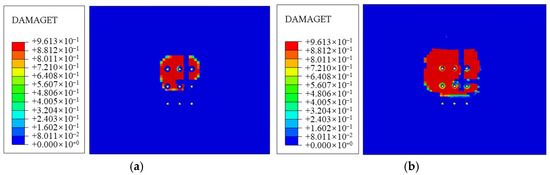
Figure 30.
Internal tensile damage of concrete. (a) Load 200 kN; (b) load 300 kN.
The concrete under the first row of bolts was crushed, resulting in cracks. As shown in Figure 29a,b, the spacing of the three bolts in the first row is 10 cm and the cracks have been penetrated. The cracking area around the second row of bolts is smaller than that of the first row, but apparent cracks are generated. The cracking area around the third row of bolts is minimal.
When the steel bracket is loaded to failure, the stress of the steel bracket is not very large, and the deformation of the steel plate itself is also tiny, while the bolts and concrete are damaged. Therefore, the connection between the steel corbel and concrete controls the ultimate bearing capacity of this scheme.
As shown in Figure 29c,d, the lower side of the anchor bolt hole is mainly compressed. Although the compression damage area gradually increases as the load increases, it does not penetrate. The concrete around the first row of anchor bolt holes exhibits the largest compressive damage area, and it decreases from top to bottom, consistent with the experiment results (as shown in Figure 29). In addition, the upper side of the anchor bolt hole is also subjected to tensile damage, with a decreased damage area from top to bottom.
In Figure 29 and Figure 30, it is clear that the tensile damage is more severe at the section where the anchor bolt expands. At 160 kN, the damaged areas around the anchor bolt are not connected. At 180 kN, the damaged areas around the first row of anchor bolts are connected. At 220 kN, the damaged areas around the second row of anchor bolts are also connected. When the load reaches 300 kN, the damaged area increases further. The load required for the steel to reach its yield strength is 220 kN. In a comprehensive analysis, when using nine anchor bolts, the bearing capacity is only 170 kN, and both the anchor bolts and the steel bracket remain in the elastic stage.
4.3. Embedded Parts and Steel Corbel
4.3.1. Analysis of Steel Corbel
Throughout the loading process of the embedded parts and steel corbel connection scheme, the primary focus is to monitor the displacement of the steel corbel and observe the connection between the corbel and the concrete. Displacement meters are used to monitor the displacement of the top plate and the two sides of the plate. The monitoring points are depicted in Figure 31, and the term ‘splaying amount’ represents the cumulative displacements of W2 and W3.

Figure 31.
Displacement monitoring points.
The stress distribution in the corbel is presented in Figure 32. The stress within the corbel increases linearly at the beginning and saturates at 280 kN. When subjected to a load of 350 kN, the minimum principal stress reaches 479.9 MPa, but it does not surpass the material’s compressive strength.
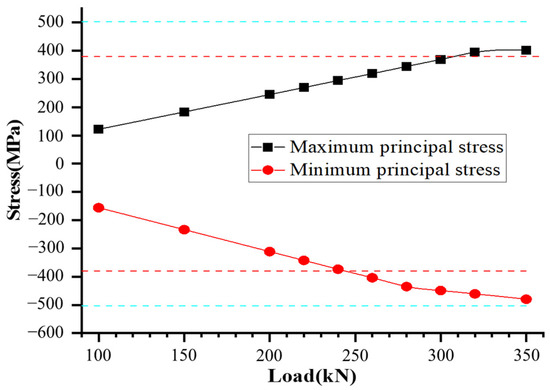
Figure 32.
Stress of steel corbel.
The displacement curves for each monitoring point are depicted in Figure 33. The most significant error between the test and numerical simulation lies in the displacement measurement at point W1, with a margin of 17.3%. However, this discrepancy is acceptable in this study. The deformation behavior of the corbel closely resembles that observed in the experiment (as shown in Figure 33), evidencing the reliability of the numerical simulation. Following loading, the lateral steel plate exhibits bending, with the maximum opening of the side plates reaching 0.94 mm. The upper steel plate is bent at the front, and within a 5 cm range at the front, where there is no side plate support, significant vertical displacement occurs, reaching 3.52 mm.
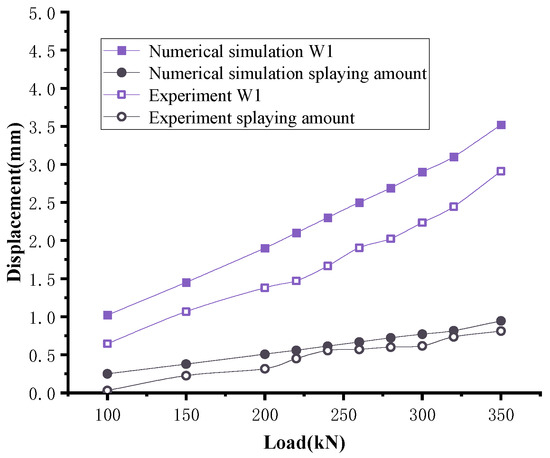
Figure 33.
Displacement curve of steel corbel.
Furthermore, with the increase in load, the displacement also exhibits a noticeable increase. The side plates experience minimal opening, bending slightly towards both sides. Compared to the two preceding connection methods, the maximum displacement of the steel leg, when loaded to 300 KN, is reduced by 64.1% and 44.7%. This substantial reduction in displacement can be attributed to the fact that, under this particular connection scheme, the maximum and minimum principal stresses within the steel leg remain within the tensile and compressive strength limits.
The cracking morphology and deformation are shown in Figure 34. When loaded to 350 kN, cracks were generated on the left and right sides of the contact between the anchor plate and the concrete. The length of the left crack was 5.8 cm, and the length of the right crack was 6.2 cm. During the whole process, the cracks grew slowly. No apparent cracks were found in the contact area between the bottom of the anchor plate and the concrete. According to the results obtained from numerical simulations, the anchoring ability of the anchor bar is strong, and the anchor plate only exhibits slight bending deformation on the upper left and right sides, with the maximum deformation being only 0.85 mm. The cracks observed between the steel corbels and the concrete are also attributed to the bending deformation of these steel corbels, which is consistent with the observation of cracks on both sides in the experiment.
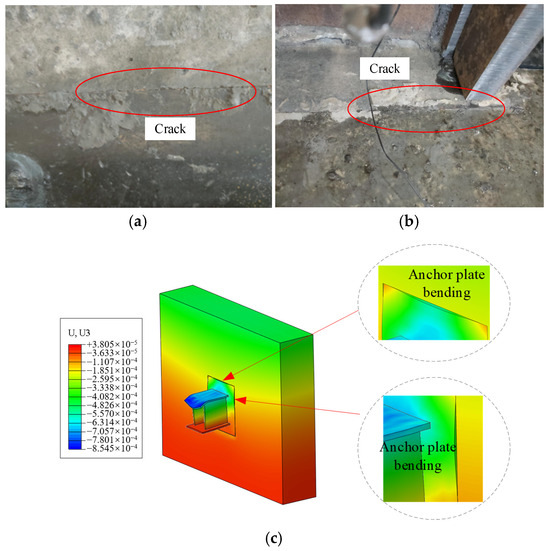
Figure 34.
Cracking morphology and deformation. (a) Left contact area; (b) right contact area; (c) deformation of corbel.
4.3.2. Analysis of Anchored Bar
Since anchor bars are embedded within the concrete structure, our investigation of anchor bar behavior primarily relies on numerical simulation. Figure 35 illustrates the stress distribution along the anchor bars, while Figure 36 presents the corresponding displacement patterns.
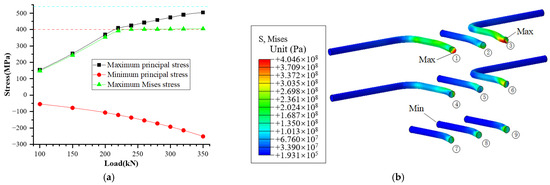
Figure 35.
Stress of anchor bar. (a) Stress curve of anchor bar; (b) stress distribution of anchor bar.
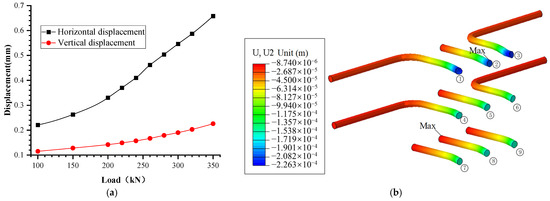
Figure 36.
Displacement of anchor bar. (a) Displacement curve of anchor bar; (b) vertical displacement of anchor bar.
Upon reaching a load of 350 kN, it is noteworthy that the anchor bars have not yet approached their tensile strength limits. Specifically, anchor bars No. 1 and No. 3 experience the highest stress levels, with stress concentration notably occurring at the welding junction. The upper anchor bar also sustains the greatest force, while the lower anchor bar experiences lower stresses. Furthermore, it is observed that the stress magnitude increases as the bar approaches the corbel.
The displacement of the anchor bolts exhibits minimal vertical displacement but notable horizontal displacement, with the latter exceeding the former. Figure 35b illustrates that the deformation of the anchor bars primarily occurs within a 5 cm vicinity near the anchor plate.
4.3.3. Analysis of Concrete Damage
The concrete’s external appearance showed no significant damage in the experiment, as depicted in Figure 37. Cracking was observed only in the lower-left corner. Furthermore, the assessment of concrete damage primarily relied on numerical simulation since the steel corbel encased in concrete could not be extracted to inspect the damage visually.

Figure 37.
Surface damage of concrete in the experiment.
The surface and internal damage to the concrete are depicted in Figure 38 and Figure 39. The tensile failure of the concrete is more pronounced than the compressive failure. The most severely damaged areas are concentrated around the upper anchor bar and the concrete at the bottom of the welded steel plate.

Figure 38.
Surface damage of concrete. (a) Compression damage of concrete (350 kN); (b) tensile damage of concrete (350 kN).

Figure 39.
Internal tensile damage of concrete. (a) Load 220 kN; (b) load 240 kN.
As the load increases from 150 kN to 350 kN, the compressive damage coefficient rises from 0.24 to 0.88, while the tensile damage coefficient increases from 0.65 to 0.9613. When the load surpasses 240 kN, cracks begin to appear within the concrete. Figure 38 illustrates that the concrete damage area around the anchor bar has become interconnected at 220 kN, whereas it was not connected at this load level.
In terms of bearing capacity, the scheme involving embedded parts and a steel corbel appears more reasonable, with a bearing capacity of up to 220 kN in elastic design. At this point, particular attention should be given to the welding part of the anchor bar, the welded steel plate, and the contact area between the anchor plate and the concrete.
4.4. Reinforced Concrete Corbel
The findings of the experimental (in Figure 40) and numerical simulations (in Figure 41) consistently reveal that the displacement of the concrete corbel remains negligible until the point at which cracks begin to manifest at the junction between the reinforced concrete corbel and the adjoining structure. In addition, the concrete predominantly experiences tensile damage rather than significant compression damage. Consequently, the primary focus of this study revolves around determining the load threshold at which these cracks commence to emerge at the juncture of the corbel and the concrete.

Figure 40.
The damage of corbel. (a) Left side; (b) right; (c) top; (d) bottom.


Figure 41.
Tensile damage of concrete. (a) Load 100 kN; (b) load 150 kN; (c) load 220 kN; (d) load 300 kN.
The damage sustained by the reinforced concrete, as observed in both the experimental and numerical simulation results, is illustrated in Figure 40 and Figure 41. Figure 40 shows that when the load is less than 240 kN, there are no conspicuous cracks near the reinforced concrete corbel. However, as the load escalates to 260 kN, a slow emergence of a 6.5 cm long crack occurs on the left side of the corbel, while a 5.6 cm crack materializes on the right side. Cracks at the top progressively propagate from both extremities toward the center. Once the load reaches 360 kN, the side crack extends to 10.2 cm. Notably, the lower portion of the corbel remains in a state of compression, and no cracks have been detected in this region.
Figure 41 illustrates that the concrete primarily experiences tensile damage, with relatively minimal compression damage. When the applied load remains below 240 kN, no observable cracking is evident in the corbel. However, once the load exceeds this threshold and reaches 240 kN, cracks commence at the juncture between the corbel and the concrete. As the load escalates, these cracks progressively propagate towards the bottom of the corbel. Notably, the tensile damage initiates from both sides of the joint between the corbel and the concrete, gradually culminating in a penetrating crack that extends in the width direction of the corbel and reaches the bottom. This crack development pattern closely mirrors the experimental findings, thus confirming the reliability of the numerical simulation results.
4.5. Scheme Comparison
With the experimental results and the numerical simulation findings indicated in Section 4.1, Section 4.2, Section 4.3 and Section 4.4, a comparative analysis of the connection schemes is presented in this section, considering the mechanical properties and construction convenience, as detailed in Table 3. The scheme involving steel corbels and rear expansion anchor bolts exhibits high bearing capacity and ease of construction. However, increasing the number of anchor bolts from six to nine reduces the bearing capacity due to decreased spacing. The schemes involving embedded parts, steel corbels, and reinforced concrete corbels can be considered, provided construction convenience challenges are addressed. At the current stage, it is recommended to favor the scheme featuring steel corbels and six rear expansion anchor bolts, as it offers further optimization potential and enhances structural safety reserves.
Table 3.
Comparison and selection of connection schemes.
4.6. Analysis of the Influence of Anchor Bolt Arrangement Form
To investigate the impact of various anchor bolt arrangements on their mechanical characteristics, a model featuring six post-expanded anchor bolts arranged in two rows and three columns was constructed, as illustrated in Figure 42, with the anchorage depth remaining at 13 cm.
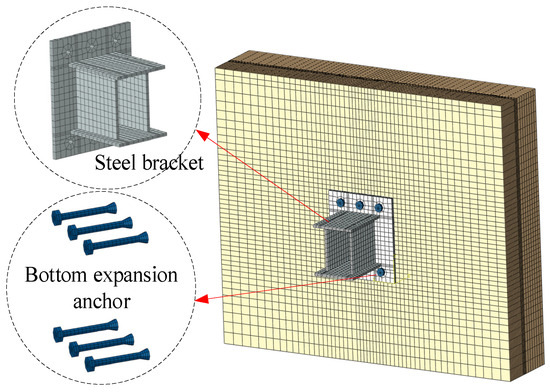
Figure 42.
Arrangement form of two rows and three columns.
In subsequent investigations, the connection configuration featuring three rows and two columns is named “mode 1”. In comparison, the configuration with two rows and three columns is labelled “mode 2”. The stress curve of the steel corbel is depicted in Figure 43, and the displacement monitoring points are shown in Figure 15, with the corresponding displacement curves presented in Figure 44. The stress distribution curves for the two models exhibit a similar pattern, with mode 1 having a higher maximum principal stress value while mode 2 has a higher minimum principal stress value. The steel plate’s maximum and minimum principal stresses increase as the load is raised. When the load reaches 300 kN, the maximum principal stress meets 505.8 MPa in mode 1, while the minimum principal stress reaches -500.8 MPa in mode 2, which is very close to the compressive strength.
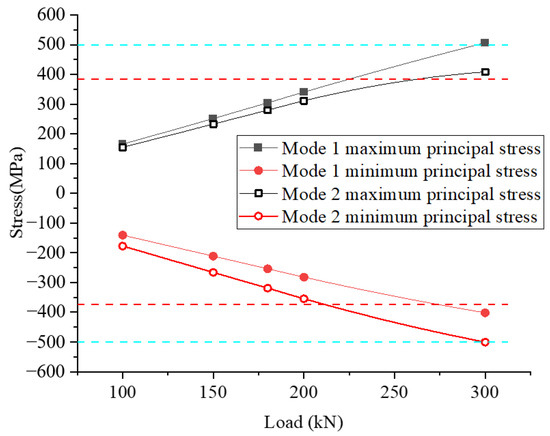
Figure 43.
Stress curve of steel corbel.
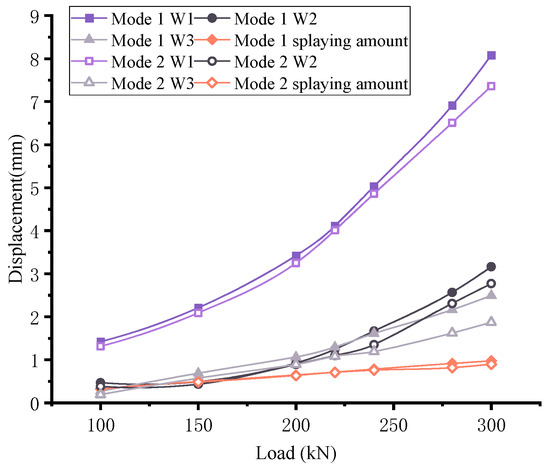
Figure 44.
Distribution of the corbel.
The displacement patterns of both models are similar, with notable differences in the displacement of specific measuring points. In mode 2, the displacement at the W1 point increases rapidly, reaching a maximum of 7.12 mm. On the other hand, the displacements at the W2 and W3 points are relatively small, maxing out at 0.76 mm and 0.69 mm, respectively. In addition, the opening of the side plates is minimal, with a maximum displacement of 0.82 mm. These displacements represent reductions of 8.9%, 12.4%, 24.9%, and 7.7% compared to the arrangement of the anchor bolts in three rows and two columns. This suggests that altering the anchor bolt arrangement can effectively reduce corbel deformation.
The stress characteristics of the anchor bolts in both modes are illustrated in Figure 45, and their displacement behavior is presented in Figure 46. Furthermore, the stress distribution is visualized in Figure 47, and the deformation patterns are shown in Figure 48. At a load of 180 kN (in Figure 45), the maximum principal stress has already reached the yield strength, and subsequent increases are gradual. There is no significant disparity in stress distribution between the two modes, with mode 2 exhibiting slightly lower anchor bolt stress levels. As the load reaches 300 kN, the minimum principal stress exceeds the compressive strength of the anchor bolt, resulting in partial damage. The maximum stress on the anchor bolt is concentrated in the contact area between the anchor bolt and the anchor plate, with the upper side experiencing compressive stress and the lower side undergoing tensile stress. The first row of middle anchor bolts experiences the highest force, while the third row of anchor bolts bears the lowest load.
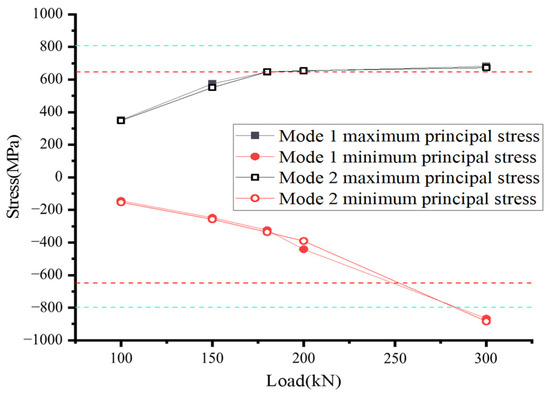
Figure 45.
Stress curve of anchor bolt.

Figure 46.
Displacement curve of anchor bolt.
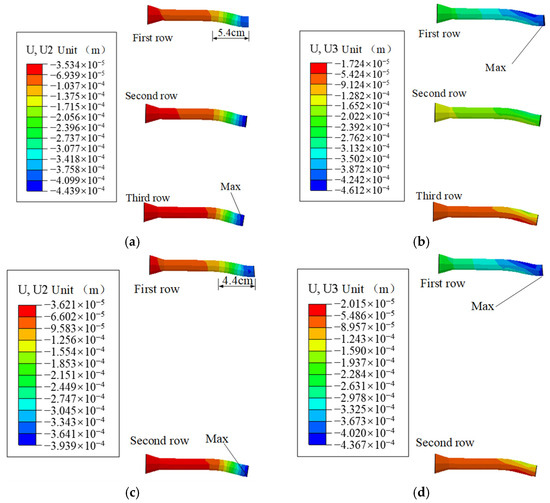
Figure 47.
Displacement of anchor bolt (m). (a) Mode 1 vertical displacement; (b) mode 1 horizontal displacement; (c) mode 2 vertical displacement; (d) mode 2 horizontal displacement.
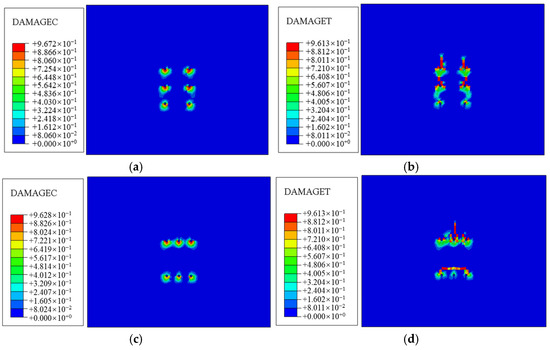
Figure 48.
Surface damage of concrete. (a) Compression damage of concrete in mode 1 (300 kN); (b) tensile damage of concrete in mode 1 (300 kN); (c) compression damage of concrete in mode 2 (300 kN); (d) tensile damage of concrete in mode 2 (300 kN).
As can be seen from the diagram in Figure 46, the anchor bolt exhibits a maximum vertical displacement of 0.9 mm and a maximum horizontal displacement of 0.67 mm, representing a 16.7% and 10.7% reduction, respectively, compared to the configuration with three rows and two columns of anchor bolts. Analyzing the displacement cloud diagram in Figure 47, it is clear that the first row of anchor bolts experiences the most significant horizontal displacement, while the third row exhibits the greatest vertical displacement. Furthermore, the anchor bolt’s most pronounced deformation zone is concentrated within the first 4.4 cm from the front, marking a 1 cm reduction from the previous 5.4 cm span.
Figure 48 illustrates the surface damage of the concrete, with the lower side of the anchor bolt hole primarily experiencing compression. The compressed damage zone gradually expands as the load intensifies but remains non-penetrative. The largest area of concrete damage surrounds the anchor bolt holes in the first row, diminishing from top to bottom. Tensile damage also affects the concrete above the anchor bolt holes, decreasing the damage area from top to bottom. However, regarding the tensile concrete damage, in mode 2, the damaged area on the upper side of the lower row anchor hole is connected, while it remains disconnected in mode 1.
Figure 49 provides insight into the internal damage within the concrete. Notably, the expansion section experiences more significant tensile damage than the arrangement with anchor bolts in two rows and three columns. This discrepancy arises from the spacing reduction between the left and right rows of the anchor bolts. The spacing of mode 1 is 100 mm, while in mode 2, it is 67.7 mm. This highlights the importance of maintaining optimal spacing between anchor bolts. Based on the working conditions in this study, the recommended bolt spacing arrangement falls within the range from 66.7 mm to 100 mm.


Figure 49.
Internal damage of concrete. (a) Mode 1 load 200 kN; (b) mode 1, load 300 kN; (c) mode 2, load 200 kN; (d) mode 2, load 300 kN.
5. Conclusions
This study conducts the tests and numerical simulations for four distinct working conditions involving steel corbel and rear expansion anchor bolts (six and nine anchor bolts), embedded parts, and steel corbel with reinforced concrete trusses. Additionally, we investigated the layout of anchor rods. Our findings led to the following conclusions:
- The critical point in the steel corbel and rear expansion anchor bolt connection scheme lies in the connection region, where we observed bolt shear failure and concrete cracking. The number of bolts significantly influences the load-bearing capacity of the steel corbel. Adhering to the criterion that the steel bar and steel plate remain within their respective yield strengths during the elastic working phase and ensuring that the concrete damage area around the bolt remains unconnected, we achieved a bearing capacity of 180 kN when utilizing six rear expansion anchor bolts. However, when employing nine rear expansion anchor bolts, the load-bearing capacity decreased to 170 kN, resulting in a 5.6% reduction in bearing capacity.
- The arrangement of bolts has a notable impact on the structural load-bearing capacity. The upper-side anchor bolts bear larger forces, while the lower-side anchor bolts handle less load. Arranging the six anchor bolts in a configuration of two rows and three columns enhances the load-bearing capacity. Still, avoiding forming a damaged area due to inappropriate bolt spacing is crucial. This study’s recommended transverse bolt spacing falls within the 66.7 mm to 100 mm range. The third row experiences the most significant vertical deformation among the anchor bolts, while the first row exhibits the greatest axial elongation. Deformation in the anchor bolts is predominantly concentrated within the 5 cm to 6 cm range near the bracket. The anchorage depth should not be less than 6 cm. In the case of this scheme, the anchorage depth can be preferably selected from the range of 11 cm to 15 cm.
- The connection scheme involving embedded parts and a steel corbel exhibits robust load-bearing capacity, capable of withstanding a 220 kN load within the elastic stage. The anchor bar demonstrates strong anchoring ability, and the steel corbel experiences minimal deformation. Anchor bar deformation primarily concentrates within the 5 cm range near the corbel, with the upper-side anchor bar showing the most significant deformation.
- The reinforced concrete corbel connection scheme boasts a bearing capacity of 240 kN, with its load-bearing capacity primarily governed by crack formation. Initially, cracks emerge symmetrically on both sides of the corbel, progressively extending to encompass the width and height of the corbel structure.
Author Contributions
Data curation, B.S.; formal analysis, Y.D.; investigation, Y.D. and H.L.; methodology, Y.D., Y.Z. and H.L.; resources, Y.Z.; validation, B.S.; writing—original draft, Y.D.; writing—review and editing, H.L. All authors have read and agreed to the published version of the manuscript.
Funding
This research was funded by The National Natural Science Foundation of China, grant number: 52078431.
Data Availability Statement
The raw data supporting the conclusions of this article will be made available by the authors on request.
Conflicts of Interest
Authors Yongxing Dai and Bolun Shi were employed by the company Guangzhou Metro Design and Research Institute Co., Ltd., Author Yi Zeng was employed by the company Guangzhou Huancheng Underground Pipe Gallery Construction Investment Co., Ltd. The remaining authors declare that the research was conducted in the absence of any commercial or financial relationships that could be construed as a potential conflict of interest.
References
- Liang, N.; Lan, F.; Zhuang, Y. Current Situation and Existing Problems of Urban Utility Tunnel Construction. J. Undergr. Space Eng. 2020, 16, 1622–1635. [Google Scholar]
- Huang, C. Study on Seismic Response of Precast Utility Tunnel with Upper and Lower Assembly; South China University of Technology: Chengdu, China, 2018. [Google Scholar]
- Fan, F. Study on Evolution and Repair Mechanism of Structural Crack Damage and Leakage in Urban Underground Integrated Pipeline Gallery; Shandong Jianzhu University: Jinan, China, 2022. [Google Scholar]
- Mao, Q. Finite Element Analysis and Experiment Study on Mechanical Properties of Precast Utility Tunnel Joints; Huazhong University of Science and Technology: Wuhan, China, 2021. [Google Scholar]
- Zhu, B.; Chen, L.; Du, X. Application of Shield Method to Utility Tunnel on Huagong Road in Harbin. Tunn. Constr. 2019, 39, 459–464. [Google Scholar]
- Chen, J. Application of Shield Utility Tunneling in Existing Urban Downtown. Munic. Eng. Technol. 2019, 37, 192–194, 223. [Google Scholar]
- Dong, L. Study on the Influence of the Staggered Segment of Shield Tunnel on the Mechanical Properties of Tunnel; Shenyang Jianzhu University: Shenyang, China, 2021. [Google Scholar]
- Peng, Y.; Ding, W.; Yan, Z.; Huang, X.; Xiao, B. Analysis and calculation method of effective bending rigidity ratio in the modified routine method. Chin. J. Geotech. Eng. 2013, 35, 495–500. [Google Scholar]
- Zeng, D.; He, C. Comparison and Analysis Research of Different Shield Tunnel Lining Internal Forces Design Methods. Chin. J. Undergr. Space Eng. 2005, 1, 707–712. [Google Scholar]
- Zhu, H.; Tao, L. Study on Two Beam-spring Models for the Numerical Analysis of Segments in Shield Tunnel. Rock Soil Mech. 1998, 19, 26–32. [Google Scholar]
- Huang, Z. Study on the Mechanical Behavior of Segmental Lining of Shield Tunnel Based on Shell-Spring Model; Hohai University: Nanjing, China, 2007. [Google Scholar]
- Zhu, W.; Huang, Z.; Liang, J. Studies on shell-spring design model for segment of shield tunnels. Chin. J. Geotech. Eng. 2006, 28, 940–947. [Google Scholar]
- Dong, X.; Xie, F. Analytical solution of segment joint model for segmented tunnel lining. Chin. J. Geotech. Eng. 2013, 35, 1870–1875. [Google Scholar]
- Wang, H.; Gao, X.; Li, P.; Jia, Z. Analysis of compressive bending capacity in bolted circumferential joint of shield tunnels. J. Beijing Jiaotong Univ. 2022, 46, 114–122. [Google Scholar]
- Liu, X.; Zhang, C. Investigation on the ultimate bearing capacity of longitudinal joints in segmental tunnel lining. China Civ. Eng. J. 2016, 49, 110–122. [Google Scholar]
- Yu, H.; Cai, C.; Bobet, A.; Zhao, X.; Yuan, Y. Analytical solution for longitudinal bending stiffness of shield tunnels. Tunn. Undergr. Space Technol. 2019, 83, 27–34. [Google Scholar] [CrossRef]
- Shi-ping, G.E.; Dong-wu, X.I.; Wen-qi, D.I.; Wen-biao, O.U. Simplified numerical simulation method for segment joints of shield tunnels. Chin. J. Geotech. Eng. 2013, 35, 1600–1605. [Google Scholar]
- Wang, F. Study on Mechanical Properties of Segment Lining Structure for Medium and Small Diameter Shield Tunnel; Southwest Jiaotong University: Chengdu, China, 2018. [Google Scholar]
- Zhao, Q. Study on Three Dimensional Numerical Modeling Method of Shield Tunnel and Mechanical Properties of Lining; Southwest Jiaotong University: Chengdu, China, 2017. [Google Scholar]
- Zhang, L.; Feng, K.; He, C.; Xu, P.K.; Zhang, J.X.; Liao, C.T. Three-dimensional Refined Numerical Simulation of Segmental Joint of Shield Tunnel. Tunn. Constr. 2020, 40, 1169–1175. [Google Scholar]
- Zeng, D.; He, C. Numerical Simulation of Segment Joint Bending Stiffness of Metro Shield Tunnel. J. Southwest Jiaotong Univ. 2004, 39, 744–748. [Google Scholar]
- Liu, S.-J.; Feng, K.; He, C.; He, Z.-S. Study on the Bending Mechanical Model of Segmental Joint in Shield Tunnel with Large Cross-section. Eng. Mech. 2015, 32, 215–224. [Google Scholar]
- Xu, G.; Wang, S.; Wang, D. Shell-Spring-Contact-Ground Model Based on Segment Joint Stiffness Nonlinearity. Eng. Mech. 2016, 33, 158–166. [Google Scholar]
- Tian, L.G.; Wang, X.; Cheng, Z.L. Numerical Study on the Fracture Properties of Concrete Shield Tunnel Lining Segments. Geofluids 2021, 2021, 9975235. [Google Scholar] [CrossRef]
- Epel, T.; Mooney, M.A.; Gutierrez, M. The influence of face and shield annulus pressure on tunnel liner load development. Tunn. Undergr. Space Technol. 2021, 117, 104096. [Google Scholar] [CrossRef]
- Blom CB, M.; Van der Horst, E.J.; Jovanovic, P.S. Three-dimensional structural analyses of the shield-driven “Green Heart” tunnel of the high-speed line South. Tunn. Undergr. Space Technol. 1999, 14, 217–224. [Google Scholar] [CrossRef]
- Zhang, H.; Lei, M.; Liu, L.; Li, Y.; Tang, Q.; Wang, L. Study on the influence law of underpass construction of new tunnel on the disturbance of existing upper shield tunnel. J. Railw. Sci. Eng. 2020, 17, 396–404. [Google Scholar]
- Huang, Z.; Liao, S.; Hou, X. Research on Shear Model of Ring Joint Bolts in Stagger-Jointed Segmental Linings. Chin. J. Rock Mech. Eng. 2004, 23, 952–958. [Google Scholar]
Disclaimer/Publisher’s Note: The statements, opinions and data contained in all publications are solely those of the individual author(s) and contributor(s) and not of MDPI and/or the editor(s). MDPI and/or the editor(s) disclaim responsibility for any injury to people or property resulting from any ideas, methods, instructions or products referred to in the content. |
© 2024 by the authors. Licensee MDPI, Basel, Switzerland. This article is an open access article distributed under the terms and conditions of the Creative Commons Attribution (CC BY) license (https://creativecommons.org/licenses/by/4.0/).