Article

Spatial Variation Characteristics of Housing Conditions in China

1
Faculty of Geography, Yunnan Normal University, Kunming 650500, China
2
International Business School, Yunnan University of Finance and Economics, Kunming 650221, China
3
Guangzhou Institute of Geography, Guangdong Academy of Sciences, Guangzhou 510070, China
*
Author to whom correspondence should be addressed.
Buildings 2023, 13(8), 2028; https://doi.org/10.3390/buildings13082028
Submission received: 28 June 2023 / Revised: 21 July 2023 / Accepted: 27 July 2023 / Published: 9 August 2023
(This article belongs to the Special Issue Trends in Real Estate Economics and Livability)

Abstract

:
The evaluation of housing conditions is a crucial aspect of determining the well-being of residents and the sustainable development of settlements. Assessing housing conditions at a macro-level is imperative to understand the differences in well-being and livability among residents in various regions within a country. Unfortunately, the spatial variation characteristics of housing conditions in China have not been extensively studied at the county scale. Thus, this study examines the housing conditions in China by using 2846 counties as the basic research unit. A housing condition evaluation index system, comprising seven indicators, is constructed based on three aspects: housing spaciousness, internal facilities, and elevator configuration. The entropy value method is used to determine the weights of the indicators, and the spatial difference patterns and spatial autocorrelation characteristics of the housing conditions and types of housing conditions in China are analyzed. The correlation analysis method is used to analyze the correlation between the subtypes of housing conditions and county fundamentals (population density, urbanization, foreign population, and rental housing). The results show that: (1) the configuration of elevators is the most important indicator of the differences in housing conditions in China; (2) the better housing conditions in China are distributed on the southeast side of the “Hu Line”, while the worse areas are distributed on the northwest side of the “Hu Line”, showing significant spatial clustering characteristics, while the distribution of the different subtypes of housing conditions and their distribution in the H–H and L–L zones also have significant variability; (3) housing conditions in China’s urban areas are generally better than those in non-urban areas, and the internal infrastructure conditions of urban housing and the degree of elevator configuration are better than those in non-urban areas; and (4) the correlation between housing conditions and county fundamentals varies depending on the regional level. At the national and urban levels, a negative correlation exists between county fundamentals and housing spaciousness, although a positive correlation exists with internal infrastructure and elevator configuration. Urbanization has the greatest impact on housing conditions in these areas. In non-urban areas, there is significant variability in the correlation between county fundamentals and housing conditions.

1. Introduction

Housing is a fundamental issue that determines the sustainable development of cities and regions. Improving the housing conditions of residents and their well-being, and building sustainable settlements, is an important approach toward sustainable development and a continuous effort in many countries around the world. Housing conditions are highly correlated with health, public safety, and life satisfaction [1,2,3]. With rapid economic development, housing conditions have become significantly differentiated across regions and the instability of housing conditions has increased, which has led to increased differentiation between groups with different socioeconomic backgrounds [4], highlighted by health inequalities [5], violent crime risk differences [6], and residential energy differences [7,8]. This reduces the well-being and identity of the population and exacerbates the instability of social development. Housing conditions are the most important factors affecting physical health [9] and residential satisfaction [10,11], and they are the core evaluation indicators for evaluating the livability of a city (or region) [12]. Indicators related to housing conditions also influence the level of housing prices or rents [13,14]. More importantly, housing conditions and sustainable development are closely related. Improving housing conditions is often considered an essential aspect of sustainable development, as it can contribute to residents’ well-being and the overall livability of cities and regions. Therefore, assessing housing conditions is crucial for understanding the social, economic, and environmental dimensions of the concept of “sustainability”. Therefore, conducting research on topics related to housing conditions is necessary. This is an important fundamental study of practical significance for building livable cities, solving urban problems, and promoting stable social development.
Housing conditions are an important topic in housing research [15]. It has been shown that spatial differences exist in housing conditions, mainly in the form of housing condition differentiation [16] and housing condition inequality [17], while the spatial clustering of such differential characteristics portrays the spatial structure of urban housing conditions [18]. The pattern of spatial differences in housing conditions is also an important entry point for reflecting the spatial structure of society [19] and the spatial structure of the housing market [20]. Therefore, research on spatial differences in housing conditions is fundamental and key to understanding their economic and social aspects. This research can be divided into two main areas: evaluation of housing conditions and factors influencing housing conditions. Morenikeji et al. used indicators such as housing type, decoration materials, water and electricity supply, and domestic toilet facilities to evaluate housing conditions in Nigeria and then analyzed their spatial patterns [21]; Li, Zhang, and Napiórkowska-Baryła et al. used indicators such as floor area per capita, number of bedrooms and number of users, and the presence of a living room or bathroom indicators, to assess housing conditions [10,22,23]; and Gu et al. proposed housing facilities, crowdedness, and housing tenure as indicators of housing conditions and then analyzed the spatial structure of housing conditions and health status in China [24]. In recent years, housing conditions have become a focus of attention during the COVID-19 global health crisis, with Tai et al. arguing that the spaciousness of indoor spaces and the configuration of indoor cleaning facilities affect residents’ health [25,26]. In their study, Zarrabi et al. pointed out that natural light, ventilation, and open or semi-open spaces are the housing conditions considered most important by residents [27]. Peters et al. suggested that healthy housing conditions should have a balcony, a living room, and a focus on proper ventilation, lighting, and landscaping [28]. Ahmad et al. evaluated the housing conditions of US counties and regions based on four indicators, namely, overcrowdedness, the high burden of the cost of housing, incomplete kitchen facilities, and incomplete plumbing facilities [29]. Thus, the evaluation indicators of housing conditions are diverse and rich, and the main focus is generally on the level of facilities and spaciousness. However, most housing in Chinese cities is dominated by multi-story and high-rise buildings, and the elevator configuration is also an important aspect when determining housing conditions, as evidenced by the case of the regeneration of old urban neighborhoods [30]. Few studies of existing housing conditions have focused on elevators. In terms of factors influencing housing conditions, Bhattacharjee et al. indicated that education, home ownership, and family preferences influence the housing conditions of refugee immigrants in Dallas, Texas [31]; Babalola used the three main indicators of socioeconomic characteristics, objective housing characteristics, and subjective variables as important predictors of housing conditions [32]; and Nieuwenhuis et al. examined the impact of housing policies on the housing conditions of single mothers in Europe [33]. In macro-scale studies of factors influencing housing conditions, urban (or regional) fundamentals (e.g., population, urbanization, employment, and so on) may be influential factors in relation to housing conditions.
China has a unique urban housing market [5], and its housing problem has been the focus of attention in all sectors of society. The population of cities is increasing rapidly as urbanization continues to advance rapidly, generating a series of housing problems for the low- and middle-income classes and the mobile population [34,35,36], and conducting research on urban housing conditions in response to the current housing problems in China is necessary. Studies of housing conditions in China have mainly focused on housing conditions and health [5,24,37], housing conditions and satisfaction [10,38], housing conditions and the mobile population [39,40], and housing condition evaluation [41]. However, there is a lack of research on the spatial patterns of housing conditions in China at the county level, which is crucial for understanding and improving housing conditions.
To address this gap in the literature, further studies are necessary to address various issues, such as the differences in housing conditions across China, the characteristics of the spatial patterns of various types of housing conditions, discrepancies between urban and non-urban areas, and the relationship between housing conditions and county fundamentals. These inquiries require further studies and responses from the academic community. Thus, based on 2846 county-level research units, this paper constructs a comprehensive evaluation system for housing conditions in three aspects: spaciousness, internal infrastructure, and elevator configuration; analyzes the differences in housing conditions in China; derives the characteristics of spatial differences in housing conditions in China; and further analyzes the relationship between housing conditions and county fundamentals in China. Compared with previous studies, the innovation points and progress of this study are as follows. First, this study extends the connotation of housing condition evaluation by including elevator configuration into the evaluation system, which is more consistent with the actual housing conditions in China. Second, in terms of such large-scale evaluation of housing conditions in China, this study takes county-level administrative regions as the basic evaluation unit, which is more refined than previous studies’ research units. Third, this study analyzes the relationship between housing conditions in China and county fundamentals (e.g., population density, urbanization, proportion of foreign population, and proportion of rental housing). Fourth, this study is concerned with the variability of housing conditions between urban and non-urban areas, which has been overlooked in previous studies. Through its findings, this study expects to provide a new perspective on the study of housing conditions at the macro scale, a new empirical case for the topic of the spatial pattern of housing conditions in China and a basic reference for the regional differentiation of housing policy formulation in China.
The remainder of the paper proceeds as follows. Section 2 provides a detailed description of the materials as well as the methodology of this paper, Section 3 presents the results of this study and their analyses, Section 4 is the discussion section of this paper, and Section 5 presents the conclusions, policy implications, and outlook for future research.

2. Materials and Methods

2.1. Study Area and Data Sources

Counties (including counties, districts, county-level cities, banners, special zones, and forest areas) were used as the study units (hereafter referred to as county-level units), with a total of 2846 (Figure 1), and the study area did not comprise the Hong Kong SAR, Macao SAR, or Taiwan Province. The data were obtained in 2020. The original data were mainly obtained from the 2020 China Population Census Sub-County Information. Among them, districts are municipal districts of municipalities directly under the central government, sub-provincial cities, and prefecture-level cities, with urban functional territories as the main focus, which are referred to as urban areas.

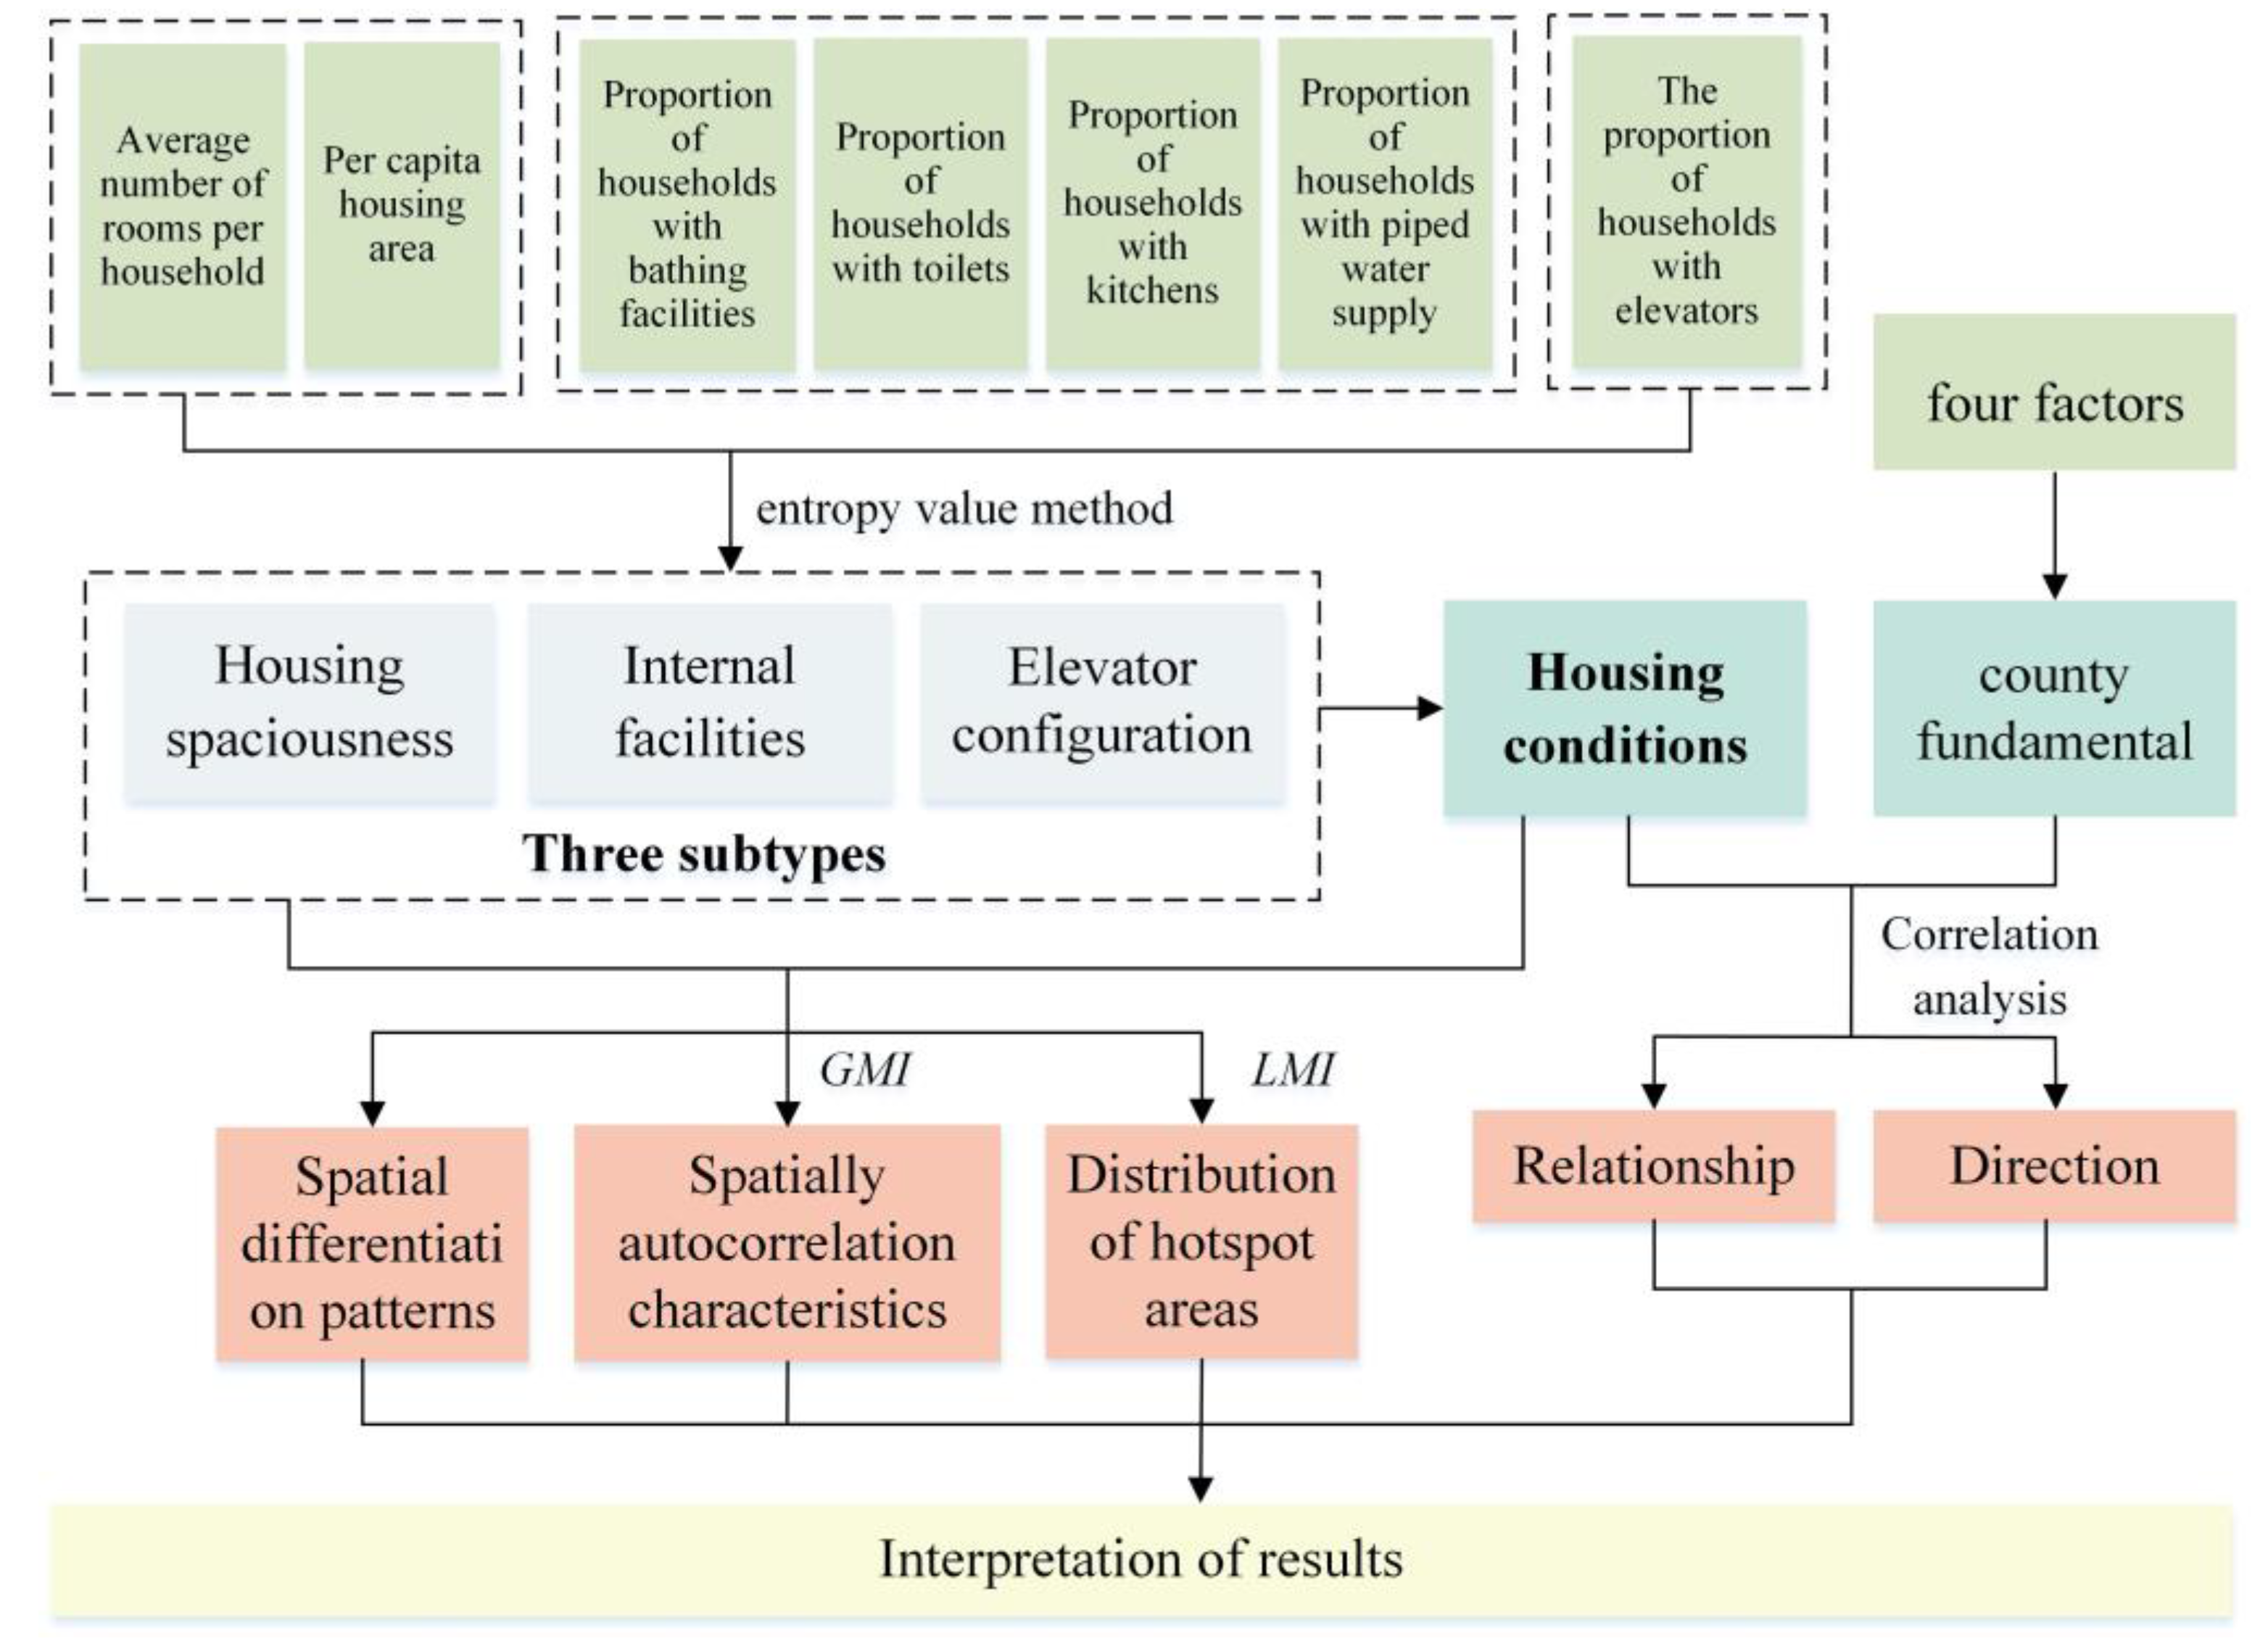
2.2. Research Design

The specific analysis process of this paper is as follows (Figure 2). First, we construct a comprehensive evaluation index system of China’s housing conditions, including seven indicators from the aspects of housing spaciousness, internal facilities, and elevator configuration. Second, this study adopts the entropy value method to determine the weights of the seven indicators, after which it calculates the total score of China’s county housing conditions and its three subtypes of scores. Then, we analyze the patterns of spatial differentiation in China’s housing conditions. Third, spatial autocorrelation analysis is conducted to identify the spatial autocorrelation characteristics and the distributions of hotspot areas of housing conditions throughout China. Then, we use correlation analysis to explore the relationship and the direction between the county fundamentals and the three subtypes of housing conditions in China. Finally, we draw conclusions, discuss them, and raise policy implications.

2.3. Comprehensive Evaluation System of Housing Conditions

Based on the principles of systematicity, validity, and accessibility of data, the housing conditions of residents in county-level units in China are evaluated comprehensively in three aspects: spaciousness of housing, internal infrastructure, and elevator configuration. Among them, spaciousness is evaluated by the average number of rooms per household and housing floor area per capita, for example, indicators such as the floor area per capita, number of bedrooms, and number of occupants have been used to assess housing conditions in prior studies, e.g., [10,23]. Internal infrastructure is mainly reflected by the configuration of piped running water, as well as kitchen, toilet, and bathing facilities. Indicators such as finishing materials, water and electricity supply, and household toilet facilities were used to evaluate housing conditions in Nigeria in past studies, e.g., [21,22]. The configuration of elevators is based on the ratio of the number of households with elevators in the building where the housing is located. The elevator configuration is an important aspect of housing convenience; housing with elevators is more convenient for residents to go up and down, wherein housing conditions are better (Table 1 and Figure 3).

2.4. Determination of Indicator Weights of Housing Conditions Using the Entropy Method

The use of the entropy method to determine weights eliminates the subjective factor of weight determination. The meaning of information entropy in social systems mainly refers to the measure of the degree of uncertainty of the system state. The higher the value of information entropy, the more balanced the system structure is and the smaller the variation; conversely, the more unbalanced the system structure is and the larger the variation is. According to the size of the entropy value of each indicator of housing conditions, the degree of variation is calculated and the weight is determined, and the main steps are [42]:
Standardization of the housing condition single indicator scores:
c i j = ( S i j S j min ) / ( S j max S j min )
Calculation of the weight of the score value of the jth housing condition evaluation indicator for the ith county unit:
C i j = c i j / i = 1 n c i j
Calculation of the indicator information entropy:
e j = 1 ln n i = 1 n ( C i j × ln C i j ) ,   0 e j 1
Information redundancy:
d j = 1 e j
Indicator weights:
W j = d j / i = 1 m d j
Total housing condition score for the i-th county unit:
H C S i = j = 1 m ( W j × S i j )
where Sij is the score value of the jth housing condition evaluation index of county i, Sjmax and Sjmin are the maximum and minimum values of the matrix column where the jth evaluation index is located, n is the number of counties, m is the number of evaluation indexes, and the larger the score value of the housing condition HCSi is, the better the housing condition would be. This method can be applied to the evaluation of the total score of comprehensive housing conditions as well as the score of each subsystem of housing conditions (e.g., housing spaciousness or internal facilities).

2.5. Exploring the Spatial Clustering Characteristics of Housing Conditions Based on Spatial Autocorrelation

Housing conditions in neighboring counties are generally spatially related and spatially correlated. The global autocorrelation index (GMI) and local autocorrelation index (LMI) can quantify the degree of spatial correlation and spatial pattern of housing conditions in China. The GMI is expressed as follows [43]:
G M I = i = 1 n j = 1 n ( H C S i H C S ¯ ) ( H C S j H C S ¯ ) / Q 2 i = 1 n j = 1 n w i j
where HCSi is the residential housing condition score of the ith county, wij is the spatial weight matrix of each county, and the distance between counties within the set threshold distance is 1, and greater than that the distance is 0.
Q 2 = i = 1 n ( H C S i H C S ¯ ) 2 / n , Z-test value: Z ( G ) = G E ( G ) V a r ( G ) , where Var(G) is the variance and E(G) is the mathematical expectation of the housing condition score. If the Z value is significant, it indicates a pattern of spatial clustering of housing conditions in China.
Local autocorrelation between counties often tends to occur based on the global autocorrelation of housing conditions. Therefore, local autocorrelation is measured using the LMI, which can be expressed as follows [44]:
L M I = w i j Z i Z j
where w′ij is the row standardization of wij, and Zi and Zj are the standardized values of the housing condition scores. At less than a 0.05 significance level, if Ii and Zi are positive at the same time, it means that the housing conditions of the ith county and its surrounding counties are better, i.e., high–high agglomeration (HH); similarly, if Ii is negative and Zi is positive, it is high–low agglomeration (HL); if Ii is positive and Zi is negative, it is low–low agglomeration (LL); while if both Ii and Zi are negative, it is low–high agglomeration (LH).

2.6. The Relationship between Housing Conditions and County Fundamentals

Three subtypes of housing condition evaluation indicators (spaciousness, internal infrastructure, and elevator configuration scores) are used as dependent variables, and four factors influencing county fundamentals (population density, urbanization, foreign population, and rental housing) are selected as independent variables in this study to investigate the relationship between housing conditions and county fundamentals in China. The population density is calculated by dividing the resident population by the administrative area, and the urbanization rate (%), the proportion of foreign population (%), and the proportion of rented households (%) are used as indicators of urbanization, foreign population, and rented housing, respectively. Furthermore, this study conducts the bivariate autocorrelation analysis using SPSS 22 (https://www.ibm.com/products/spss-statistics, accessed on 2 May 2023).
A bivariate correlation analysis can quantitatively explain the strength of the statistical relationships between variables and determine whether two variables are correlated with each other. The method is fitted by least squares, and the Pearson correlation coefficient is used to describe the degree and direction of the correlation between two variables, which is calculated as follows:
r X Y = i = 1 n ( X i X ¯ ) ( Y i Y ¯ ) i = 1 n ( X i X ¯ ) 2 i = 1 n ( Y i Y ¯ ) 2
where X and Y are the independent and dependent variables to be analyzed, X and Y are the means of the independent and dependent variables, i = 1, 2......n; rXY is the correlation coefficient, −1 ≤ rXY ≥ 1, when r > 0, it means that the two variables are positively correlated with each other; when r < 0, it means that the two variables are negatively correlated before. Here, r = 1 is completely correlated and r = 0 is no correlation.

3. Results and Analysis

3.1. Spatial Differentiation Patterns of Housing Conditions in China

Based on the information entropy method, the information entropies and weights of the seven indicators were calculated for 2846 counties in China (Table 2). The results show that PH_elevators has the highest weight of 0.593538, which is the most important indicator used to determine the inter-county differences in housing conditions in China, and also indicates that there are large differences in elevator configurations among various counties in China. Four indicators of internal facilities (PH_piped water, PH_kitchens, PH_toilets, and PH_bathing facilities) generally have lower weights, indicating that the internal facilities configuration of housing in China is generally better in 2020, and the disparity between counties is not large; therefore, the indicator of internal facilities is not the main indicator category that determines the difference between counties in China.
Based on the weights in Table 2, the housing condition scores of each county were derived. Based on the data distribution, the housing conditions in China were classified into five grades: good (0.3–0.85 points), better (0.2–0.3 points), average (0.15–0.2 points), poor (0.1–0.15 points), and poor (less than 0.1 points). Based on the aforementioned data, GIS technology was used to derive the spatial differentiation pattern of housing conditions in China (Figure 4). The figure shows that the regions with good housing conditions in China are mainly urban areas, while the regions with poor housing conditions are mainly in the northeast and parts of the Qinghai–Tibet Plateau and Xinjiang. The regions with better housing conditions are generally distributed on the southeast side of the “Hu Line” (Heihe–Tengchong Line), while on the northwest side of the “Hu Line”, housing conditions are relatively poor.
The pattern of the spatial differences in housing conditions (spaciousness, internal infrastructure, elevator configuration) of the different subtypes was further analyzed (Figure 4), and the way the housing conditions of different classes of subtypes were divided is shown in the legend of Figure 5. A significant difference exists in the pattern of housing conditions of different subtypes. In terms of the spaciousness of housing (Figure 5a), it shows a difference pattern of high in the south and low in the north. In terms of internal facilities (Figure 5b), the scores of housing internal facilities in Northeast China, Inner Mongolia, Shanxi, and the Qinghai–Tibet Plateau are relatively low, while the rest of the regions have high scores. In terms of elevator configuration (Figure 5c), the elevator configuration scores in urban areas are generally higher than those in non-urban areas, showing a difference between urban and non-urban areas.

3.2. Spatial Autocorrelation Characteristics and the Distribution of Hotspot Areas of Housing Conditions in China

The spatial association and clustering characteristics of the housing conditions and their subtypes in China were judged based on Moran’s I index. The FD method (fixed distance) was used as the basis for judging the spatial weight matrix, and the threshold distance was set to 150 km, while Moran’s I index and the Z-score and p-value derived from its expected value were derived as shown in Table 3.
Table 3 shows that Chinese residents’ housing conditions generally show significant spatial clustering characteristics. Among them, housing spaciousness, a subtype of housing conditions, has the most significant spatial clustering characteristics, with Moran’s I reaching 0.4316. Based on this, the local spatial autocorrelation characteristics of the housing conditions and its subsystems are judged based on the LMI (Figure 6).
Figure 6a shows that the H–H zone of the housing spaciousness score is mainly concentrated in the southern region of China (Fujian–Jiangxi–Hunan–Guizhou–Guangxi–Yunnan, and western Hubei, western Sichuan, and southern Tibet) and in the northern region of Henan Province, while the L–L zone is concentrated in the northeast region—northern China, the Yangtze River Delta, Pearl River Delta, Shandong Peninsula, Hainan Province, Xinjiang’s northern part, and the Sichuan–Qinghai border.
Figure 6b shows that the H–H zones of the internal facilities score are significantly clustered in China’s eastern and central regions (except Shanxi). Guangxi, Chongqing, central Sichuan, central Yunnan, and western Xinjiang in the western region also show H–H clustering characteristics. L–L areas are clustered in the northeast region—Inner Mongolia, Shanxi, northern Shaanxi, southern Gansu, Qinghai, and southern Tibet, showing a concentrated contiguous distribution.
Figure 6c shows that the H–H zones of the elevator configuration scores are mainly distributed in city clusters and metropolitan areas, including the Yangtze River Delta city cluster, Pearl River Delta city cluster, Chengdu–Chongqing city cluster, West Coast city cluster, Liaoning–China-South city cluster, Beijing–Tianjin metropolitan area, Wuhan metropolitan area, and Urumqi metropolitan area.
In terms of the comprehensive housing conditions (Figure 6d), the H–H zones are (1) five urban agglomerations: the Yangtze River Delta urban agglomeration, the Pearl River Delta urban agglomeration, the West Coast urban agglomeration, the Central Plains urban agglomeration, and the Changsha–Zhuzhou–Xiangtan urban agglomeration; and (2) the Beijing–Tianjin metropolitan area, the Wuhan metropolitan area, the Chengdu metropolitan area, and the Chongqing metropolitan area. The L–L zones are mainly located in the northeastern and western regions.

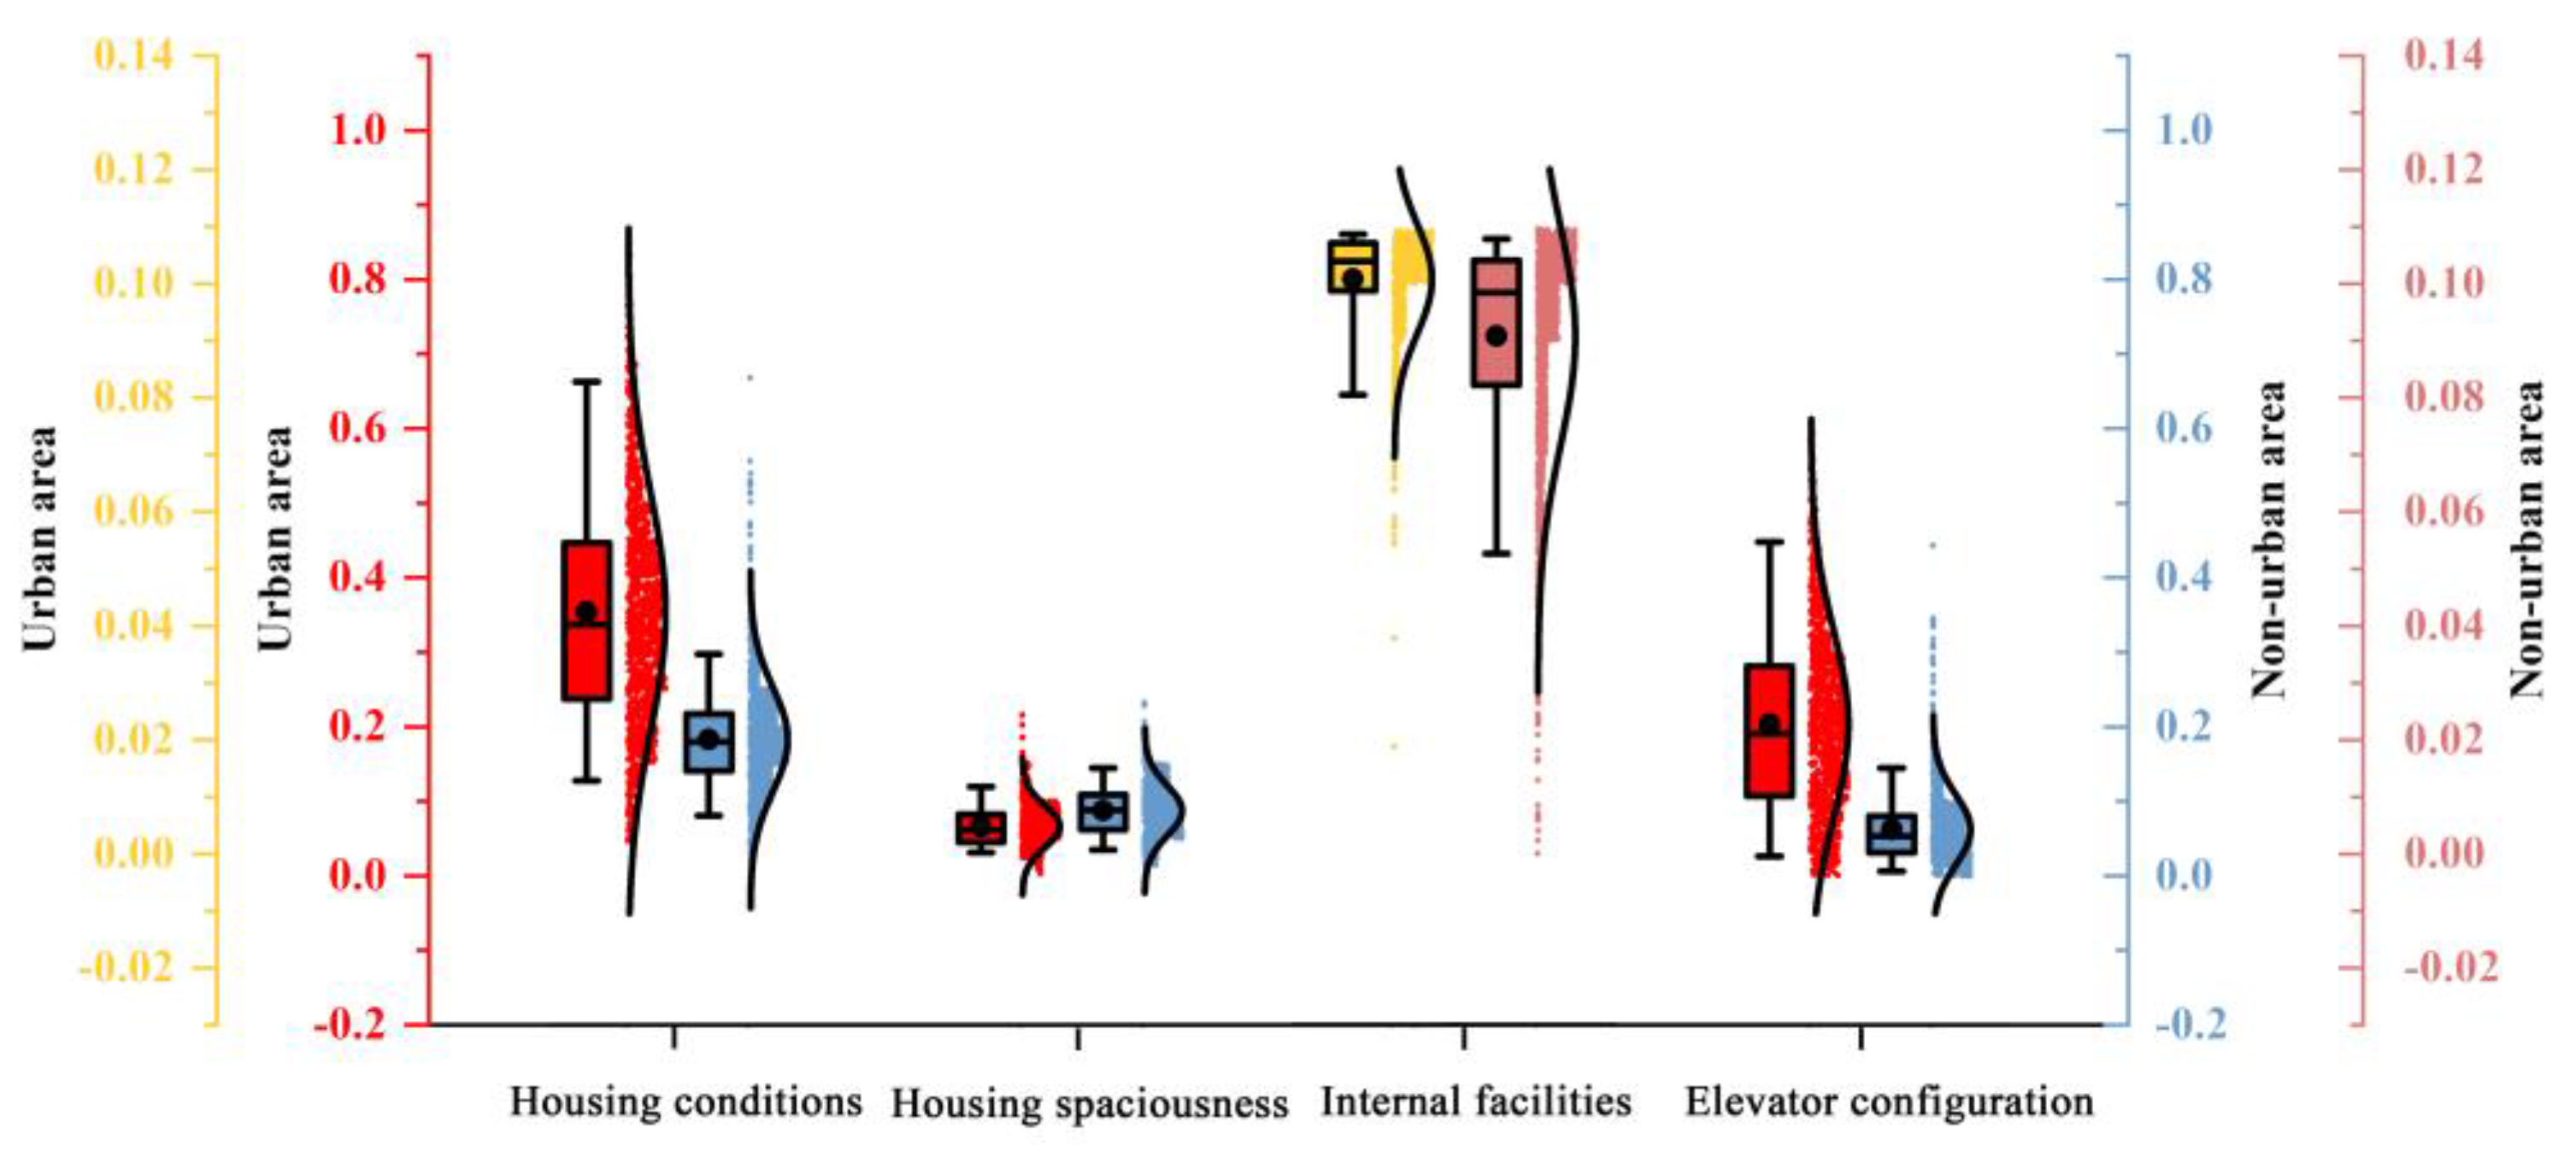
3.3. Differences in Housing Conditions between Urban and Non-Urban Areas in China

Using whether the study unit was a municipal district as the judgment criterion, the county unit was divided into two sub-regions, urban and non-urban, to compare the differences in housing conditions between urban and non-urban areas of China. The mean scores of the urban and non-urban housing conditions are shown in Table 4, and the box plots are shown in Figure 7. Housing conditions in urban areas of China are generally better than those in non-urban areas, and in terms of housing spaciousness, the housing sizes in the latter areas are more spacious than those in the former due to the higher number of commercial housing units and the limited land supply in urban areas. However, most of the housing units in non-urban areas are self-built and have a much larger housing stock. In terms of internal facilities, the average score of urban houses is higher than that of non-urban houses, indicating a higher degree of internal facility improvement in urban housing. Similarly, in terms of the elevator configuration, urban housing shows a significantly better configuration than non-urban housing. This can be attributed to the fact that urban areas have a high number of high-rise dwellings and a high proportion of lifts allocated to them, which is why urban areas have a higher lift allocation score.
As shown in Figure 7, the housing condition scores, internal facilities scores, and elevator configuration scores are generally higher in urban areas than in non-urban areas, with a relatively dispersed data distribution. Furthermore, the housing spaciousness in urban areas is lower than in non-urban areas, with a relatively concentrated data distribution.

3.4. Relationship between Housing Conditions and County Fundamentals in China

Using SPSS 22 software (https://www.ibm.com/products/spss-statistics, accessed on 2 May 2023), a bivariate correlation analysis was used to analyze the four influencing factors and three subtypes of housing conditions indicators containing 1846 county units according to all the counties, urban areas, and non-urban areas, respectively, to derive the correlation coefficients, and a two-sided test was conducted using the t-test method, defining a test value less than 0.01 as a significant correlation, and the results are shown in Table 5 below.
For all the counties (with a sample of 2846 counties), the correlations between the three housing condition subtype scores, housing spaciousness, internal facilities, and elevator configuration, and the four county fundamentals factors are shown in Figure 6.
Table 5 and Figure 8 show that housing conditions are significantly correlated with county fundamentals at the national level, and that the four factors act in different directions on housing conditions. Among them, the most significant correlation between elevator allocation and county fundamentals is positive, with the magnitude of the correlation coefficients of the four factors—urbanization, renter households, floating population and population density—being 0.724, 0.535, 0.505, and 0.484, in that order; a significantly positive correlation exists between housing interior facilities and county fundamentals, with urbanization having the strongest effect on interior infrastructure; while a significantly negative correlation exists between housing spaciousness and county fundamentals, indicating that all four influencing factors of county fundamentals have a significant negative effect on housing spaciousness, with urbanization (−0.473) and renter households (−0.380) ranking as the top two in terms of the impact intensity.
A significant correlation exists between housing conditions and county fundamentals at the urban level. Housing spaciousness and county fundamentals are significantly negatively correlated, with the strongest correlation between housing spaciousness and urbanization, with a correlation coefficient of 0.670, indicating that urbanization has the greatest effect on housing spaciousness, and the higher urbanization has a relatively narrow housing size. Internal infrastructure and elevator configuration are positively correlated with county fundamentals, with urbanization having the most significant effect on housing internal infrastructure and elevator configuration. Thus, this shows that the urbanization rate has a greater impact on housing conditions in urban areas. On the one hand, the urbanization rate has a negative impact on housing spaciousness. On the other hand, the urbanization rate has a positive effect on housing internal infrastructure and elevator configuration.
At the non-urban level, large variability exists between county fundamentals and housing conditions, with varying degrees as well as directions of correlation. The correlation between housing internal infrastructure and county fundamentals differs, with a negative correlation with renter households and a positive correlation with the rest of the factors, and the strengths of population density (0.335) and urbanization (0.296) ranked as the top two; county fundamentals and elevator allocation were positively correlated, with the strengths of urbanization, population density, floating population, and renter households in that order.

4. Discussion

Previous studies have neglected the importance of elevator configuration in determining housing conditions between counties in China. However, we recognize that elevators are an indispensable indicator of evaluating housing conditions, especially in the context of China’s recent construction boom in multi-story and high-rise buildings. Elevators have a significant impact on housing conditions as an important facility for vertical transportation, especially in medium and high-rise dwellings. This result is similar to the findings of Au-Yong et al. [45] regarding the maintenance of lift systems in high-rise dwellings in Malaysia and of Kshetrimayum et al. [46] regarding the evaluation of housing conditions in the slums of Mumbai, and it should not be ignored in future studies.
Currently, the impact of internal facilities such as piped water, kitchens, toilets, and bathing facilities on housing conditions is limited as they have become a standard configuration in housing for Chinese residents due to improved living standards and economic and social development. Consequently, regional differences in these indicators are not significant, and they have become less important in evaluating housing conditions in China compared to previous studies.
To evaluate housing conditions accurately, it is important to consider the variations between urban and non-urban areas. This aspect often goes unnoticed in existing studies due to the stark differences in housing types between the two. Non-urban areas typically have a higher percentage of rural owner-occupied housing, whereas urban areas are dominated by commercial housing such as multi-story and high-rise buildings. Consequently, housing conditions vary greatly between these two subtypes and should be analyzed separately.
When analyzing the factors that influence housing conditions, considering the correlation between different subtypes of housing conditions and county fundamentals is important. For instance, the internal infrastructure of housing and elevator configuration show a positive correlation with county fundamentals, whereas the correlation between housing spaciousness and county fundamentals is in a different direction. This highlights the importance of using subtype indicators when studying the factors related to regional differences in housing conditions in China.
One limitation of this study is the difficulty in accurately distinguishing between commercial housing (mainly multi-story and high-rise) and self-built housing (mainly low-rise) when assessing housing conditions. This may affect the scores given to housing conditions, as factors such as the presence of elevators in commercial buildings or the spaciousness of self-built homes may not be fully accounted for. In addition, in the comprehensive evaluation index system for housing conditions, this study did not consider sustainability indicators, such as green and energy-saving as well as intelligent building indicators. Thus, we expect that this will be improved in future studies.

5. Conclusions and Policy Implications

5.1. Main Conclusions

This study examines the various housing conditions and subtypes in county units in China, and it investigates the correlation between housing conditions and county fundamentals. Elevator allocation is included in the comprehensive evaluation system for housing conditions. Chinese counties are used as the study units. The study also distinguishes between urban and non-urban subtypes, and it analyzes the relationship between housing conditions and county fundamentals such as population density, urbanization, proportion of floating population, and proportion of renter households. This study’s contribution lies in its comprehensive approach toward evaluating housing conditions and its focus on Chinese counties as a unique study unit.
The following conclusions were obtained from this study. (1) The configuration of elevators is the most important indicator of the differences in housing conditions in China. (2) According to this research, areas with better housing conditions are primarily located on the southeast side of the “Hu Line,” whereas areas with worse housing conditions are located on the northwest side. Variations exist in the distribution of the different subtypes of housing conditions. Chinese residents’ overall housing conditions exhibit significant spatial clustering characteristics, and there are notable differences in the distribution of different subtypes of high–high (H–H) and low–low (L–L) zones. (3) Housing conditions in China’s urban areas are generally better than those in non-urban areas. (4) The correlation between housing conditions and county fundamentals varies depending on the regional level. At the national level, a negative correlation exists between county fundamentals and housing spaciousness, although a positive correlation exists with internal infrastructure and elevator allocation. (5) Housing conditions vary considerably between urban and non-urban areas: urban housing has better internal facilities and elevators are better equipped than in non-urban areas; however, it is typically less spacious than in non-urban areas. At the urban level, a negative correlation exists between county fundamentals and housing spaciousness, although positive correlations are observed with internal infrastructure and elevator allocation. Furthermore, urbanization has the strongest effect on housing conditions. However, at the non-urban level, there is greater variability in the correlation between county fundamentals and housing conditions. The results also indicate a positive correlation between county fundamentals and elevator configuration, as well as a correlation of varying direction and strength with housing spaciousness and internal facilities.
This study examines the spatial differences in housing conditions in China and their correlation with county fundamentals. The findings offer valuable insights for future studies of housing conditions in China and the development of targeted housing policies.

5.2. Policy Implications and Perspectives

5.2.1. Policy Implications

Based on the conclusions of this study, it is recommended that the relevant management authorities improve housing conditions in China in the following ways. (1) In non-urban areas, the level of the internal infrastructure configuration of typical housing and buildings with more than six floors must be increased. All of them should be equipped with lifts so as to improve accessibility to vertical transportation. (2) In urban areas, especially in the downtown areas of large cities that are usually congested with city dwellers, the housing supply should be increased and the number of rooms per capita and per household should be raised. These goals can be achieved through urban renewal and efforts to encourage the population to move to the suburbs, thereby increasing the per capita living area and the average number of rooms per household. Ultimately, these will alleviate housing congestion. (3) In old urban areas, urban renewal should be actively promoted, which can be achieved through the renovation of facades, the installation of lifts, and through the adoption of new building technologies, energy-saving technologies, and smart technologies. Doing so can comprehensively remediate the living conditions of the housing stock, thus avoiding the old towns degenerating into slums and high-crime-risk zones in the future. (4) The housing conditions in the northwestern part of the Hu line must be actively improved through various measures, such as improving the conditions of the existing housing infrastructure and increasing the living comfort through the restoration and renewal of the old houses. Furthermore, housing conditions can be improved by rebuilding high-standard and modernized housing in different locations through resettlement.

5.2.2. Research Perspectives

In terms of research directions, future studies could be conducted in the following areas. (1) Future studies can investigate the differences in housing conditions among different housing types (e.g., commercial and self-built housing). Such studies could benefit from more precise data that allow for a separate analysis of commercial and self-built housing. (2) Although there are major differences between the housing within the built-up urban areas and the housing within rural geographies, it is difficult to distinguish between them using the current data. Therefore, in the future, we should further distinguish between urban and rural areas, study housing conditions in these areas separately, and propose countermeasures to improve the housing conditions accordingly. (3) In terms of the evaluation index system for housing conditions, more attention should be paid to sustainability indicators, such as intelligent building indicators and green and energy-saving building indicators. (4) Due to China’s vast geographical scope and widely varying features, the strong spatial heterogeneity of the factors affecting housing conditions can be further investigated. This can be achieved by using geographically enhanced regression to analyze the relationship between housing conditions and county-level fundamentals.

Author Contributions

Conceptualization, Y.W. (Yang Wang), Y.Y. and H.Z.; methodology, Y.Y. and X.Y.; software, Y.W. (Yang Wang) and X.Y.; validation, Y.Z., Y.W. (Yingmei Wu) and H.Z.; formal analysis, Y.W. (Yang Wang), Y.Y., X.Y. and Y.Z.; investigation, Y.W. (Yang Wang) and Y.Y.; resources, Y.W. (Yang Wang), Y.Y., Y.Z. and H.Z.; data curation, X.Y. and Y.Z.; writing—original draft preparation, Y.W. (Yang Wang), Y.Y. and X.Y.; writing—review and editing, Y.W. (Yang Wang), Y.Y., Y.W. (Yingmei Wu) and H.Z.; visualization, X.Y. and Y.Z.; supervision, Y.W. (Yang Wang), Y.W. (Yingmei Wu) and H.Z.; project administration, Y.W. (Yang Wang), Y.Y. and H.Z.; funding acquisition, Y.W. (Yang Wang), Y.Z. and H.Z. All authors have read and agreed to the published version of the manuscript.

Funding

This research was funded by the National Natural Science Foundation of China (No. 41871150; 42101278), Yunnan Fundamental Research Projects (Grant No. 202301AT070062; 202201AT070039), Yunnan Province Innovation Team Project (202305AS350003), and Yunnan Fundamental Research Projects (Coordinated Development of Urbanization and Ecological Environment, Grant No. 202305AP350041).

Data Availability Statement

Not applicable.

Conflicts of Interest

The authors declare no conflict of interest.

References

  1. Huang, J.; Kwan, M.P. Associations between COVID-19 risk, multiple environmental exposures, and housing conditions: A study using individual-level GPS-based real-time sensing data. Appl. Geogr. 2023, 153, 102904. [Google Scholar] [CrossRef] [PubMed]
  2. Cartagena Farias, J.; Brimblecombe, N.; Hu, B. Early onset of care needs in the older population: The protective role of housing conditions. Health Place. 2023, 81, 103007. [Google Scholar] [CrossRef] [PubMed]
  3. Soma, H.; Sukhwani, V.; Shaw, R. An approach to determining the linkage between livelihood assets and the housing conditions in urban slums of Dhaka. J. Urban Manag. 2022, 11, 23–36. [Google Scholar] [CrossRef]
  4. Agyekum, B. Adult student perspectives toward housing during COVID-19. Wellbeing Space Soc. 2022, 3, 100086. [Google Scholar] [CrossRef]
  5. Nie, P.; Clark, A.E. Income-related health inequality in urban China (1991–2015): The role of homeownership and housing conditions. Health Place 2022, 73, 102743. [Google Scholar] [CrossRef]
  6. Tacoli, C.; Satterthwaite, D. Gender and urban change. Environ. Urban. 2013, 25, 3–8. [Google Scholar] [CrossRef] [Green Version]
  7. Haddad, S.; Paolini, R.; Synnefa, A.; De Torres, L.; Prasad, D.; Santamouris, M. Integrated assessment of the extreme climatic conditions, thermal performance, vulnerability, and well-being in low-income housing in the subtropical climate of Australia. Energy Build. 2022, 272, 112349. [Google Scholar] [CrossRef]
  8. Graff, M.; Carley, S.; Konisky, D.M.; Memott, T. Which households are energy insecure? An empirical analysis of race, housing conditions, and energy burdens in the United States. Energy Res. Soc. Sci. 2021, 79, 102144. [Google Scholar] [CrossRef]
  9. Palacios, J.; Eichholtz, P.; Kok, N.; Aydin, E. The impact of housing conditions on health outcomes. Real Estate Econ. 2021, 49, 1172–1200. [Google Scholar] [CrossRef]
  10. Zhang, F.; Zhang, C.; Hudson, J. Housing conditions and life satisfaction in urban China. Cities 2018, 81, 35–44. [Google Scholar] [CrossRef]
  11. Ibem, E.O.; Aduwo, E.B. Assessment of residential satisfaction in public housing in Ogun State, Nigeria. Habitat Int. 2013, 40, 163–175. [Google Scholar] [CrossRef]
  12. Chakraborty, A.; Sharma, M.; Abhay, R.K. Colonial imprints in contemporary urban livability: An inter-ward analysis of Kolkata. GeoJournal 2023, 88, 543–559. [Google Scholar] [CrossRef]
  13. Wang, Y.; Wang, S.J.; Li, G.D.; Zhang, H.O.; Jin, L.X.; Su, Y.X.; Wu, K.M. Identifying the determinants of housing prices in China using spatial regression and the geographical detector technique. Appl. Geogr. 2017, 79, 26–36. [Google Scholar] [CrossRef]
  14. Wang, Y.; Wu, K.M.; Jin, L.X.; Huang, G.Z.; Zhang, Y.L.; Su, Y.X.; Zhang, H.O.; Qin, J. Identifying the spatial heterogeneity in the effects of the social environment on housing rents in Guangzhou, China. Appl. Spatial Anal. Policy 2021, 14, 849–877. [Google Scholar] [CrossRef]
  15. Schwartz, A.F. Housing Policy in the United States, 2nd ed.; Routledge: New York, NY, USA; Routledge: London, UK, 2014. [Google Scholar]
  16. Hess, D.B.; Tammaru, T.; Leetmaa, K. Ethnic differences in housing in post-Soviet Tartu, Estonia. Cities 2012, 29, 327–333. [Google Scholar] [CrossRef]
  17. Lemire, E.; Samuels, E.A.; Wang, W.; Haber, A. Unequal housing conditions and code enforcement contribute to asthma disparities in Boston, Massachusetts. Health Aff. 2022, 41, 563–572. [Google Scholar] [CrossRef]
  18. Bassett, K.; Short, J.R. Housing and Residential Structure: Alternative Approaches; Taylor & Francis: London, UK, 1980; Volume 14, pp. 657–658. [Google Scholar]
  19. Matějů, P.; Večerník, J.; Jeřábek, H. Social structure, spatial structure and problems of urban research: The example of Prague. Int. J. Urban Reg. Res. 1979, 3, 181–202. [Google Scholar] [CrossRef]
  20. Muth, R.F. The spatial structure of the housing market. Pap. Reg. Sci. 1961, 7, 207–220. [Google Scholar] [CrossRef]
  21. Morenikeji, W.; Umaru, E.; Pai, H.; Jiya, S.; Idowu, O.; Adeleye, B.M. Spatial analysis of housing quality in Nigeria. Int. J. Sustain. Built Environ. 2017, 6, 309–316. [Google Scholar] [CrossRef]
  22. Napiórkowska-Baryła, A.; Świdyńska, N. Factors affecting housing conditions: A case study of Cittaslow towns in Poland. Entrep. Sustain. Iss. 2021, 9, 94–107. [Google Scholar] [CrossRef]
  23. Li, S. Do internal migrants suffer from housing extreme overcrowding in urban China? Hous. Stud. 2018, 33, 708–733. [Google Scholar] [CrossRef]
  24. Gu, L.; Rosenberg, M.; Yang, L.; Yu, J.P.; Wei, B.G. A spatial multilevel analysis of the impacts of housing conditions on county-level life expectancy at birth in China. Appl. Geogr. 2020, 124, 102311. [Google Scholar] [CrossRef]
  25. Tai, D.B.G.; Shah, A.; Doubeni, C.A.; Sia, I.G.; Wieland, M.L. The disproportionate impact of COVID-19 on racial and ethnic minorities in the United States. Clin. Infect. Dis. 2021, 72, 703–706. [Google Scholar] [CrossRef] [PubMed]
  26. Rozenfeld, Y.; Beam, J.; Maier, H.; Haggerson, W.; Boudreau, K.; Carlson, J.; Medows, R. A model of disparities: Risk factors associated with COVID-19 Infection. Int. J. Equity Health 2020, 19, 126. [Google Scholar] [CrossRef] [PubMed]
  27. Zarrabi, M.; Yazdanfar, S.A.; Hosseini, S.B. COVID-19 and healthy home 0references: The case of apartment residents in Tehran. J. Build. Eng. 2021, 35, 102021. [Google Scholar] [CrossRef]
  28. Peters, T.; Halleran, A. How our homes impact our health: Using a COVID-19 informed approach to examine urban apartment housing. Archnet-IJAR Int. J. Archit. Res. 2020, 15, 10–27. [Google Scholar] [CrossRef]
  29. Ahmad, K.; Erqou, S.; Shah, N.; Nazir, U.; Morrison, A.R.; Choudhary, G.; Wu, W.C. Association of poor housing conditions with COVID-19 incidence and mortality across US Counties. PLoS ONE 2020, 15, e0241327. [Google Scholar] [CrossRef]
  30. Dai, X.; Li, Z.; Ma, L.; Jin, J. The spatio-temporal pattern and spatial effect of installation of lifts in old residential buildings: Evidence from hangzhou in China. Land 2022, 11, 1600. [Google Scholar] [CrossRef]
  31. Bhattacharjee, S.; Corbett, C.N. Housing condition and preferences of refugee immigrants in Dallas, TX. Wellbeing Space Soc. 2023, 4, 100150. [Google Scholar] [CrossRef]
  32. Babalola, O.D. Housing quality and its predictors in public residential estates in Lagos, Nigeria. Environ. Dev. Sustain. 2020, 22, 3973–4005. [Google Scholar] [CrossRef]
  33. Nieuwenhuis, R.; Zagel, H. Housing conditions of single mothers in Europe: The role of housing policies. Eur. Soc. 2023, 25, 181–207. [Google Scholar] [CrossRef]
  34. Wu, W. Sources of migrant housing disadvantage in urban China. Environ. Plan. A 2004, 36, 1285–1304. [Google Scholar] [CrossRef] [Green Version]
  35. Arcury, T.A.; Weir, M.; Chen, H.; Summers, P.; Pelletier, L.E.; Galvan, L.; Bischoff, W.E.; Mirabelli, M.C.; Quandt, S.A. Migrant farmworker housing regulation violations in North Carolina. Am. J. Ind. Med. 2012, 55, 191–204. [Google Scholar] [CrossRef] [Green Version]
  36. Lin, L.Y.; Zhu, Y. Housing conditions of the floating population under the double residential status and the factors affecting them: A case study in Fujian Province. Popul. Res. 2008, 32, 48–56. [Google Scholar]
  37. Fang, M.; Mirutse, G.; Guo, L.; Ma, L. Role of socioeconomic status and housing conditions in geriatric depression in rural china: A cross-sectional study. BMJ Open 2019, 9, e024046. [Google Scholar] [CrossRef] [Green Version]
  38. Zhou, Z.; Ma, Y.; Du, W.; Zhou, K.J.; Qi, S.J. Housing conditions and adolescents’ socioemotional well-being: An empirical examination from China. Appl. Res. Qual. Life 2022, 17, 2721–2741. [Google Scholar] [CrossRef]
  39. Xie, S.; Chen, J. Beyond homeownership: Housing conditions, housing support and rural migrant urban settlement intentions in China. Cities 2018, 78, 76–86. [Google Scholar] [CrossRef]
  40. Cao, Y.; Liu, R.; Qi, W.; Wen, J. Urban land regulation and heterogeneity of housing conditions of Inter-Provincial migrants in China. Land 2020, 9, 428. [Google Scholar] [CrossRef]
  41. Lin, L.Y.; Zhu, Y.; Liang, P.F.; Xiao, B.Y. The spatial patterns of housing conditions of the floating population in China based on the Sixth Census Data. Geogr. Res. 2014, 33, 887–898. [Google Scholar]
  42. Wang, Y.; Fang, C.L.; Wang, Z.B. Spatial Valuation and Regionalization of Comprehensive Urbanization Level in China. In Proceedings of the 19th International Conference on Geoinformatics, Shanghai, China, 24–26 June 2011. [Google Scholar]
  43. Gatrell, A.C. Autocorrelation in spaces. Environ. Plan. A 1979, 11, 507–516. [Google Scholar] [CrossRef]
  44. Anselin, L. Local indicators of spatial associatin-LISA. Geogr. Anal. 1995, 27, 93–115. [Google Scholar] [CrossRef]
  45. Au-Yong, C.P.; Azmi, N.F.; Mahassan, N.A. Maintenance of lift systems affecting resident satisfaction in Low-cost high-rise Residential Buildings. J. Facil. Manag. 2018, 16, 17–25. [Google Scholar] [CrossRef]
  46. Kshetrimayum, B.; Bardhan, R.; Kubota, T. Factors affecting residential satisfaction in slum rehabilitation housing in Mumbai. Sustainability 2020, 12, 2344. [Google Scholar] [CrossRef] [Green Version]
Figure 1. Study area and county unit division.
Buildings 13 02028 g001
Figure 2. Research design.
Buildings 13 02028 g002
Figure 3. Box plots of the seven housing condition evaluation indicators based on county units in China.
Buildings 13 02028 g003
Figure 4. Spatial differentiation pattern of housing conditions in China.
Buildings 13 02028 g004
Figure 5. Spatial differentiation pattern of the housing condition subtypes in China.
Buildings 13 02028 g005
Figure 6. LMI maps of the housing conditions and their subtypes in China.
Buildings 13 02028 g006
Figure 7. Box plots of the four housing condition scores for urban and non-urban areas.
Buildings 13 02028 g007
Figure 8. Scatterplot of the relationships between the housing condition scores and county fundamentals.
Buildings 13 02028 g008
Table 1. Housing condition evaluation indicator system.
Major CategoriesEvaluation IndicatorsAbbreviations
Housing spaciousnessAverage number of rooms per household (room/household)AN_room
Per capita housing area (m2/person)PCH_area
Internal facilitiesProportion of households with piped water supply in their housing (%)PH_piped water
Proportion of households with kitchens in their housing (%)PH_kitchens
Proportion of households with toilets in their housing (%)PH_toilets
Proportion of households with bathing facilities in their housing (%)PH_bathing facilities
Elevator configurationProportion of households with elevators in the building where the housing is located (%)PH_elevators
Table 2. Information entropies and weights of the evaluation indicator of housing conditions in China.
Information EntropyRedundancyWeight
AN_room0.9837070.0162930.195545
PCH_area0.9915510.0084490.101402
PH_piped water0.9977290.0022710.027257
PH_kitchens0.9993090.0006910.008297
PH_toilets0.9991750.0008250.009900
PH_bathing facilities0.9946620.0053380.064060
PH_elevators0.9505450.0494550.593538
Table 3. The global spatial autocorrelation indexes of housing conditions in Guangzhou.
Total Score of Housing ConditionsHousing SpaciousnessInternal FacilitiesElevator Configuration
Moran’s I0.21010.43160.34190.2063
Z-score51.0704104.796183.107750.1602
p-value0.00000.00000.00000.0000
Table 4. Mean scores for urban and non-urban housing conditions.
Sub-RegionAverage Score of Housing ConditionsHousing Spaciousness Average ScoreInternal Facilities Average ScoreElevator Configuration Average Score
Urban area0.3536560.0662640.1007700.203361
Non-urban area0.1828710.0874360.0907640.061790
Table 5. Correlation analysis between housing conditions and county fundamentals in China.
Study Area
(Number)
Housing Condition IndicatorsResult TypeInfluencing Factors
Population Density (person/km2)Urbanization Rate (%)Percentage of Urban Floating Population (%)Percentage of Renting Households (%)
All
(2846)
Housing spaciousnessCoefficient−0.277−0.473−0.185−0.380
Significance0.0000.0000.0000.000
Internal facilitiesCoefficient0.1970.3900.1890.118
Significance0.0000.0000.0000.000
Elevator configurationCoefficient0.4840.7240.5050.535
Significance0.0000.0000.0000.000
Urban areas
(973)
Housing spaciousnessCoefficient−0.386−0.670−0.174−0.430
Significance0.0000.0000.0000.000
Internal facilitiesCoefficient0.2370.3630.1710.220
Significance0.0000.0000.0000.000
Elevator configurationCoefficient0.3740.6020.4360.461
Significance0.0000.0000.0000.000
Non-urban areas
(1873)
Housing spaciousnessCoefficient0.154−0.238−0.010−0.242
Significance0.0000.0000.6510.0000
Internal facilitiesCoefficient0.3350.2960.064−0.104
Significance0.0000.0000.0050.000
Elevator configurationCoefficient0.4130.4660.2280.221
Significance0.0000.0000.0000.000
Note: Two-tailed test of significance was used.
Disclaimer/Publisher’s Note: The statements, opinions and data contained in all publications are solely those of the individual author(s) and contributor(s) and not of MDPI and/or the editor(s). MDPI and/or the editor(s) disclaim responsibility for any injury to people or property resulting from any ideas, methods, instructions or products referred to in the content.

