Abstract
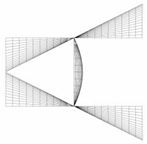
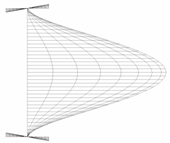
The local buckling of I-section columns is investigated in this paper, where the interaction between the web and flanges is taken into account. An analytical method is first developed based on the classical theory of the elastic buckling of thin plates, with which the main parameters affecting the interaction between the web and flanges are analyzed. The interactive behaviors of the buckling deformations of the I-section with different parameters are then revealed by employing finite element analyses. Simple approximate solutions for the buckling coefficients of the web and flanges are proposed using the energy method, which is capable of providing very accurate predictions compared to the analytical results. Using the simple solutions for buckling coefficients, the limits for the width-to-thickness ratio of I-section columns are proposed. Comparisons between the existing solutions and provisions in design codes indicate that the proposed limits for width-to-thickness ratio are capable of precisely considering the web–flange interaction at the local buckling of I-section columns.
1. Introduction
Local buckling, as one of the main failure modes of thin-walled members, has been extensively investigated. To prevent local buckling failure, the limits of the width-to-thickness ratio of plate components of thin-walled sections under various loading conditions have been provided in many design codes (e.g., GB50017 [1], AISC360 [2], and EC3 [3]), based on the existing studies.
A conventional method for the local buckling analysis of thin-walled members is based on the local buckling of thin plates. In many previous studies, the components of thin-walled sections were treated as a series of isolated plates in the local buckling analysis. By assuming the boundary conditions, the buckling stresses of different plate components of thin-walled sections have been obtained, from which the limits of the width-to-thickness ratio were also derived. In employing this method, the boundary conditions at conjunctions of different plate components were frequently assumed to be constant for a certain type of cross-section, which indicates that the interactions between the different plate components of the cross-section remain unchanged for cross-sections with different parameters. This method has been adopted in many specifications [1,2,3].
However, the interactive behaviors between different plate components of thin-walled sections have been investigated in many studies. Based on the analytical [4,5,6,7,8,9], numerical [9,10,11,12,13,14,15] and experimental studies [16], it has been found that the effects of these interactions may be significant. In Kroll et al. [4], the buckling coefficient of the web of I-sections, , was acquired by either applying the principles of moment distribution to the stability of plates [5] or an alternative procedure using charts of references [6,7,17]. In the latter method, the flange or web was assumed to be elastically restrained, and the buckling coefficient was given in the form of tables and charts. Based on the results from the finite strip analyses, Schafer and Seif [10] presented a normalized nondimensional parameter to account for the interaction between the web and flanges of I-sections at the local buckling. Subsequently, approximate expressions for the elastic buckling coefficient were proposed, which provide conservative predictions in most cases.
More precise formulas for elastic local buckling stresses were developed by Gardner and Fieber [11,12] using the finite strip software CUFSM v4.03. Based on a large number of analyses, a general expression for the local buckling stress () that accounts for the interaction between different plate components of the cross-section was presented:
where is the interaction coefficient mainly dependent on the ratio of buckling stresses of the isolated, simply supported flange and web, , which was provided to quantify the degree of rotational restraint provided at the conjunction edge. The superscripts “SS” and “F” in Equation (1), respectively, represent the fixed and simply supported boundary conditions, while the subscripts “cs” and “p” mean the cross-section and isolated plate, respectively. It is worth mentioning that the subscript “p” cannot be directly replaced with either “w” (i.e., the web) or “f” (i.e., the flange), as is actually the minimum of and . Likewise, is the minimum of and . A similar method as Gardner and Fieber [11,12] was also adopted by Jin and Tong [13] to consider the interaction between the flanges and the web of I-section members at the local buckling. Using about 3500 results from the finite element analyses, approximate solutions were also presented for the interaction coefficient. However, as illustrated in Figure 1, significant differences may exist between the interaction coefficients of the above two studies for I-sections under axial compression. In the recent numerical study by Vieira et al. [14], the local buckling of RHS members with equal flange and web thicknesses was studied based on the General Beam Theory. Subsequently, the approximate polynomial expression of the buckling coefficient kw was proposed, and a chart was also provided for the association of this expression.
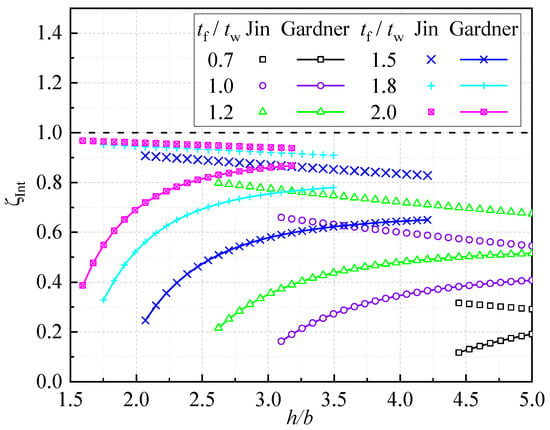
Figure 1.
Interaction coefficients of the I-section under axial compression.
The local buckling of I-sections under axial compression is investigated in this study, with the interaction between the flanges and web taken into account. First, an analytical method is developed for the analysis, with which the web–flange interactions in I-sections of different parameters are analyzed. The finite element model is also built to illustrate the details of buckling deformations of cross-sections under different interactive situations. Simple solutions for the buckling coefficients for local buckling are then presented based on the energy method, which is capable of precisely predicting the buckling coefficients of the web and flanges of I-sections within a very large range of dimensions. The limits of width-to-thickness ratios of I-section columns are also proposed using the presented simple solutions, and their superiority can be found by comparing them with the results from existing studies and design codes.
2. Theoretical Approach
According to classical theory, the equilibrium differential equation for the local buckling of a thin plate under compression can be given by [18]:
where x and y are the coordinates of the Cartesian coordinate system; is the deflection normal to the plate; Nx is the applied force per unit width in the -direction; and is the flexural rigidity of the plate per unit width and can be given by
in which and are, respectively, the elastic modulus and Poisson’s ratio of material, and is the thickness of the plate.
As depicted in Figure 2a, an I-section column may fail into the local buckling with a series of half-waves. In the local bucking analysis of such a column, a segment with its length equal to one half-wave is frequently adopted, as the inflection points of the local bucking deformations can be regarded as simply supported conditions. For ease of description, two local Cartesian coordinate systems, x-1-y1 and x-2-y2, are established for the flange and web of the I-section (Figure 2a–c). As shown in Figure 2c, the origin of x-2-y2 for the web plate is located at the midpoint of the loaded edge, while the origin of x-1-y1 for the flange plate is set at the flange-web conjunction. The longitudinal axes of both coordinate systems are denoted as x, as shown in Figure 2c. The parameters for the dimensions of the cross-section are illustrated in Figure 2b, where is the distance between the centerlines of the two flanges, is one half of the width of the flange, and and are the thicknesses of the flange and web of the I-section, respectively.

Figure 2.
Local buckling of an I-section member. (a) Buckled shape. (b) Dimensions of the cross-section. (c) Local coordinate systems. (d) Moment equilibrium.
The functions for the deflections of the flange and web, wf and ww, are assumed as
where x, y1 and y2 are the coordinates (see Figure 2c), and is the length of one half-wave of the buckling deformation in the x-direction. Substituting Equations (4) and (5) into Equation (2) and solving the differential equation, the expressions of and can be given by
where , , , , , , and are constants to be determined; () and () are, respectively, the flexural rigidities of the web and flange plates per unit width; () and () are, respectively, the forces applied at the web and flange per unit width; and and are the buckling coefficients of the web and flange, respectively. The other parameters in Equations (6a) and (6b) are given by:
It should be noted that the expression for case is only given in Equation (6b), as this is always satisfied as and are the case for a simply supported plate:
For the constants in Equations (6a) and (6b), can easily be obtained by considering the symmetry about y2 = 0, as:
As an important feature of the local buckling of the I-section, the deflections of both the flange and web should be zero at the flange–web conjunction, as
Substituting Equations (6a) and (6b) into Equations (10a) and (10b) leads to and . Then, Equations (6a) and (6b) can be rewritten as:
The case of is taken as an example in determining the four constants , , and in Equations (11a) and (11b) for brevity. The bending moment and shear force at the free edge of the flange plate are zero, which can be expressed as
Equations (12a) and (12b) result in:
where
The moment balance at the conjunction of the web and flange plates (Figure 2d) leads to
Substituting Equations (11a) and (11b) into Equation (15a) gives
The rotation continuity of the web and flange plates at the conjunction gives:
Equation (16a) can be simplified as
in which
Making the determination of the constant matrix of Equations (13a), (13b) and (16b) to be zero leads to the solution for :
Following a similar procedure as illustrated in Equations (12a)–(17a), the solution for can also be given:
in which
The elastic buckling coefficient can be obtained using Equations (17a) and (17b), respectively, for cases and , when the parameters , and are known.
Considering the uniform distribution of the axial stress, i.e., , the buckling coefficient of the flange plates, , can be obtained using the relationship illustrated in Equation (19a).
where
The results of Equations (17a) and (17b) using the iterative code of Matlab (denoted as the theoretical results) are shown in Figure 3a,b, for Kw and Kf, respectively. In the iterative code, the elastic modulus E and Poisson’s ratio μ of material are taken as 206,000 N/mm2 and 0.3, respectively. This is also used in the analyses in the rest of this paper, unless otherwise stated. It is worth mentioning that Kw represents the buckling coefficient of the web corresponding to the minimal buckling stress, which is obtained by searching for the minimal solution within the half-wave parameter being 0.5–5.0 for each case in the calculation. The value of Kf is then gained from the relationship illustrated in Equation (19a). It can be seen from Figure 3a that each Kw versus h/b curve contains an ascending branch at the stage with a relatively small h/b due to the increase in the rotational restraints from the flanges. This interaction at local buckling between the web and flanges, in turn, results in a reduction in the buckling resistance of the flanges, as indicated in Figure 3b for Kf. Kw reaches its peak value at a certain h/b, where the rotation of the web is almost fully restrained by the flanges, and therefore Kw remains almost constant with the further increase of h/b.
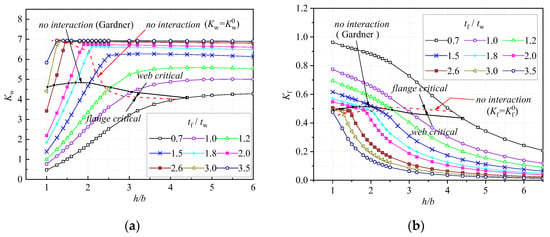
Figure 3.
Local buckling coefficients for I-sections under axial compression and Comparison of No Interaction Line with Reference [11]. (a) Web and (b) flange.
The values of buckling coefficients of the web and flanges, excluding the interaction between them, are also given in Figure 3a,b, using the red dashed lines, where and are always satisfied. In Figure 3a, () represents the critical buckling coefficient of a simply supported plate, with the half-wavelength being a, while (instead of ) in Figure 3b is calculated using its relationship with (instead of ), as illustrated in Equation (19a). Gardner [11,12] also categorized the local buckling of I-sections into two groups (i.e., the flange-critical and the web-critical sections) using the governing factor , where and , respectively, represented the minimal buckling stresses of the isolated plates (the web and the flange), with their boundary conditions along the web–flange conjunction assumed to be simply supported. Then, the no-interaction criterion for local buckling, , can be obtained by assuming = 1, which is illustrated by a black solid line in Figure 3a,b. It can be seen from Figure 3a that the buckling coefficients for no-interaction cases presented in Gardner [11,12] are close to those from the analyses of this study only for sections with , while for other sections the results of Gardner [11,12] are much smaller than those of this study.
Seif and Schafer [10] have revealed that the use of the parameter is more reasonable than the commonly used h/b in illustrating the interaction between the web and flanges of the cross-section at the local buckling. Therefore, the variations of Kw and Kf against the parameter are also shown in Figure 4a,b. It can be seen from Figure 4a,b that the correlations of curves for Kw and Kf with different are significantly improved by using the parameter as the horizontal axis compared with Figure 3a,b.
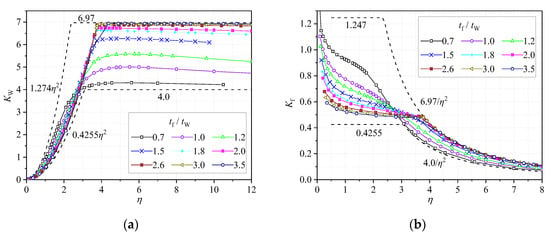
Figure 4.
Theoretical results of local buckling coefficients for I-sections under axial loading. (a) Web and (b) Flange.
According to Gardner [11], the condition of is always satisfied, where is the minimal elastic buckling stress of the cross-section, and the other quantities are the minimal buckling stresses of the isolated plates ( and for the web and and for the flanges). In the above expressions, the superscripts “SS” and “F” represent the simply supported and fixed boundary conditions along conjunction edges, respectively. Employing the relationship between the buckling stresses and coefficients gives and .
As illustrated in Figure 4a,b, all the curves for different and ratios fall in the region between the upper and lower bounds (shown as black dash lines) presented in Ref. [11].
As shown in Figure 3a and Figure 4a, the values of may exceed 4.0, the buckling coefficient for the web, by assuming its four edges are simply supported, in many cases even for the case without interaction between the web and flange at the local buckling. This is because, as mentioned previously, the buckling coefficients of this study shown in Figure 3a,b and Figure 4a,b correspond to the minimal buckling stress of the entire section. In this case, the half-wavelength of buckling deformation (i.e., a) may be different from those corresponding to the respective minimal buckling coefficients of the web and flanges.
3. Finite Element Analysis
3.1. Finite Element Modelling
The finite element (FE) analysis is also conducted using the general FE software ANSYS 17.0. As shown in Figure 5, the I-section column is modelled using the shell63 element of ANSYS, which is a four-node thin shell element with six degrees of freedom at each node. This element is suitable for large deformation analysis, according to the documentation of ANSYS. In FE analyses, the I-section columns are applied with a uniformly distributed load in the longitudinal direction at both ends. To simulate the simply supported boundary conditions at both ends, the z and y translations of both ends of the column are restrained. The displacement along the x-direction of the middle point of the web is also restrained to eliminate the rigid body motion. The refined mesh size was adopted based on the convergence study.
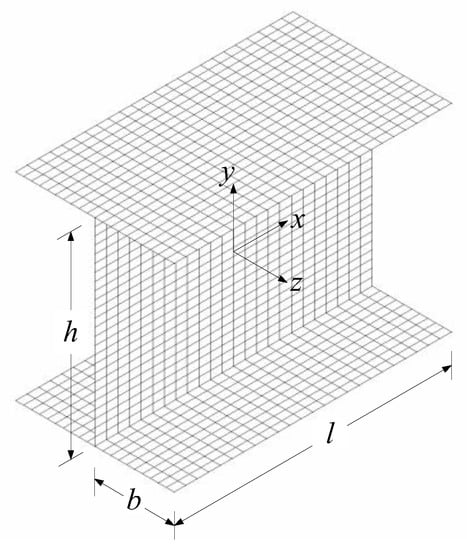
Figure 5.
I-section member under axial compression (FE model).
3.2. Results and Discussions
A total of 130 I-column examples are analyzed using FE analyses employing the eigenvalue method, which has been widely adopted in elastic buckling analyses. In FE analyses, and are used for all examples, while and vary from 1.25 to 6 and 0.7 to 4, respectively. For each section, the length of the specimen l varies from 0.5 h to 5 h in FE analyses. Using these FE analyses, the minimal buckling stress and the corresponding length a can be obtained. Then, the elastic buckling coefficient of the web, , can be obtained using
Comparisons of from FE analyses (denoted using the superscript “b”) with those from analytical studies (denoted using the superscript “a”) are made in Table 1, which show that the two series of results match very well with each other for all cases in Table 1 (the maximum deviation being less than 1%). For I-section columns with a certain h/b ratio, the buckling coefficient, and , increases with the ratio. As illustrated in Table 1, the variation of may be very significant for different cases, as the minimal and maximum values of are about 0.72 and 6.95 for all cases, respectively.

Table 1.
kw of I-section columns under axial compression.
3.3. Buckling Mode
The interactions between the web and flanges of I-section columns with typical and ratios are shown in Table 2 from an FE analysis. As exhibited in the buckled shapes in Table 2, the local buckling of the cross-sections may be web- or flange-dominated. For I-sections with a small h/b ratio (e.g., h/b = 1.0), the deformations of the flanges at the buckled configuration are much greater than those of the web, indicating flange-dominated local buckling.

Table 2.
Typical buckling modes from FE analysis.
As shown in Table 2 for h/b = 1.0, the relatively strong restraining effect is provided by the web to the flanges at the local buckling, especially for sections with small values of . On the other hand, strong interactions can be found between the web and flanges at the local buckling of cross-sections with large ratios (e.g., h/b = 6.0 in Table 2), where the rotational deformations of the web are restrained by the flanges at the web–flange conjunctions. The rotational restraining of flanges may be very strong, so that the boundary conditions of the web at the web–flange conjunctions are nearly fixed (see h/b = 6.0 for = 1.8 and 2.6 in Table 2). An interesting point shown in the deformed shape of the case ( = 2.6 and h/b = 1.5) is that the rotational restraining to the web may depend on the local twisting stiffness of the flanges.
4. Simple Solution Development
4.1. Energy Method
To develop simple solutions for the buckling coefficients of I-section columns incorporating the web–flange interaction, the energy method is adopted in this study. The total potential of a thin plate under axial compression can be given by [18]:
Under the same coordinate systems shown in Figure 1c, the buckling displacement of the flange plate is assumed to be
Using the expression of Equation (22) and the relationship , the total potential of the two flanges of the I-section can be obtained:
According to the continuity condition, the rotations of the web and the flange plates should be the same at the flange-web conjunction, i.e.,
where is the buckling displacement of the web plate and can be assumed as
The total potential of the web is then given by
Taking to be zero gives
where . The axial compression in Equation (27) can be expressed as
The buckling coefficient of the web, , can be directly determined using Equation (27) for different cases by considering the relationship of Equation (28). The minimal value of can be gained by employing to Equation (27), which gives
where and are the minimal buckling coefficient of the web and the corresponding nondimensional half-wavelength, and .
The comparisons of from Equation (29b) and the theoretical solution developed in Section 2 are shown in Figure 6. It can be seen from Figure 6 that the predictions of the solution of Equation (29b) () are generally in good agreement with those from the theoretical results (). However, dramatic overestimations of the solution illustrated in Equation (29b) can also be seen in Figure 6 for I-columns with great values of h/b compared to the theoretical results. Moreover, the value of Kw1 may exceed 6.97, the upper limit of the web (see Figure 4a). This overestimation of the buckling coefficient is because obvious differences may exist between the buckled deformations assumed in Equation (25) and those of actual buckling (see the example in Figure 7) when the restraining of the flange to the web is strong.
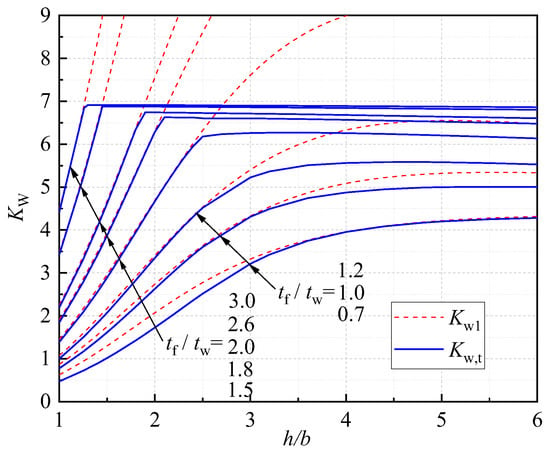
Figure 6.
Comparison of .
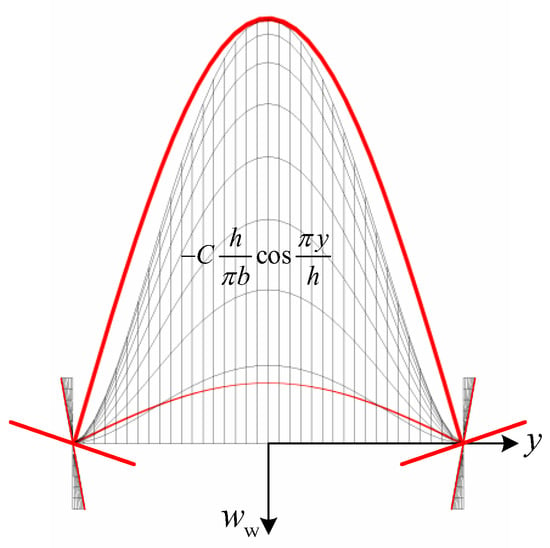
Figure 7.
Comparisons of the buckled shape (, ).
An upper limit of Kw1 is given in this study, denoted as , as
It can be seen from Figure 8 that the predictions of Equation (30) on the upper limit of Kw1 (Equation (30)) match very well with those from theoretical results. In Figure 8, the theoretical result of each case is the maximum value of Kw for I-columns with a certain (see Figure 6).
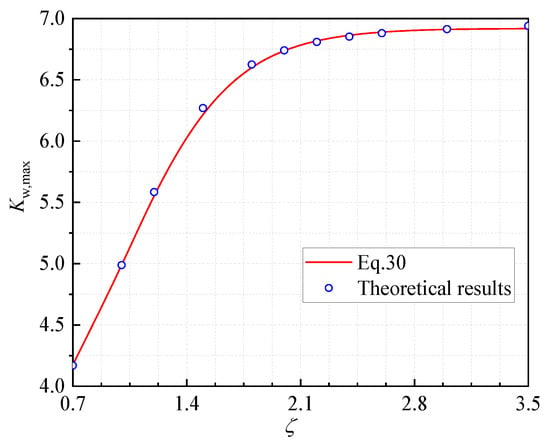
Figure 8.
Comparisons of maximum values of .
On the other hand, as presented in Figure 9a, the predictions of Equation (29b) may obviously overestimate the buckling coefficient of the web with and relatively small values of h/b. This is because the local buckling of I-sections is dominated by the buckling of flanges, where the web provides the rotational restraints for the flanges (see Table 2). In this case, the buckling deformations of the flanges along the y1-direction are more complicated than the assumed linear mode in Equation (22). Therefore, a modification factor, , is then presented in Equation (31) for the buckling coefficient of the web plate. It should be noted that Equation (31) is only applicable to the I-section columns with , which is believed to be capable of covering most practical cases.
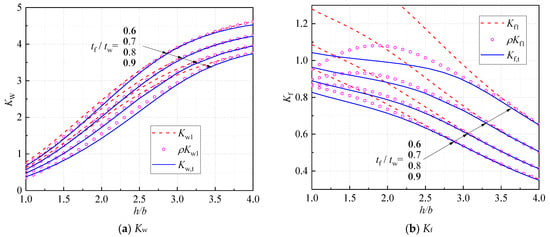
Figure 9.
Modification of the buckling coefficient with .
It can be seen from Figure 9a that the modified solution performs very well in predicting the buckling coefficient of the web of I-section columns compared to the results of the theoretical solution (). Moreover, the improvement by using the modification factor to is notable compared to the results of and . However, the overestimations (about 10%) on can still be found in Figure 9b for relatively small values of (i.e., less than about 2.5). Therefore, the further modification is then made to and denoted as for the modified parameter.
The buckling coefficient of the flanges, , corresponding to can be obtained employing Equation (19a).
Based on the above discussion, the local buckling coefficients of the web and flanges of I-section columns are given as:
where , and are given in Equations (32), (30) and (31), respectively.
It can be seen from Figure 10a,b that the buckling coefficients using Equations (33a) and (33b) (Kws and Kfs) are in very good agreement with the theoretical results (Kw,t and Kf,t) for all cases. It should be noted that slight deviations (within 10%) can be found between the predictions of Equation (33b) and the theoretical results for cases with and . Fortunately, is rarely used in practice, and the predictions of Equation (33b) are conservative compared to Kf,t.
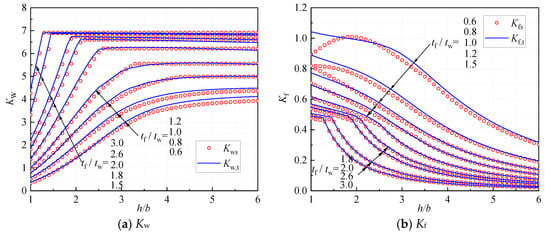
Figure 10.
Comparisons between Kw (Kf).
4.2. Compared with Existing Solutions
The local buckling of steel members under different loading conditions was analyzed using the finite strip software CUFSM in Seif and Schafer [10]. In their study, the buckling coefficient was normalized using the parameter to account for the web–flange interaction. An approximate solution for the buckling coefficient was also proposed by Seif and Schafer [10] with respect to the parameter . In this study, the parameter is also adopted to consider the web–flange interaction in the local buckling of I-section columns under axial compression. As shown in Figure 11a,b, the predictions of the solutions proposed by Seif and Schafer [10] are conservative for most of the cases compared to the theoretical results.
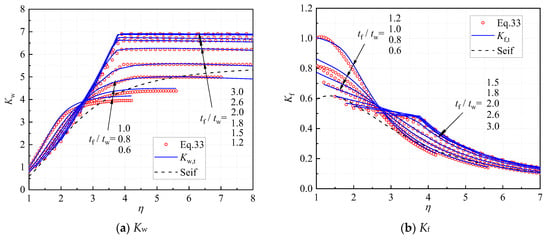
Figure 11.
Comparison with reference [10].
Based on a large number of finite strip analyses (CUFSM) on about 500 I-sections, approximate formulas for the local buckling stress of I/H sections were developed and calibrated by Gardner and Fieber [11,12] under different loading conditions and geometries. Note that these formulas were only applicable to I-sections with = 0.89~6.36. It can be seen from Figure 12a,b, that for I-sections with , the buckling coefficients of the web using the formulas of Ref. [11] (Kw,G) are generally in good agreement with those from the predictions of Equation (33a) (Kw), although a slight deviation can be seen between the buckling coefficients of the flange for and (Figure 12b). As shown in Figure 12a, Kw,G may exceed the upper bound of the web 6.97 and be obviously different from the predictions of the solution illustrated in Equation (33a).
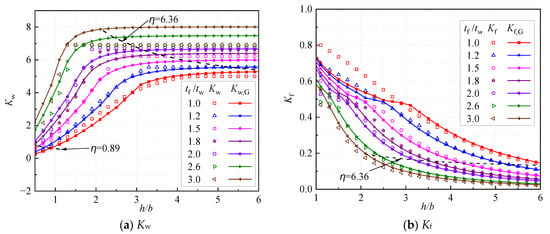
Figure 12.
Comparison with reference [11].
5. Width-to-Thickness Ratio Limit for I-Section Columns
5.1. Method for Determination of Limited Values
According to GB50017-2017 [1], the slenderness of a plate of I-sections can be categorized into five classes, S1–S5. The limit values of slenderness for S1–S4 are taken as 0.5, 0.6, 0.7 and 0.8 times the so-called yield slenderness of , which is calculated by taking the elastic buckling stress equal to the yield stress.
where is the elastic buckling coefficient.
Employing Equation (34), the slenderness limits of S1–S4 classes can be calculated using the elastic buckling coefficients obtained in the previous sections with specifying and . The limits of width-to-thickness ratio for I-section columns of S1 class according to GB50017-2017 [1] are shown in Figure 13, where the interaction between the web and flanges of the cross-section is taken into account by using the theoretical results for the buckling coefficients. It should be noted that the limit values depicted in the figures in this Section (i.e., Figure 13, Figure 14, Figure 15, Figure 16 and Figure 17) are all based on steel Q235 and should be multiplied with when applied to other grades of steel. It can be seen from Figure 13 that the width-to-thickness limits of the flange and web of I-sections are dependent on each other, which is different from those given in many design codes (e.g., AISC 360 [2] and GB50017 [1]). As indicated in Figure 13, all curves intersect at the points, with b/tf being about 10 and h/tw being about 28, representing no interaction between the web and flanges at the local buckling. It should be noted that the intersection points of these curves may not exactly locate at a unique point with h/tw = 28.15, the width-to-thickness limit of the web with the simply supported conditions at all edges. This is because the existence of flanges may lead to the half-wavelength of the web being slightly different from the one corresponding to a simply supported plate at the case without the interaction between the web and flanges of I-sections. The limit of b/tf increases with the decrease of h/tw when h/tw is less than about 28.0, due to the rotational restraining from the web. The limit of b/tf has a maximum value of 15.72 at h/tw = 0, as an extreme, where the flange is fixed at the web–flange conjunction (Figure 13). On the other hand, in general, the limit of h/tw increases with the decrease of b/tf for cases with b/tf less than about 10, as shown in Figure 13. The limits of h/tw for different cases reach their maximum values at b/tf, which is about 6–9.8, depending on the ratio tf/tw. It should be noted that the limits of h/tw for all cases shown in Figure 13 tend to be 28.15 when the value of b/tf equals zero, due to the infinitesimal rotational stiffness of the flanges.
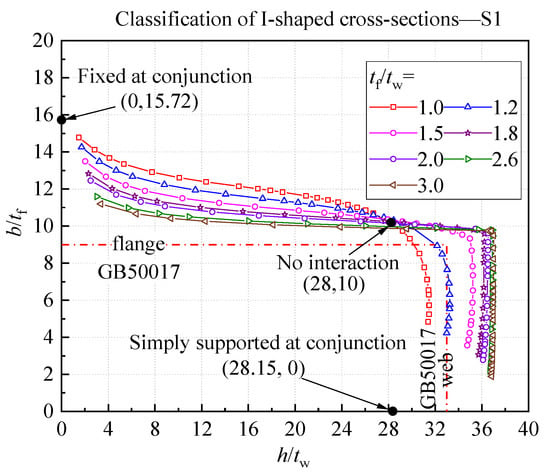
Figure 13.
The interactive curves for the limit of width-to-thickness ratios in the S1 class.
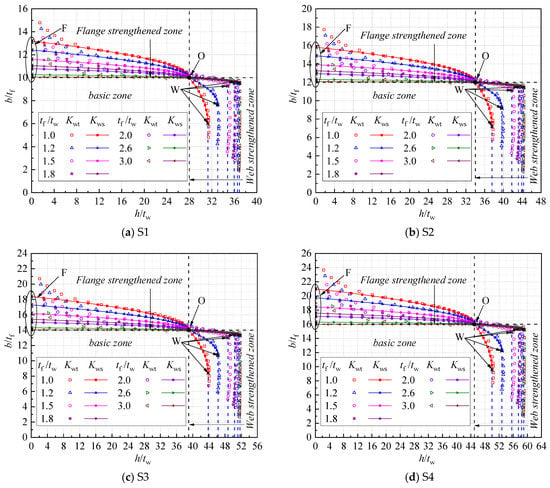
Figure 14.
Limits of width-to-thickness ratios of Classes S1–S4.
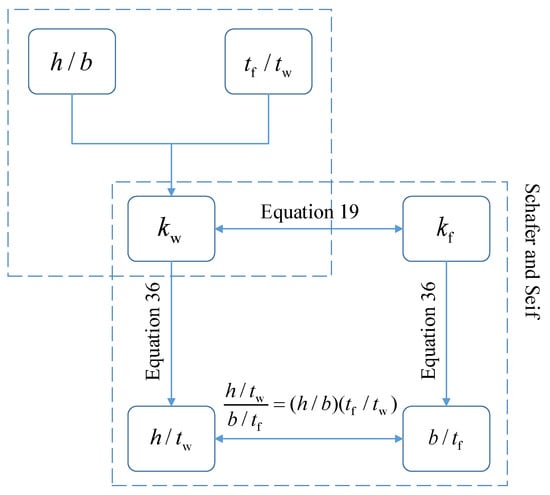
Figure 15.
Illustration process to obtain the limits of width-to-thickness ratios.
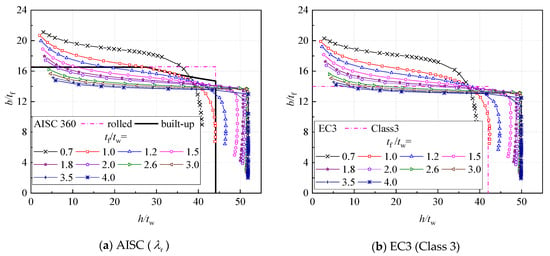
Figure 16.
Comparisons of width-to-thickness ratio limits for I-columns.
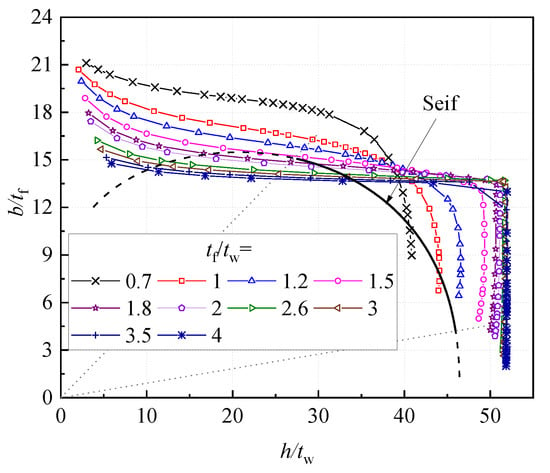
Figure 17.
Comparisons of Limiting width-to-thickness ratios for I-columns with Reference [10].
5.2. Revised Criteria for Limitation
It can be seen from Figure 13 that the limits for the width-to-thickness ratio of Class S1 I-section columns given in GB50017-2017 [1] are constant for the flanges and web, as the interaction between them is not considered. Generally speaking, the limits given by GB50017-2017 are conservative, while for the cases with tf/tw = 1.0, the provisions of GB50017-2017 may be a little unsafe when the values of b/tf are relatively small (i.e., b/tf < 9.0). A new solution for determining the limits of the width-to-thickness ratio of I-section columns is proposed in this study based on the analytical solution presented in previous sections. Different from the provisions in many existing design codes (i.e., GB50017 [1], AISC360 [2], and EC3 [3]), the interaction between the flanges and web at local buckling of I-section columns is taken into consideration in the proposed solution.
In Figure 14a–d, –0.8 of is taken in determining the limits of the width-to-thickness ratio of Classes S1–S4, similar to the method used in GB50017-2017. The I-section columns with tf/tw being 1.0–3.0 are only considered in Figure 14a–d, considering their practical use. As shown in Figure 14a–d, the whole region can be divided into three zones: the basic zone, the flange-strengthened zone and the web-strengthened zone. The limits of the width-to-thickness ratio of the flanges and web can be increased due to the flange–web interaction at the local buckling of I-section columns in the flange-strengthened zone and web-strengthened zone, respectively.
Three characteristic points are defined for each curve shown in Figure 14a–d in developing the simple solution for the width-to-thickness limits. The Point O (, ) represents no interaction between the flanges and web, while Points F (0, ) and W (, ) are the maximum values of the limits of the width-to-thickness ratios of the flanges and web. The limits of the width-to-thickness ratio of the web are given by
where the values of , , , and for Classes S1–S4 are given in Table 3.

Table 3.
The interactive limited values of width-to-thickness ratios.
The predictions of Equations (35a) and (35b) (Kws) are compared in Figure 14 with the results from theoretical analyses (Kwt) for I-columns of the Class S1 section, where very good agreements between these two results can be found. As revealed in Figure 14, in the flange strengthened zone with small h/tw ratios (i.e., less than about 12), the predictions of Equation (35a) on the limits of the b/tf may be conservative compared to the results from theoretical analyses. It should be noted that the constant limits of h/tw are used in this study for the cases with b/tf less than [b/tf]0, although, as mentioned in the previous section, the limits of h/tw may tend to be 28.14 with b/tf approaching zero. This is because, as illustrated in Figure 14, the decrease in the limits of h/tw is very slight in the practical region of b/tf.
5.3. Comparison with the Provisions of AISC and EC
According to AISC 360-16 [2], the non-slender/slender element limit of the plate elements of columns can be obtained using
where b and t are the width and thickness of the plate elements; k is the buckling coefficient; and is the plate slenderness limit, generally obtained from testing. For columns of common sections, AISC 360-16 [2] and EC3 [3] also give values (Table 4). The limits of the width-to-thickness ratio for plate elements of I-section columns can be derived using Kw of this study and . The method is shown in Figure 15, which was also adopted by Schafer and Seif [10]. It should be noted that the values of for different plate elements of a certain section should be the same when the interaction between the web and flanges is taken into account. Therefore, the values of used in this study may be slightly different from those in AISC 360 and EC3 for cross-sections using nonunique for different components, as illustrated in Table 4.

Table 4.
The plate slenderness limits given in design codes and used in this paper.
Following the procedure illustrated in Figure 15, relationships between the limits of and can be gained, which are compared with those from AISC 360 in Figure 16a. In Figure 16a,b, , and are adopted in the calculations. It can be seen from Figure 16a that the limits of the width-to-thickness ratio of the web given in AISC 360 are conservative in the web-strengthened zone for most cases. However, the obvious overestimation of the limits for the width-to-thickness ratio of the flange can be found in Figure 16a in the flange-strengthened zone. This overestimation is more significant for sections with greater tf/tw. As shown in Figure 16a, the predictions of AISC 360 are in better agreement with those from the method of this study in the region near the intersection of and . This is because the interaction between the web and flange at local buckling is partially considered in AISC 360 for build-up sections. The interaction effect is considered in AISC360 [2] by modifying the limits of the flange by a factor of (see of AISC for the flange of built-up sections in Table 4), where the interaction only depends on (Johnson [16]).
The comparisons between the predictions of EC3 [3] and those using the method of this study for the Class 3 section are also made in Figure 16b. It can be seen from Figure 16b that the predictions of EC3 [3] on the width-to-thickness limits for both webs and flanges are a little conservative compared to those of AISC 360 [2]. The predictions of EC3 for Class 3 sections are generally conservative compared to the results based on the method of this study for Class 3 sections. As illustrated in Figure 13 and Figure 16a,b, the design codes may make unsafe predictions on the width-to-thickness limits of I-sections in some cases. Fortunately, the cases of tf/tw = 0.7 and 1 are not within the practical region, where all three design codes mentioned above may give unconservative predictions on h/tw. For AISC 360 [2], a smaller limit of b/tf (about 13) is suggested to ensure the resistance of the I-section against the local buckling.
5.4. Comparison with Existing Solutions in Literature
An approximate solution was also presented by Seif and Schafer [10] for the limits of the width-to-thickness ratios of I-section columns, where the interaction between the web and flanges was also considered.
where .
Equation (37) and the width-to-thickness limits given in Figure 17 were obtained through the procedure shown in Figure 15 with = 0.7. The limited values for the width-to-thickness ratio are plotted in Figure 17. As the elastic buckling coefficient of Ref. [10] was expressed only in terms of one variable , the approximate solution for the width-to-thickness ratio limits is also only related to . As revealed by Figure 17, the interaction curves calculated from Equation (37) are quite close to those of this study (Equations (33a) and (33b)) and provide rather conservative results in most cases.
6. Conclusions
The local buckling of I-section columns under axial compression is investigated in this study, where the interaction between the web and flanges is taken into consideration. An analytical method is first developed based on the classical theory of elastic buckling of thin plates, with which it is found that the interaction between the web and flanges of I-section columns depends largely on the h/b and tf/tw ratios. Subsequently, the interactive behaviors at the local buckling for I-section columns with different parameters are revealed using FE analyses employing thin plate elements. The simple approximate solutions for the buckling coefficients of the web and flanges are then proposed using the energy method and validated using the analytical results. Compared to the existing similar solutions, the proposed solutions are precise and applicable for I-sections with dimensions in a very large range, in addition to their simplicity. With simple solutions for buckling coefficients, the limits for the width-to-thickness ratio of I-section columns are proposed. In this study, the interactive curves for the width-to-thickness ratio limits of the web and flanges are classified into the flange-strengthened zone, the basic zone and the web-strengthened zone to account for the web–flange interaction in I-sections with different parameters at the local buckling. Comparisons between the existing solutions and provisions in design codes indicate that the proposed limit solutions for width-to-thickness ratio are capable of precisely considering the web–flange interaction at the local buckling of I-section columns. For the verification of the proposed solutions, an experimental study will be conducted in the near future.
Author Contributions
Conceptualization, L.Z.; Methodology, Q.Z.; Validation, Y.Z. and Y.L.; Formal analysis, Q.Z.; Investigation, Q.Z.; Resources, Y.Z. and J.Z.; Data curation, Y.L.; Writing–original draft, Q.Z. and L.Z.; Writing–review & editing, Y.Z. and J.Z.; Visualization, Y.Z. and Y.L.; Supervision, L.Z. and J.Z.; Project administration, L.Z.; Funding acquisition, J.Z. All authors have read and agreed to the published version of the manuscript.
Funding
This work is financially supported by China Southwest Architectural Design & Research Institute Corp., Ltd. (Project No. R-2021-08-S-A-2023). The support is highly appreciated.
Data Availability Statement
The data presented in this study are available on request from the corresponding author. The data are not publicly available due to privacy.
Conflicts of Interest
The authors declare no conflict of interest.
References
- GB50017-2017; Standard for Design of Steel Structures. China Architecture & Building Press: Beijing, China, 2017.
- American Institute of Steel Construction. Specification for Structural Steel Buildings (ANSI/AISC 360-16); American Institute of Steel Construction: Chicago, IL, USA, 2016. [Google Scholar]
- EN 1993-1-1; Eurocode 3: Design of Steel Structures—Part 1-1: General Rules and Rules for Buildings. European Committee for Standardization: Brussels, Belgium, 2005.
- Kroll, W.D.; Fisher, G.P.; Heimerl, G.J. Charts for Calculation of the Critical Stress for Local Instabilty of Columns with I-, Z-, Channel, and Rectangular-Tube Section; NACA: Washington, DC, USA, 1943. [Google Scholar]
- Lundquist, E.E.; Stowell, E.Z.; Schuette, E.H. Principles of Moment Distribution Applied to Stability of Structures Composed of Bars or Plates; NACA: Washington, DC, USA, 1943. [Google Scholar]
- Lundquist, E.E.; Stowell, E.Z. Critical Compressive Stress for Flat Rectangualr Plates Supported along All Edges and Elastically Restrained against Rotation along the Unloaded Edges; NACA: Washington, DC, USA, 1942. [Google Scholar]
- Lundquist, E.E.; Stowell, E.Z. Critical Compressive Stress for Outstanding Flanges; NACA: Washington, DC, USA, 1942. [Google Scholar]
- Bedair, O. Stability of web plates in W-shape columns accounting for flange/web interaction. Thin Wall. Struct. 2009, 47, 768–775. [Google Scholar] [CrossRef]
- Peng, G. The Research on Local Buckling of Thin-Walled Section. Master’s Thesis, Zhejiang University, Hangzhou, China, 2012. [Google Scholar]
- Seif, M.; Schafer, B.W. Local buckling of structural steel shapes. J. Constr. Steel Res. 2010, 66, 1232–1247. [Google Scholar] [CrossRef]
- Gardner, L.; Fieber, A.; Macorini, L. Formulae for Calculating Elastic Local Buckling Stresses of Full Structural Cross-sections. Structures 2019, 17, 2–20. [Google Scholar] [CrossRef]
- Fieber, A.; Gardner, L.; Macorini, L. Formulae for determining elastic local buckling half-wavelengths of structural steel cross-sections. J. Constr. Steel Res. 2019, 159, 493–506. [Google Scholar] [CrossRef]
- Jin, Y.; Tong, G. Elastic Buckling of Web Restrained by Flanges in I-section members. J. Zhejiang Univ. (Eng. Sci.) 2009, 43, 1883–1891. [Google Scholar]
- Vieira, L.; Gonçalves, R.; Camotim, D. On the local buckling of RHS members under axial force and biaxial bending. Thin Wall. Struct. 2018, 129, 10–19. [Google Scholar] [CrossRef]
- Ragheb, W.F. Local buckling of welded steel I-beams considering flange-web interaction. Thin Wall. Struct. 2015, 97, 241–249. [Google Scholar] [CrossRef]
- Johnson, D.L. An Investigation into the Interaction of Flanges and Webs in Wide-Flange Shapes. In Proceedings of the Annual Technical Session and Meeting, Cleveland, OH, USA, 16–17 April 1985; pp. 395–405. [Google Scholar]
- Kroll, W.D. Tables of Stiffness and Carry-Over Factor for Flat Rectangular Plates under Compression; NACA: Washington, DC, USA, 1943. [Google Scholar]
- Timoshenko, S.P.; Gere, J.M. Theory of Elastic Stability, 2nd ed.; McGraw-Hill: New York, NY, USA, 1961. [Google Scholar]
- EN 1993-1-5; Eurocode 3: Design of Steel Structures—Part 1-5: Plated Structrual Elements. European Committee for Standardization: Brussels, Belgium, 2006.
Disclaimer/Publisher’s Note: The statements, opinions and data contained in all publications are solely those of the individual author(s) and contributor(s) and not of MDPI and/or the editor(s). MDPI and/or the editor(s) disclaim responsibility for any injury to people or property resulting from any ideas, methods, instructions or products referred to in the content. |
© 2023 by the authors. Licensee MDPI, Basel, Switzerland. This article is an open access article distributed under the terms and conditions of the Creative Commons Attribution (CC BY) license (https://creativecommons.org/licenses/by/4.0/).

