Abstract
Residential buildings in the Kingdom of Saudi Arabia (KSA) contribute to nearly half of the overall electricity consumption in the building stock, highlighting their significant role in energy consumption. While an upgraded energy code has been established and enforced for new buildings, existing buildings continue to operate at the same level of energy consumption. Therefore, there is a need for further energy upgrades in existing buildings. This study evaluates the energy savings potential of various energy retrofitting measures for a case study in Jeddah, KSA. Data from previous studies and current practices were collected and analyzed. Different energy upgrade measures, such as windows replacement, wall insulation upgrade, roof insulation upgrade, and air conditioning unit replacement, were selected and evaluated using a digital simulation tool called Design-Builder. The simulation results were compared to understand the potential percentage of energy savings. The average annual energy consumption (AAEC) was used as the primary performance indicator to compare the energy savings among the scenarios. The results demonstrate significant reductions in energy consumption for the proposed scenarios. Furthermore, the study examined the significant impact of uncertainties, specifically, the infiltration rate and AC setback temperature, on AAEC. In conclusion, the proposed scenarios have the potential to achieve substantial energy savings, ranging from 25% to 66%, depending on the number of energy retrofitting interventions employed. The findings of this study can serve as a useful reference for similar energy retrofitting projects.
1. Introduction
In the Kingdom of Saudi Arabia (KSA), building energy consumption is a significant contributor to oil consumption and a major expense for building users [1]. The government has introduced numerous initiatives to promote energy efficiency and renewable energy, recognizing the importance of energy efficiency in buildings [2]. While the Saudi building code (SBC) committee has endorsed the upgraded energy code and required it for new residential buildings in 2021, existing buildings continue to consume high levels of energy. Furthermore, the Saudi Energy Efficiency Center (SEEC) has initiated efforts to improve energy consumption in existing buildings, including enhancing the energy efficiency of household appliances and lighting products [2]. However, further investigation is needed to understand the energy-saving potential of energy upgrade measures for existing buildings. Upgrading the building envelopes is essential for reducing energy consumption, which can reach up to 68% [3]. However, retrofitting existing buildings for energy efficiency can be challenging due to design limitations, climate considerations, and occupant behavior [4]. Unfortunately, the retrofitting progress of existing buildings has been slow due to insufficient awareness, funding, and technical expertise [4].
This paper aims to evaluate the energy-saving potential of building envelope upgrades through energy retrofitting measures for a case study of a residential building in Jeddah, Saudi Arabia. The study compares various strategies for eight apartments to illustrate the potential energy savings achievable for each unit. The building under investigation is a typical low-rise residential structure, consisting of five floors and eight apartments. Key performance indicators, such as the average annual energy consumption (AAEC), are used to compare the energy consumption of the building before and after the energy retrofit scenarios. The proposed scenarios encompass improvements to the building envelope and HVAC systems.
The study explores the challenges and opportunities associated with retrofitting existing buildings in Jeddah city, emphasizing the importance of a holistic approach that considers multiple factors when retrofitting existing buildings. Additionally, the potential for energy savings resulting from retrofitting existing buildings is examined. The paper also discusses uncertainties and their effects on the AAEC, including the infiltration rate (ACH50) (Air changes per hour at 50 Pascal) and the desired user thermal comfort temperature. The simulation of energy from the basic model employed an infiltration rate of 20 ACH50, with attempts made to generate scenarios targeting a rate of 4 ACH50, as required by SBC standards. Outdoor scenarios were applicable to the entire building, rather than individual apartment upgrades. The simulation results reveal a significant reduction in the average annual energy consumption (AAEC) when a deep energy retrofit scenario was implemented.
The paper’s conclusion compares the energy-saving potential among different scenarios and highlights certain uncertain factors that impact the AAEC, such as infiltration rates and setback temperatures. The study’s results contribute significantly to the existing literature on energy retrofitting of existing buildings in Jeddah.
2. Methodology
A mixed-methods approach, encompassing qualitative and quantitative techniques, was employed in this study to provide comprehensive results contributing to the existing literature on energy retrofitting of existing buildings in Jeddah. Qualitative data were collected from the relevant literature and related studies, forming a solid foundation for exploring the energy-saving potential of retrofitting measures using the DesignBuilder (Version 7) digital software (EnergyPlus).
To examine the energy-saving possibilities and enhance the energy efficiency of existing apartments in Jeddah, a series of energy retrofitting scenarios were analyzed for eight apartments within the same building. The simulation tool was utilized to assess the current energy consumption and determine the potential energy savings for each scenario.
The objective of this paper was to evaluate and compare the energy-saving possibilities across different energy retrofitting scenarios, utilizing simulation software. To establish the simulation parameters, several steps were undertaken. First, a comprehensive review of the literature and related studies was conducted to summarize the essential design parameters and energy benchmark levels, which play a crucial role in highlighting specific variables. Second, the case study was described, as it was necessary for digital modeling. Data were collected from various sources, including floor plans, apartment orientation, component materials and U-values, user activities, and mechanical AC systems. Third, specific uncertainties that affect energy savings results, such as the infiltration rate and user thermal comfort (setback temperature), were identified. Fourth, an overview of the energy upgrade scenarios and interventions was formulated. Finally, the simulation results were analyzed to evaluate and compare the energy savings achieved by each energy upgrade scenario.
Further illustrations will be presented in subsequent sections, and Figure 1 provides a visual representation of the workflow, facilitating readers’ understanding of the sequential steps in this study.
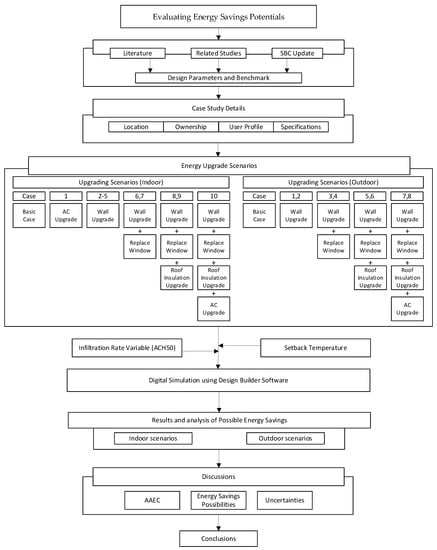
Figure 1.
Research structure of the paper.
3. Literature Review and Related Studies
This section addresses the knowledge gap in previous studies on energy retrofitting upgrades and highlights the latest methods used in the field for energy retrofit measures. It also presents related studies and existing practices.
Researchers have extensively investigated the advantages of energy conservation measures for residential buildings in the Gulf Cooperation Council (GCC) countries. However, there has been a lack of investigation into the recent cost of living increases and the government’s vision for energy conservation measures, particularly in the context of the Kingdom of Saudi Arabia (KSA). KSA citizens have only recently gained knowledge and basic information about energy savings and conservation measures. Some studies have demonstrated the potential for significant energy consumption savings through the application of various energy-saving measures. However, many of these studies did not explicitly consider the associated costs.
Several researchers, such as [5,6,7], have reported varying energy savings, ranging from 15% to 72%, when implementing different energy-saving measures, including insulation upgrading, U-value upgrading, window glazing upgrading, electrical devices upgrading, shading devices installation, and on-site energy generation units. Konstantinou presented five specific strategies (replace, add-in, wrap-it, add-on, and cover-it) that could be incorporated into refurbishment designs for aging residential buildings, providing a toolbox of refurbishment strategy possibilities to aid decision-making processes [8]. The main outcome of Konstantinou’s study was the provision of a façade refurbishment toolbox to support the decision-making process in design. It is important to note that all the strategies mentioned in the study aimed to improve all building envelope components where heat loss occurs, both inside and outside the buildings. In contrast, in the KSA context, energy retrofitting strategies aim to improve all building envelope components where heat penetrates, specifically, from the outside of the building to the inside, due to the KSA context.
Several researchers have investigated different energy-saving measures, considering climate and economic conditions in GCC countries. These studies have provided fundamental knowledge on applicable and feasible strategies that could be implemented within the KSA context. However, the recent cost of living increases, the addition of value-added tax (VAT), and the introduction of new service fees require further investigation.
For example, a research study conducted in Kuwait in 2003 demonstrated savings of 3.25 million MWh over 10 years by implementing energy-saving measures, such as insulation, glazing upgrades, and reducing the window area in 42,403 retrofitted old residential buildings [9]. The main challenges in this project were the government’s role as the main financer of the initial retrofitting costs and the long payback period of over 30 years, during which electricity tariff prices continued to be subsidized. Additionally, Krarti presented the economic and environmental benefits of improving energy efficiency in new and retrofitted buildings in Kuwait [10]. The study proposed three levels of retrofitting proposals for better energy efficiency. Furthermore, the research showed that implementing various energy-saving measures could result in savings of 8%, 23%, or more than 50% of annual energy usage.
Similarly, Krarti recommended similar implementation measures for buildings in the KSA to achieve comparable energy savings on a larger scale. Ameer suggested that doubling electricity prices (electricity tariffs) in Kuwait would incentivize the implementation of energy efficiency measures in the residential buildings sector, which would ultimately benefit the Kuwaiti government [11]. Currently, building users in Kuwait, as in other GCC countries, rely on government subsidies for their energy bills, although the amount of subsidies varies across countries.
In the UAE, Taleb tested the improvement of building thermal performance using 8 passive cooling strategies, achieving energy consumption reduction of up to 23.6% in residential buildings in Dubai [12]. Further, Alfaris observed a remarkable increase in energy performance efficiency of 25% by implementing low and medium energy conservation measures [6]. This led to energy consumption savings ranging from 14.4% to 47.6%, depending on individual operating conditions and occupants’ behaviors. Rakhshan demonstrated a 40% reduction in summer peak demand and a 32% decrease in CO2 emissions by improving wall insulation to a U-value of 0.3 W/(m2K) and upgrading AC systems to a Coefficient of Performance (COP) of 2.7 [13]. Giusti and Almoosawi examined the impact of occupants’ behaviors on electricity consumption, including raising the AC thermostat temperature to 24 °C, switching off domestic water heating when not needed, and adding roof insulation, all of which contributed to varying percentages of energy consumption savings [14].
Friess reviewed several passive measures, such as building orientation, thermal insulation, appropriate glazing types and orientation, excessive light levels and glare, and natural ventilation. These measures were found to achieve energy consumption savings of 30% in villas and up to 79% in high-rise office buildings [15]. Studies on energy-saving measures have been more extensively explored in the United Arab Emirates (UAE) compared to other GCC countries, yielding diverse results that have been recently implemented.
On the other hand, researchers have highlighted the significant impact of building user behaviors on energy savings. Al-Saadi demonstrated a substantial reduction of up to 42.5% in annual energy consumption through the implementation of various saving measures in a calibrated model of a typical house in Oman [16]. Alalouch emphasized the urgent need for large-scale retrofitting programs, which could effectively reduce energy consumption through suitable energy-saving measures [17].
Aldossary proposed various management and technical upgrades in KSA that could serve as benchmarks for enhancing energy efficiency in the country’s residential stock. The author identified three prototype houses exhibiting maximum energy efficiency, surpassing international standards. These recommendations serve as exemplary standards for future implementation of retrofitting measures in KSA’s residential buildings. Similarly, Krarti investigated optimal energy savings for residential buildings across 5 sub-climate zones in KSA, ranging from 26% to 47.3%. These savings were achieved by applying energy conservation measures to building envelope elements, such as wall insulation, roof insulation, window area, window glazing, window shading, and thermal mass, considering life cycle cost and energy savings [18]. Additionally, Alaidroos highlighted that the application of energy conservation measures within the KSA region could result in significant annual savings on energy cost subsidies, national oil consumption, and investment in new power plants [18].
Furthermore, Alaboud noted that implementing necessary measures, such as reducing the Window-to-Wall Ratio (WWR) from 15.3% to 5%, adding insulation to the roof and external walls, and increasing the thermostat temperature in houses by 1 °C, could lead to a substantial 35% decrease in cooling load [19]. The study suggested that if these measures were implemented, there would be a 35% reduction in cooling demand, which could be further increased with additional retrofitting plans, considering cost-effectiveness. In 2019, Krarti demonstrated that retrofitting residential buildings could reduce energy consumption by up to 60%. Moreover, by utilizing solar panels (PVs) on building roofs in KSA, surplus energy could be generated for internal use or returned to the grid [20]. Previous studies have explored different strategies for energy-saving measures focused on building energy performance.
In summary, the studies have shown significant energy savings, ranging from 15% to 72%, when implementing various energy retrofitting measures using appropriate combinations of interventions, as illustrated in Table 1. However, these studies have not taken into account recent changes in the KSA context, such as the recent increase in energy costs, updates in building codes, and the government’s development towards the 2030 vision. Therefore, there are knowledge gaps that need to be addressed in current research.

Table 1.
The Strategy Types and The Savings Interventions.
3.1. Retrofitting Strategies for Low-Rise Residential Buildings in Jeddah, KSA
Various factors influence the implementation of energy retrofit applications, including the micro-climate, thermal properties of building fabric, occupants’ thermal comfort level, owners’ acceptance of changes, and budget constraints [21]. However, a study by Ma emphasizes that sustainable energy retrofitting applications must follow a strategic design process, which involves careful decision making at different phases [22]. The same study proposes a systematic approach to achieving sustainable energy retrofit applications, which can be divided into three activities: pre-retrofit (identification of possible solutions), retrofit (testing of solutions), and post-retrofit (evaluation of the application) [22]. Similarly, energy retrofitting strategies require similar processes to ensure an effective application for maximizing energy efficiency.
Energy retrofits can be categorized in various ways [23,24,25,26,27]. Natural Resources Canada (NRCAN) classifies retrofit activities into three scales: minor retrofit, major retrofit, and deep retrofit. This study adopts the NRCAN categorization as a baseline [23]. The scales are classified based on the level of intervention required and the percentage of energy savings.
- A
- —Minor Energy Retrofit
A minor energy retrofit involves easy upgrades that can be implemented with low-cost investments. This includes sealing gaps, upgrading lighting systems, improving electrical devices, implementing control systems, and conducting regular maintenance. These activities require minimal interventions and have little to no disturbance for building users.
- B
- —Major Energy Retrofit
A major energy retrofit involves significant changes or upgrades aimed at reducing the building’s energy consumption while causing minimal disruption for building users. Key activities include replacing, upgrading, or adding building elements, such as windows (frames, panes, glazing), wall thickness, insulation and shading systems and improving AC systems.
- C
- —Deep Energy Retrofit
A Deep Energy Retrofit (DER) achieves substantial energy savings, potentially reducing energy costs by up to 60%. The International Energy Agency (IEA) defines Deep Energy Retrofit as follows:
“A major building renovation project in which site energy use intensity (including plug loads) has been cut by at least 50% compared to the baseline with a corresponding improvement in indoor environmental quality and comfort”[28].
In the same study, Deep Energy Retrofit is described as a comprehensive approach that includes upgrades, additions, or changes to building systems, resulting in at least 50% energy consumption savings. These activities may involve major disruptions for building users, such as replacing the entire façade, adding a second-skin façade, or applying External Insulation Finishing System (EIFS) as insulation cover.
Table 2 illustrates the different levels of interventions and activities, providing an overview of the changes that can be implemented across various energy retrofit measures.
Table 2.
Main differences between minor, major, and deep energy retrofits.
In this study, energy retrofitting is defined as any changes (replacement, repairs, upgrades, or additions) that improve the building’s energy performance efficiency and reduce energy consumption costs. The scope of the study focuses on exploring potential energy retrofitting strategies and their economic and environmental benefits.
Initially, in KSA, energy retrofitting strategies were not widely recognized among building users due to the low energy tariffs. However, attitudes and approaches changed when the tariffs increased significantly, as mentioned earlier. The Social Development Bank (SDB) in KSA defined the restoration loan/finance program as follows:
“A financing program designed for restoration, maintenance, repair of structural and emergency defects, for the purpose of additions or necessary modifications for private residential houses”[29].
Until recently, energy retrofitting measures were not commonly practiced in most architectural firms in KSA. However, there has been a shift, and it is now becoming more standard practice as clients recognize its importance. The recent increase in energy prices and the definition of energy performance defects in buildings have contributed to this change, as they are now being closely monitored.
It is worth noting that energy prices in KSA remain competitive compared to average energy consumption prices in European countries, as shown in Figure 2. The SEEC initiatives have primarily focused on minor energy activities, such as promoting the labeling of electrical devices (including lighting and ACs) and providing discounts on efficient AC units. They have also increased public awareness of energy efficiency through the media. However, major and deep energy retrofits have not been comprehensively covered by the SEEC.
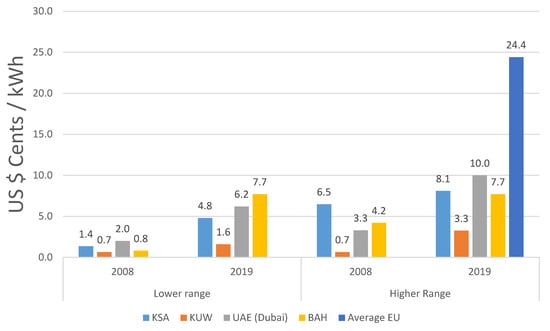
Figure 2.
Electricity tariff prices (lower range (≤6000 kWh) and higher range (>6001 kWh)) comparing four GCC countries and the EU.
Energy retrofitting strategies in the KSA context have generally received low acceptance rates among homeowners due to various factors. In the past, this included high initial costs and limited interest in energy efficiency, primarily due to low energy tariffs, as shown in Figure 3.
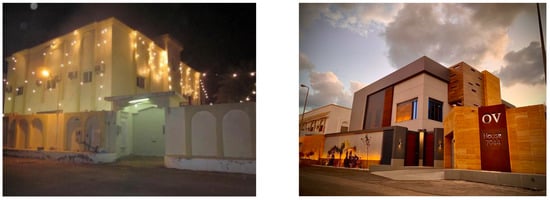
Figure 3.
Austah House’s recent renovation project in Yanbu city, KSA.
Historically, energy retrofitting solutions needed to consider the initial costs of energy improvements compared to the current scenario, focusing on total energy savings and their potential impact on energy costs. Energy performance and cost are, therefore, primary indicators for evaluating energy consumption levels. The challenge lies in creating a comfortable indoor environment for building users in the harsh, outdoor, hot desert climate of KSA, where temperatures range between 32 and 49 °C (Jeddah), and indoor temperatures should ideally be maintained between 18 and 24 °C [1].
Despite the limited number of residential building renovation projects in KSA, energy upgrades have not been a significant consideration, even among existing projects that have not met upgraded SBC standards. Homeowners typically renovate their buildings for aesthetic or structural purposes, with little emphasis on energy efficiency. However, a recent documented renovation project of a residential building serves as an example of integrating energy upgrade measures alongside aesthetic improvements, resulting in substantial energy savings. This case highlights the common misconception that residential building renovation is solely for aesthetic purposes and underscores the importance of considering energy efficiency measures during renovation projects.
Austah House, located in Yanbu city in the western region of KSA, represents a recent renovation case that provides insight into available energy enhancement possibilities (see Figure 3). The following information is based on an interview with the owner and architect, Moaad Austah, and supporting pictures and information obtained through Twitter, a social media application [30].
The renovation of the Austah House was motivated by cultural aspects, building quality, and economic considerations, highlighting how building owners approach renovation activities, as shown in Figure 3. The construction of the building took 2 years and was completed in 2020, which was attributed to the fact that the building was occupied during the construction period.
The main energy-related changes incorporated into the house included upgrades to the walls, windows, lights, and air conditioning (AC) systems. The east and west façade walls were upgraded to a 40 cm thickness, consisting of a 15 cm block, 5 cm insulation panels, another 15 cm block, and 2.5 cm of mortar on both sides of the wall. The windows were upgraded to double-glazed windows with thermal break frames (6 mm glass, 12 mm air vacuumed, and 6 mm glass). Additionally, 18 AC window units were replaced with split AC units with energy efficiency ratings of 5 or 6 stars. The owner reported a 30% energy saving after the building renovation.
To assess the actual energy consumption, the study illustrated the monthly electricity bills over a 2-year period from February 2019 to December 2020. The average energy consumption on the first floor was approximately 135 kWh/m2 per year, with an energy cost of around 24 S.R. (USD 6.4), as detailed in Figure 4. The Austah house case exemplified a diligent renovation approach, including several energy retrofitting measures, such as wall insulation upgrades, window replacements, AC upgrades, and lighting improvements. Further energy savings measures could potentially enhance the energy performance efficiency of the building.
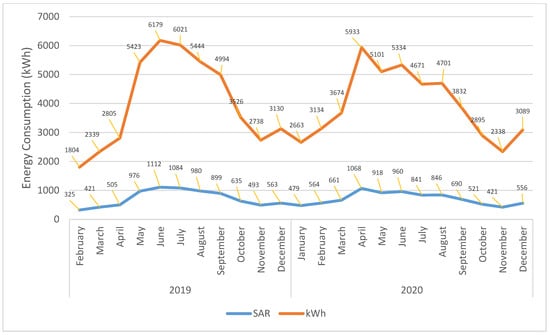
Figure 4.
The 2019–2020 energy consumption (kWh) and energy cost (Saudi Riyal (SAR)) for 1st floor [31].
3.2. Energy Retrofitting Strategies
Existing retrofitting projects in KSA have primarily focused on either restructuring the building or enhancing its aesthetic appearance. Konstantinou [8] presented various refurbishment strategies used as a basis for the study, with an update for the Jeddah context. The strategies employed (replace, add-in, wrap-it, add-on, or cover-it) were specified in the specific context of KSA, excluding the cover-it strategy from the study scope. Table 3 illustrates the suitable strategy categories based on these approaches.
Table 3.
List of energy upgrade strategies.
- A
- —Replace Strategy
The replace strategy involves exchanging old building components (walls, windows, insulation, connections) with new ones, either separately or by altering the entire façade. The cost depends on the number of intervention activities and the energy efficiency level of the materials used. Fewer interventions result in lower costs, while replacing an entire façade significantly impacts the building’s energy efficiency with higher costs. However, the level of disturbance to building users’ activities should be considered early in the application process to minimize disruptions. The level of disturbance may vary depending on the extent of the replacement interventions, with greater replacement interventions resulting in more disturbances.
- B
- —Add-In Strategy
The add-in strategy encompasses upgrading building components (walls, windows, insulation, connections) within the existing building. This strategy allows for maintaining the same outdoor façade, making it suitable for individual units of residential buildings. Attention needs to be given to addressing thermal bridging issues that arise from connections between building components. Increasing indoor wall thickness may reduce the livable space, which is crucial to consider during the design process.
- C
- —Wrapping (Wrap-It) Strategy
The wrapping (wrap-it) strategy involves adding an extra layer to the building, such as a second-skin façade or external insulation (EIFS). The second-skin façade resolves thermal bridging issues and allows for aesthetic modifications to the building when outdoor wall thickness increase is not restricted by the Saudi Building Code (SBC). EIFS has great potential for improving thermal energy performance, eliminating thermal bridging. However, if the existing walls have stone finishing, additional investigation is required for the disassembly of the stone, considering time and cost implications. Although the EIFS option has been used recently, the costs have been higher compared to previous strategies.
- D
- —Add-On Strategy
The add-on strategy involves adding shading devices or structural elements to the external façade layer, primarily targeting shaded parts of the building. Residential buildings in hot climate conditions generally have a low Window-to-Wall Ratio (WWR). Merged balconies can be expanded to provide additional indoor space, subject to merging restrictions imposed by the Saudi Building Code (SBC).
3.3. Energy Performance Challenges of Residential Buildings in Jeddah
Residential building envelopes in Jeddah were designed with insufficient thermal properties. Several studies have assessed the thermal performance of existing building envelopes, including walls, windows, floors, and roofs. Computational simulations were employed to analyze actual building cases [3,18,32]. These simulations have identified potential areas for energy savings [7,9,18]. Interestingly, 1 study demonstrated that with minimal interventions, energy savings ranging from around 15% to just below 50% could be achieved, depending on the specific energy-saving measures implemented [6]. Life cost analysis has also been utilized to determine the most energy-saving interventions in the long run.
The primary challenge observed in buildings requiring energy upgrades is the presence of defective thermal building designs, resulting in significant outdoor heat gains through different components of the building envelope, leading to thermal discomfort in indoor spaces (see Table 4). The study identified that high energy consumption is primarily influenced by infiltration rates and thermal bridges. In practice, mechanical cooling systems, such as air conditioning units (ACs), are commonly employed by building users to achieve thermal comfort. Therefore, the main issues that need to be addressed regarding current residential building energy performance are the lack of information regarding ACs at various levels, from building codes to construction, and the impact of low energy tariffs on the defective energy performance of building envelopes.
Table 4.
Energy efficiency challenges, causes, and results.
When upgrading existing buildings to reduce high heat gain from the external environment, several factors need to be considered to improve indoor thermal comfort for occupants:
- Lack of knowledge on the cost benefits of essential technical solutions for energy retrofitting building envelopes. Defective thermal properties of walls, roofs, and windows must be addressed. Additionally, the old Saudi Building Code (SBC) did not require sufficient energy levels and allowed the use of low-thermal-resistance materials.
- High infiltration rates (air tightness) in indoor spaces were not included in the old SBC. Currently, there is a lack of knowledge regarding the most efficient infiltration rate for existing residential buildings.
- The presence of thermal bridges resulting from poor thermal designs requires consideration.
Although these constraints are interconnected, the previous discussion highlights that the energy requirements outlined in the old building code were the main driver of the current problem. Historically, low energy costs and occupant behavior also contributed to high energy consumption in residential buildings. When energy requirements and electricity tariffs were low, buildings were constructed with poor thermal properties, leading to increased cooling demands. Occupants responded to thermal discomfort in indoor spaces by using ACs, which were cost-effective at the time.
In recent years, GCC countries have implemented various policies aimed at reducing CO2 emissions. These policies have necessitated changes at the governmental level to enhance building energy performance and promote the use of renewable energy sources, raising the overall energy efficiency standards in the region.
The Solar Decathlon Middle East (SDME) competition focused on the potential for net-zero buildings in hot, arid climate conditions, considering the large areas required for PV solar panels to achieve the net-zero concept [33]. The results emphasized the importance of efficient building designs combined with renewable energy sources. A project by Virginia Tech demonstrated the possibility of transforming a villa from an energy consumer to an energy producer, setting a benchmark for net-zero energy houses [34]. Although the SDME competition focused on a different building typology (villas), the results can provide valuable evidence of energy-efficient homes in hot, arid climate zones.
A recent local study by Aldossary proposed an energy benchmark range for apartments in low-rise buildings in KSA, ranging from 77 to 98 kWh/m2 per year, resulting in lower carbon emissions [7]. Aldossary also provided specifications for building elements, including the layers, thickness, and U-Value in Table 5. The author suggested an optimal solution of a 35 cm external wall thickness with a 0.257 U-Value. Another study by Alaidroos extensively tested five energy efficiency measures, demonstrating significant energy-saving potential that could reduce energy cost subsidies, national oil consumption, and the need for new power plants [18]. The suggested energy range can serve as a benchmark and reference for future comparisons with the proposed scenarios.
Table 5.
Building elements specifications [7].
Furthermore, the study illustrates that current energy consumption in KSA ranges from 114 to 166 kWh/m2 per year for apartments and 109 to 185.4 kWh/m2 per year for villas [32]. The results of the simulation-based studies illustrated actual upgrading possibilities of energy performance for the existing residential buildings, especially after regulating the upgraded SBC. The detailed study will be used as a reference level while further simulation validation is needed. Simulation-based studies have demonstrated actual energy performance improvement possibilities for existing residential buildings, particularly after the introduction of upgraded SBC regulations. These detailed studies will be used as reference points, but further simulation validation is necessary.
The Saudi Building Code (SBC) underwent an upgrade in 2018, accompanied by an increase in energy tariffs. Subsequently, in January 2021, the SBC national committee endorsed an upgraded building code that applied to all new residential buildings constructed from 1 July 2021 onwards. Interestingly, after the SBC endorsement, there was a noticeable decrease in the issuance of construction permits in Jeddah for at least three months, until the committee revised some of the requirements [35]. This study specifically focuses on existing residential buildings in Jeddah categorized as Zone 1 according to the SBC classification, as depicted in Table 6 [36]. While the upgraded SBC assigns improved U-Values to optimize the energy performance of new residential buildings, the current performance levels of existing residential buildings fall significantly below these upgraded SBC standards. The upgraded SBC energy standards, considered the best minimum requirements for Zone 1, can serve as a baseline reference for any energy upgrade solutions. Consequently, energy upgrade measures through retrofitting strategies should align with the current SBC U-Values.
Table 6.
The minimum U-Values and R-Values for air-conditioned spaces and non-air-conditioned spaces (C.I. (continuous insulation), C (C-Value (Thermal conductance)), F (F-Factor (heat transfer through the floor)) [36].
Interestingly, the upgraded SBC allows for lower U-Values in non-air-conditioned spaces compared to air-conditioned spaces. This suggests that designing passive housing units may require higher U-Values if appropriately designed. The question arises as to who is responsible for verifying whether a housing unit is designed passively or not. However, the building code could define the minimum R-Values or U-Values requirements, while specifying whether the space is air-conditioned or not. Additionally, it needs to consider the possibilities of manipulation, especially given that most buildings in Jeddah require AC systems.
Cost plays a crucial role in the decision-making process when considering energy-saving measures. The ideal solutions are those that incur minimal costs, while offering efficient intervention measures.
The study’s primary objective is to establish a framework of potential energy retrofitting interventions that meet, at the very least, the upgraded Saudi Building Code (SBC) energy standards for existing low-rise residential buildings in Jeddah.
3.4. Jeddah’s Climatic Challenges
Jeddah experiences the highest number of Cooling Degree Days (CDDs) per year compared to other cities in Saudi Arabia, totaling 6587 CDDs, as shown in Table 7 [37].
Table 7.
Cooling and heating degree-days for five cities in KSA.
Jeddah has a hot, dry climate with a maritime desert subzone [38]. The city’s temperature ranges from a maximum of 48 °C to a minimum of 13 °C, with varying relative humidity levels, as explained in more detail in Table 8 [32].
Table 8.
Temperatures and humidity levels in Jeddah city, KSA.
Alaidroos and Al-Hadhrami highlighted that residential buildings in Jeddah exhibit exceptionally high cooling consumption, accounting for 71% of the total energy consumption, and have the highest number of Cooling Degree Days [18,39]. Felimban also emphasized that buildings without thermal insulation have a negative impact on occupants’ energy behavior [1]. As a result, hot outdoor air easily penetrates indoor spaces, leading to increased indoor temperatures and prolonged usage of mechanical cooling systems.
3.5. Overview of the Existing Residential Building Stock
3.5.1. Residential Building Stock in KSA
The primary objective of this section is to identify representative building typologies that can serve as a foundation for defining design parameters for energy upgrade strategies for building envelopes. The aim is to gather relevant information to accurately assess the current energy performance of residential buildings in terms of common building types, the housing unit population, the Sakani (My House) financial support program, changes in low-rise building regulations, and ownership types.
In Saudi Arabia (KSA), low-rise residential buildings constitute approximately 50% of the overall building stock (including commercial, governmental, agricultural, and industrial buildings) [1]. Apartment units account for around 2.9 million units, representing approximately 53% of KSA’s residential buildings [3]. In Makkah province, where Jeddah is located, there are approximately 1 million housing units.
The Sakani program aims to increase housing ownership from 47% to 70% by 2030. The program offers various housing solutions, including providing housing units or financial support for acquiring the first housing unit. Established in 2017, Sakani was launched to expedite homeownership among Saudi families. By August 2021, Sakani had successfully accommodated over 1.4 million households (see Figure 5), encompassing a range of housing products, such as residential free lands with loans, market unit loans, self-construction loans, under-construction unit loans, ready-made unit loans, subsidized mortgage transfers, loans for military members, loans for civilians, and loans for education members. To achieve the strategic goal, 40% more housing units are currently in the delivery process [40]. The majority of apartment buildings in KSA are low-rise structures, typically comprising 3–5 floors and classified as residential. Low-rise residential buildings in KSA are categorized into two types: purely residential or residential combined with commercial spaces, based on land use standards.
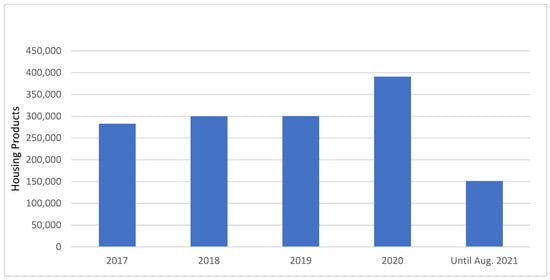
Figure 5.
Comparison of Sakani Housing Products (1.4 Million) from 2017 to 2021.
The regulations for low-rise residential buildings have undergone two changes, resulting in different building use and ownership categories (old, recent, and new), as illustrated in Figure 6. The first upgrade mandated building owners to allocate parking spaces on the ground floor, while allowing for the construction of a villa on the rooftop, which this study categorizes as the recent type. This regulation change introduced multi-ownership to the building, although historically, potential homeowners were reluctant to purchase an apartment with shared ownership.
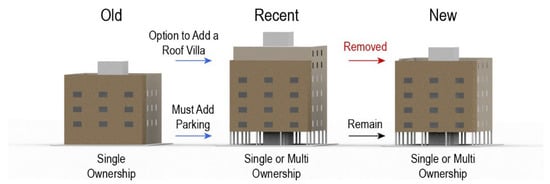
Figure 6.
The regulation changes affect the building ownership types.
The regulation change offered additional yearly income for owners who constructed a villa on the roof and leased the remaining apartments. Consequently, during this period, many investors constructed low-rise residential buildings with villa roofs and sold them as separate entities (apartments and a roof villa), leading to the trend of multi-ownership within a single building.
Subsequently, low-rise building regulations were updated, and the construction of a villa on the roof was prohibited, although parking requirements remained. In summary, these regulation changes have impacted ownership types, shifting from single ownership to multi-ownership, which was unacceptable two decades ago.
The improvement in multi-ownership management can be attributed to the implementation of updated building regulations and the introduction of the Mullak program in February 2020. This study primarily focuses on low-rise residential buildings and investigates both multi-ownership and single-ownership scenarios to propose practical solutions. Figure 7 depicts the various types of low-rise residential buildings found in Jeddah, considering different construction ages. Despite variations in construction ages, these buildings exhibit comparable energy performance due to their similar construction approaches. However, discrepancies in ownership types may influence the proposed results, which will be discussed further in the subsequent text.
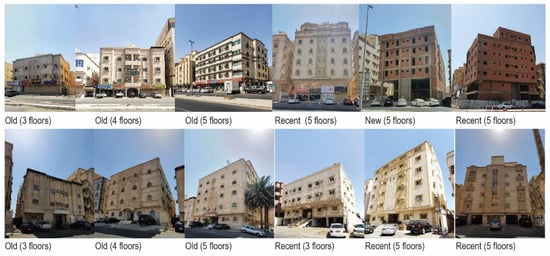
Figure 7.
Different types of low-rise residential buildings illustrate the types of construction and ownership.
Several researchers have explored Saudi residential building characteristics from various perspectives, taking into account factors such as location and user profiles. Aldossary identified several prototypes based on official construction plans, while Alaidroos described construction methods and HVAC specifications for a base case villa in KSA. However, this study focuses specifically on 3–5 floor residential buildings with both multi-ownership and single ownership, excluding villas on the roof due to the latest SBC upgrade regulations. The primary emphasis is on multi-ownership buildings to accommodate more housing units, although single-ownership scenarios are also considered. The categorization of the selected residential buildings is based on construction methods and materials used, rather than their historical construction dates.
3.5.2. Common Construction Method
Usually, reinforced concrete is the most commonly used material in residential building construction due to its availability, affordability, and durability. Skeleton structure systems, also known as frame structures, are the predominant construction method employed in low-rise residential buildings in KSA [41]. The construction phases of a low-rise residential building generally follow typical steps, as depicted in Figure 8.
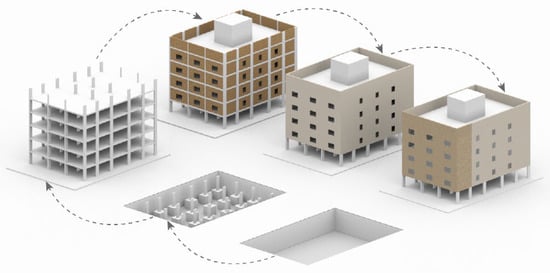
Figure 8.
Typical construction method.
The construction process for low-rise residential buildings begins with the underground phase, which involves drilling and column foundation. The most common system used for low-rise buildings in KSA is the concrete skeleton structure, utilizing reinforced concrete for its affordability, availability, and durability. The construction of the skeleton structure follows specific procedures from the foundation to the roof slab.
The next phase is the block walls (wall-filling), where blocks are used to fill the spaces between the skeleton columns, as indicated by the red walls in Figure 9. The choice of material for wall-filling depends primarily on the allocated budget, with options ranging from cement blocks, red blocks, and Burkani blocks to the less common Siporex blocks. Each type of wall-filling material has different properties and thermal conductivity levels. Typically, walls are constructed using 20 cm blocks, as shown in Figure 9 and Figure 10.
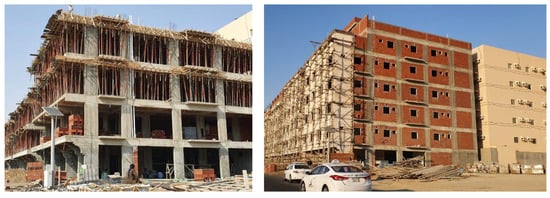
Figure 9.
The 20 cm blocks for wall-filling within the skeleton structure.
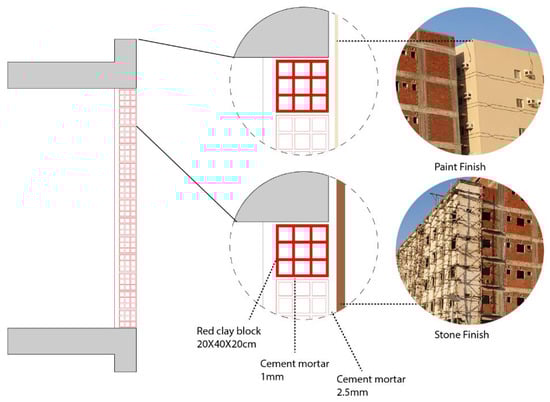
Figure 10.
Typical wall section demonstrating materials used in construction.
The third phase involves cement finishing (mortar), which entails adding a 2 cm layer of mortar to both sides of the blocks, as depicted in Figure 9. The final phase involves the overall finishing of the building envelope through painting or the application of stone. The choice of painting or decorative elements depends on the budget of the building owner. Some owners with higher budgets may opt to add different types of stone to the front façade for aesthetic purposes, as shown in Figure 9 and Figure 10.
Understanding the typical construction materials used in residential buildings helps define and clarify the available materials for each targeted envelope component within the Jeddah context [41]. These materials serve as a starting point for energy-upgrading applications, such as replacement or upgrading solutions for walls, insulation, windows (frames, glazing, and panes), and sealants, supporting the design possibilities. Additionally, this section discusses the materials related to existing residential buildings, as these materials play a significant role in outdoor heat gain. As mentioned earlier, the construction method encompasses four stages: skeleton structure, wall-filling, cement mortar, and finishing. Each stage utilizes various materials. The subsequent sub-section and Figure 10 explain the material variations for wall-filling (blocks), insulation, finishing, windows, and sealants.
- A
- —Wall Fillings (Blocks)
According to Felimban, approximately 70% of residential buildings in Jeddah lack insulation [1,2]. In general, the walls of typical residential buildings consist of single bricks (red blocks, cement blocks, Burkani blocks, or Siporex blocks) covered with a 2 cm cement layer of mortar on both sides.
Walls with openings incorporate window frames with single glazed panes, as discussed in a later sub-section. The current thermal energy levels of the walls present an excellent opportunity for energy performance upgrades. Any energy upgrade scenario should consider the types of blocks commonly used in Jeddah’s residential buildings. Wall upgrade interventions could involve increasing thickness by adding insulation layers and an air gap to the indoor space. All scenarios involve tightening the indoor space, while addressing thermal bridges resulting from connections, which is another challenge that needs to be considered. Figure 11 illustrates the commonly used wall materials, including cement blocks with holes, red blocks, Burkani blocks, and Siporex blocks. Since 2021, block factories have been required to meet specific thermal properties to comply with the upgraded SBC standards (see Table 9).
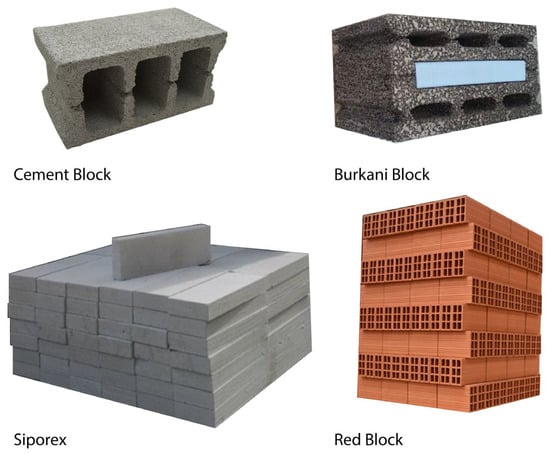
Figure 11.
Various types of building blocks.
Table 9.
Wall materials U-Values and R-Values [42].
- B
- —Insulation Materials
In hot climate regions, thermal insulation serves the purpose of resisting the penetration of hot air from the outside to the inside. Insulation layers are applied to the walls and roof surfaces, and they can be categorized as conventional (commercially available organic or inorganic products) or sustainable (natural or recycled) materials [43]. As mentioned earlier in this study, most residential buildings in KSA lack insulation, which significantly hinders energy efficiency by allowing outdoor heat transfer to indoor spaces. Commonly used and available insulation materials in KSA include polystyrene, polyurethane, mineral wool, glass wool, Perlite, and Siporex, as shown in Figure 12 [42,43]. Various factors, such as availability, cost, installation difficulty, soundproofing, and fire resistance, must be considered in the design process to select a suitable insulation material.
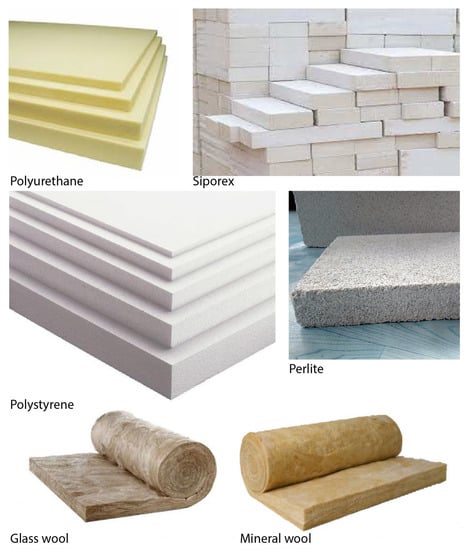
Figure 12.
Various types of insulation materials.
- C
- —Finishing
The finishing layers typically involve a 2–2.5 cm cement layer of mortar on both sides of the wall, followed by painting or the application of stone on the main façade for aesthetic purposes. The thermal conductivity of mortar finish is 0.72 W/mK. When it comes to painting or stone selection, it largely depends on the building owner’s budget. Some owners may have a higher budget and can incorporate different types of stone on the front façade for both aesthetic and thermal performance purposes. It is worth noting that certain painting companies now offer thermally resistant options, although these options come at a higher price compared to other materials. In energy upgrade scenarios, the finishing layer options, especially when a stone finish is involved, require careful consideration and planning in terms of the cost and time required for stone disassembly.
- D
- —Windows
Upgrading windows plays a significant role in enhancing energy efficiency, despite accounting for a maximum of 25% of the total façade area [44]. Window frames, glazing, and panes greatly influence the transfer of outdoor heat into indoor spaces through gaps between the frames and the wall, as well as within the window frames themselves. Additionally, consideration should be given to the Solar Heat Gain Coefficient (SHGC) through window panes. Aluminium frames are typically used for their durability and market availability. In recent years, the use of unplasticized Polyvinyl Chloride (uPVC) frames has increased due to their competitive prices and availability. Moreover, uPVC has demonstrated higher thermal resistance compared to other materials, such as aluminium or steel. Timber and steel frames are rarely used in window construction due to their high cost and limited availability, and thus, they are excluded from the scope of this study.
There are different types of window glazing and panes with varying U-Values and SHGC, as illustrated in Table 10. The thermal resistance levels of window glazing depend on factors such as the number of panes, color, and cavity size between the panes.
Table 10.
Window glazing types and heat transfer level, LoE (Low Emissivity) [18].
- E
- —Sealants
Sealant materials are used to fill the gaps between the wall (blocks) and the window frames, preventing the infiltration of air and water into indoor spaces [8]. In KSA, sealants play a significant role in mitigating outdoor heat transfer to indoor areas. Lower-quality sealants result in higher heat transfer to indoor spaces, leading to increased mechanical cooling demand. Sealant compositions are categorized as silicone sealants, hybrid polyurethane sealants, and polyurethane sealants.
4. Design Parameters and Energy Benchmark
This section aims to define the design parameters and energy consumption benchmark levels to establish the study scope and enable energy upgrade scenarios.
Key performance indicators (KPIs) are crucial for evaluating the scenarios. The primary KPI is the Annual Average Energy Consumption (AAEC) in kWh/m2/year, which serves as a benchmark for comparing various upgrade scenarios to the original case. The evaluation of each apartment considered at least one of the following upgrades: U-values (W/m2K), thickness (cm), infiltration rate (ACH50), Solar Heat Gain Coefficient (SHGC) and Window-to-Wall Ratio (WWR) for windows, and Coefficient of Performance (COP) for AC units.
The hot, arid, humid climate conditions in Jeddah necessitate mechanical systems in all indoor spaces, a finding supported by other researchers, such as Felimban and Alaidroos [1,18]. In addition, it is essential to consider the building location within the neighborhood, as this could also affect the AAEC for each apartment in the building. Additionally, the location of the building within the neighborhood must be taken into account, as it can also impact the AAEC for each apartment. The selection of building types was based on the number of housing units and the new buildings developed by the KSA Ministry of Housing. Apartments account for more than 50% of the total housing units in KSA [45].
This research focused primarily on buildings constructed using the concrete skeleton structure (CSS), as this is the predominant construction method in Jeddah. The historical aspect of the buildings was not considered. Moreover, the construction process of a CSS involves wall infilling with blocks, plaster/cement finishing, and aesthetical finishing. The Saudi Energy Efficiency Centre (SEEC) and Felimban highlight that over 70% of residential buildings in Jeddah lack thermal insulation, underscoring the need for energy retrofit upgrades of the existing building envelopes [1,46].
The Saudi Building Code (SBC) has upgraded its energy efficiency requirements and energy benchmarks. However, in February 2022, the SBC National Committee revised the energy efficiency requirements in response to feedback from construction companies and their reluctance to issue new construction permits for residential buildings. Table 11 illustrates the specific value changes in energy requirements resulting from the SBC upgrades by the National Committee.
Table 11.
SBC energy requirements upgrades (Bold numbers indicate the changes) [36,44,47,48].
Aldossary’s research established AAEC values for different residential buildings in KSA, albeit only covering the first two floors of low-rise residential building types [32].
Unfortunately, the top floors of buildings require more extensive energy upgrade interventions to achieve better performance, as they are more exposed to the sun’s heat and radiation due to additional external surfaces. Researchers have observed AAEC values ranging from 116 to 165 kWh/m2/year, which are predicted to be even higher for top floors. However, Aldossary proposed AAEC values in the range of 77–98 kWh/m2 to achieve a low carbon energy consumption level [7].
Various researchers, including Aldossary, Alaidroos, Krarti, and Hijazi, have explored different sets of energy retrofit measures that can reduce energy consumption in the residential building sector by 37%, 41.5%, 50%, and up to 80% when applying hybrid systems [18,32,49,50]. The literature often presents optimistic predictions of energy savings for existing buildings when implementing different energy-saving measures. In this study, detailed energy retrofit scenarios have been defined to provide a more realistic estimation of energy-saving possibilities for specific units in Jeddah. Additionally, factors such as infiltration rate (ACH50) and user thermal comfort temperature (°C) have been included, as they impact the AAEC results. However, the calculation did not consider thermal bridges due to the complexity of methodologies required to obtain accurate results [51].
5. Case Study Descriptions and Simulation Process
5.1. Building Location and Position Selection
The selected case study was the residential building described in detail in Section 3.4. Jeddah’s climate and location have been described in considerable detail in Section 3.4 and by Felimban, Talep, and Aldossary [1,32,52]. The building position that was eventually selected was based on simulation testing of six positions of a typical building in an urban setting. Then, the worst case was selected, where the average energy consumption was the highest. This will be further shown in the simulation progress section.
5.2. Building and Apartment Descriptions
Generally, the land area for a residential building varies among 20 m × 20 m, 20 m × 30 m, 25 m × 30 m, and 30 m × 30 m, with a built-up ratio maximum of 60% [36,53]. The building case was extracted from actual plans of a low-rise residential building (4 floors) provided by an architectural firm [54]. However, the case is based on a land size of 750 m2 (25 m × 30 m), resulting in a built-up floor area of around 450 m2. The selected building contains eight apartments (two per floor), and the first floor (ground floor) has parking spaces and other services, such as driver rooms and the main entrance. The apartments mainly face either west or east. However, the east and north sides face the neighboring buildings, while the west and south sides face the street. These factors have an effect on the AAEC for each apartment. Each apartment has three bedrooms, a living room, a kitchen, a dining room, a reception room, a maid room, and three bathrooms, as shown by the floor plans in Figure 13, Figure 14 and Figure 15.
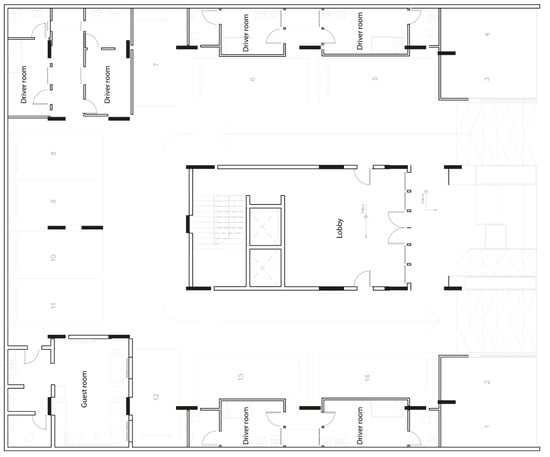
Figure 13.
First floor plan (ground floor) (14 Parking spots, 6 Driver rooms, and 1 guest room).
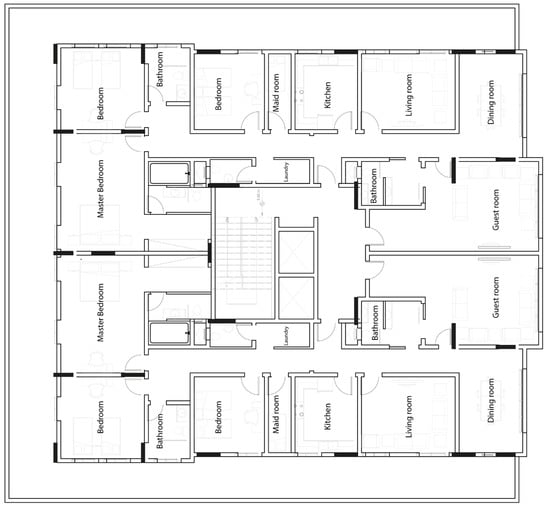
Figure 14.
Repeated floor plan (3 bedrooms, 1 maid room, 1 kitchen, 1 living room, 3 bathrooms, 1 dining room, and 1 guest room).
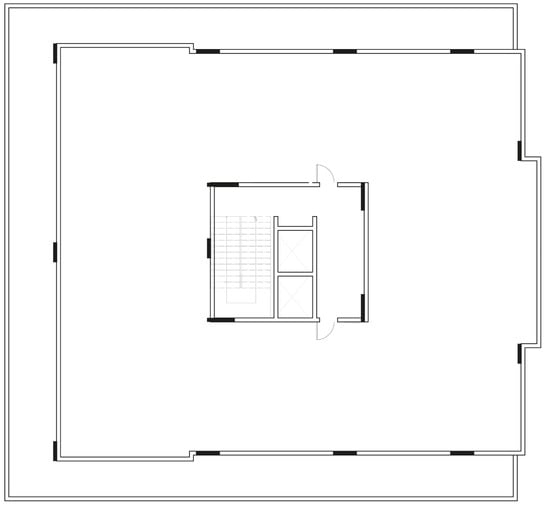
Figure 15.
Roof floor plan.
The building fabric was defined and illustrated based on previous studies and material properties. Table 12 and Table 13 demonstrate every component in respect to total U-values, component thickness, and other variables. The apartments on the east side of the building have the same floor area, which is around 215 m2, while on the west side, the area is around 225 m2.
Table 12.
Building specifications.
Table 13.
Building fabric description and current energy values of building components.
5.3. User Profile
In the real world, every apartment has a different user profile, while in this example, specific information has been used to create a basis, against which other apartments can be compared. The typical number of users in an apartment is 7, including a housemaid; the average family size is 5.9 members [45,55]. The activity in the apartment varies depending on the parents’ professions. However, in this study, it is assumed that user activities are based on a proposed schedule of activities and AC working duration hours, as demonstrated in Table 14. Furthermore, every room has a different number of hours during which the AC is used; the living room proved to be the most active room, with usage of 17.5 h per day, and the guest room was the least active room, using an average of 3 h per day, as Figure 16 illustrates.
Table 14.
User activity schedule for a case model of a Saudi Family.
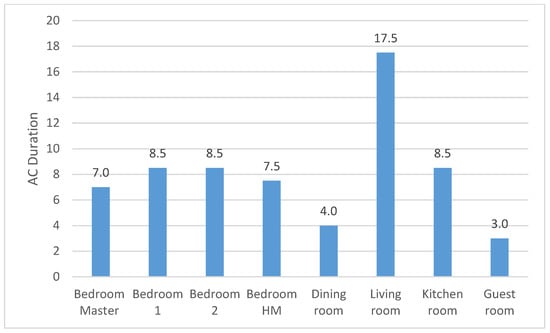
Figure 16.
Comparison of the average AC duration for different rooms per day.
The provided assumed activity hours were the minimum duration hours that varied among families. However, a compact schedule, i.e., a schedule where the people who lived in the house were there for the maximum number of hours, was taken as the basis to use later in the simulation program (DesignBuilder). The assumed schedule was applied to all the apartments to provide comparable numbers that could subsequently be validated. The occupancy percentage was 20% during the inactive hours (07:00–16:00).
5.4. Building Ownership
The ownership of a residential building was primarily only single ownership until it developed into a multi-ownership model. In 2018, the “Mullak” ownership system was introduced to settle the required rules for single- and especially multi-ownership types of apartments [56]. In this study, the ownership of a building has a significant role in designing the energy retrofitting scenarios, which have been divided into single-ownership or multi-ownership types.
Typically, the construction of any residential building falls within three types of constructors: individual, private developer, or governmental. Each type has different business activities that fulfil the construction’s primary goal. Therefore, the type of ownership falls under single- or multi-ownership, as Table 15 illustrates.
Table 15.
Different business activities for several building contractors.
The energy retrofitting scenarios have been divided into two primary types: indoor and outdoor. The indoor scenarios are possible for both ownership types, while the outdoor scenarios are only possible for the single-ownership type because of difficulties in the decision-making processes.
5.5. Simulation Description
The selected software was DesignBuilder [57], which allows engineer researchers to analyze the energy consumption of building energy. However, a comparative study of widely used dynamic simulation tools for buildings, such as EnergyPlus, TRNSYS, Simulink libraries CarnotUIBK and ALMABuild, IDA ICE, Modelica/Dymola, and DALEC, demonstrated a good consensus among these tools, despite the varying levels of input detail required by each tool [58]. The Design-Builder tool was chosen due to its availability in the market and its accessibility as a simulation software. It allows for the analysis and prediction of energy consumption in any structure using predefined datasets. The Design-Builder program is particularly user-friendly, making it suitable for educational purposes. It eliminates the need to extensively delve into software details and codes. The main features of using the Design-Builder software are its ability to simulate accurate environmental performance data, its fast simulation capabilities, and its ability to import various file types for 2D and 3D imaging. Additionally, one can save rendered images of any result at any stage [58,59].
The study modelled the case study in the DesignBuilder software using the collected actual floor plans from the Archteam firm. The data were entered based on previous studies described earlier in this section.
Initially, the floor plans were extracted from the provided documents, and a 3D model was constructed using the DesignBuilder software. The wall specifications were then added based on Table 13, which was derived from Table 5 and other relevant literature. Subsequently, the window and roof specifications were incorporated. Afterward, various datasets were inputted, including ACH50 (N50), setback temperature, climate data, and activity data. The simulation was then conducted to obtain annual energy consumption data, which were stored in an Excel file. The simulation covered 8 apartments, each with 17 scenarios (10 indoor and 7 outdoor), resulting in a total of 272 simulations per trial.
Due to various uncertainties, the simulation was repeated multiple times, accounting for factors such as the actual infiltration rate and the AC setback temperature, which are further elaborated upon in the subsequent sections. Each scenario’s simulation time ranged up to 7 s. The primary objective of using AAEC (Annualized Average Energy Consumption) was to compare the energy consumption before and after implementing the upgrading measures for all eight apartments within a single building.
6. Energy Retrofitting Scenario Description
The available energy retrofit interventions were described in the previous study as a guideline for designing the energy retrofitting scenarios in this section. Table 16 illustrates every energy upgrade scenario, as it shows the interventions used. In addition, Table 17 and Table 18 illustrate the scenarios designed to achieve the SBC requirements, where red colors mean that the value did not meet the SBC energy requirements, while green means that the value did meet the SBC energy requirements. The concept achieves high-resolution scenarios by starting with minimal changes and adding additional intervention to reach an efficient scenario that meets the SBC (green labels in Table 17 and Table 18). The design was divided into two categories, indoor scenarios and outdoor scenarios, and these are described as follows.
Table 17.
Indoor energy retrofit scenarios for a residential building in Jeddah (red color indicates did not meet the SBC and green color indicates the value meets the SBC).
Table 18.
Outdoor energy retrofit scenarios for a residential building in Jeddah (red color indicates did not meet the SBC and green color indicates the value meets the SBC).
6.1. Indoor Scenarios
In Table 17, Scenario 1 involves the replacement of windows with an energy-efficient option. Scenarios 2–5 incorporate additional measures to enhance wall insulation with local materials to achieve the required SBC U-values. Scenarios 6 and 7 incorporate the wall upgrade aspect of Scenario 5, with the window replacement, while the only difference between Scenarios 6 and 7 is the type of windows used. Scenarios 8 and 9 follow the approach of Scenario 7 and upgrade the roof U-value with two distinct U-values. Finally, Scenario 10 builds upon Scenario 8 and replaces the air-conditioning systems with efficient alternatives.
6.2. Outdoor Scenarios
In Table 18, Scenarios 1 and 2 incorporate external insulation and finishing systems (EIFSs) as add-on measures to improve the U-value of the walls. Scenarios 3 and 4 build upon Scenario 2 and replace the windows. Scenarios 5 and 6 follow the approach of Scenario 4, including upgrading the roof U-values. Lastly, Scenario 7 incorporates the measures from Scenario 5, but also involves replacing the air-conditioning systems with energy-efficient alternatives.
Table 17 and Table 18 demonstrate how and what the scenarios are. The central concept of designing the energy retrofit scenarios was to develop scenarios from a minor upgrade to a deeper upgrade using mixed energy retrofitting strategies (add-in, add-on, replace-it, and wrap-it) in order to reach the SBC energy requirements. The scenarios are intended to develop the targeted envelope component (wall, windows, and roof) to upgrade the heat-resistant value in order to achieve better performance. In both Table 17 and Table 18, the green color indicates that the value reached the SBC minimum standards.
The infiltration rate was assumed as 20 ACH50, as recommended by Makawi, where higher results could be possible for the basic case [60,61]. The rationale for employing a value of 20 ACH50 to represent infiltration in simulation software is based on several factors. ASHRAE defines infiltration as the unintended flow of outdoor air into a building through cracks, openings, and exterior doors [61]. Airtightness is a related concept, referring to the amount of air infiltrating a building at a pressure difference of 50 Pa [62]. Infiltration and airtightness are distinct but related phenomena, with empirical evidence suggesting that infiltration is typically around 1/20th the value of airtightness [62].
The blower door test (BDT) is commonly used to measure airtightness by measuring air change rates under a 50 Pa pressure difference [61]. The resulting value, known as ACH50, is a measure of the infiltration of outdoor air into a building and is influenced by envelope tightness. Infiltration can contribute significantly to a building’s heating and cooling loads, with estimates ranging from 25% to 50% in some studies [63,64]. Research has shown a wide range of ACH50 values in residential buildings, with values as high as 39 ACH50 in some cases [65]. However, the exact value will vary depending on various factors, including the type of window frames used.
In Saudi Arabia, a study found a lack of infiltration data on the building stock and recorded ACH50 values of 6.58 and 7.04 for 2 houses in Dhahran City [61]. These values were due to exfiltration caused by the central HVAC fan system. This study and other literature show that 20 ACH50 is not considered high for an existing residential building.
To validate the proposed energy retrofitting scenarios, a value of 20 ACH50 is used for the basic case model to improve this value to 4 ACH50, as required by the Saudi Building Code for the airtightness of residential buildings in Jeddah. This approach aligns with previous research recommendations and is based on a range of empirical evidence.
7. Results and Analysis
The energy performance simulation process follows three steps. The first step explores the highest average energy consumption of a residential building using different urban positions. The second step shows the different energy consumption results when the variables have been changed, such as the infiltration rate or how the temperature in the various rooms is controlled, which will later affect the possible energy-saving results. The third step involves performing an energy simulation for each proposed scenario in order to calculate the potential energy savings. Hence, every step will provide significant information that will help analyze the simulation results using different variables.
7.1. Step One: Building Position (Locating the Highest Energy Consumption)
In the KSA context, it is possible for a residential building to be situated in six different positions when the alone (no surrounding buildings) position faces towards the south (see Figure 17). The southwest (SW) position (see Figure 18) recorded the highest AAEC compared to other positions, as shown in Figure 19. The north position is found to have almost the same AAEC as 180 kWh/m2/year (the value is total average energy consumption of all apartments in one building), as shown in Figure 19 and Figure 20.
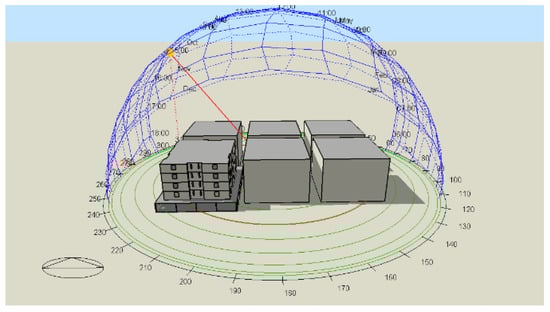
Figure 17.
Rendering of a residential building (south orientation).
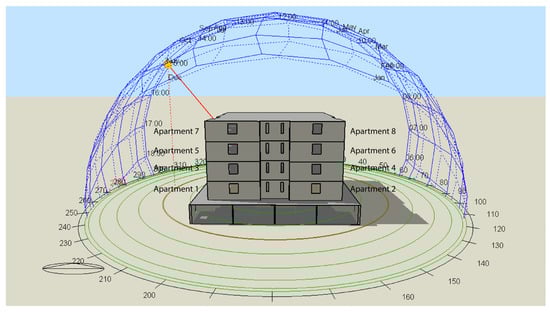
Figure 18.
Rendering of a residential building (southwest orientation) within other buildings.
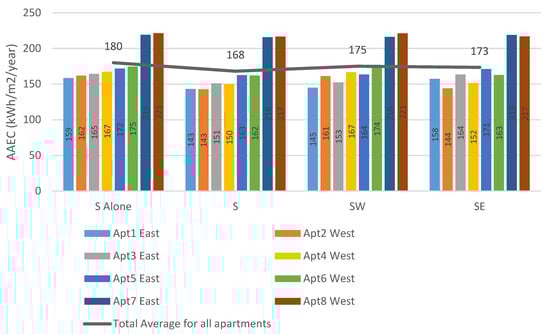
Figure 19.
Comparison of energy consumption for different building positions that face south.
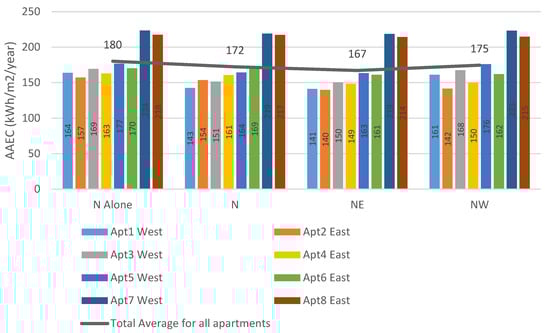
Figure 20.
Comparison of energy consumption for different building positions that face north.
7.2. Step Two: Effect of Changing Infiltration Rate and Cooling Temperature on AAEC
The infiltration rate ACH50 is crucial in determining the AAEC. In this study, ACH50 values of 4, 6, 7, 8, 15, 30, and 50 were considered, with 4 ACH50 considered best practice, according to the SBC [36]. The maximum ACH50 value of 50 was determined based on previous studies that found a maximum of 39 ACH50 through monitoring methods [65]. This study includes the infiltration rate and its impact on the AAEC, with results demonstrating the significance of the ACH50 on energy consumption for each scenario and apartment. The study used 20 ACH50, calibrated with the average energy consumption bill, as reported by Aldossary for the first 2 floors of the building [32]. Hence, different infiltration rates (50 to 4 ACH50) were tested, and when applying lower infiltration rates, lower AAEC results were achieved. Figure 21 demonstrates a range of increases in AAEC when only changing the infiltration rate from 50 to 4 within the same apartment. The AAEC increase percentages range from 62% to 74%, as the top-floor apartments with higher ACH50 had the highest values compared to the lower floors.
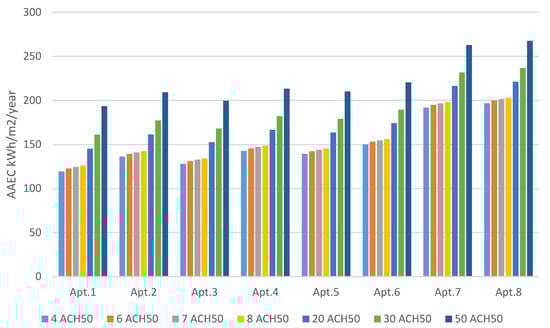
Figure 21.
Changes in the impact of the ACH50 rate on AAEC for every apartment in south orientation case.
The user comfort level is another factor affecting the AAEC, as cooler temperatures increase energy consumption, requiring extra cooling. The thermal comfort preferences of occupants in Jeddah vary, with a typical cooling temperature range of 19–24 °C, according to Felimban [1]. The scenarios for changing cooling temperatures highlight the impact on the AAEC. For example, as shown in Figure 22, the AAEC for apartment 1 decreases by approximately 4 kWh/m2/year when the cooling temperature is increased by 1 °C. However, decreasing the cooling temperature by 2 or 3 °C increases the AAEC by around 15, 33, or 51 kWh/m2/year. However, a lower cooling set-point temperature leads to a higher AAEC in air-conditioned apartments. To conclude, both the infiltration rate and user thermal comfort levels are considered primary impact factors that contribute to the increase or decrease in the AAEC, as shown in Figure 10 and Figure 11.
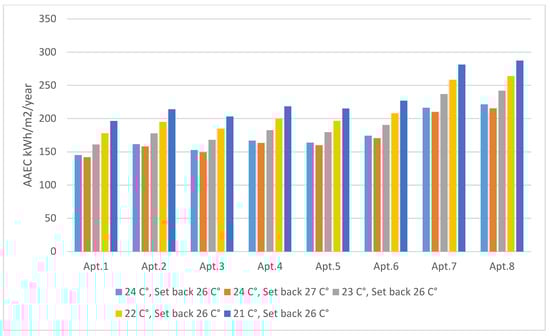
Figure 22.
Impact of changing the setback point of the cooling temperature on AAEC using DesignBuilder simulation in south orientation case.
7.3. Step Three: Energy Performance Simulation and Energy Savings
The energy simulation of the basic model used 20 ACH50 infiltration rates and aimed to produce scenarios targeting a rate of 4 ACH50, as the SBC standards require. According to the simulation results, Figure 12, Figure 13, Figure 17 and Figure 18 illustrate the AAEC for each apartment using infiltration rates of 20 and 4 ACH50. The following two sections illustrate the AAEC results that depend on the user scenario and the selected infiltration rate. The simulation was divided into indoor and outdoor scenarios, as explained earlier in the description of the scenarios.
- A
- —Indoor Scenarios
As previously explained, indoor scenarios can be applied individually to any apartment. The simulation results show an extensive reduction in AAEC when using a deep energy retrofit scenario (Scenario 10); the reduction was up to 121 kWh/m2/year. When applying a minor retrofit scenario (Scenario 2), it was possible to reduce the amount of electricity used by at least 34 kWh/m2/year compared to the basic model. In addition, the AAEC varied from one apartment to another depending on the apartment position (floor level) and the apartment orientation in the building. All of the deep retrofit scenarios led to a more efficient AAEC for all apartments.
The most critical factor of AAEC reduction was the insulation upgrades for the walls and roofs. Adding an insulation layer to the walls and roofs resulted in a significant sharp reduction in energy use, as shown in Figure 23 and Figure 24. Additional upgrade interventions, such as window replacement and roof upgrade, added further reduction to the energy consumption with different percentages.
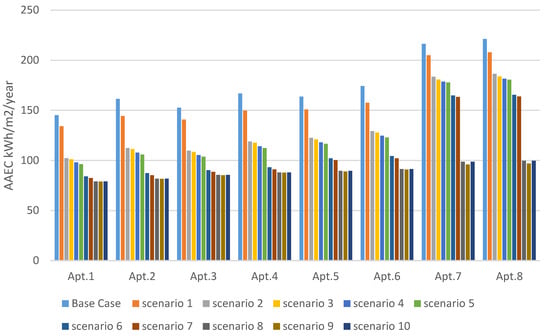
Figure 23.
AAEC values for indoor energy retrofitting scenarios using 4 ACH50 for infiltration rate.
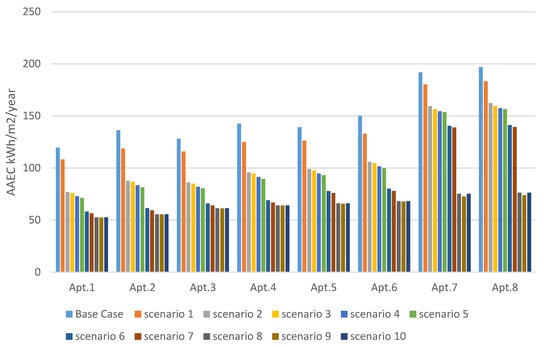
Figure 24.
AAEC values for indoor energy retrofitting scenarios using 20 ACH50 for infiltration rate.
It was also shown that window and AC upgrades greatly influence the ACH50 rate, where outdoor heat is prevented from penetrating through the air gaps to the indoor space.
Energy savings gradually increased from Scenario 1 (5–10%) to Scenario 10 (45–56%), where the infiltration rate was 20 ACH50, while for the 4 ACH50 infiltration rate, Scenario 1 (6–12%) to Scenario 10 (55–65%) are illustrated in Figure 25 and Figure 26. There were remarkable differences in energy savings between apartments when applying the different Scenarios (1, 2–5, 6–7, and 8–10).
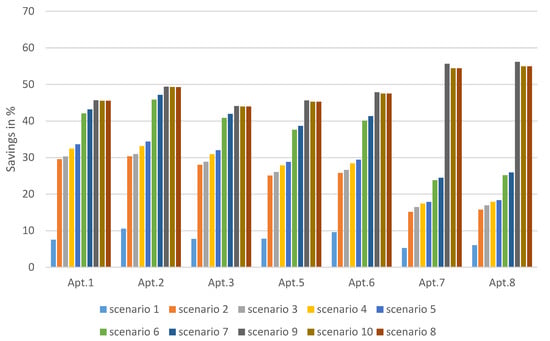
Figure 25.
Possible energy savings from testing different scenarios (indoor) where the infiltration rate is 20 ACH50.
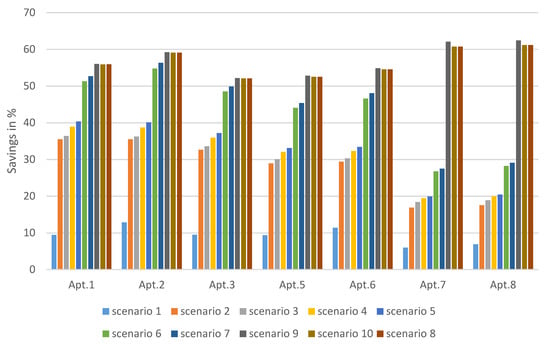
Figure 26.
Possible energy savings from testing different scenarios (indoor) where the infiltration rate is 4 ACH50.
Apartments 7 and 8 recorded around 60% savings when using Scenarios 8, 9, and 10, where additional insulation was added to the roofs. However, apartments 1–6 only had a slight savings increase when applying Scenarios 8, 9, and 10 compared to Scenarios 6 and 7. Apartments 7 and 8 had less energy savings than apartments 1-6 when using Scenarios 1–7. Therefore, it is suggested that every apartment has specific properties that require different energy retrofitting scenarios, and an individual cost analysis per apartment is required.
Furthermore, more energy savings were achieved when the basic model used 20 ACH50 and the applied scenarios used 4 ACH50. The energy savings increased for Scenario 1 from 5–10% to 17–26%, and for Scenario 10, they increased from 45–56% to 63–65%, where the change in the ACH50 rate had a significant impact on the energy savings percentage (see Figure 27). The considerable energy savings show the importance of considering infiltration rate levels in energy retrofitting applications to achieve a better AAEC for all apartments.
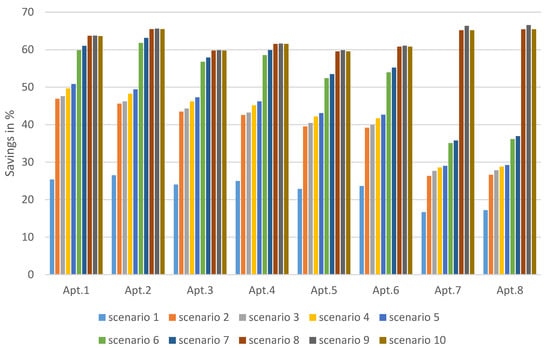
Figure 27.
Possible energy savings from testing different scenarios (indoor) where the infiltration rate is 4 ACH50, with a rate of 20 ACH50 for the basic model.
The indoor scenarios are very valuable for individual decision making for energy retrofit upgrades. The only concern in these indoor scenarios is the thermal heat transfers through the concrete skeleton structure (thermal bridges), especially when the structure intersects with an indoor partition. In this study, thermal bridges have not been incorporated in the calculations, as the main objective of the study was to calculate the overall energy-saving possibilities so that the factors could be easily calculated in the future in order to help retrofit the residential buildings and ensure energy efficiency.
In summary, the indoor scenarios of energy retrofitting applications have great potential to enhance the energy efficiency of residential apartments, with energy savings ranging from 20% to 65% depending on the apartment’s circumstances.
- B
- —Outdoor Scenarios
The outdoor scenarios, as observed earlier, can only be applied to the whole building and cannot be applied to individual upgrades to individual apartments. The simulation results show a sharp reduction in AAEC when using a deep energy retrofit scenario, as can be seen with Scenario 7 shown in Figure 28 and Figure 29. However, adding 10 cm of insulation to the outdoor wall, as shown in Scenario 1, can significantly reduce at least 50 kWh/m2/year compared to the basic model. Figure 28 and Figure 29 illustrate significant reductions in AAEC, each using different infiltration rates of 20 ACH50 and 4 ACH50.
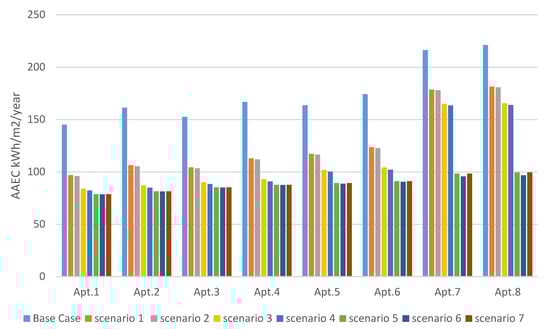
Figure 28.
AAEC for outdoor energy retrofitting scenarios using 20 ACH50 for the infiltration rate.
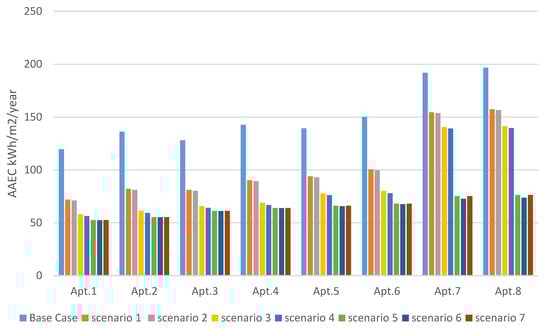
Figure 29.
AAEC for outdoor energy retrofitting scenarios using 4 ACH50 for the infiltration rate.
To provide more detail, Figure 28 presents different ranges of decrease of the AAEC depending on the apartment and the applied scenario. The AAEC results for apartment 1 show a 33% reduction for Scenario 1 and a 46% reduction for Scenario 7. However, apartment 8 records an 18% reduction for Scenario 1 and a 55% reduction for Scenario 7.
Apartments 1–6 gradually increased their energy savings when applying the scenarios in order, as Figure 30 and Figure 31 illustrate. Apartments 7 and 8 had less energy savings when using Scenarios 1–4 compared to the other apartments. However, outdoor Scenarios 5–7 significantly increased the energy savings for apartments 7 and 8. Generally, the high-resolution scenarios depend on the infiltration rate levels and the selected scenario.
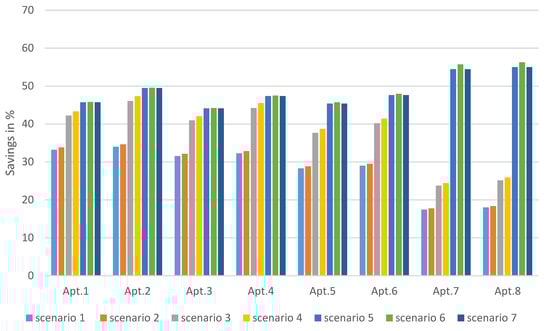
Figure 30.
Possible energy savings from testing different outdoor scenarios where the infiltration rate is 20 ACH50, with a rate of 20 ACH50 for the basic model.
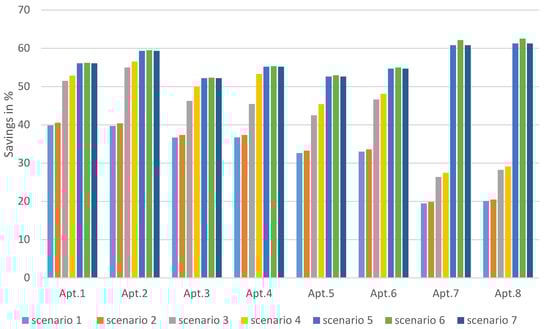
Figure 31.
Possible energy savings from testing different scenarios (outdoor) where the infiltration rate is 4 ACH50, with a rate of 4 ACH50 for the basic model.
Figure 31 indicates more promising energy savings for all units when applying scenarios that include improving the infiltration rate to 4 ACH50 compared to the results in Figure 31. Figure 32 shows decreasing savings percentages from 50% to around 30% for apartments 1 and 8, respectively. However, if any of Scenarios 5–7 applied to all apartments 1, 2, 3, 4, 5, 6, 7, and 8, then AAEC could reach efficient consumption values of 52, 55, 61, 63, 66, 68, 75, and 76 kWh/m2/year, respectively.
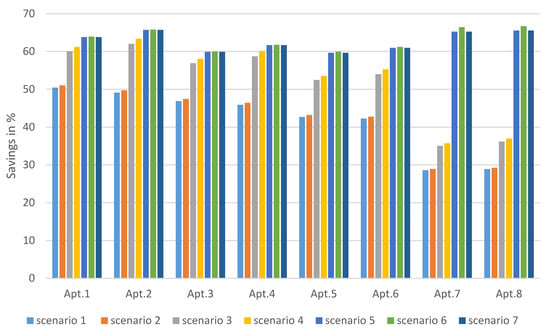
Figure 32.
Possible energy savings from testing different scenarios (outdoor) where the infiltration rate is 4 ACH50, with a rate of 20 ACH50 for the basic model.
In summary, the simulation results of the energy performance for residential buildings in Jeddah validated an optimistic range of energy savings (30–60%) when applying different energy retrofit scenarios.
8. Discussion
The discussion has been divided into three main points. Initially, the AAEC is discussed in respect to the eight apartments, based on the analyzed properties; secondly, the energy-saving possibilities are discussed in respect to applying different scenarios; finally, the uncertainties and the effects on the AAEC are addressed, such as the infiltration rate (ACH50) and the user thermal comfort temperature.
8.1. Average Annual Energy Consumption
The simulation results for residential apartments range from 145 to 221 kWh/m2/year, depending on the orientation and the floor level. Apartments situated on the upper floors consume more AAEC than apartments found lower in the building due to the heat exposure from the roof. For instance, apartments 7 and 8 recorded the highest AAEC of 216 and 221 kWh/m2/year.
The apartments that faced the west recorded a higher AAEC than east-facing apartments when they were located on the same floor. In addition, 2 west-facing apartments, i.e., apartments 2 and 4 (161, 166 kWh/m2/year), consumed more than the upper floor, east-facing apartments 3 and 5 (152, 163 kWh/m2/year). The apartment location, specifically the orientation and floor level, are the main factors used to calculate the AAEC.
8.2. Energy-Saving Possibilities
In general, the simulation results demonstrate a significant impact from every scenario. The impact degree is based on the weaknesses in the envelope component design, such as the walls, the windows, or the roof. Furthermore, in respect to apartments 1–6, the weaknesses came from the walls and the windows, where different energy savings were recorded from Scenarios 1–7, ranging from 7% to 47%, whereas Scenarios 8–10 only add about 2% savings compared to Scenario 7.
The weaknesses in apartments 7 and 8 were due to all components, and the roof presented the main weakness. For instance, apartment 8 had energy savings when applying Scenarios 1–7, ranging from 6% to 26%, and 55% to 56% for Scenarios 8–10.
Every scenario has energy-saving possibilities, leading to better energy performance to achieve the main objective of extensive simulation validation.
8.3. Uncertainties
Uncertainty factors affect the AAEC, such as the actual infiltration rate and the user’s thermal preferences (user thermal comfort). Each factor dramatically influences the AAEC as they can increase the energy-saving possibilities when they are known before designing the possible energy scenarios.
An actual infiltration rate (ACH50) is a significant factor that can be used to demonstrate actual energy savings, as Figure 33 illustrates. It is also important to note that the savings percentage increased when the infiltration rate was enhanced.
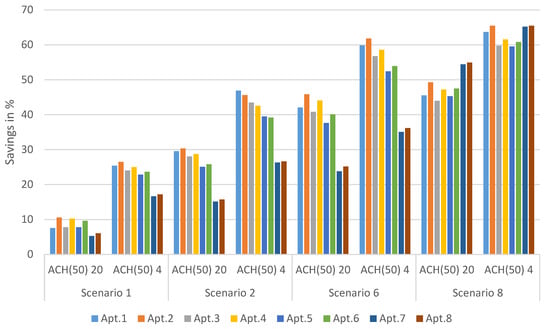
Figure 33.
Possible energy savings when different infiltration rates were applied.
The existing residential buildings in Jeddah, KSA, currently require an air conditioning system every day of the year when an infiltration procedure occurs. If the infiltration rate is tested, then the air tightness of the indoor spaces could be designed better in the energy retrofitting scenarios.
The other factor is the difference in user thermal comfort. User thermal comfort varies from family to family. However, both the infiltration rate and cooling temperature affect the increasing possibility of AAEC for all apartments, as Figure 34 illustrates. Understanding the user’s thermal comfort would help designers and occupants to lower their energy usage; increasing designers’ awareness so that thermal comfort is considered in the design process is very important. In short, higher cooling temperatures and lower infiltration rates lead to extensive energy savings.
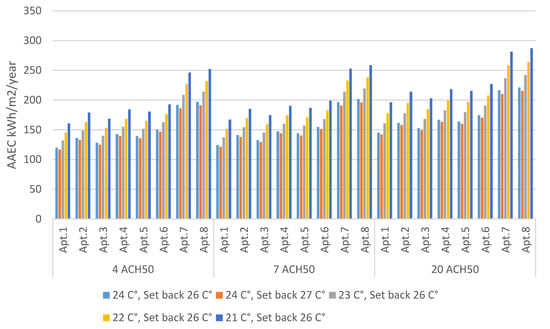
Figure 34.
Impacts of cooling temperature and infiltration rate change on AAEC for all apartments.
9. Conclusions
The energy retrofit scenarios presented in this study were validated through digital simulation using DesignBuilder software to demonstrate the potential for energy savings. The baseline case model yielded AAEC values for apartments 1, 2, 3, 4, 5, 6, 7, and 8, respectively, of 145, 161, 152, 166, 163, 174, 216, and 221 kWh/m2/year. However, it is important to note that the building’s location within the urban environment influences the AAEC for all units. Additionally, the position of each apartment (orientation and floor level) results in different AAEC values.
This paper has presented a comprehensive case study that considers crucial elements, such as building location, apartment positioning, user profiles, and ownership types. Two energy-upgrade scenarios, focusing on indoor and outdoor improvements, were introduced for the eight apartments. These scenarios primarily involve upgrading building components (walls, windows, and roofs) to meet the energy benchmark level defined by the upgraded SBC energy standards. The outcomes of the analysis provide insights into key variables that can significantly impact energy savings. It is worth noting that achieving the highest energy savings depends on various factors, including interventions for improving the building envelope, enhancing the infiltration rate, and determining the desired level of thermal comfort. While the simulation encompassed different design variables, two main variables (infiltration and user thermal comfort level) can yield more accurate AAEC values if known during the scenario design phase.
However, it is important to consider not only energy savings, but also the cost aspect, when selecting the optimal scenario. Evaluating the cost associated with each scenario is crucial to determine its suitability for individual cases. This aspect will be further explored in a subsequent paper, providing a more comprehensive understanding.
In conclusion, based on the analysis of energy retrofit scenarios in Jeddah, a series of simulations was conducted to confirm the potential for energy savings, ranging from 25% to 66%. The findings emphasize the significance of implementing energy-saving measures and highlight the opportunities for improving energy efficiency in the residential building sector.
Author Contributions
Conceptualization, A.F., U.K. and T.K.; Methodology, A.F., U.K. and T.K.; Validation, A.F.; Formal analysis, A.F.; Writing—original draft, A.F.; Writing—review & editing, A.F.; Visualization, A.F.; Supervision, U.K. and T.K. All authors have read and agreed to the published version of the manuscript.
Funding
This research received no financial support for the research, authorship, and/or publication of this article.
Conflicts of Interest
The authors declare no conflict of interest with respect to the research results, authorship, and/or publication of this article.
Nomenclature
| List of abbreviations | |
| AAEC | Average Annual Energy Consumption |
| ACH | Air Change per Hour |
| ACH50 | Air Changes per Hour at 50 pascals pressure differential |
| CDD | Cooling Degree Days |
| COP | Coefficient of Performance |
| CSS | Concrete Skeleton Structure |
| EIFS | External Insulation Finishing System |
| EPS | Expanded Polystyrene Insulation |
| ERA | Energy Retrofitting Application |
| GCC | Gulf Cooperation Council |
| KPI | Key Performance Indicator |
| KSA | Kingdom of Saudi Arabia |
| SBC | Saudi Building Code |
| SEEC | Saudi Energy Efficiency Centre |
| WWR | Window-to-Wall Ratio |
| XPS | Extruded Polystyrene Insulation |
References
- Felimban, A.; Prieto, A.; Knaack, U.; Klein, T.; Qaffas, Y. Assessment of Current Energy Consumption in Residential Buildings in Jeddah, Saudi Arabia. Buildings 2019, 9, 163. [Google Scholar] [CrossRef]
- Saudi Energy Efficiency Center. BUILDINGS|Saudi Energy Efficiency Center. 2018. Available online: https://www.seec.gov.sa/en/energy-sectors/buildings-sector/ (accessed on 21 October 2018).
- Krarti, M.; Aldubyan, M.; Williams, E. Residential building stock model for evaluating energy retrofit programs in Saudi Arabia. Energy 2020, 195, 116980. [Google Scholar] [CrossRef]
- Laponche, B.; López, J.; Raoust, M.; Devernois, N. Energy Efficiency Retrofitting of Buildings: Challenges and Methods; Research Program in Hubei Province, China; Agence Française de Développement: Paris, France, 2012; p. 182. Available online: http://www.afd.fr/webdav/site/afd/shared/PUBLICATIONS/RECHERCHE/Scientifiques/Focales/08-VA-Focales.pdf (accessed on 13 March 2023).
- Aldossary, N.A.; Rezgui, Y.; Kwan, A. Domestic energy consumption patterns in a hot and arid climate: A multiple-case study analysis. Renew. Energy 2014, 62, 369–378. [Google Scholar] [CrossRef]
- AlFaris, F.; Juaidi, A.; Manzano-Agugliaro, F. Energy retrofit strategies for housing sector in the arid climate. Energy Build. 2016, 131, 158–171. [Google Scholar] [CrossRef]
- Aldossary, N.A.; Rezgui, Y.; Kwan, A. Establishing domestic low energy consumption reference levels for Saudi Arabia and the Wider Middle Eastern Region. Sustain. Cities Soc. 2017, 28, 265–276. [Google Scholar] [CrossRef]
- Konstantinou, T. Supporting the Design of Residential Energy Upgrades. Ph.D. Thesis, Delft University of Technology, Delft, The Netherlands, 2014. [Google Scholar]
- Al-Ragom, F. Retrofitting residential buildings in hot and arid climates. Energy Convers. Manag. 2003, 44, 2309–2319. [Google Scholar] [CrossRef]
- Krarti, M. Evaluation of large scale building energy efficiency retrofit program in Kuwait. Renew. Sustain. Energy Rev. 2015, 50, 1069–1080. [Google Scholar] [CrossRef]
- Ameer, B.; Krarti, M. Impact of subsidization on high energy performance designs for Kuwaiti residential buildings. Energy Build. 2016, 116, 249–262. [Google Scholar] [CrossRef]
- Taleb, H.M. Using passive cooling strategies to improve thermal performance and reduce energy consumption of residential buildings in U.A.E. buildings. Front. Arch. Res. 2014, 3, 154–165. [Google Scholar] [CrossRef]
- Rakhshan, K.; Friess, W.A. Effectiveness and viability of residential building energy retrofits in Dubai. J. Build. Eng. 2017, 13, 116–126. [Google Scholar] [CrossRef]
- Giusti, L.; Almoosawi, M. Impact of building characteristics and occupants’ behaviour on the electricity consumption of households in Abu Dhabi (UAE). Energy Build. 2017, 151, 534–547. [Google Scholar] [CrossRef]
- Friess, W.A.; Rakhshan, K. A review of passive envelope measures for improved building energy efficiency in the UAE. Renew. Sustain. Energy Rev. 2017, 72, 485–496. [Google Scholar] [CrossRef]
- Al-Saadi, S.N.; Al-Hajri, J.; Sayari, M.A. Energy-Efficient Retrofitting Strategies for Residential Buildings in hot climate of Oman. Energy Procedia 2017, 142, 2009–2014. [Google Scholar] [CrossRef]
- Alalouch, C.; Al-Saadi, S.; AlWaer, H.; Al-Khaled, K. Energy saving potential for residential buildings in hot climates: The case of Oman. Sustain. Cities Soc. 2019, 46, 101442. [Google Scholar] [CrossRef]
- Alaidroos, A.; Krarti, M. Optimal design of residential building envelope systems in the Kingdom of Saudi Arabia. Energy Build. 2015, 86, 104–117. [Google Scholar] [CrossRef]
- Alaboud, M.; Gadi, M. Indoor environmental monitoring of residential buildings in Saudi Arabia, Makkah: A case study. IOP Conf. Ser. Mater. Sci. Eng. 2019, 609, 042044. [Google Scholar] [CrossRef]
- Krarti, M.; Dubey, K.; Howarth, N. Energy productivity analysis framework for buildings: A case study of GCC region. Energy 2019, 167, 1251–1265. [Google Scholar] [CrossRef]
- Webb, A.L. Energy retrofits in historic and traditional buildings: A review of problems and methods. Renew. Sustain. Energy Rev. 2017, 77, 748–759. [Google Scholar] [CrossRef]
- Ma, Z.; Cooper, P.; Daly, D.; Ledo, L. Existing building retrofits: Methodology and state-of-the-art. Energy Build. 2012, 55, 889–902. [Google Scholar] [CrossRef]
- Natural Resources Canada. Retrofitting. Available online: https://www.nrcan.gc.ca/retrofitting/20707 (accessed on 15 June 2020).
- Marina Economidou. Energy Renovation Programme. European Energy Efficiency Platform (E3P). 2016. Available online: https://e3p.jrc.ec.europa.eu/articles/energy-renovation (accessed on 1 March 2020).
- Building and Construction Authority. Existing Building Retrofit. 2010. Available online: www.bca.gov.sg (accessed on 20 March 2022).
- What Is a Building Retrofit? Available online: https://www.melbourne.vic.gov.au/business/sustainable-business/1200-buildings/building-retrofit/Pages/building-retrofit.aspx (accessed on 1 March 2020).
- Energy Efficient Retrofitting of Buildings. Available online: https://www.bable-smartcities.eu/explore/solutions/solution/energy-efficient-retrofitting-of-buildings.html (accessed on 1 March 2020).
- Zhivov, A.; Lohse, R. Deep Energy Retrofit—A Guide for Decision Makers; Springer International Publishing: Cham, Switzerland, 2021. [Google Scholar]
- Ministry of Human Resources and Social Development. Social Development Bank. 2019. Available online: https://www.sdb.gov.sa/en-us/our-products/personal/social-loans/sub-pages/application-rules (accessed on 16 January 2020).
- Austah, M. Private House Renovation in Yanbu City, KSA. 2020. Available online: https://twitter.com/MoaadAustah/status/1245081929789079556 (accessed on 19 September 2020).
- Saudi Electricity Company. Fixed Bill Service. Available online: https://www.se.com.sa/en-us/Customers/Pages/Fixed_Bill/About.aspx (accessed on 22 March 2023).
- Aldossary, N.A.; Rezgui, Y.; Kwan, A. Domestic energy consumption patterns in a hot and humid climate: A multiple-case study analysis. Appl. Energy 2014, 114, 353–365. [Google Scholar] [CrossRef]
- Solar Decathlon Middle East. Available online: https://www.solardecathlonme.com/ (accessed on 19 June 2020).
- Solar Decathlon Middle East Virginia Tech Team. Available online: https://www.solardecathlonme.com/teams/team-virginia-tech (accessed on 19 June 2020).
- Alarabiya.net. Amendments to the Requirements of the Saudi Building Code for Residential Buildings. 2021. Available online: www.alarabiya.net/aswaq/realestate/2021/10/06/%D8%AA%D8%B9%D8%AF%D9%8A%D9%84%D8%A7%D8%AA-%D9%81%D9%8A-%D9%85%D8%AA%D8%B7%D9%84%D8%A8%D8%A7%D8%AA-%D9%83%D9%88%D8%AF-%D8%A7%D9%84%D8%A8%D9%86%D8%A7%D8%A1-%D8%A7%D9%84%D8%B3%D8%B9%D9%88%D8%AF%D9%8A-%D9%84%D9%84%D9%85%D8%A8%D8%A7%D9%86%D9%8A-%D8%A7%D9%84%D8%B3%D9%83%D9%86%D9%8A%D8%A9 (accessed on 10 March 2023).
- The Saudi Building Code National Committee (Regulations). SBC 602: Energy Conservation Requirements (Arabic). 2018. Available online: https://www.sbc.gov.sa/resources/PdfPreview/web/viewer.html?avx=PUlqTQ==&type=0 (accessed on 20 February 2020).
- Krarti, M.; Dubey, K.; Howarth, N. Evaluation of building energy efficiency investment options for the Kingdom of Saudi Arabia. Energy 2017, 134, 595–610. [Google Scholar] [CrossRef]
- Alrashed, F.; Asif, M. Climatic Classifications of Saudi Arabia for Building Energy Modelling. Energy Procedia 2015, 75, 1425–1430. [Google Scholar] [CrossRef]
- Al-Hadhrami, L. Comprehensive review of cooling and heating degree days characteristics over Kingdom of Saudi Arabia. Renew. Sustain. Energy Rev. 2013, 27, 305–314. [Google Scholar] [CrossRef]
- Ministry of Municipalities Rural Affairs & Housing (MOMRAH). Sakani. Available online: https://sakani.sa/ (accessed on 19 March 2020).
- Alayed, E.; O’Hegarty, R.; Kinnane, O. Thermal envelope analysis for new code compliance of Saudi Arabian dwellings. Energy Build. 2021, 243, 110997. [Google Scholar] [CrossRef]
- Thermal Insulation Material List. 2023. Available online: https://www.ewa.bh/en/contact/Documents/March2023TIPlist.pdf (accessed on 13 March 2023).
- Kumar, D.; Alam, M.; Zou, P.X.W.; Sanjayan, J.G.; Memon, R.A. Comparative analysis of building insulation material properties and performance. Renew. Sustain. Energy Rev. 2020, 131, 110038. [Google Scholar] [CrossRef]
- Saudi Energy Efficiency Center. The Guide for Thermal Insulation Systems and Materials According to the Requirements of the Saudi Building Code. Volume 1. 2018. Available online: www.seec.gov.sa/en/seec/ (accessed on 20 March 2020).
- General Authority for Statistics. Annual Report 2017. 2018. Available online: https://www.stats.gov.sa/sites/default/files/annualreport2017.pdf (accessed on 17 October 2018).
- Yearly Report 2021. 2021. Available online: https://www.seec.gov.sa/media/44alu10p/seec-ar-2021.pdf (accessed on 15 October 2022).
- Almasri, R.A.; Alardhi, A.A.; Dilshad, S. Investigating the Impact of Integration the Saudi Code of Energy Conservation with the Solar PV Systems in Residential Buildings. Sustainability 2021, 13, 3384. [Google Scholar] [CrossRef]
- Saudi Building Committee. Issuance of Temporary Flexibility for Thermal Insulation Coefficient. 2022. Available online: https://sbc.gov.sa/ar/MediaCenter/Pages/NewsDetails.aspx?NewstId=90 (accessed on 14 March 2023).
- Krarti, M.; Howarth, N. Transitioning to high efficiency air conditioning in Saudi Arabia: A benefit cost analysis for residential buildings. J. Build. Eng. 2020, 31, 101457. [Google Scholar] [CrossRef]
- Hijazi, J.; Howieson, S. Displacing air conditioning in Kingdom of Saudi Arabia: An evaluation of ‘fabric first’ design integrated with hybrid night radiant and ground pipe cooling systems. Build. Serv. Eng. Res. Technol. 2018, 39, 377–390. [Google Scholar] [CrossRef]
- Theodosiou, T.; Tsikaloudaki, K.; Kontoleon, K.; Giarma, C. Assessing the accuracy of predictive thermal bridge heat flow methodologies. Renew. Sustain. Energy Rev. 2021, 136, 110437. [Google Scholar] [CrossRef]
- Taleb, H.M.; Sharples, S. Developing sustainable residential buildings in Saudi Arabia: A case study. Appl. Energy 2011, 88, 383–391. [Google Scholar] [CrossRef]
- Ministry of Municipalities Rural Affairs & Housing (MOMRAH). Sakani-Real State Market. Available online: https://sakani.sa/app/marketplace?land_types=moh_lands®ion_id=2&unit_type=land&project_types=lands_moh_land&marketplace_purpose=buy&view_mode=list&sort=-publish_date (accessed on 14 March 2023).
- Architecture Team. 2020. Available online: http://www.archteam.co/ (accessed on 14 March 2020).
- Al-Khraif, R.; Salam, A.A.; Rashid, M.F.A. Family Demographic Transition in Saudi Arabia: Emerging Issues and Concerns. SAGE Open 2020, 10, 2158244020914556. [Google Scholar] [CrossRef]
- Ministry of Municipalities Rural Affairs & Housing (MOMRAH). Mullak. Available online: https://mullak.housing.gov.sa/public-page/246 (accessed on 2 February 2021).
- Design Builder Software. 2016. Available online: https://designbuilder.co.uk/ (accessed on 6 February 2020).
- Magni, M.; Ochs, F.; de Vries, S.; Maccarini, A.; Sigg, F. Detailed cross comparison of building energy simulation tools results using a reference office building as a case study. Energy Build. 2021, 250, 111260. [Google Scholar] [CrossRef]
- Pawar, B.; Kanade, P. Energy Optimization of Building Using Design Builder Software. Int. J. New Technol. Res. 2018, 4, 263152. [Google Scholar]
- Makawi, M.A. The Impact of Air Infiltration on Energy Performance of Single-Family Detached Houses in Hot Climate. Master’s Thesis, King Fahd University of Petroleum and Minerals, Dhahran, Saudi Arabia, 2020. [Google Scholar]
- Makawi, M.A.; Budaiwi, I.M.; Abdou, A.A. Characterization of Envelope Air Leakage Behavior for Centrally Air-Conditioned Single-Family Detached Houses. Buildings 2023, 13, 660. [Google Scholar] [CrossRef]
- Prignon, M.; Van Moeseke, G. Factors influencing airtightness and airtightness predictive models: A literature review. Energy Build. 2017, 146, 87–97. [Google Scholar] [CrossRef]
- Sorgato, M.; Melo, A.; Lamberts, R. The effect of window opening ventilation control on residential building energy consumption. Energy Build. 2016, 133, 1–13. [Google Scholar] [CrossRef]
- Sherman, M.H.; Wanyu, R.C. Building Airtightness: Research and Practice; Routledge: Oxfordshire, UK, 2004. [Google Scholar]
- Ambrose, M.; Syme, M. Air Tightness of New Australian Residential Buildings. Procedia Eng. 2017, 180, 33–40. [Google Scholar] [CrossRef]


Disclaimer/Publisher’s Note: The statements, opinions and data contained in all publications are solely those of the individual author(s) and contributor(s) and not of MDPI and/or the editor(s). MDPI and/or the editor(s) disclaim responsibility for any injury to people or property resulting from any ideas, methods, instructions or products referred to in the content. |
© 2023 by the authors. Licensee MDPI, Basel, Switzerland. This article is an open access article distributed under the terms and conditions of the Creative Commons Attribution (CC BY) license (https://creativecommons.org/licenses/by/4.0/).