
Seismic Risk of Weak First-Story RC Structures with Inerter Dampers Subjected to Narrow-Band Seismic Excitations

 , ,
, ,
Abstract
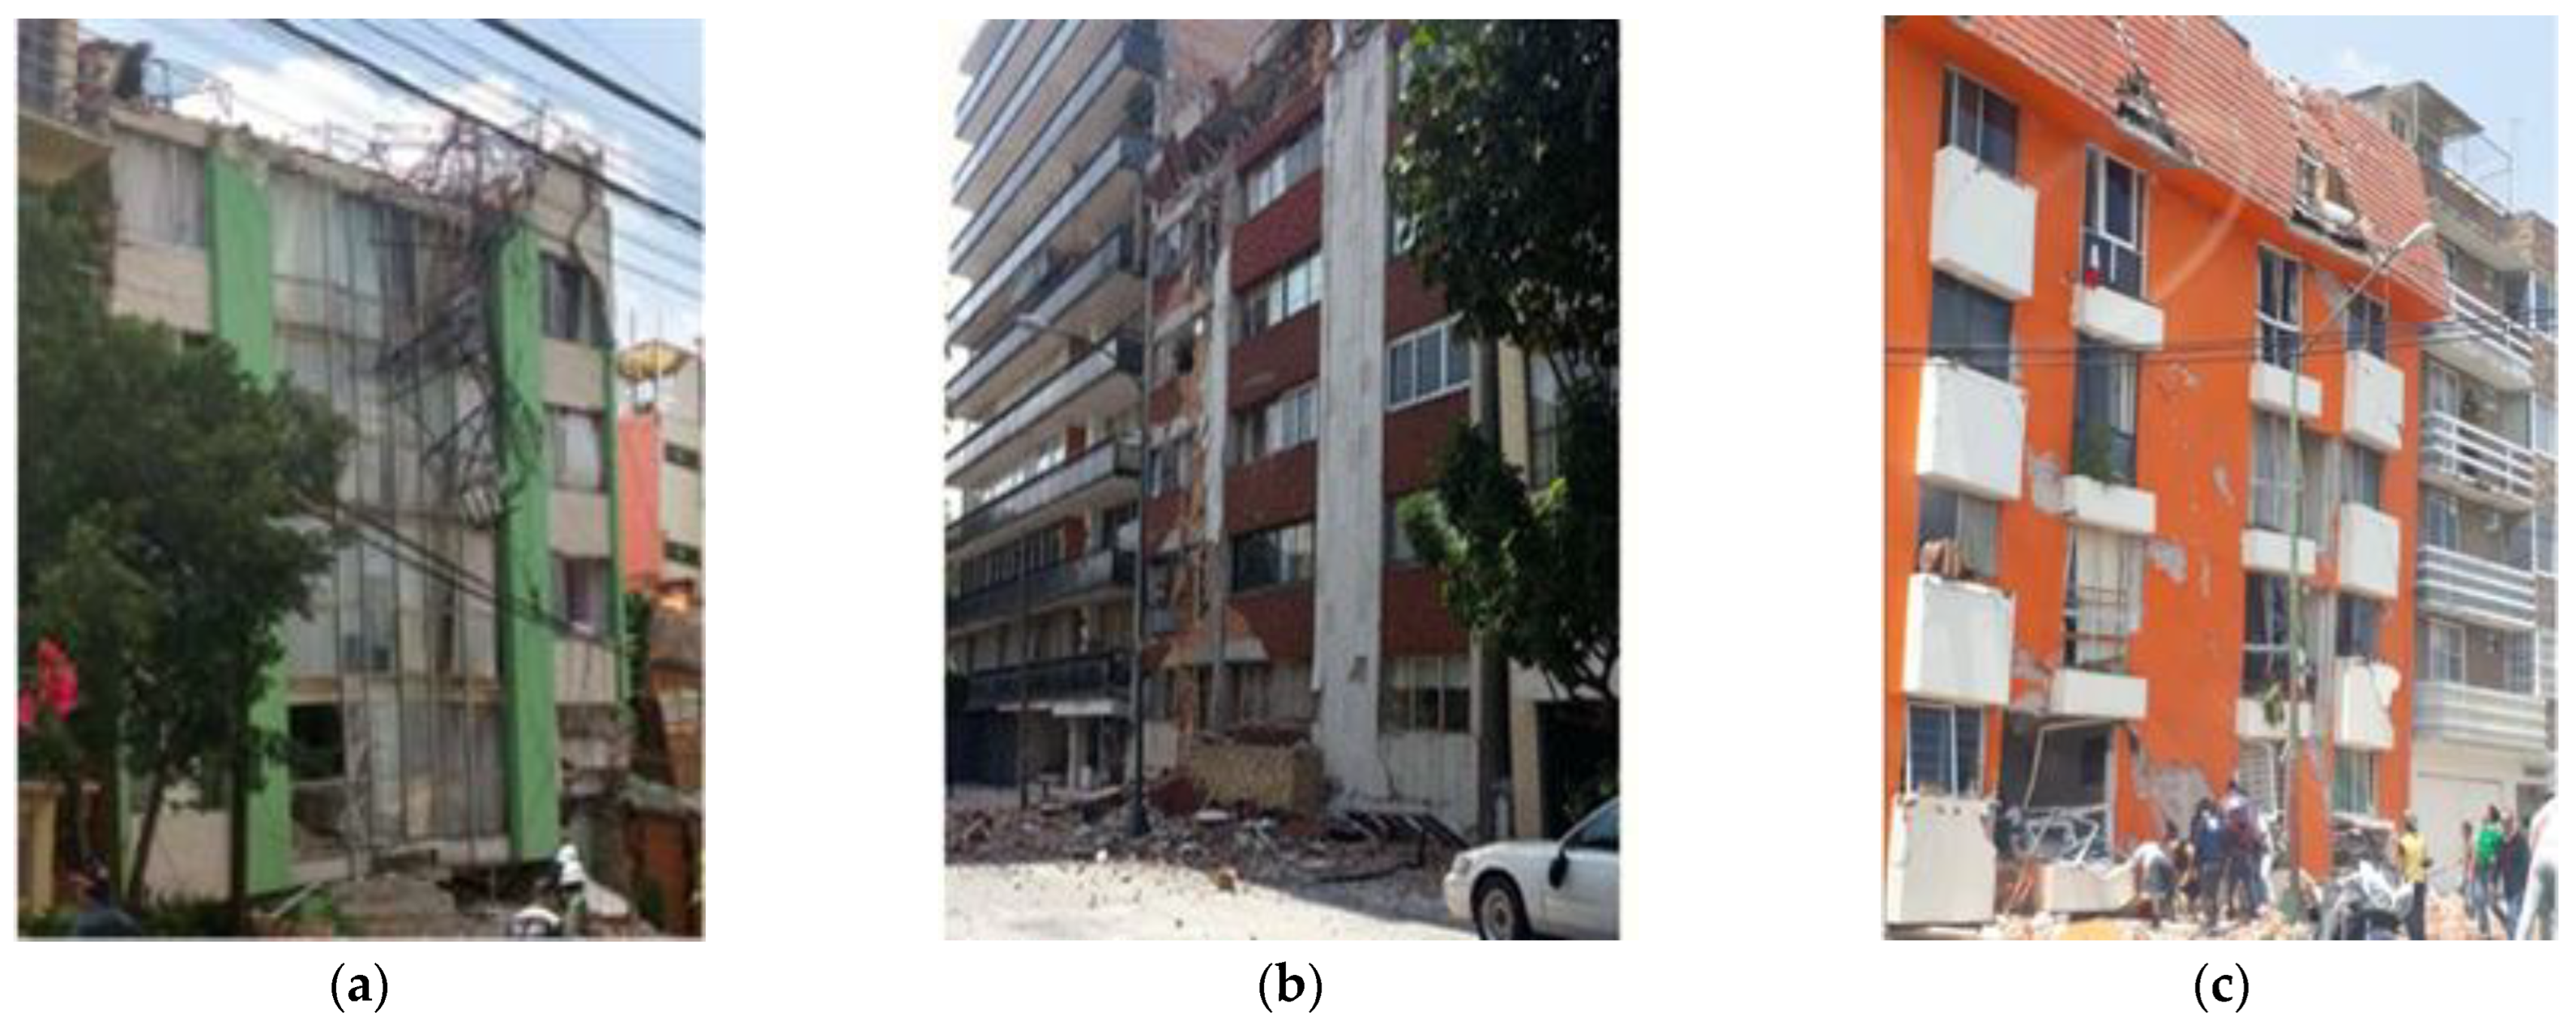
1. Introduction
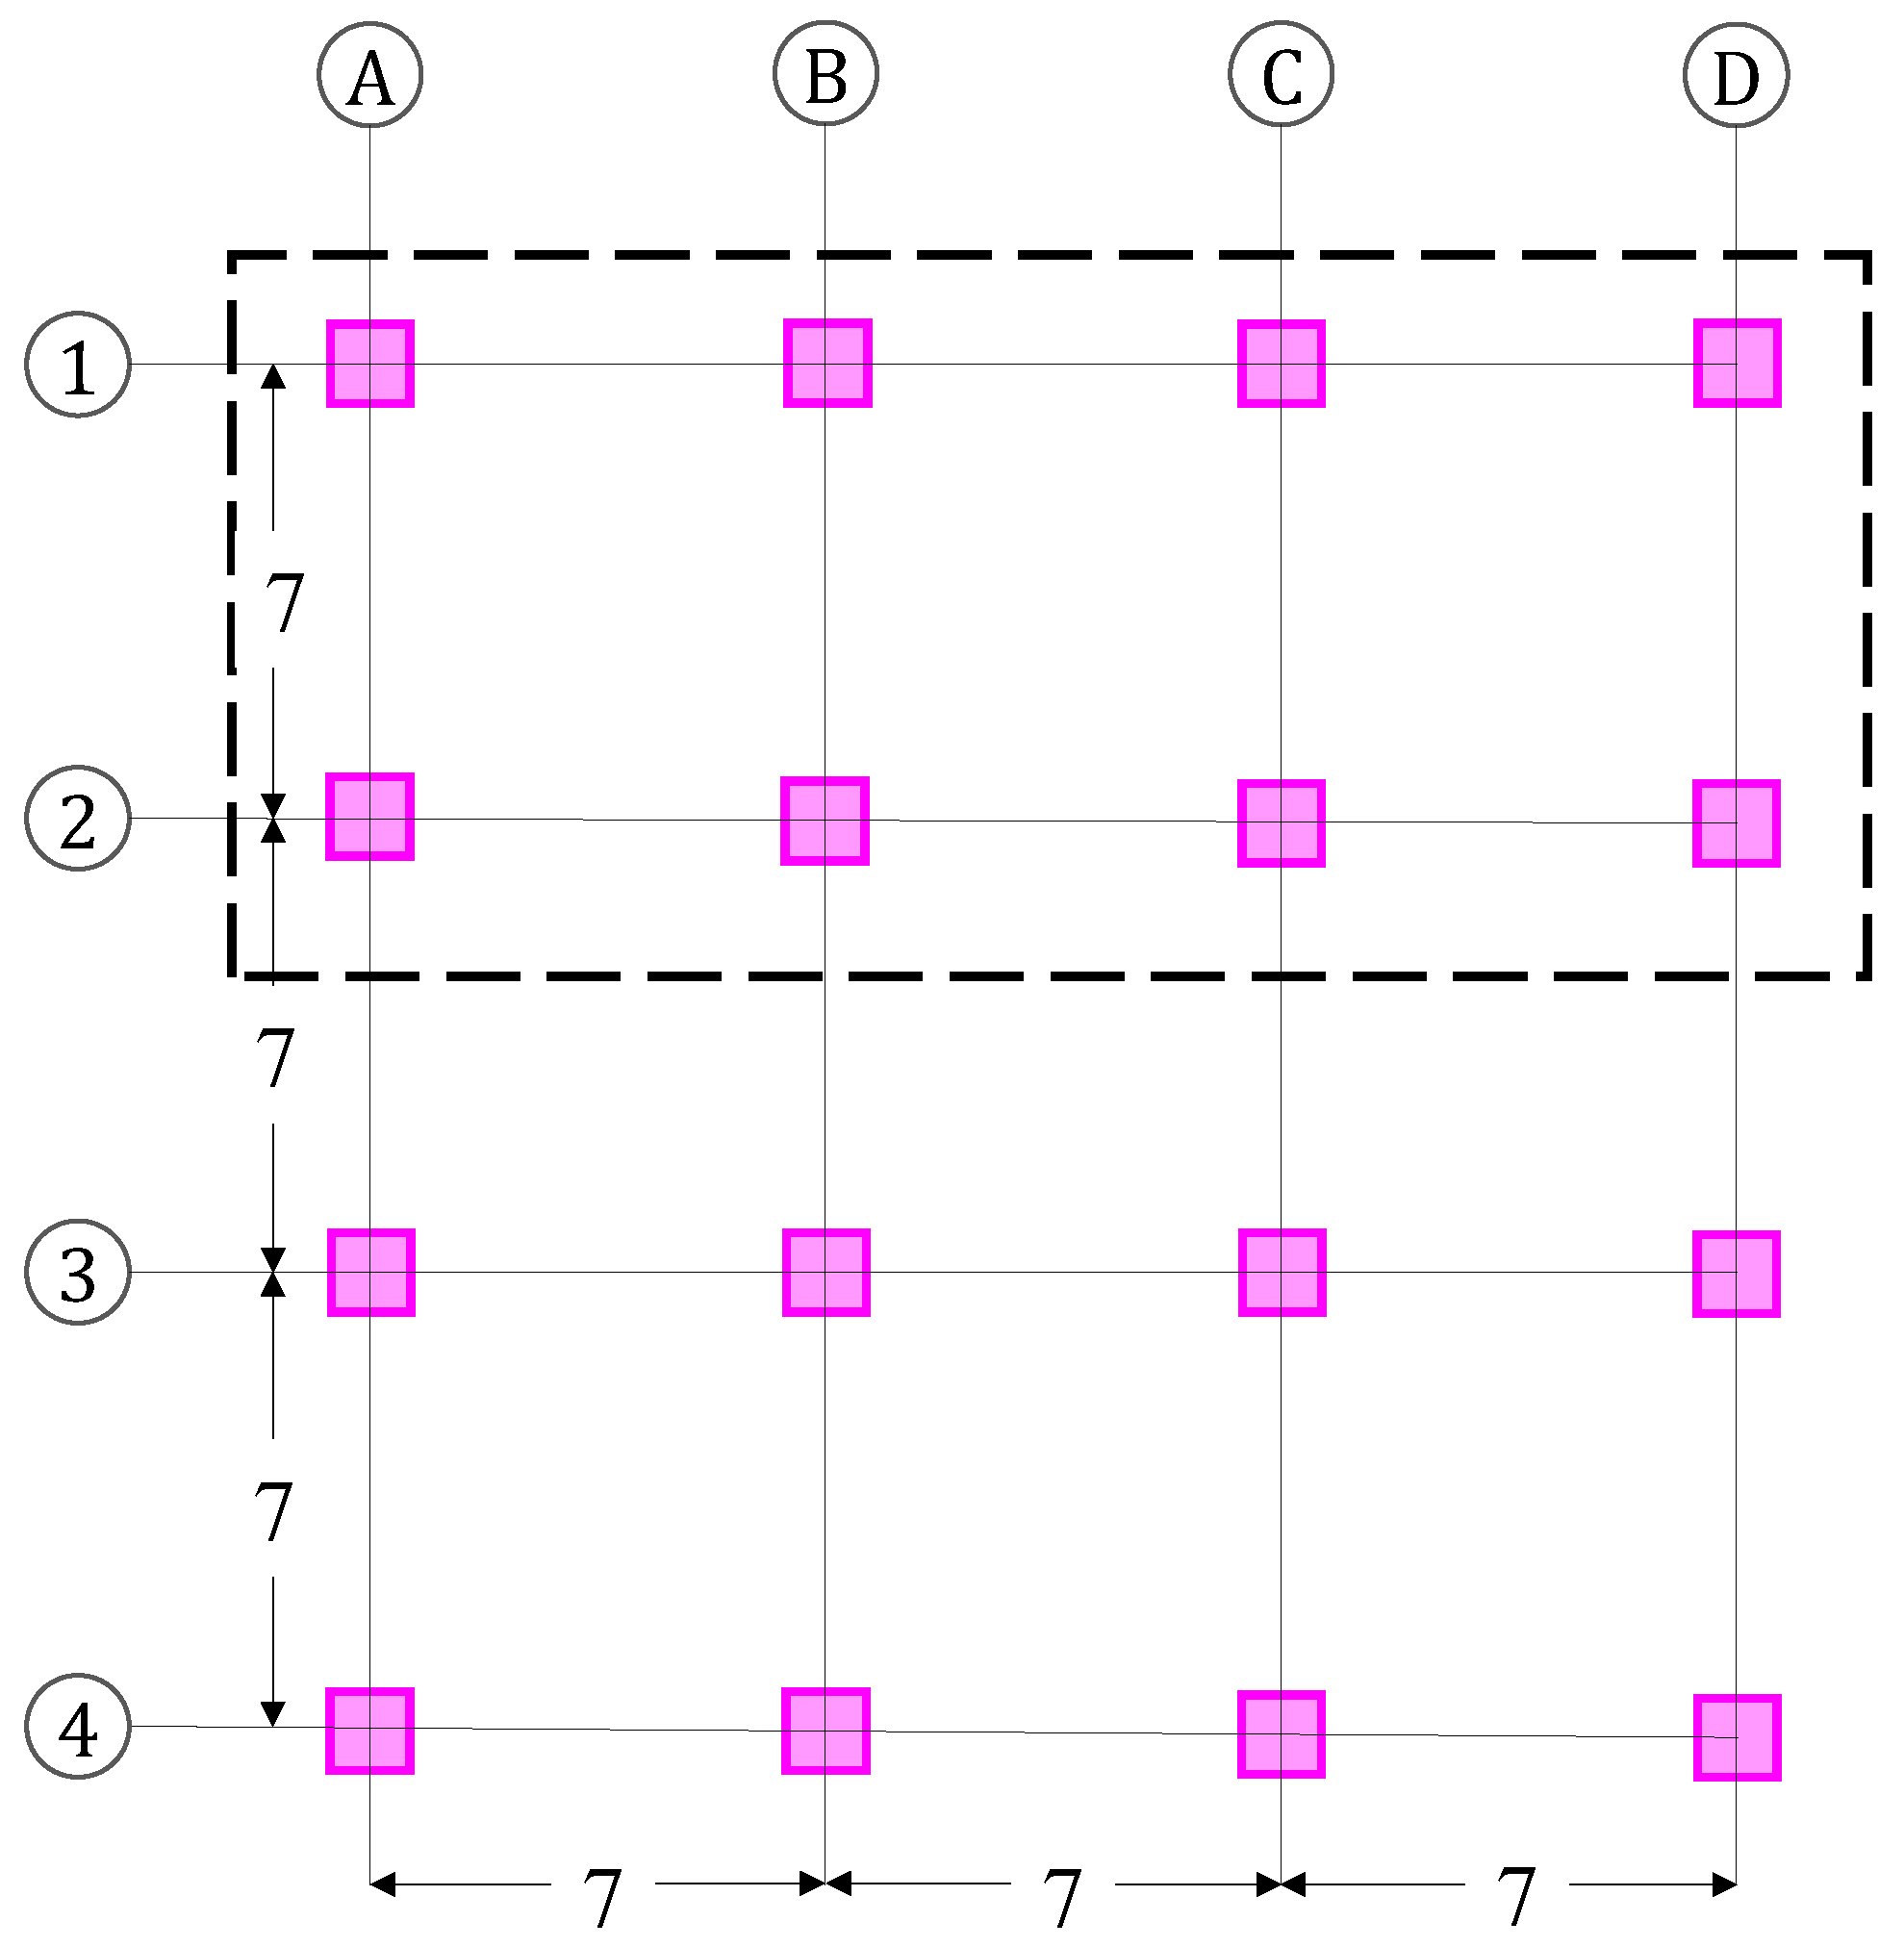
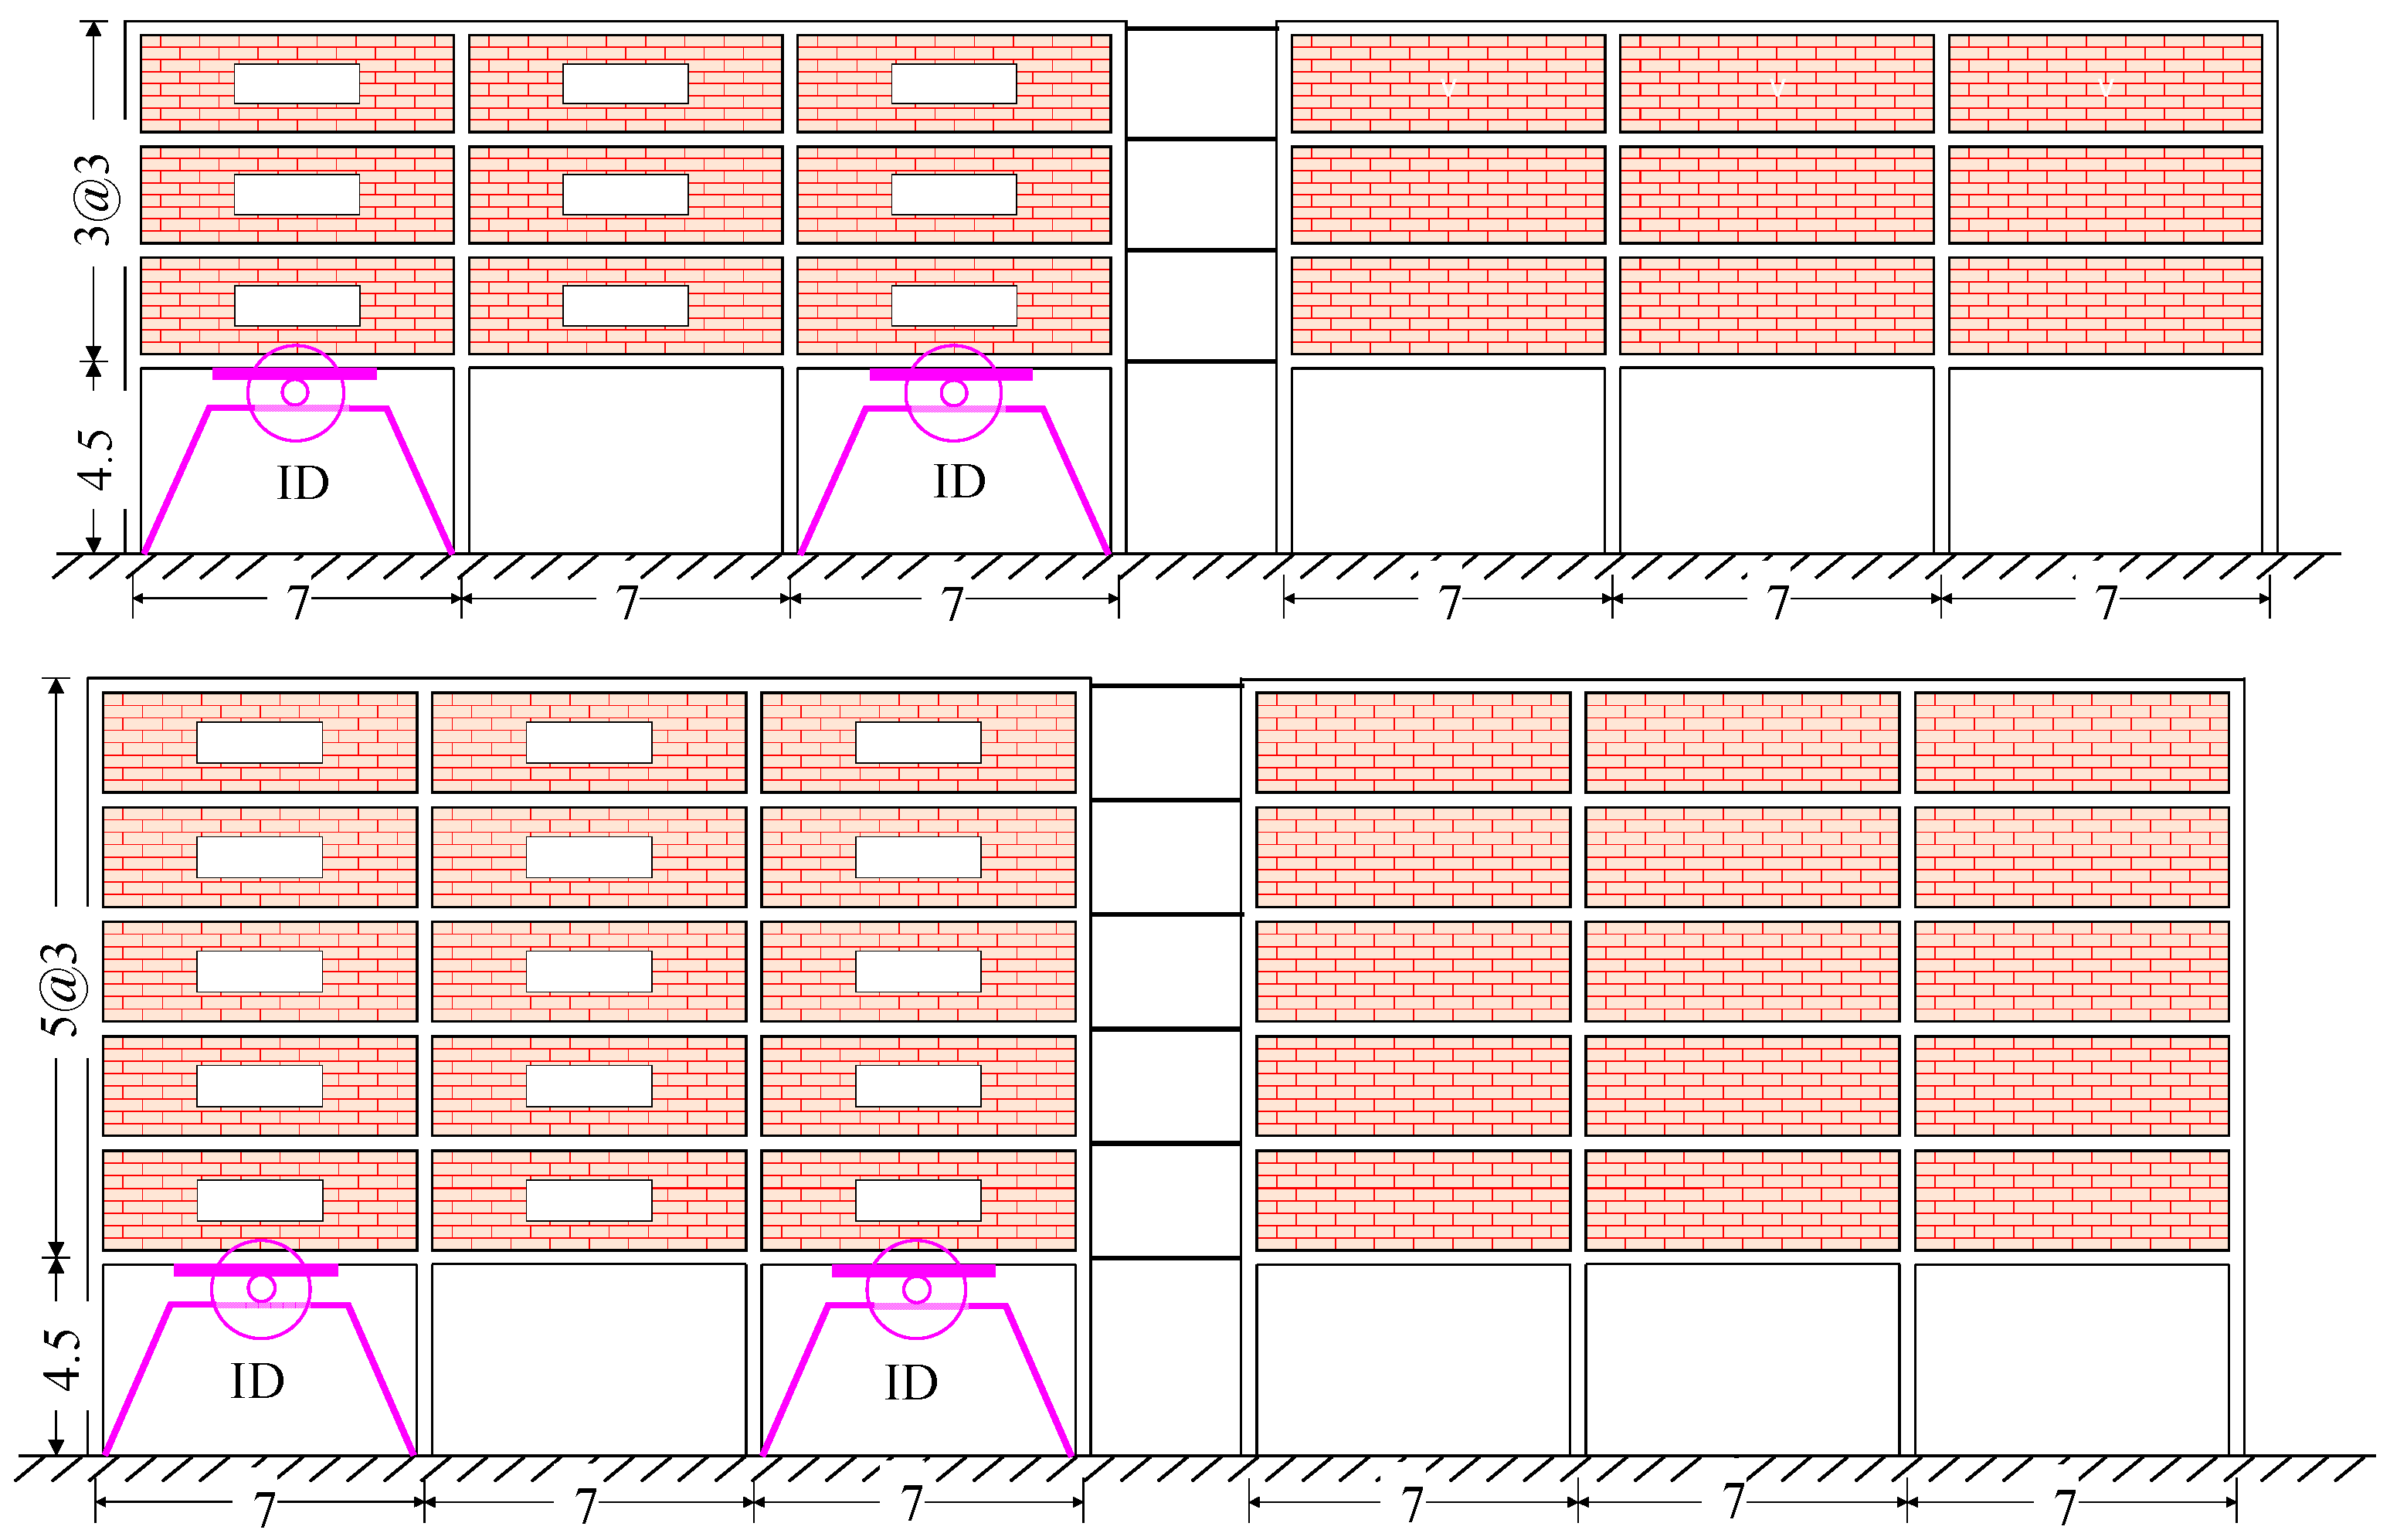
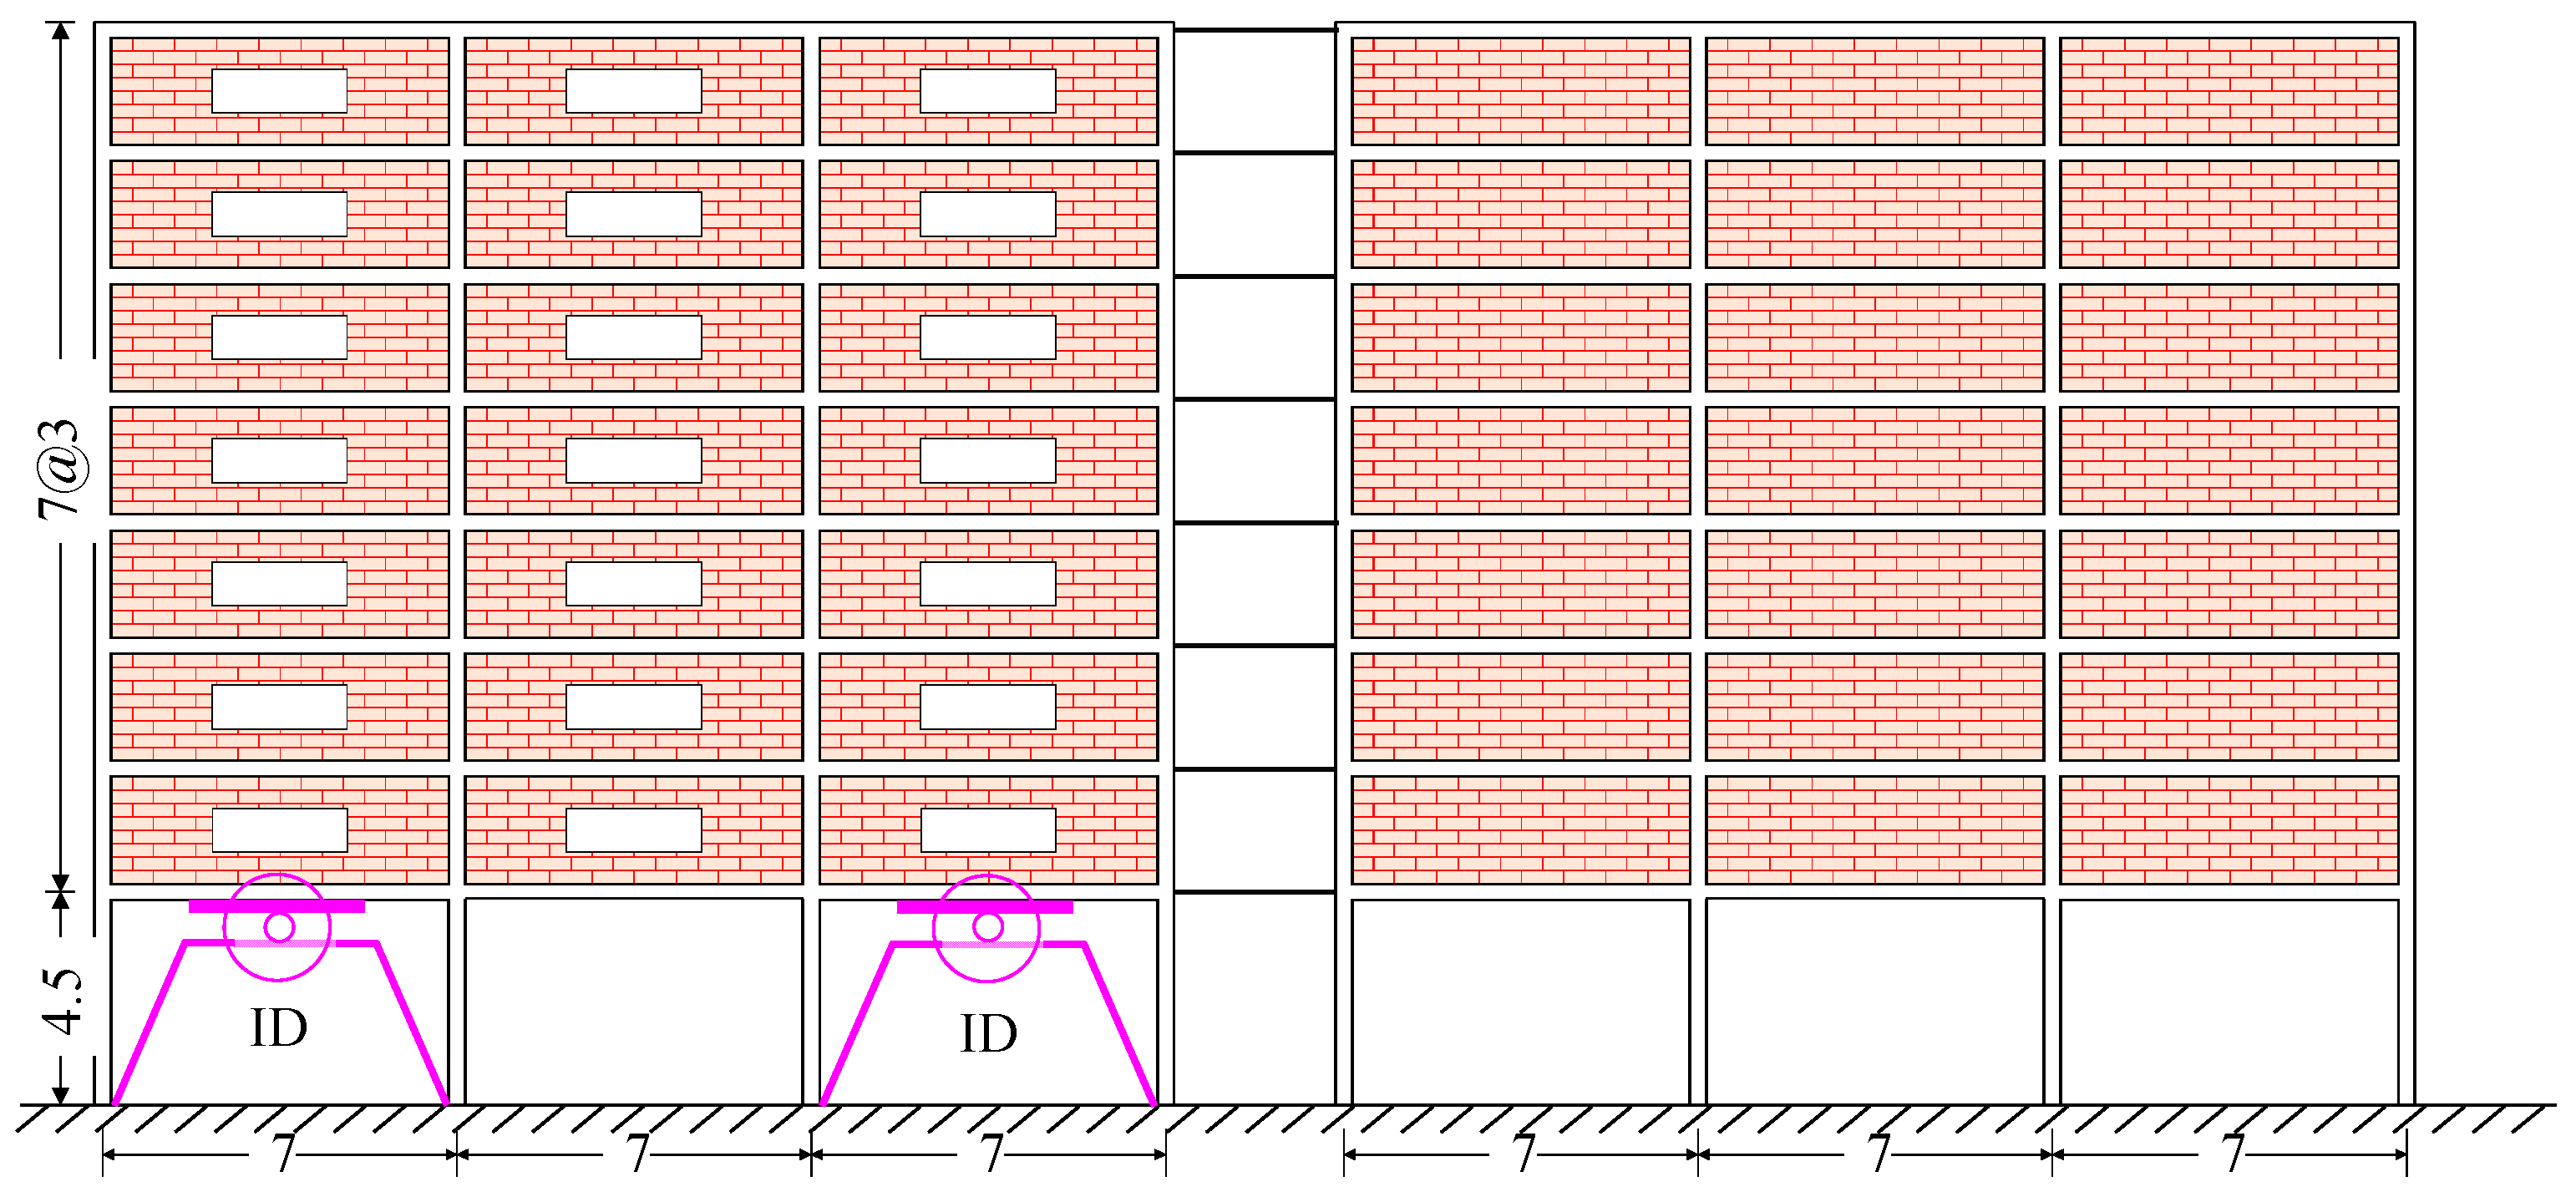
2. Designed Buildings Considered
2.1. Dynamic Analysis of the Buildings
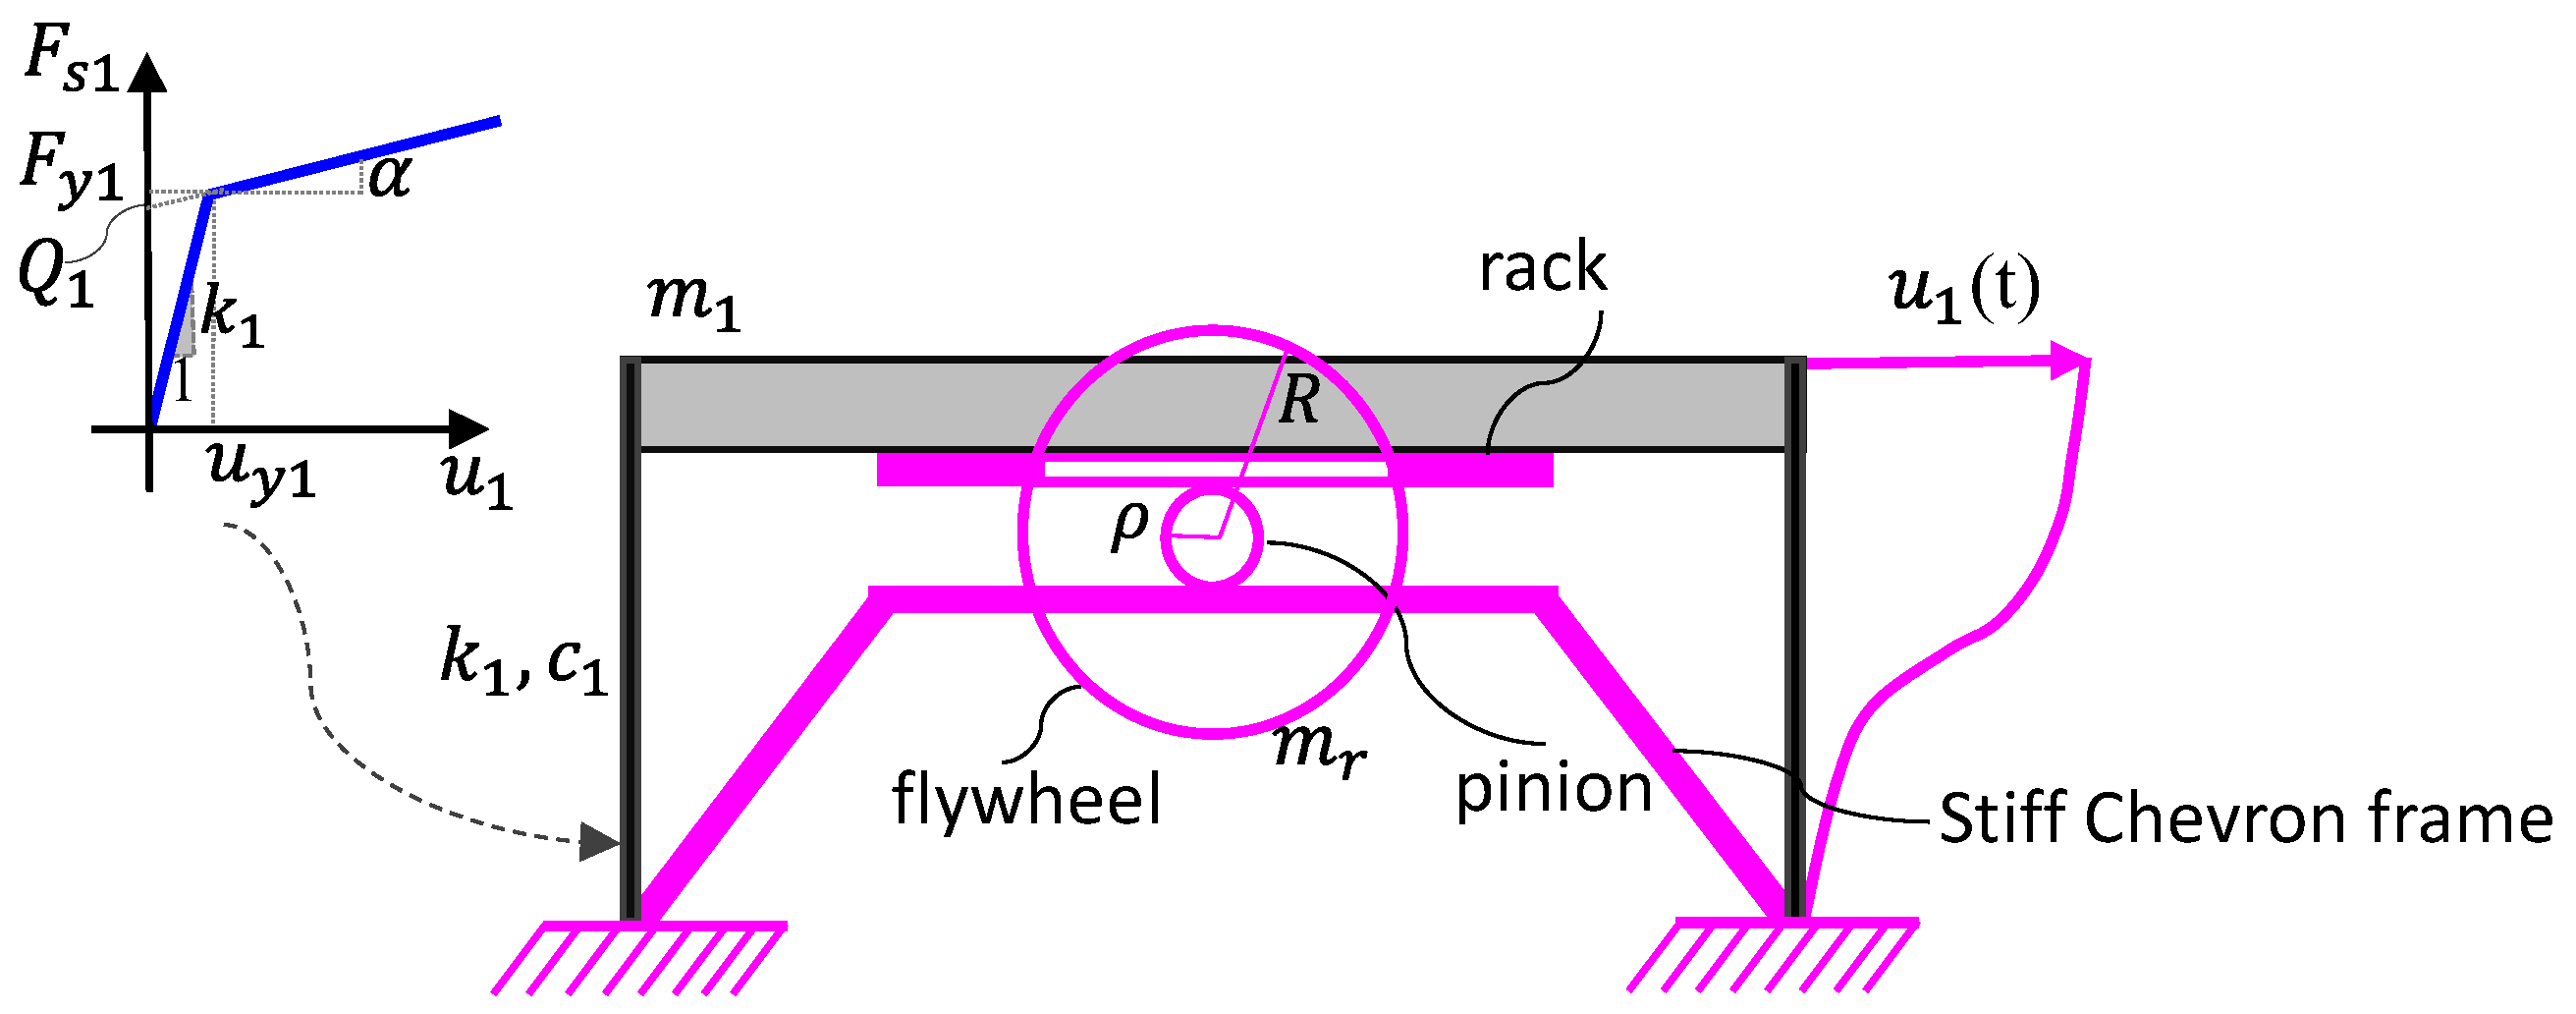
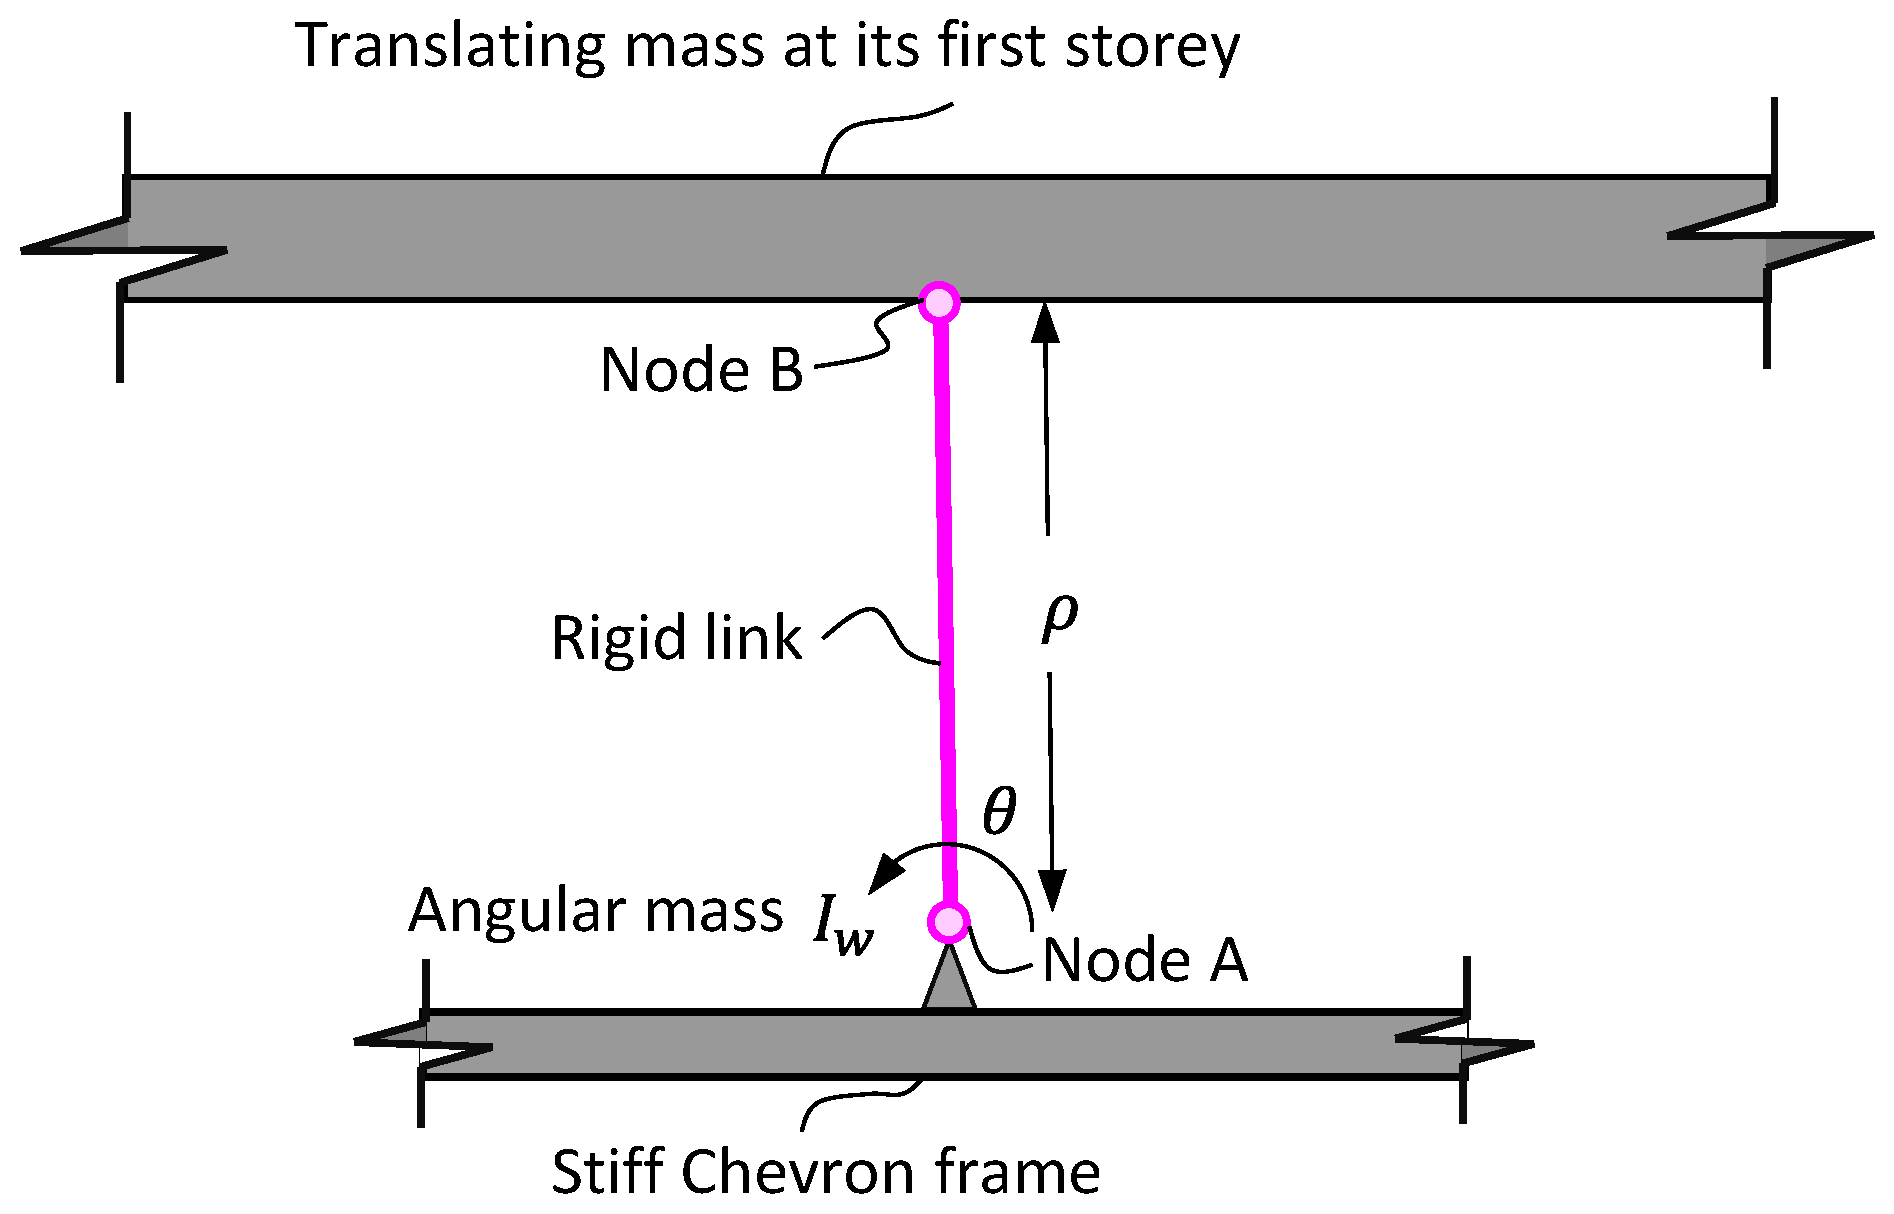
2.2. Modeling of the Inerter Damper
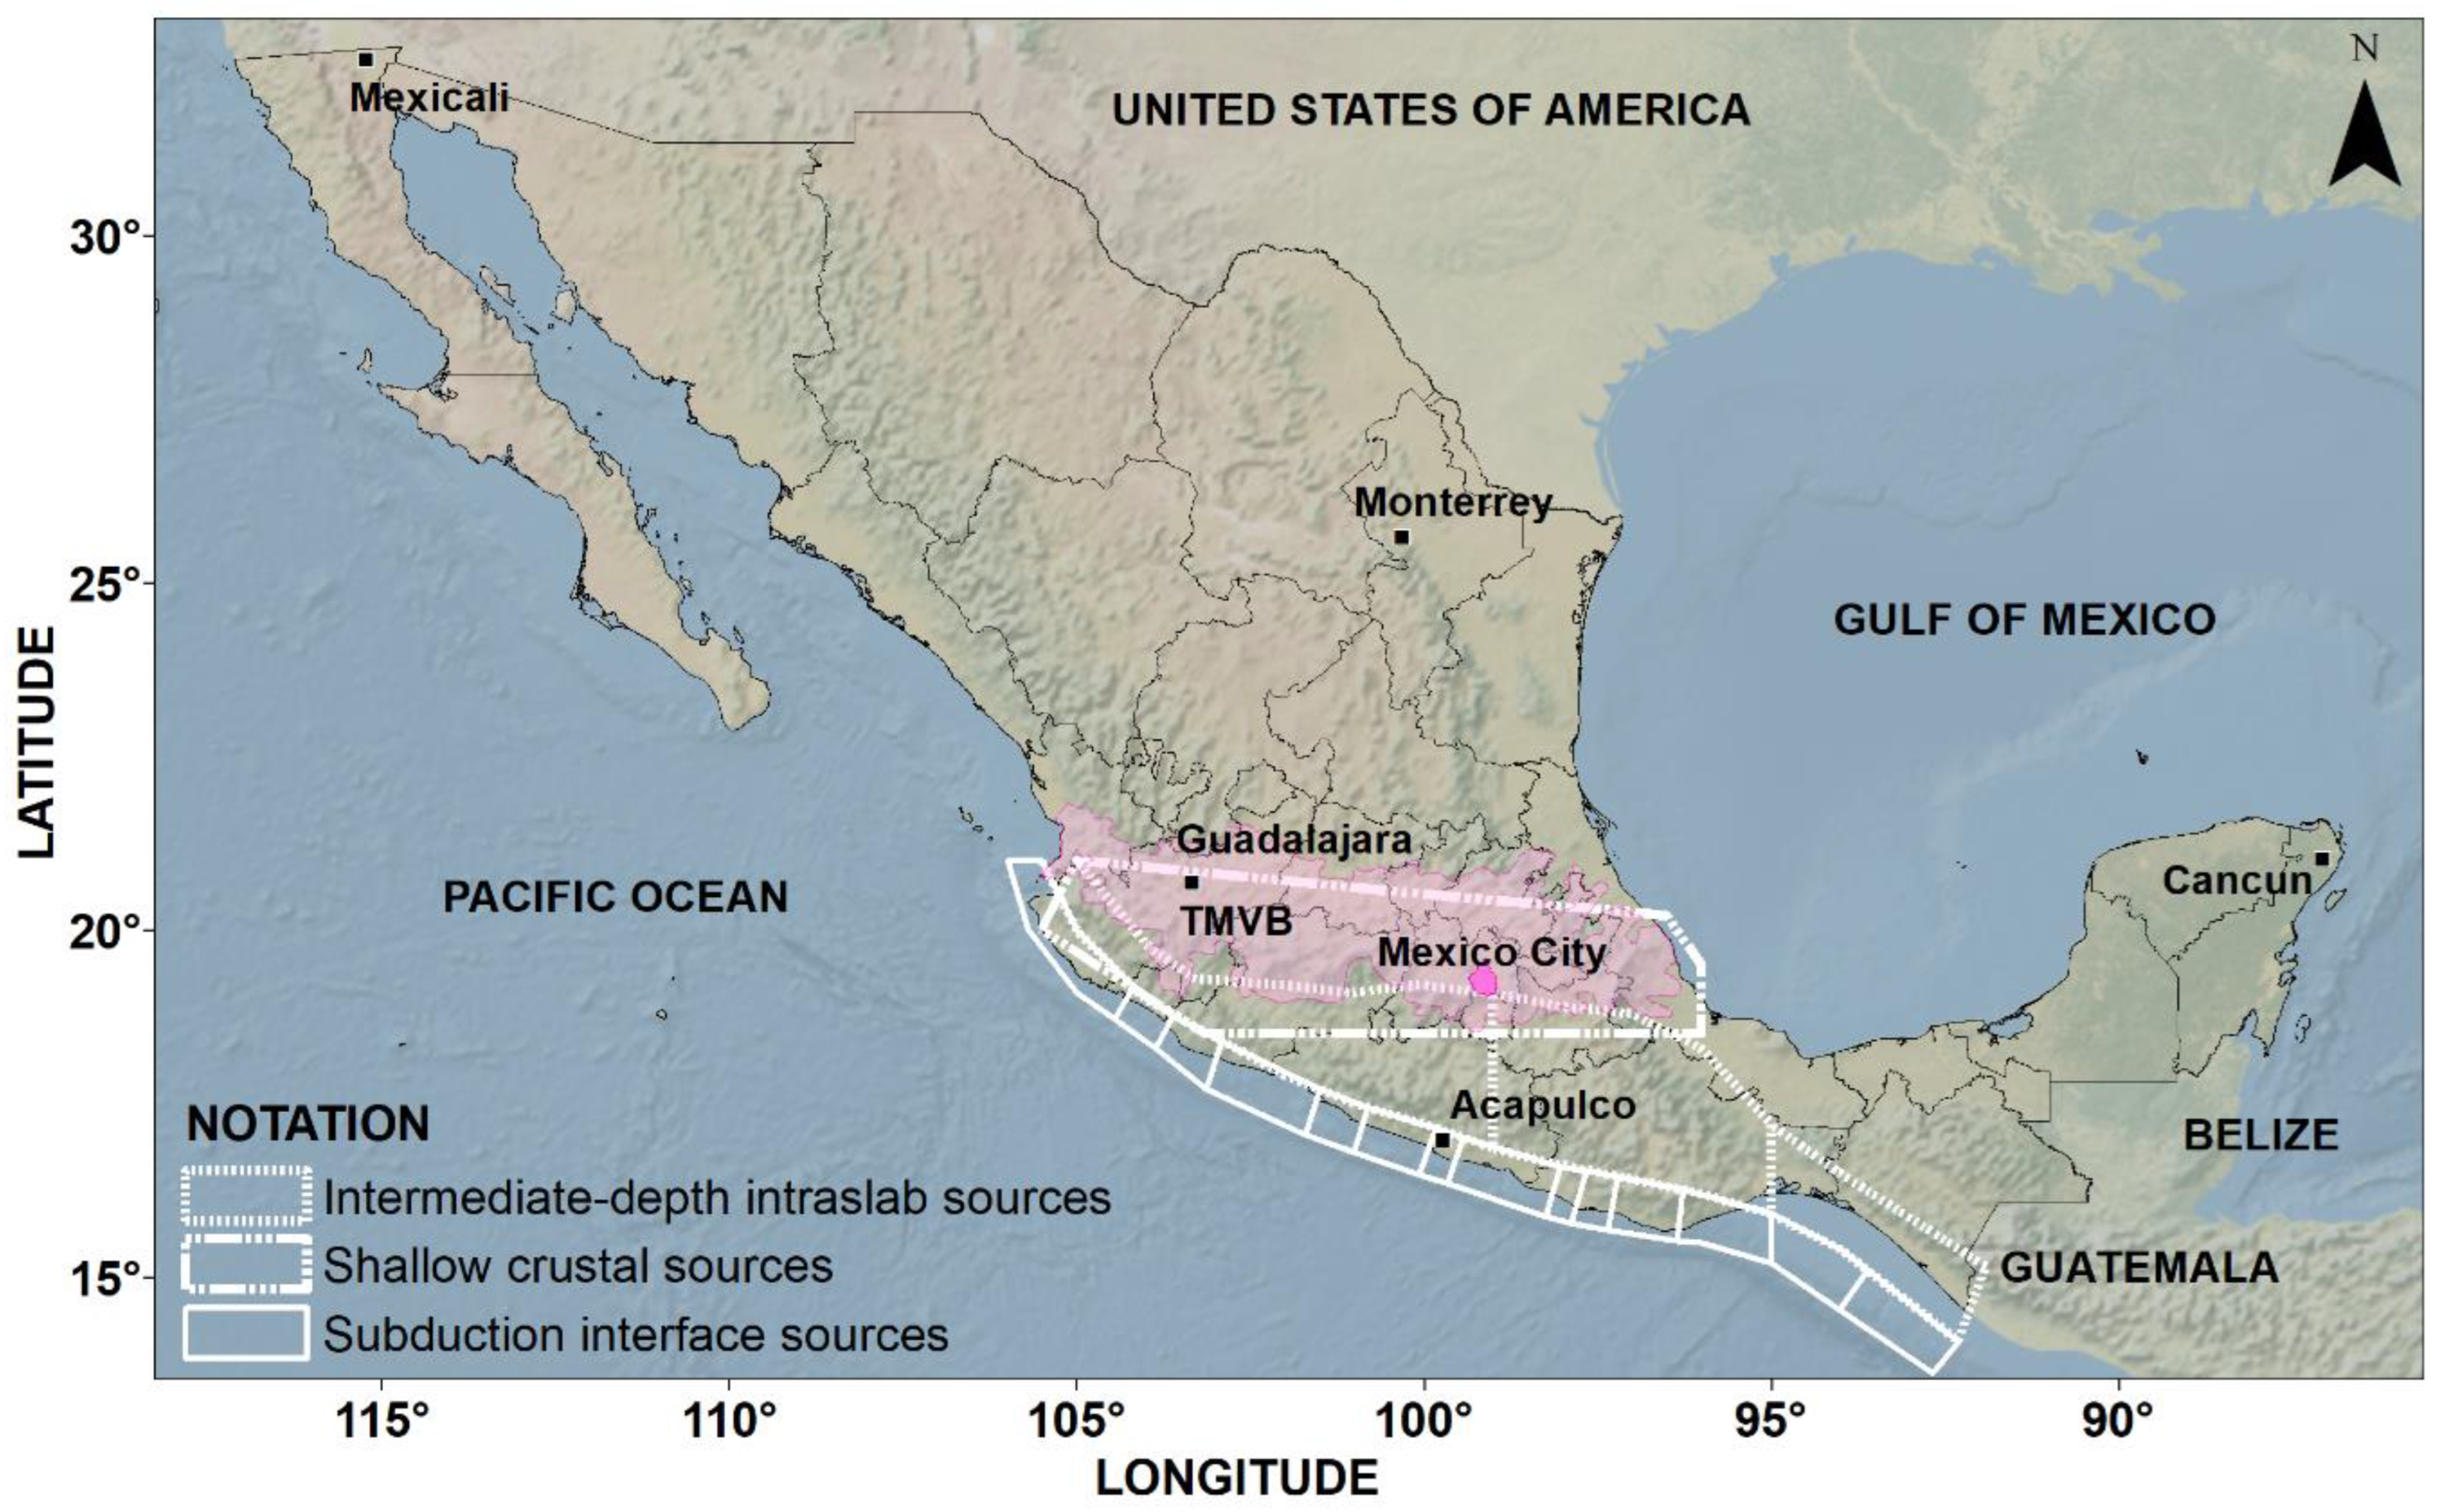
3. Seismic Hazard and Ground Motion Selection
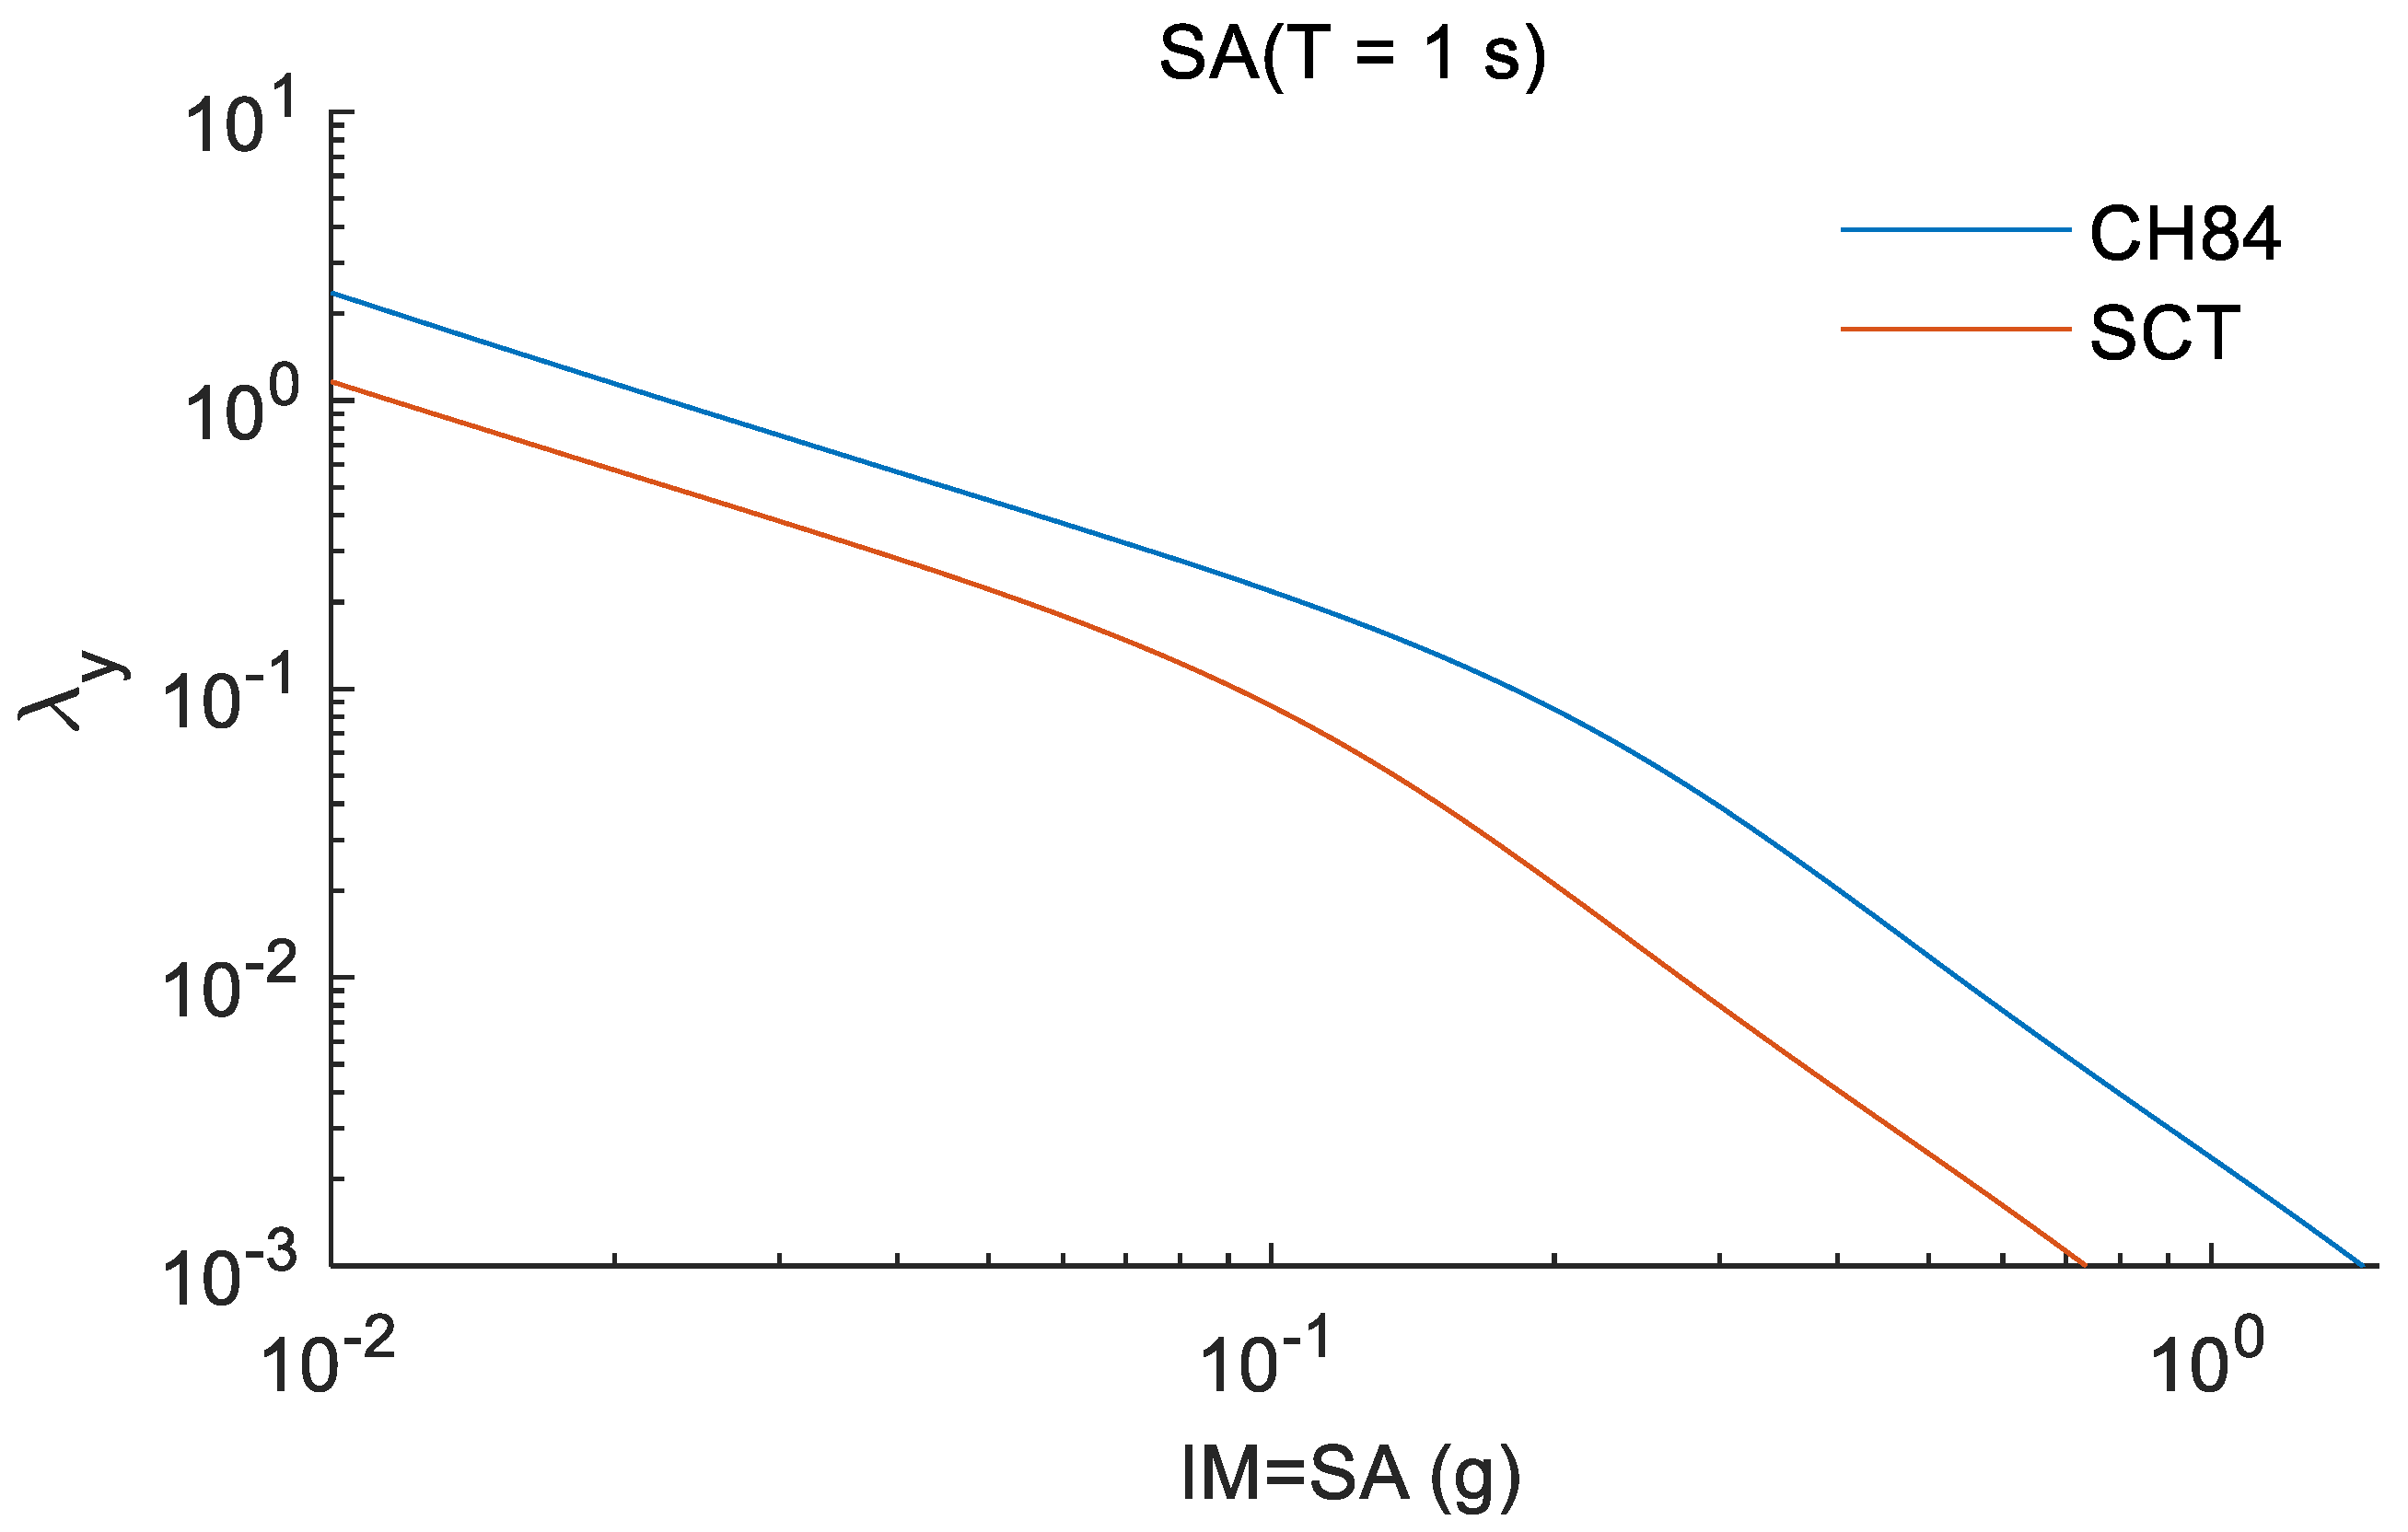
3.1. Seismic Hazard at Soft Sites
3.2. Set of Earthquake Ground Motions Considered
3.3. Criteria for Scaling Ground Motion
4. Earthquake-Induced Response of Buildings with Inerter Dampers
4.1. Seismic Response of Sdof Systems for Synthetic Ground Motion
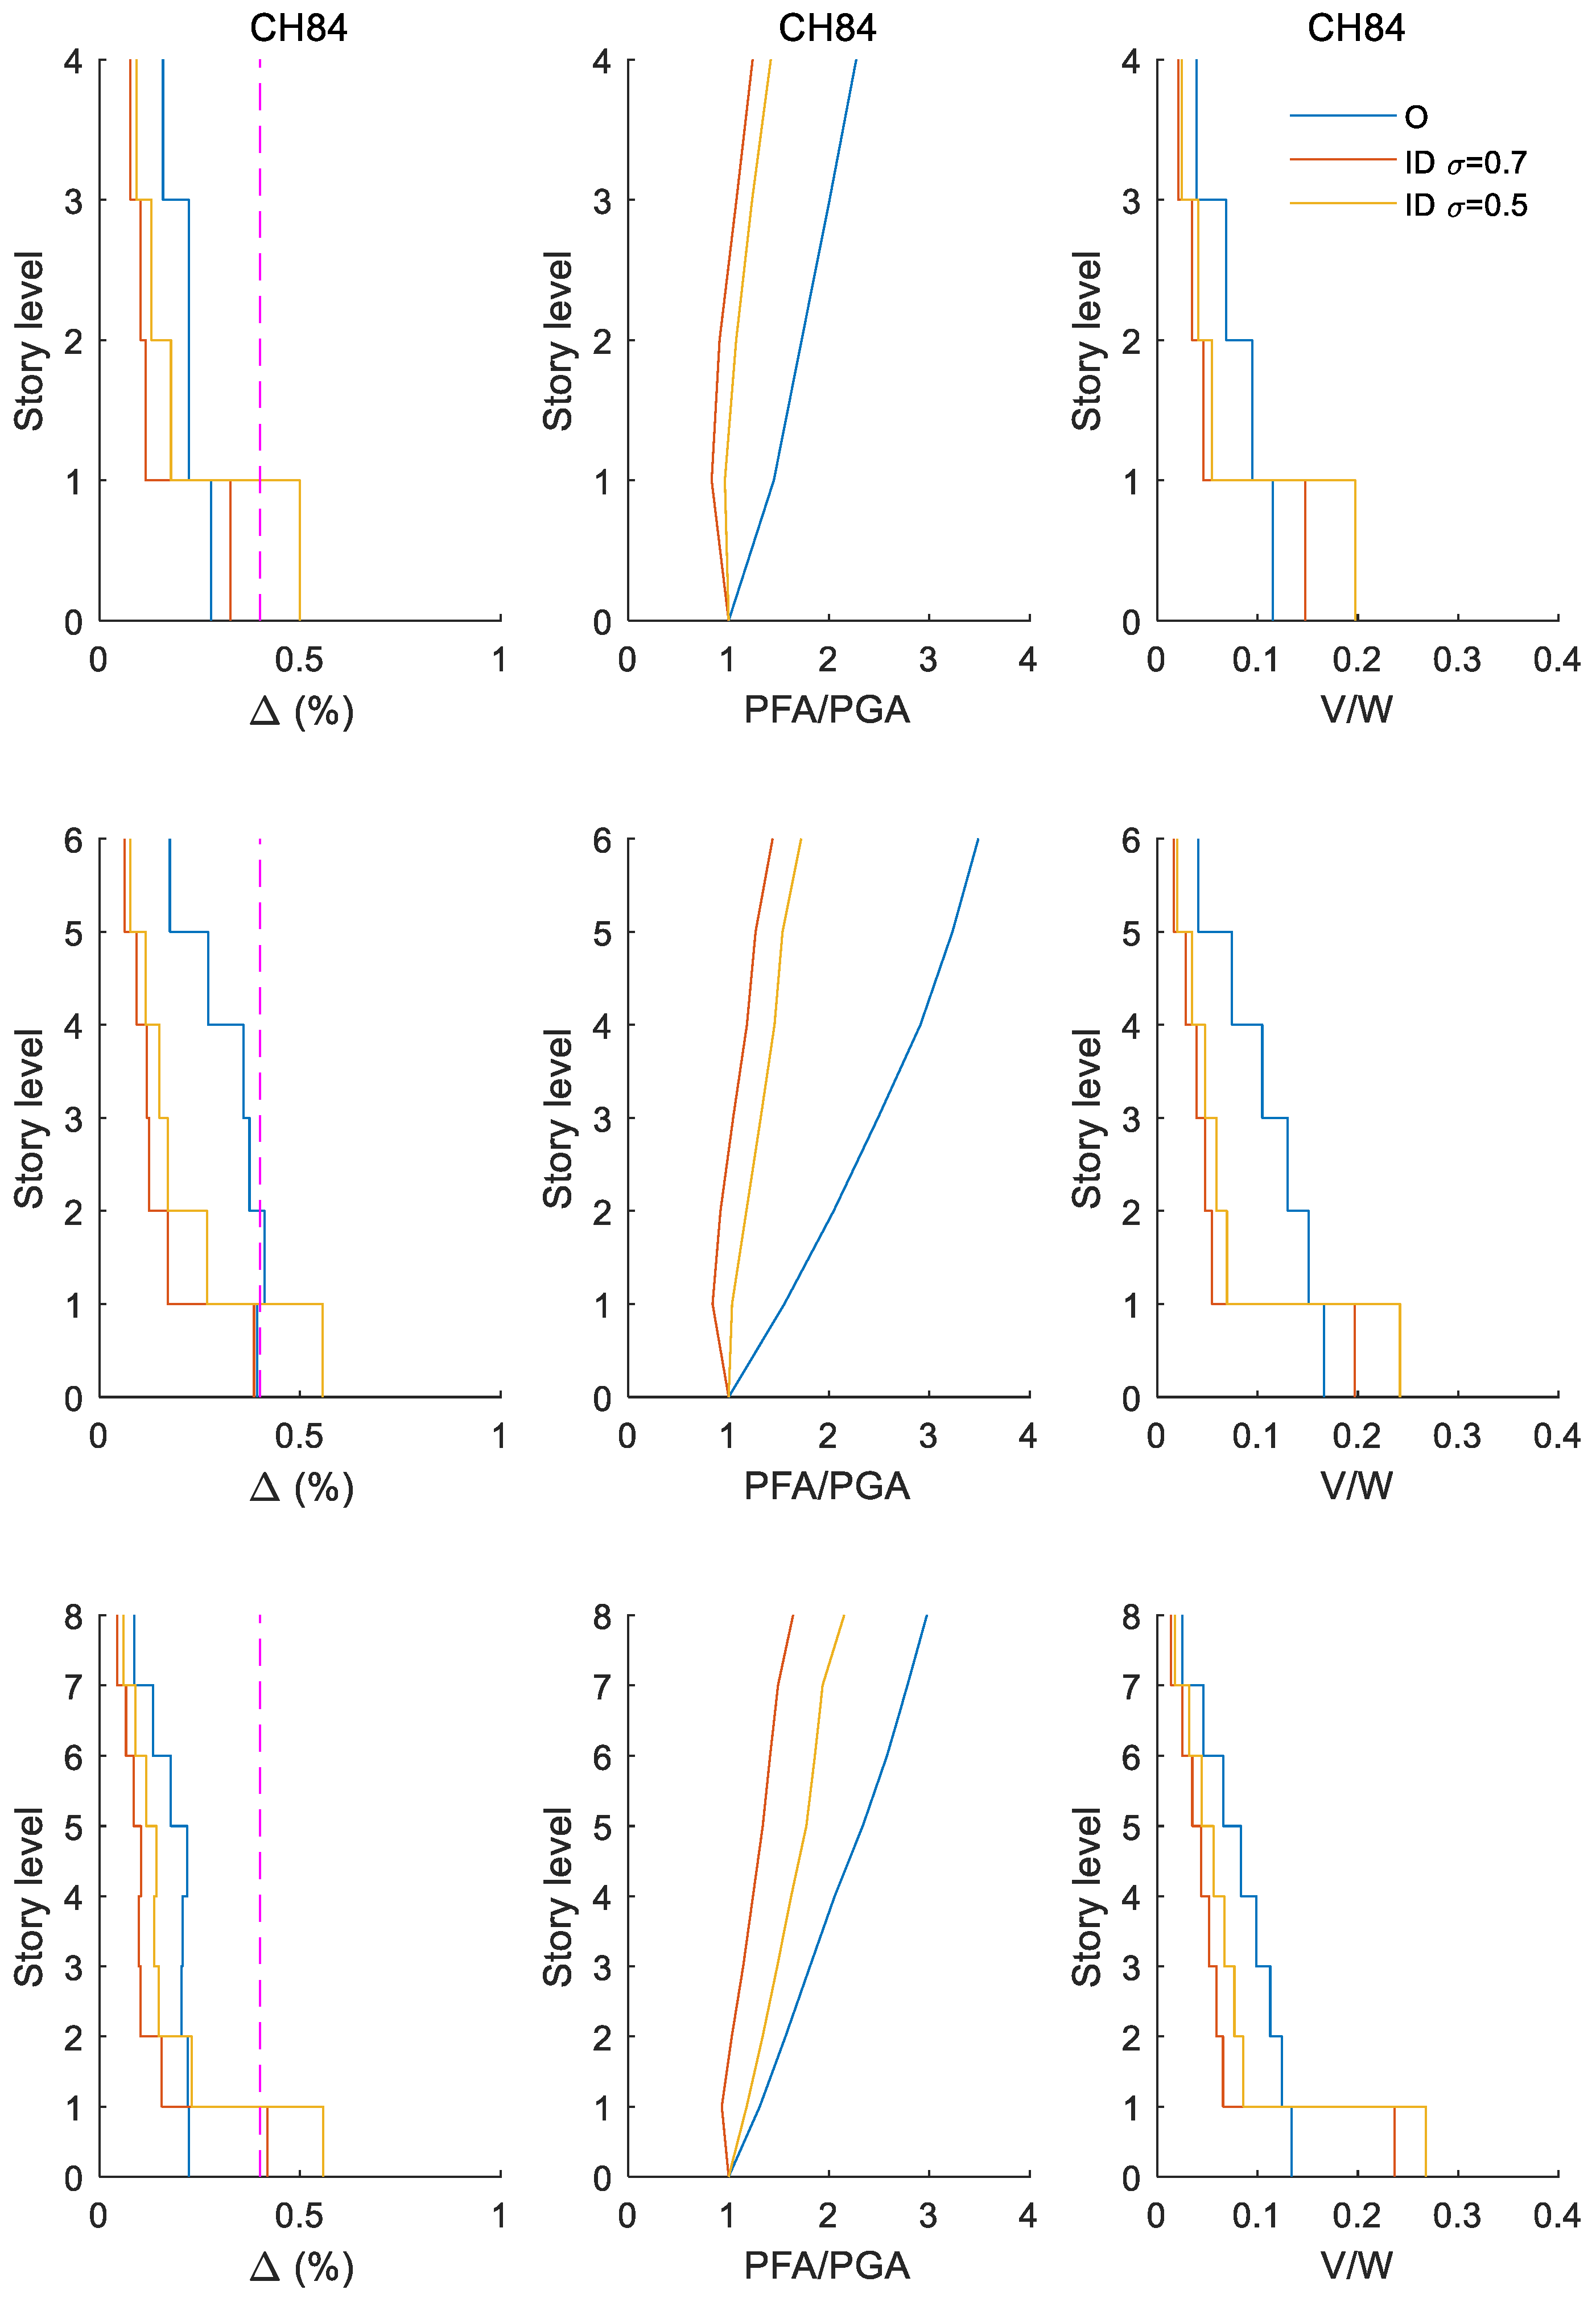
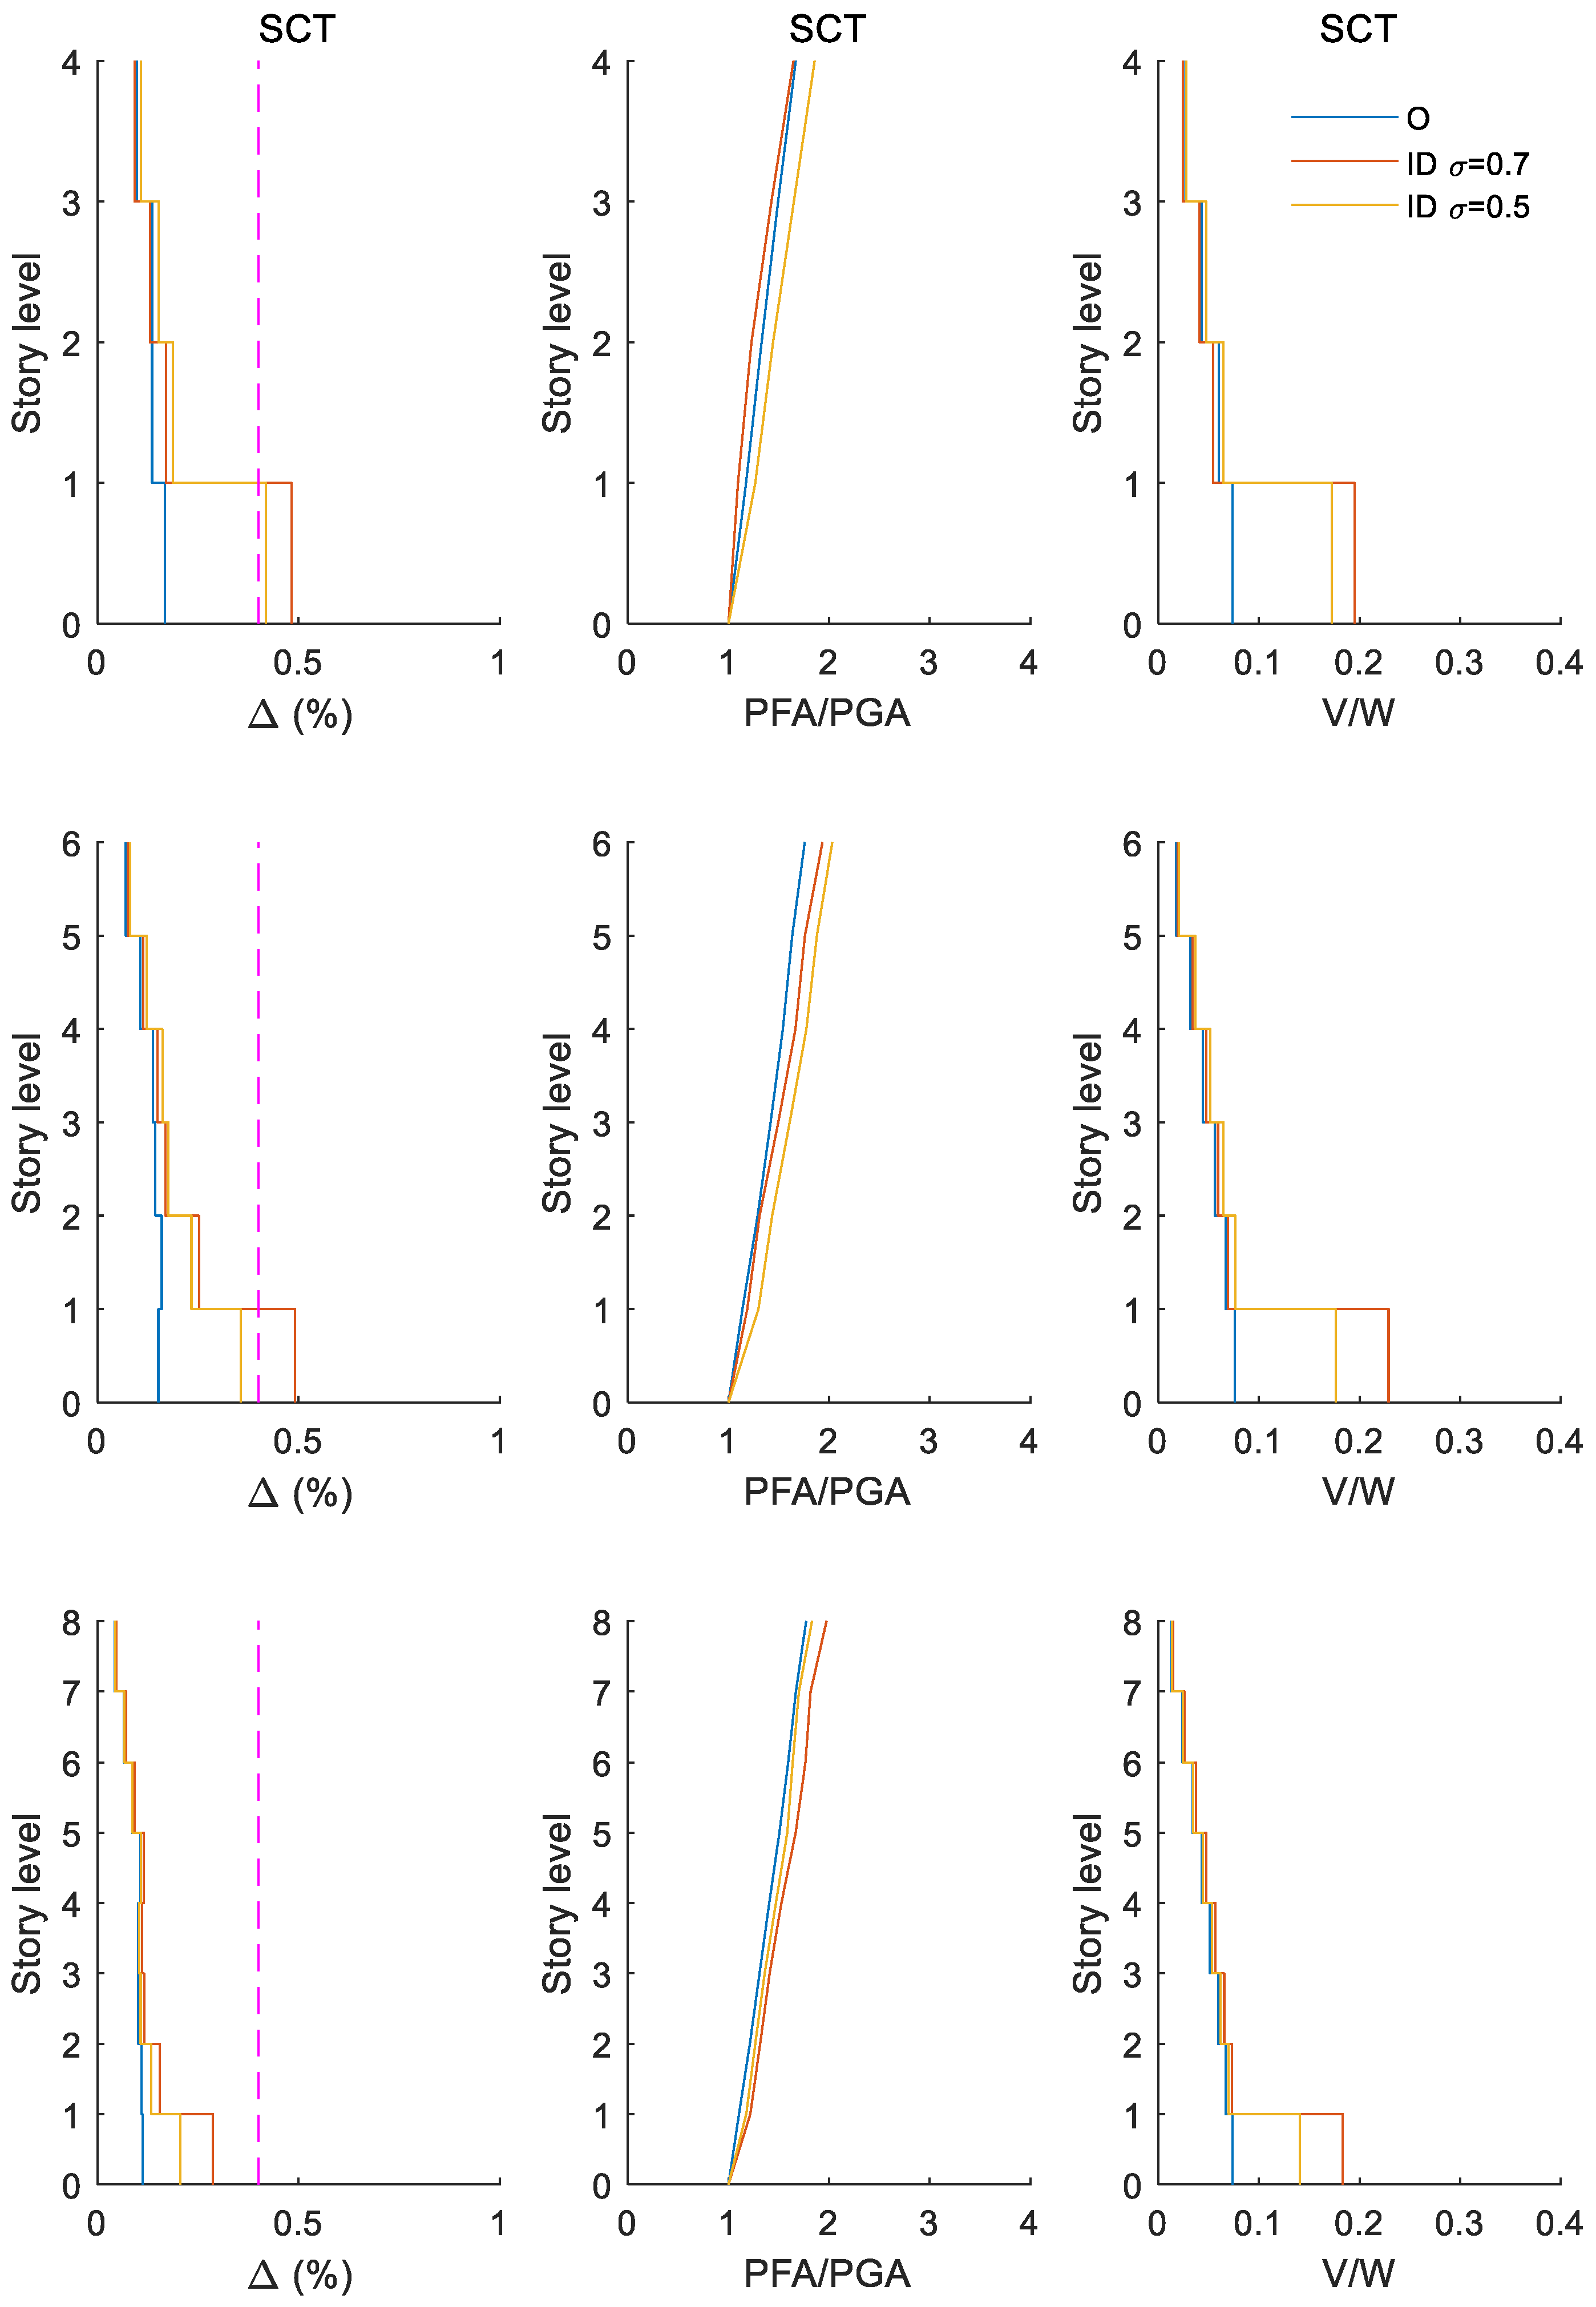
4.2. Influence of Seismic Intensities Associated to Limit State of Collapse
4.3. Influence of Seismic Intensities Associated to Limit State of Damage Limitation
5. Fragility Functions
5.1. Probability of Failure for Maximum Peak Story Drifts
5.2. Results of Probability of Failure for Maximum and Residual Displacements
6. Earthquake-Induced Risk Assessment
6.1. Maximum Peak Story Drift
6.2. Maximum Peak Story Drift for Buildings Q = 6 Versus Q = 4
7. Conclusions
- 1.
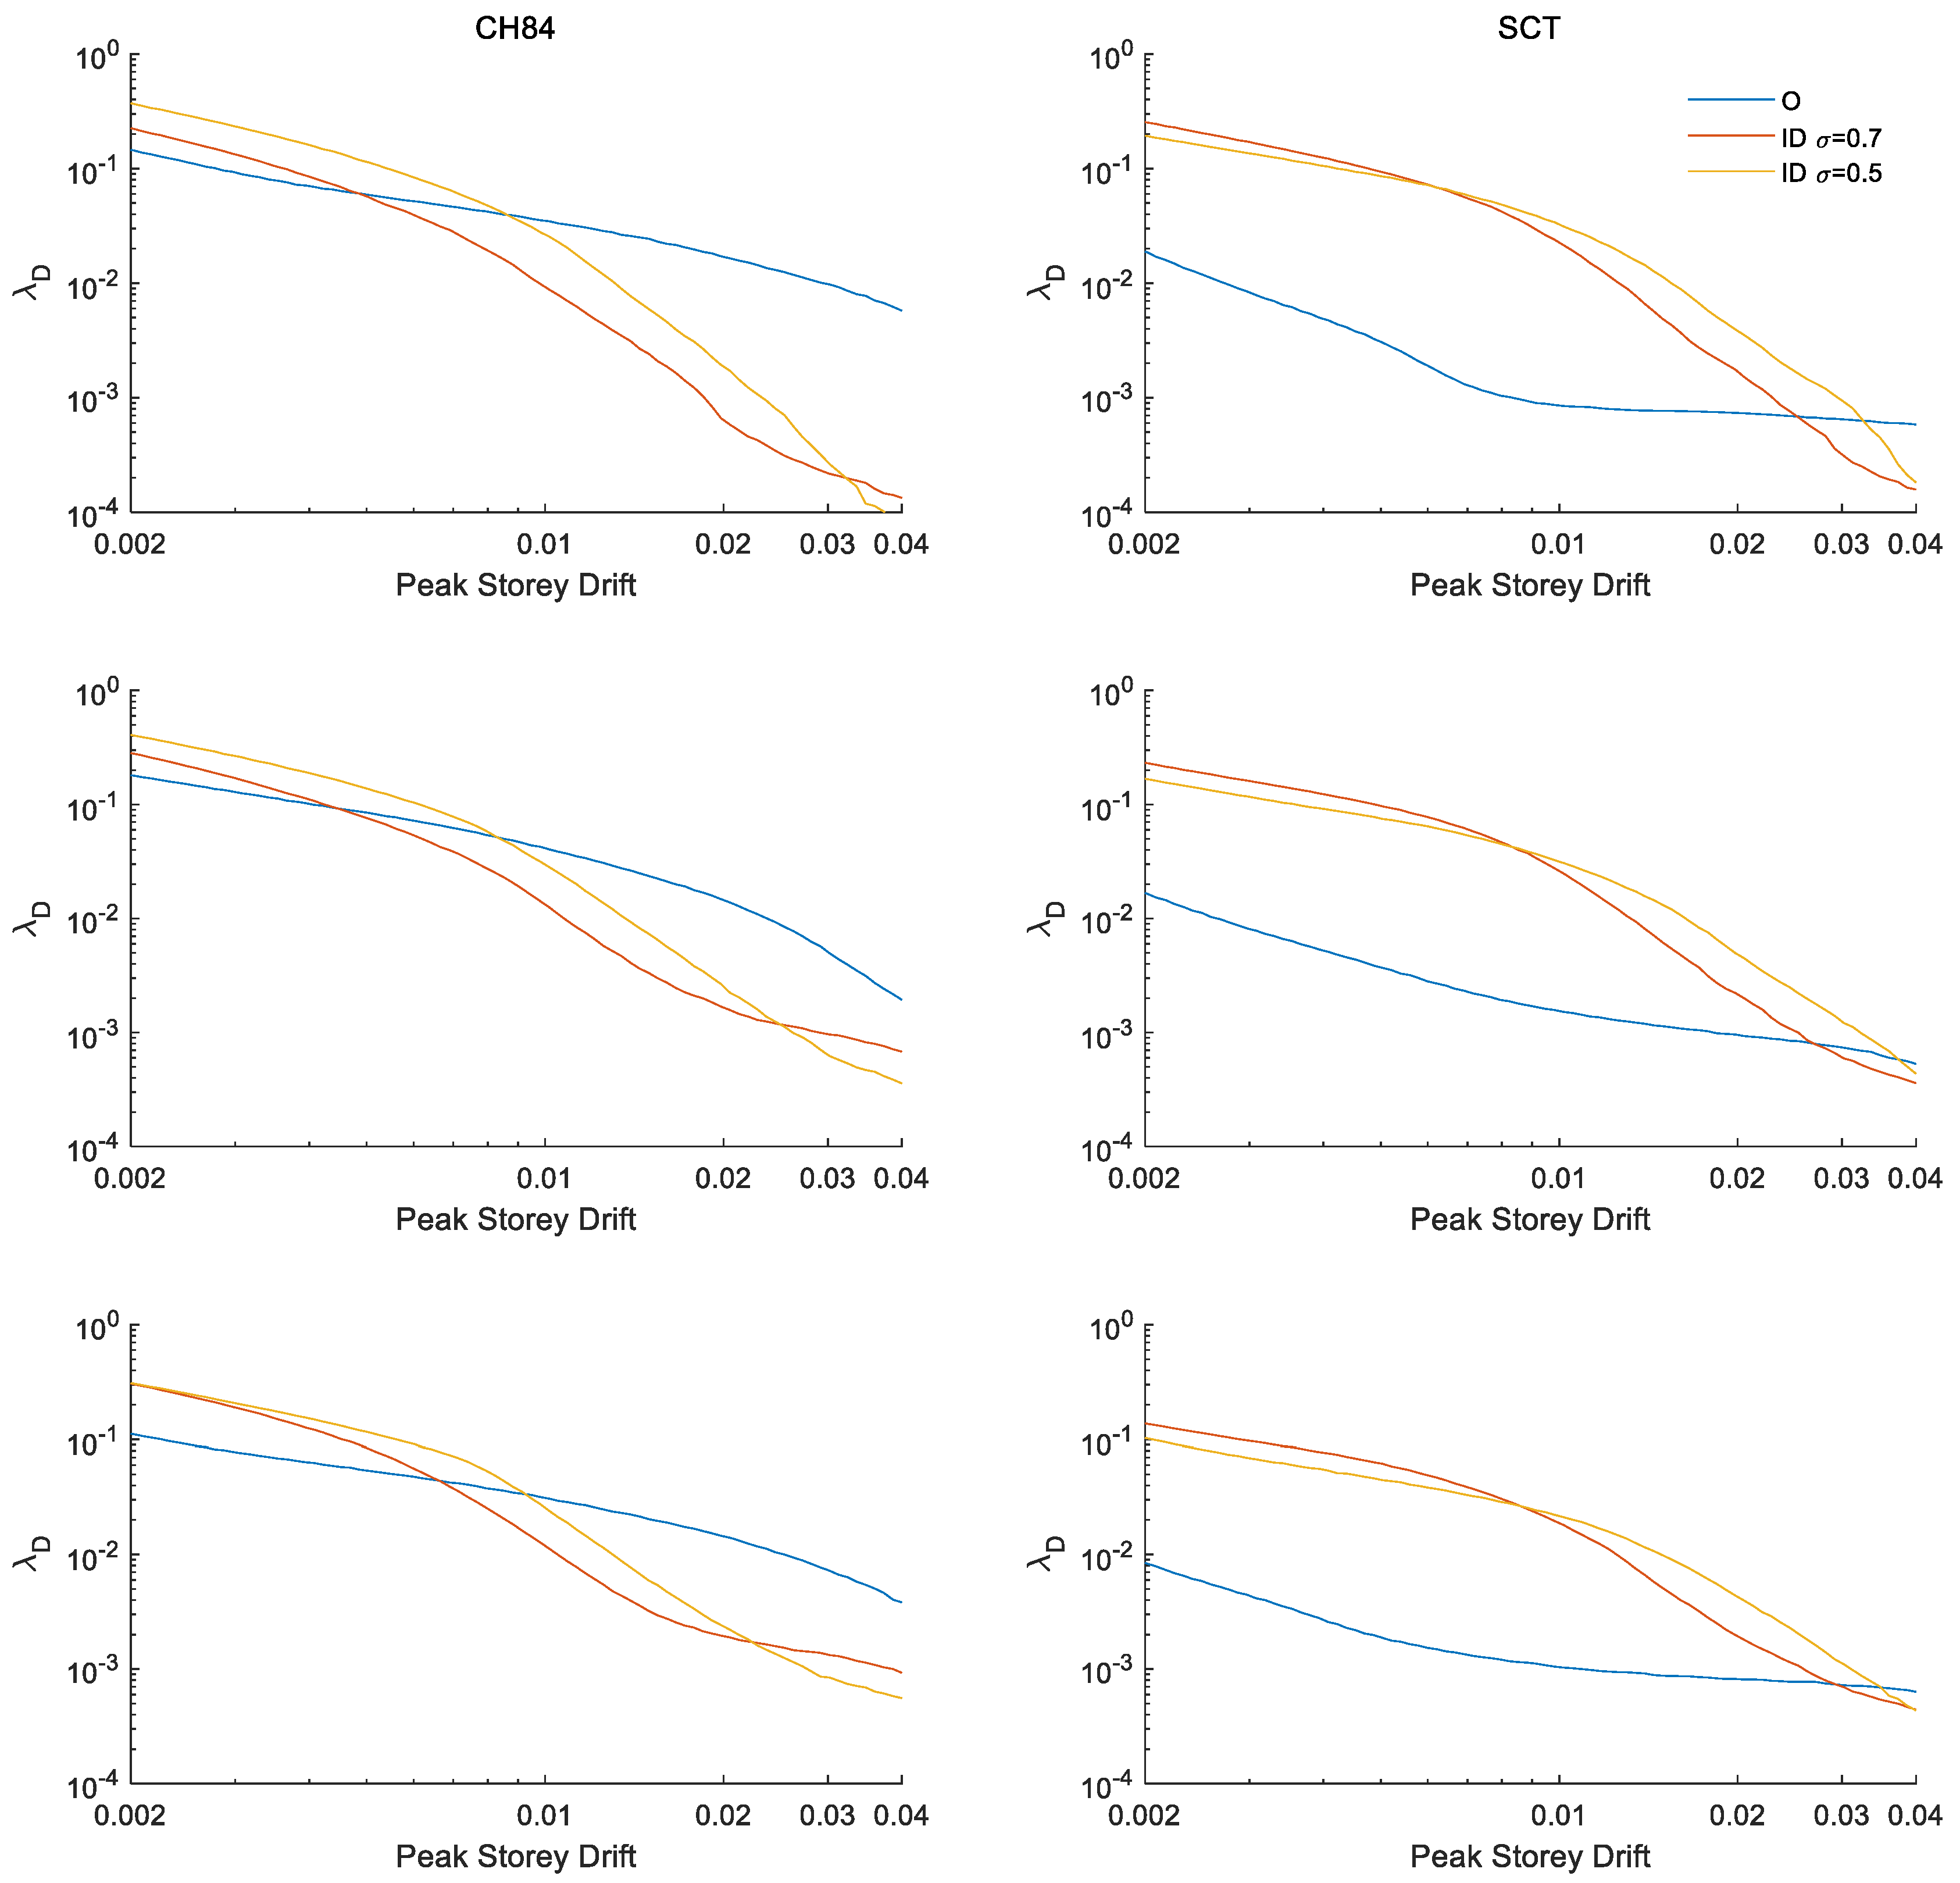
- The results of fragility functions indicate that the ground motions with high frequency (e.g., site CH84, ) yield larger peak drifts for structures with inerter dampers compared to the ground motions with low frequency (e.g., site SCT, ). Likewise, it is observed that, when structures include inerter dampers at their ground level, the probabilities of exceeding certain peak story drift are less than those in structures without inerter dampers for large ground-motion intensities at both sites. On the contrary, for moderate ground-motion intensities, this trend can be reversed, which is particularly evident for site SCT where the inerter dampers do not offer benefits compared to the original case.
- 2.
- The results show that, for the maximum peak story drift, the reliabilities of structures with inerter dampers at their ground level are in general higher or the risks are lower for buildings under seismic intensities associated with limit state of collapse (i.e., very high seismic demands), especially for low-height buildings. Improvements in order of half of the original response were observed. However, for buildings under intensities associated with the limit state of damage limitation (i.e., relatively common seismic demands during the service life of the building), the reliability of structures with inerter dampers could be less than those of structures without IDs.
- 3.
- Therefore, it is concluded that inerter dampers are an effective retrofitting alternative for improving the seismic behavior of weak first-story buildings that undergo inelastic behavior (very large seismic intensities associated with the incipient collapse limit state); however, this is not the case (and it actually could be self-defeating) for controlling lateral demands for buildings that behave linearly (under moderate seismic intensities associated with the limit state of damage limitation). This applies to the cases studied in the present research. Further investigation is recommended for other structures and ground motions.
- 4.
- It is noteworthy that providing inerter dampers to the building does not eliminate the weak first story, but it controls the problem induced by the weak first-story mechanism from a dynamic point of view provided that adequate parameters of the inerter dampers are selected. If an ID device with larger apparent mass ratio is selected (e.g., >1 for the studied cases), damage in the upper stories could be expected. Therefore, care should be taken to adequately select IDs to control lateral displacements.
Author Contributions
Funding
Acknowledgments
Conflicts of Interest
Appendix A. Seismic Response for Buildings of Q = 4 Subjected to a Set Earthquakes Whose Seismic Intensities Are Associated to Limit State of Collapse


Appendix B. Seismic Response for Buildings of Q = 4 Subjected to a Set Earthquakes Whose Seismic Intensities Are Associated to Limit State of Damage Limitation


Appendix C. Fragility Function for Maximum Peak Story Drift for Buildings of Q = 4

Appendix D. Risk Curves for Maximum Peak Story Drift for Buildings of Q = 4

References
- Villaverde, R.V. Explanation for the numerous upper floor collapses during the 1985 Mexico City earthquake. Earthq. Eng. Struct. Dyn. 1991, 20, 223–2410. [Google Scholar]
- Hall, J.F.; Heaton, T.H.; Halling, M.W.; Wald, D.J. Near-source ground motion and its effects on flexible buildings. Earthq. Spectra 1995, 11, 569–605. [Google Scholar] [CrossRef]
- Alavi, B.; Krawinkler, H. Behavior of moment-resisting frame structures subjected to near-fault ground motions. Earthq. Eng. Struct. Dyn. 2004, 33, 687–706. [Google Scholar] [CrossRef]
- Alavi, B.; Krawinkler, H. Strengthening of moment-resisting frame structures against near-fault ground motion effects. Earthq. Eng. Struct. Dyn. 2004, 33, 707–722. [Google Scholar] [CrossRef]
- Rosenblueth, E.; Meli, R. The 1985 Mexico earthquake. Concr. Int. 1986, 8, 23–34. [Google Scholar]
- AIJ. Report on the Hanshin-Awaji Earthquake Disaster-Building Series. In Volume 1: Structural Damage to Reinforced Concrete Building; Architectural Institute of Japan (AIJ): Tokyo, Japan, 1997. (In Japanese) [Google Scholar]
- AIJ. Preliminary Reconnaissance Report of the 2011 Tohoku-Chiho Taiheiyo-Oki Earthquake; Architectural Institute of Japan (AIJ): Tokyo, Japan, 2011; pp. 105–111. (In Japanese) [Google Scholar]
- Galvis, F.A.; Miranda, E.; Heresi, P.; Dávalos, H.; Ruiz-García, J. Overview of collapsed buildings in Mexico City after the 19 September 2017 (Mw7. 1) earthquake. Earthq. Spectra 2020, 36, 8755293020936694. [Google Scholar] [CrossRef]
- Lago, A.; Trabucco, D.; Wood, A. Damping Technologies for Tall Buildings: Theory, Design Guidance and Case Studies; Butterworth-Heinemann: Oxford, UK, 2018. [Google Scholar]
- Arakaki, T.; Kuroda, H.; Arima, F.; Inoue, Y.; Baba, K. Development of seismic devices applied to ball screw: Part 1 Basic performance test of RD-series. AIJ J. Technol. Des. 1999, 5, 239–244. [Google Scholar] [CrossRef] [PubMed]
- Arakaki, T.; Kuroda, H.; Arima, F.; Inoue, Y.; Baba, K. Development of seismic devices applied to ball screw: Part 2 Performance test and evaluation of RD-series. AIJ J. Technol. Des. 1999, 5, 265–270. [Google Scholar] [CrossRef]
- Hwang, J.S.; Kim, J.; Kim, Y.M. Rotational inertia dampers with toggle bracing for vibration control of a building structure. Eng. Struct. 2007, 29, 1201–1208. [Google Scholar] [CrossRef]
- Lazar, I.F.; Neild, S.A.; Wagg, D.J. Using an inerter-based device for structural vibration suppression. Earthq. Eng. Struct. Dyn. 2014, 43, 1129–1147. [Google Scholar] [CrossRef]
- Makris, N.; Kampas, G. Seismic protection of structures with supplemental rotational inertia. J. Eng. Mech. 2016, 142, 04016089. [Google Scholar] [CrossRef]
- Málaga-Chuquitaype, C.; Menendez-Vicente, C.; Thiers-Moggia, R. Experimental and numerical assessment of the seismic response of steel structures with clutched inerters. Soil Dyn. Earthq. Eng. 2019, 121, 200–211. [Google Scholar] [CrossRef]
- Makris, N.; Moghimi, G. Displacements and forces in structures with inerters when subjected to earthquakes. J. Struct. Eng 2019, 145, 04018260. [Google Scholar] [CrossRef]
- Moghimi, G.; Makris, N. Seismic response of yielding structures equipped with inerters. Soil Dyn. Earthq. Eng. 2021, 141, 106474. [Google Scholar] [CrossRef]
- Smith, M.C. Synthesis of mechanical networks: The inerter. IEEE Trans. Autom. Control 2002, 47, 1648–1662. [Google Scholar] [CrossRef]
- Papageorgiou, C.; Smith, M.C. Laboratory experimental testing of inerters. In Proceedings of the 44th IEEE Conference on Decision and Control, Seville, Spain, 15 December 2005; pp. 3351–3356. [Google Scholar]
- Patton, W.J. Mechanical Power Transmission; Prentice Hall: Upper Saddle River, NJ, USA, 1980. [Google Scholar]
- Bouc, R. Modele mathematique d’hysteresis. Acustica 1971, 21, 16–25. [Google Scholar]
- Wen, Y.K. Method for random vibration of hysteretic systems. J. Eng. Mech. Div. 1976, 102, 249–263. [Google Scholar] [CrossRef]
- Teran-Gilmore, A.; Jirsa, J.O. Energy demands for seismic design against low-cycle fatigue. Earthq. Eng. Struct. Dyn. 2007, 36, 383–404. [Google Scholar] [CrossRef]
- Ruiz-García, J.; Cárdenas, Y. Seismic performance assessment of weak first-storey RC buildings designed with old and new seismic provisions for Mexico City. Eng. Struct. 2021, 232, 111803. [Google Scholar] [CrossRef]
- García-Ranz, F.; Gómez, R. The Mexico Earthquake of 19 September 1985—Seismic Design Regulations of the 1976 Mexico Building Code. Earthq. Spectra 1988, 4, 427–439. [Google Scholar] [CrossRef]
- Valente, M.; Milani, G. Alternative retrofitting strategies to prevent the failure of an under-designed reinforced concrete frame. Eng. Fail. Anal. 2018, 89, 271–285. [Google Scholar] [CrossRef]
- Alam, Z.; Zhang, C.; Samali, B. The role of viscoelastic damping on retrofitting seismic performance of asymmetric reinforced concrete structures. Earthq. Eng. Eng. Vib. 2020, 19, 223–237. [Google Scholar] [CrossRef]
- Cardenas, Y. Comportamiento Sísmico de Edificios de Concreto Reforzado con Planta Baja Débil Sujetos al Sismo del 19 de Septiembre de 2017. Bachelor Thesis, School of Engineering, Universidad Michoacana de San Nicolás de Hidalgo, Morelia, Mexico, 2020. (In Spanish). [Google Scholar]
- Gregorio, L. Evaluación de las Nuevas Disposiciones Normativas para el Diseño Sísmico de Edificios de Concreto Reforzado con Planta Baja Débil. Bachelor Thesis, School of Engineering, Universidad Michoacana de San Nicolás de Hidalgo, Morelia, Mexico, 2020. (In Spanish). [Google Scholar]
- McKenna, F. OpenSees: A framework for earthquake engineering simulation. Comput. Sci. Eng. 2011, 13, 58–66. [Google Scholar] [CrossRef]
- Kent, D.C.; Park, R. Flexural members with confined concrete. J. Struct. Div. 1971, 97, 1969–1990. [Google Scholar] [CrossRef]
- Mazzoni, S.; McKenna, F.; Scott, M.H.; Fenves, G.L. OpenSees command language manual. Pac. Earthq. Eng. Res. Cent. 2006, 264, 137–158. [Google Scholar]
- Reinoso, E.; Ordaz, M. Spectral ratios for Mexico City from free-field recordings. Earthq. Spectra 1999, 15, 273–295. [Google Scholar] [CrossRef]
- Singh, S.K.; Iglesias, A.; Ordaz, M.; Pérez-Campos, X.; Quintanar, L. Estimation of ground motion in Mexico City from a repeat of the M∼7.0 Acambay earthquake of 1912. Bull. Seismol. Soc. Am. 2011, 101, 2015–2028. [Google Scholar] [CrossRef]
- Singh, S.K. A study of amplification of seismic waves in the Valley of Mexico with respect to the hill zone site. Earthq. Spectra 1988, 4, 653–674. [Google Scholar] [CrossRef]
- Singh, S.K.; Mena, E.A.; Castro, R. Some aspects of source characteristics of the 19 September 1985 Michoacan earthquake and ground motion amplification in and near Mexico City from strong motion data. Bull. Seismol. Soc. Am. 1988, 78, 451–477. [Google Scholar]
- Ordaz, M.; Reinoso, E.; Singh, S.K.; Vera, E.; Jara, J.M. Espectros de Respuesta en Diversos Sitios del Valle ante Temblores Postulados en la Brecha de Guerrero. In Memorias del VIII Congreso Nacional de Ingeniería Sísmica and VII Congreso Nacional de Ingeniería Estructural; Acapulco, México, 1989; pp. A187–A198. (In Spanish) [Google Scholar]
- Montalvo-Arrieta, J.C.; Sánchez-Sesma, F.J.; Reinoso, E. A virtual reference site for the Valley of Mexico. Bull. Seismol. Soc. Am. 2002, 92, 1847–1854. [Google Scholar] [CrossRef]
- Jaimes, M.A.; Reinoso, E.; Ordaz, M. Comparison of methods to predict response spectra at instrumented sites given the magnitude and distance of an earthquake. J. Earthq. Eng. 2006, 10, 887–902. [Google Scholar] [CrossRef]
- McGuire, R.K. Probabilistic seismic hazard analysis: Early history. Earthq. Eng. Struct. Dyn. 2008, 37, 329–338. [Google Scholar] [CrossRef]
- Ordaz, M.; Reyes, C. Earthquake hazard in Mexico City: Observations versus computations. Bull. Seismol. Soc. Am. 1999, 89, 1379–1383. [Google Scholar] [CrossRef]
- Jaimes, M.A.; Reinoso, E. Comparación del comportamiento de edificios en el valle de México ante sismos de subducción y de falla normal. Rev. Ing. Sísmica 2006, 75, 1–22. (In Spanish) [Google Scholar]
- Jaimes, M.A.; Ramirez-Gaytán, A.; Reinoso, E. Ground-motion prediction model from intermediate-depth intraslab earthquakes at the hill and lake-bed zones of Mexico City. J. Earthq. Eng. 2015, 19, 1260–1278. [Google Scholar] [CrossRef]
- Jaimes, M.A.; Lermo, J.; García-Soto, A.D. Ground-motion prediction model from local earthquakes of the Mexico Basin at the hill zone of Mexico City. Bull. Seismol. Soc. Am. 2016, 106, 2532–2544. [Google Scholar] [CrossRef]
- Rosenblueth, E.; Arciniega, A. Response spectral ratios. Earthq. Eng. Struct. Dyn. 1992, 21, 483–492. [Google Scholar] [CrossRef]
- Reyes, C. El Estado Límite de Servicio en el Diseño Sísmico de Edificios. Ph.D. Thesis, UNAM, Ciudad de Mexico, México, 1999. (In Spanish). [Google Scholar]
- Candia, G.; Macedo JJaimes, M.A.; Magda-Verdugo, C. A new state of the art platform for probabilistic and deterministic seismic hazard assessment. Seismol. Res. Lett. 2019, 90, 2262–2275. [Google Scholar] [CrossRef]
- NTCS. Technical Norms for Seismic Design. Gaceta Oficial de la Ciudad de México. 15 December 2017. Available online: https://www.smig.org.mx/archivos/NTC2017/normas-tecnicas-complementarias-reglamento-construcciones-cdmx-2017.pdf (accessed on 10 October 2020).
- Watson-Lamprey, J.; Abrahamson, N. Selection of ground motion time series and limits on scaling. Soil Dyn. Earthq. Eng. 2006, 26, 477–482. [Google Scholar] [CrossRef]
- Kunnath, S.K.; Mander, J.B.; Fang, L. Parameter identification for degrading and pinched hysteretic structural concrete systems. Eng. Struct. 1997, 19, 224–232. [Google Scholar] [CrossRef]
- Goda, K.; Hong, H.P.; Lee, C.S. Probabilistic characteristics of seismic ductility demand of SDOF systems with Bouc-Wen hysteretic behavior. J. Earthq. Eng. 2009, 13, 600–622. [Google Scholar] [CrossRef]
- Thiers-Moggia, R.; Málaga-Chuquitaype, C. Seismic control of flexible rocking structures using inerters. Earthq. Eng. Struct. Dyn. 2020, 49, 1519–1538. [Google Scholar] [CrossRef]
- Thiers-Moggia, R.; Málaga-Chuquitaype, C. Effect of base-level inerters on the higher mode response of uplifting structures. J. Eng. Mech. 2021, 147, 04021041. [Google Scholar] [CrossRef]
- Vamvatsikos, D.; Cornell, C.A. Incremental dynamic analysis. Earthq. Eng. Struct. Dyn. 2002, 31, 491–514. [Google Scholar] [CrossRef]
- Esteva, L. Bases para la Formulación de Decisiones de Diseño Sísmico; Serie Azul 182; Instituto de Ingeniería, Universidad Nacional Autónoma de México: Ciudad de Mexico, Meico, 1968. (In Spanish) [Google Scholar]
- Esteva, L. Regionalizacion Sísmica para Fines de Ingeniería; Serie Azul 246; Instituto de Ingeniería UNAM: Ciudad de Mexico, Mexco, 1970. (In Spanish) [Google Scholar]
- Cornell, C.A. Engineering seismic risk analysis. Bull. Seismol. Soc. Am. 1968, 58, 1583–1606. [Google Scholar] [CrossRef]
- Der Kiureghian a Non-Ergodicity and PEER’s framework formula. Earthq. Eng. Struct. Dyn. 2005, 34, 1643–1652. [CrossRef]


| Model | Total Weight (kN) | Period | Participating Mass Percentage (%) First, Second, and Third Mode |
|---|---|---|---|
| E4Q6 | 5928 | 1.02 | 89.4, 8.8, 1.1 |
| E6Q6 | 9186 | 1.04 | 87.3, 9.8, 2.0 |
| E8Q6 | 13,574 | 0.98 | 83.9, 11.6, 2.5 |
| E4Q4 | 5972 | 0.87 | 89.3, 9.1, 1.2 |
| E6Q4 | 9330 | 0.97 | 87.2, 10, 1.9 |
| E8Q4 | 13,771 | 0.92 | 83.8, 10.8, 2.5 |
Disclaimer/Publisher’s Note: The statements, opinions and data contained in all publications are solely those of the individual author(s) and contributor(s) and not of MDPI and/or the editor(s). MDPI and/or the editor(s) disclaim responsibility for any injury to people or property resulting from any ideas, methods, instructions or products referred to in the content. |
© 2023 by the authors. Licensee MDPI, Basel, Switzerland. This article is an open access article distributed under the terms and conditions of the Creative Commons Attribution (CC BY) license (https://creativecommons.org/licenses/by/4.0/).
Share and Cite
Jaimes, M.A.; Niño, M.; Franco, I.; Trejo, S.; Godínez, F.A.; García-Soto, A.D. Seismic Risk of Weak First-Story RC Structures with Inerter Dampers Subjected to Narrow-Band Seismic Excitations. Buildings 2023, 13, 929. https://doi.org/10.3390/buildings13040929
Jaimes MA, Niño M, Franco I, Trejo S, Godínez FA, García-Soto AD. Seismic Risk of Weak First-Story RC Structures with Inerter Dampers Subjected to Narrow-Band Seismic Excitations. Buildings. 2023; 13(4):929. https://doi.org/10.3390/buildings13040929
Chicago/Turabian StyleJaimes, Miguel A., Mauro Niño, Isaac Franco, Salatiel Trejo, Francisco A. Godínez, and Adrián D. García-Soto. 2023. "Seismic Risk of Weak First-Story RC Structures with Inerter Dampers Subjected to Narrow-Band Seismic Excitations" Buildings 13, no. 4: 929. https://doi.org/10.3390/buildings13040929
APA StyleJaimes, M. A., Niño, M., Franco, I., Trejo, S., Godínez, F. A., & García-Soto, A. D. (2023). Seismic Risk of Weak First-Story RC Structures with Inerter Dampers Subjected to Narrow-Band Seismic Excitations. Buildings, 13(4), 929. https://doi.org/10.3390/buildings13040929