Abstract
Taking the expansive soil near Hefei Xinqiao International Airport as the research subject, indoor dynamic triaxial tests were conducted to investigate the influence of different loading methods on the dynamic pore pressure of saturated remolded expansive soil on the basis of maximally simulating the real characteristics of subway loading. Furthermore, the action laws of three factors, namely intermittent loading ratio, static deviator stress, and cyclic stress ratio, on the accumulated pore pressure of saturated remolded expansive soil under intermittent subway cyclic loading were analyzed. The research results indicate that the loading method significantly affects the development trend of the accumulated pore pressure. Under similar conditions, a larger intermittent loading ratio leads to smaller accumulated pore pressure values and a slower initial development rate of pore pressure under the same cycle vibration. Increasing static deviatoric stress promotes the accumulation of pore pressure. The influence of the cyclic stress ratio is dependent on the intermittent loading ratio and does not follow a consistent pattern.
1. Introduction
Currently, the study of dynamic behavior in special soils has become a hot topic in the field of geotechnical engineering, with particular emphasis on expansive soils due to their complexity, variability, and long-term potential hazards. However, the research on the dynamic behavior of expansive soils, especially regarding the dynamic pore pressure, is still relatively limited compared with other types of soils like loess [1,2,3,4] or frozen soils [5,6,7].
Research on the dynamic properties of soils has primarily focused on parameters such as dynamic elastic modulus, damping ratio, and dynamic strain. However, there has been limited research on the dynamic pore pressure of special soils. Dong et al. [8] conducted an analysis and discussion of the changes in excess pore pressure in marine sedimentary clay subgrade under cyclic dynamic loading conditions, specifically under intermittent drainage conditions. Their findings revealed that, during intermittent drainage stages, the dissipation of excess pore pressure generated during cyclic loading led to soil reconsolidation. Moreover, the increase in strain due to pore pressure dissipation during the intermittent periods accounted for a significant portion of the total strain.
From this, it is evident that the increase in strain resulting from intermittent drainage should not be overlooked. Therefore, the study of pore pressure patterns in soils under dynamic loading conditions holds significant research importance.
Chen Qiang [9] researched the dynamic characteristics of expansive soil embankments under traffic loading. The study considered factors such as moisture content, vibration frequency, confining pressure, and dynamic stress, and their influence on the cumulative plastic strain and cumulative pore pressure in expansive soils. However, there was not sufficient evidence provided to justify the equivalence of simulating traffic loads as sinusoidal waves. In reality, traffic loads induce only compressive stress and do not exhibit the sinusoidal stress pattern characterized by both tension and compression [10].
In studying the impact of subway loads on pore pressure in expansive soils, several key factors must be taken into consideration. Firstly, subway loads are discontinuous and exert only compressive stresses on the soil [11], and the passage of a subway train can also induce transient shear stresses within the soil. Furthermore, the development of pore pressure is influenced by various factors, including soil structure, the type of train load during operation, stress amplitudes, frequencies, the number of loading cycles, and drainage conditions, among others. Among these influencing factors, shear stress and stress amplitude are the most critical factors affecting the dynamic behavior of soils.
In this study, we have selected factors such as the cyclic loading ratio, static shear stress, and cyclic stress ratio as experimental parameters. We have investigated the variation of cumulative pore pressure in saturated remolded expansive soils under intermittent subway loading, focusing on how it changes with the number of loading cycles. Additionally, we have conducted a comparative analysis of the cumulative pore pressure curves in expansive soils subjected to intermittent and continuous loading. The findings of this research not only provide theoretical insights for fellow scholars but also contribute to a deeper understanding of the cumulative pore pressure behavior in expansive soils under dynamic loading conditions.
2. Dynamic Triaxial Test
2.1. Test Equipment and Test Soil Samples
The advanced motor-controlled dynamic triaxial testing system (DYNTTS) used in the study is manufactured by GDS, a renowned company based in the United Kingdom. This instrument comprises five constituent parts, namely the GDSLAB control software, axial actuation system, DCS digital control system, confining pressure and back pressure controllers, and pressure chamber, as shown in Figure 1.
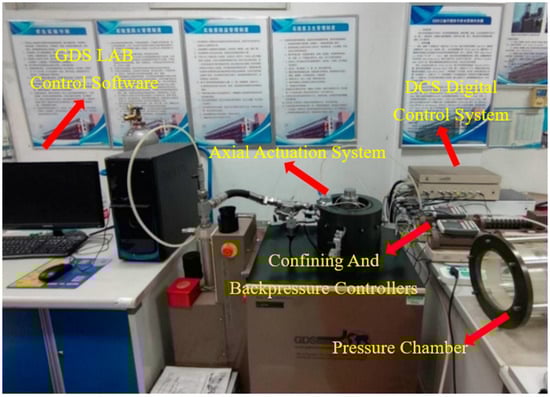
Figure 1.
Dynamic triaxial testing system (DYNTTS).
The test soil was obtained from the expansive soil at a subway station near the Xinqiao International Airport in Hefei City. Soil samples with a diameter of 80 mm and a height of 200 mm were collected, as shown in Figure 2.
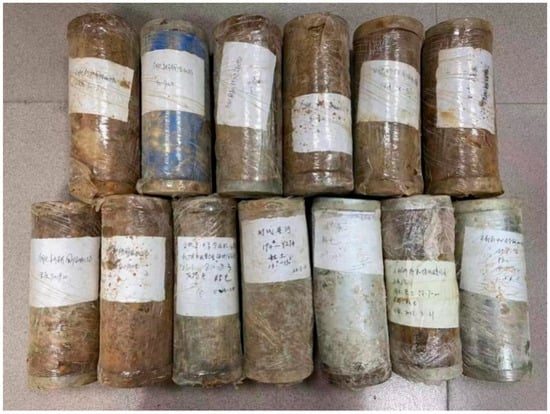
Figure 2.
Samples of undisturbed expansive soil.
The retrieved expansive soil samples underwent a series of measurements for their physical properties, following the guidelines outlined in the ‘Standard Test Methods for Geotechnical Investigation’ (GB/T50123-2019) [12]. The basic physical properties of the undisturbed expansive soil are presented in Table 1.

Table 1.
Basic physical property indices of soil samples.
According to the ‘Technical Code for Buildings in Expansive Soil Regions’ (GB 50112-2013) [13], when the free swelling ratio falls within the range of 40% to 65%, the undisturbed soil sample is categorized as weak expansive soil. When the free swelling ratio is between 65% and 90%, it is classified as moderate expansive soil. When the free swelling ratio exceeds 90%, the undisturbed soil sample is considered as strong expansive soil. Therefore, the soil used in this study falls under the category of moderate expansive soil, indicating a moderate potential for swelling.
Considering the non-uniformity of soil composition and variations in the basic physical parameters of soil samples, the study utilized saturated remolded soil samples to minimize experimental errors. Apart from the experimental factors, all other conditions were maintained consistently. The specific procedures for preparing the sample are as follows. (1) Remove the soil sample from the sampling cylinder and cut it into slices, placing them on a tray. Then, put the tray into the drying oven and dry the soil at 110 °C for 24 h to ensure complete desiccation. (2) Crush and sieve the dried sample manually and mechanically, leaving soil particles with a diameter ranging from 1 mm to 2 mm. Then, thoroughly mix the sieved soil and measure the moisture content of the sample. (3) Utilize the wet method for sample preparation. Calculate the mass and moisture content of the dry soil required for the experiment based on the predetermined moisture content and maximum dry density. Add water to the dry soil container to reach the required moisture content. Then, cover the surface of the container with a damp cloth and allow it to rest undisturbed for 12 h to ensure uniform moisture distribution within the soil material. (4) Following the completion of wet soil sample preparation, employ the compaction method to compact the soil sample. Weigh the designated sample quantity, then pour it into the compaction mold in seven layers, ensuring an even distribution and leveling the soil surface. Throughout the testing process, it is essential to maintain consistent layer heights, and the layered surfaces should undergo trimming to remove excess soil. (5) Once the compaction is finished, use a cutting ring to extract a soil sample for weighing. Measure the moisture content of the soil samples cut from both ends of the ring, with an acceptable error range of ±1%. After completing the sample preparation, wrap it with cling film and allow it to rest undisturbed in preparation for the dynamic triaxial test.
2.2. Experimental Parameter Settings
The dynamic properties of expansive soil are influenced by multiple factors, including confining pressure, stress amplitude, vibration frequency, consolidation ratio (over-consolidation ratio), initial stress conditions, and others. To ensure the validity of the experiments, it is necessary to select appropriate parameters based on the research objectives and scope, while maximizing their alignment with real-world conditions. Given the intermittent nature of subway loading, the experimental factors should also consider the intermittent effects associated with subway loading. Consistent control conditions should be maintained for all other aspects of the experiment.
- (1)
- Intermittent Loading Ratio
Considering the intermittent nature of subway loading, the intermittent loading ratio is defined as the ratio of the intermittent loading duration, , and the functioning time of the subway loading, . The specific parameter settings for the intermittent loading ratio were determined as follows. Since the typical subway train in Hefei city consists of 6 sections of type B drum-shaped cars, with a length of approximately 120 m, and the train speed ranges from 30 to 80 km/h, the time taken for the subway to pass a specific point can be calculated as 5.4 s to 14.4 s. Taking 10 s as the time for the subway to pass a specific point, the intermittent duration is generally tens of times the running time. The selected values for the intermittent loading ratio, , were 1, 5, 10, and 50, thus corresponding to intermittent durations of 10 s, 50 s, 100 s, and 500 s, respectively. A control experiment was also included with = 0.
- (2)
- Static Deviatoric Stress
The actual loads experienced by the soil under train-induced loading include a static load and cyclic dynamic loads. The static load arises from the instantaneous pressure exerted by the train on the soil. Wang Changjing et al. [14] investigated the influence of static bias stress on the development of pore pressure in saturated soft clay from Xiaoshan. Through indoor dynamic triaxial tests, they found that higher static bias stress leads to a faster development of residual pore pressure in the soil. Zang Meng et al. [15] also explored the dynamics of pore pressure in structured clay under the effect of static bias stress. They concluded that the dynamic pore water pressure in structured soil is lower than in typical clay, and the presence of static bias stress leads to negative growth of pore pressure after soil failure.
According to existing research findings [16], during the operation of subway trains, the instantaneous stress exerted by the surrounding soil is in the range of 20 kPa to 40 kPa. Chen et al. [17] considered the static loads from superimposed structures (loading, track, and sleepers) and applied a static bias stress of 15 kPa. In this study, two different static bias stress values, 15 kPa and 30 kPa, were chosen for comparative analysis.
- (3)
- Cyclic Stress Ratio
As one of the most important factors affecting the dynamic characteristics of soil, the cyclic stress ratio cannot be ignored in triaxial dynamic tests. The cyclic stress ratio, , is defined as the ratio of the dynamic load amplitude (the difference between the peak and trough of the load), , to the confining pressure, . In the experiment, cyclic stress ratios, , of 0.1, 0.2, and 0.4 were set, respectively.
- (4)
- Soil Consolidation Conditions
The actual consolidation state of the soil sample is not isotropic consolidation but is in a biased consolidation state. Therefore, the test adopted the biased consolidation condition of the soil, using the consolidation module provided by GDS, with an effective confining pressure of 120 kPa.
- (5)
- Drainage Conditions and Test Termination Criteria
When the subway train acts on the soil, the soil does not have time to drain, and, at this point, the soil is in a nearly undrained condition. Subsequently, as the subway train load is removed, the pore water in the soil begins to drain out. Therefore, under intermittent subway load conditions, both drained and undrained conditions were simulated. During the loading phase, the drainage valve was closed to simulate the undrained condition. During the rest phase, the drainage valve was opened to simulate the drained condition. When subjected to continuous subway loading, the soil remains close to an undrained condition, so the drainage valve remained closed to simulate the undrained condition.
The termination criteria for the continuous loading test are that the axial strain reaches 10% or the total number of cycles reaches 10,000, and the failure criterion is that the axial strain reaches 5%. For the intermittent loading test, the loads applied were relatively small, and the corresponding strains were in the range of 10−3 to 10−2. The intermittent duration was set to 10 s to 500 s. The instrument cannot automatically perform the cycle loading and unloading operation, and long-term repeated loading and unloading under the same termination criteria as the continuous loading test can cause damage to the machine. Therefore, the termination criteria for non-continuous loading tests are different from those for continuous loading tests. When the strain stabilizes within a certain range (order of magnitude 10−4), the test was terminated, and the same number of cycles was controlled to avoid test errors caused by long-term manual operation.
2.3. Determination of Parameters Related to Subway Loads
- (1)
- Load Waveform
Previous scholars have demonstrated that the subway running load has obvious characteristics of harmonic waves, and, among various waveforms, the biased sinusoidal waveform closely approximates the actual subway train load. It can not only simulate the instantaneous bias stress generated by the train passing through the soil, but also meet the requirement that the soil experiences only compressive stress under subway loading conditions. Therefore, the biased sinusoidal wave was selected as the subway load waveform, as depicted in Figure 3 and Figure 4.
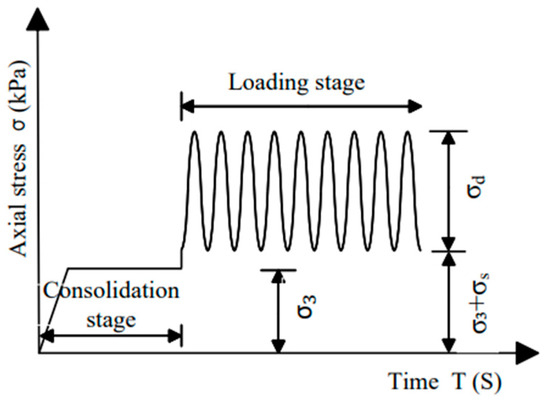
Figure 3.
Schematic diagram of continuous cyclic loading waveform in dynamic triaxial test.
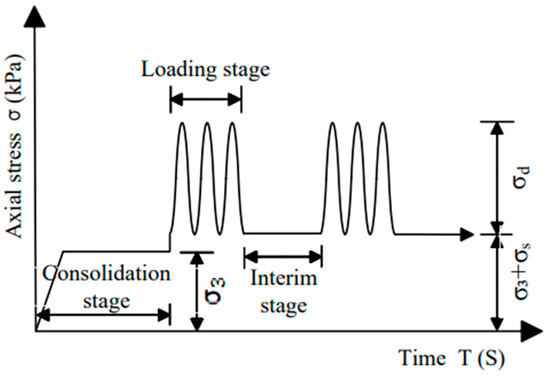
Figure 4.
Schematic diagram of intermittent cyclic loading waveform in dynamic triaxial test.
- (2)
- Vibration Frequency
Zhang Yu’e [18] proposed that the main vibrations generated by subway trains passing through have a low frequency, and high-frequency vibrations have minimal impact on structures. Based on research, Lei Shengyou et al. [19] found that the frequency of dynamic loads has little effect on the deformation of expansive soil. Zhou Xiaosheng [20] conducted experimental research on remolded expansive soil, and reached the conclusion that there is no significant regular change in the dynamic strain, dynamic elastic modulus, and damping ratio of the soil when the frequencies are, respectively, 1 Hz and 2 Hz. Zhuang Jiahuang [21] determined the frequency of cyclic loading as 1 Hz based on measured data. Therefore, the influence of frequency on the dynamic loading tests for expansive soil was no longer considered, and a uniform value of 1 Hz was adopted.
2.4. Test Plan
The test plan is shown in Table 2.
Table 2.
Dynamic triaxial test plan.
3. Analysis of Test Results
3.1. Analysis of the Influence Law of Loading Methods on the Dynamic Pore Pressure of Expansive Soil
As depicted in Figure 5, the pore pressure time curve of specimen S3 under continuous cyclic loading of the subway is shown. Figure 5a represents the complete curve, showing the development of pore pressure over time under continuous cyclic loading. It reveals that the pore pressure consists of both recoverable and non-recoverable components, and the overall curve exhibits an increasing trend as time progresses. The line connecting the lowest points of the dynamic pore pressure development curve represents the variation of accumulated pore pressure over time under continuous loading conditions, as shown in Figure 5b. It can be observed that the accumulated pore pressure initially increases rapidly, then gradually slows down, and eventually stabilizes towards the end of the cyclic loading phase.
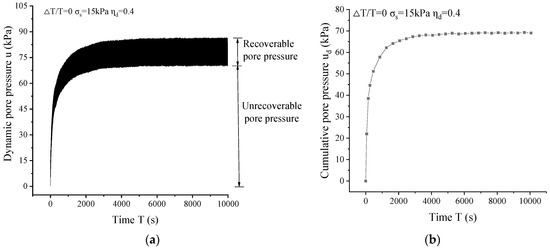
Figure 5.
Time course curve of dynamic pore pressure under continuous loading conditions. (a) Dynamic pore pressure time course curve; and (b) accumulated pore pressure time course curve.
In both undrained continuous loading tests, the soil samples were maintained in a saturated state, meaning that the drainage valve remained closed throughout the loading process, preventing the release of pore water. Consequently, the external stresses applied to the samples due to the cyclic subway loading were rapidly converted into pore pressures. As a result, the pore pressure increased sharply during the initial cycles of loading, and there was no dissipation of pore pressure throughout the entire test. After a certain number of loading cycles, the rate of pore pressure development began to decrease, and the slope of the curve decreased with an increasing number of vibration cycles, eventually leveling off. This behavior is consistent with previous research findings [22].
Figure 6a presents the time development curve of dynamic pore pressure for specimen S21 under intermittent cyclic loading from the subway for the initial 800 s. The graph displays the changes in pore pressure during the loading phase and the intermittent phase, showing an overall increasing trend and exhibiting distinct “step-like” development. The curve of pore pressure development over time, similar to continuous loading, comprises two components: recoverable pore pressure and non-recoverable pore pressure. The line connecting the lowest points of the dynamic pore pressure development curve represents the variation of accumulated pore pressure over time under intermittent loading conditions, as shown in Figure 6b. The growth curve of accumulated pore pressure under intermittent subway cyclic loading follows a pattern of “rapid increase to a peak, followed by a gradual decrease with the number of cycles”.
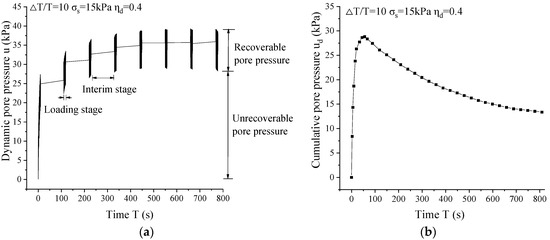
Figure 6.
Time course curve of dynamic pore pressure under intermittent loading conditions. (a) Dynamic pore pressure time course curve; and (b) accumulated pore pressure time course curve.
Under intermittent loading conditions, partial drainage is employed. During the initial cycles, the specimen remains undrained during the loading phase, resulting in a rapid increase in pore pressure over time. In the intermittent phase, drainage is allowed, but, due to the incomplete dissipation of pore pressure from the loading phase, rapid pore pressure accumulation occurs when the pore pressure growth exceeds the dissipation rate. As a result, the initial pore pressure value of the subsequent loading phase is higher than the final pore pressure value of the preceding intermittent phase. Once the growth and dissipation of pore pressure reach equilibrium, the curve of accumulated pore pressure reaches its peak. With the passage of time, pore pressure dissipation surpasses pore pressure accumulation, leading to a decline in the accumulated pore pressure until it reaches a stable state.
(1) The development curves of dynamic pore pressure differ significantly under intermittent and continuous loading conditions. Under continuous loading conditions, the specimen experiences a continuous growth in pore pressure, but the growth rate decreases with an increasing number of cycles. When the number of cycles is sufficiently large, the accumulated pore pressure reaches a steady state. Under intermittent loading conditions, pore pressure increases and dissipates alternately, with the dissipation amount being dependent on the duration of the intermittent phase, ultimately influencing the form of the accumulated pore pressure curve.
(2) The number of cycles required to reach a stable state is larger under continuous loading conditions, while, under intermittent loading conditions, the peak value is achieved with a smaller number of cycles. However, under the same conditions, the accumulated pore pressure value for intermittent loading is smaller than that for continuous loading, indicating a significant weakening of the pore pressure accumulation trend due to the intermittent effect.
3.2. Analysis of Accumulated Pore Pressure Behavior of Expansive Soil under Intermittent Loading
3.2.1. Analysis of the Influence Law of Intermittent Loading Ratio on the Accumulated Pore Pressure
Taking the examples of cyclic stress ratio with static deviator stress and cyclic stress ratio with static deviator stress , as shown in Figure 7, we can observe that, under the same conditions, the development trends of accumulated pore pressure curves vary for different intermittent loading ratios.

Figure 7.
Development curve of accumulated pore pressure with the number of cycles at different intermittent loading ratios. (a) , ; and (b) , .
When = 1 and = 5, the accumulated pore pressure initially increases rapidly with the number of cycles and then reaches a stable state. When = 10 and = 50, the accumulated pore pressure increases rapidly with the number of cycles until it reaches a peak value. As the number of cycles continues to increase, the accumulated pore pressure tends to decrease with the increase of cycle times.
This behavior is attributed to the fact that, when the intermittent loading ratio is relatively small, the drainage occurs during the rest period, resulting in a significantly lower dissipation of pore pressure compared with its increase. Consequently, the primary contribution is the increase in pore pressure, leading to a gradual accumulation of pore pressure with an increasing number of cycles until it reaches a stable value. Moreover, smaller intermittent loading ratios resemble undrained conditions in terms of the growth in accumulated pore pressure. Additionally, under partial drainage conditions, the reduction in pore pressure growth is faster than under undrained conditions. Hence, the accumulation of pore pressure tends to stabilize more quickly in the later stages of the cycles under smaller intermittent loading ratios.
As the intermittent loading ratio increases to a certain value, the dissipation of pore pressure also gradually increases with the number of cycles. Once the dissipation of pore pressure exceeds the increase in pore pressure, the accumulated pore pressure starts to decline, but at an extremely slow rate. With further increases in the intermittent loading ratio, the rate of pore pressure growth diminishes. Eventually, a balance is reached between the increase and dissipation of pore pressure, causing the accumulated pore pressure to reach its peak value. Subsequently, the dissipation of pore pressure consistently exceeds the increase, resulting in a gradual decrease in accumulated pore pressure with additional cycles, albeit at a slower pace.
Figure 7 also indicates that, under similar conditions, larger intermittent loading ratios correspond to smaller values of accumulated pore pressure for the same number of cycles and a slower initial rate of pore pressure growth. This phenomenon primarily arises from the immediate conversion of external cyclic loads to pore pressure during the initial stage of the cycles, given the non-drained loading phase and the saturated state of the soil specimen. When the drainage switch is opened during the rest period, the dynamic load-induced pore pressure gradually diminishes, with the extent of reduction dependent on the duration of the rest period. The cumulative capacity of the specimen depends on the relative relationship between pore pressure dissipation and pore pressure growth, with longer rest periods resulting in poorer cumulative pore pressure capacity. Therefore, the initial rate of pore pressure growth is lower in such cases.
3.2.2. Analysis of the Influence Law of Static Deviator Stress on the Accumulated Pore Pressure
According to Figure 8, which illustrates the relationship between accumulated pore pressure and the number of cycles under cyclic stress ratio = 0.2, and static bias stresses = 15 kPa and = 30 kPa, a similar pattern of pore pressure development can be observed under other cyclic stress ratios, and, thus, further elaboration is unnecessary. It is evident from the graph that the static bias stress has a significant influence on the accumulated pore pressure. Depending on the duration of the rest period, the development curve of accumulated pore pressure varies. However, under the same intermittent loading ratio and cyclic stress ratio, the trends of pore pressure development for = 15 kPa and = 30 kPa are similar.
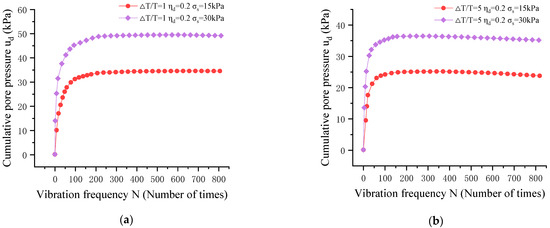
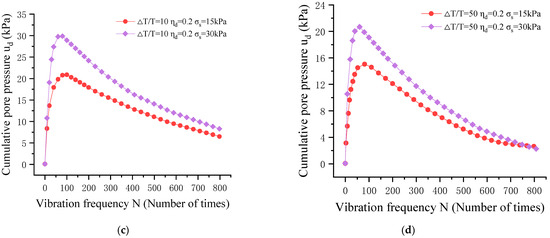
Figure 8.
Development curve of accumulated pore pressure with the number of cycles under different static deviator stress. (a) = 1; (b) = 5; (c) = 10; and (d) = 50.
The curves of accumulated pore pressure can be categorized into two types based on the intermittent loading ratio. The first type shows a rapid initial increase in accumulated pore pressure with the number of cycles, followed by a decrease in the growth rate. The dissipation of pore pressure remains consistently smaller than or equal to the increase in pore pressure. The second type exhibits a rapid increase in accumulated pore pressure with the number of cycles, reaching a peak value when the number of cycles reaches a certain threshold. Subsequently, the dissipation of pore pressure exceeds the increase in pore pressure, resulting in a gradual decline in accumulated pore pressure, with a decreasing rate.
Based on Figure 8a–d, it can be observed that, for the same number of cycles, the pore pressure values corresponding to a static deviator stress, , of 30 kPa are consistently greater than those corresponding to a of 15 kPa. This indicates that the presence of static deviator stress promotes the increase in pore pressure, albeit to varying degrees. When = 1, the maximum pore pressure under a static deviator stress of = 30 kPa is approximately 43% higher than that under = 15 kPa. When = 5, the difference in maximum pore pressure is approximately 45%. When = 10, the difference is about 43%, and, when = 50, the difference is around 38%. Comparative analysis reveals that, when ≤ 5, the influence of static deviator stress on pore pressure increases with an increase in the intermittent loading ratio. However, when > 5, this influence diminishes with a higher intermittent loading ratio. This suggests that the smaller the intermittent loading ratio is, the more pronounced the effect of static deviator stress on pore pressure is.
3.2.3. Analysis of the Influence Law of Cyclic Stress Ratio on the Accumulated Pore Pressure
Figure 9 depicts the relationship between accumulated pore pressure and the number of cycles under different cyclic stress ratios. It is evident that, under the same conditions, the development curves of accumulated pore pressure exhibit a similar pattern for different cyclic stress ratios, while varying with different intermittent loading ratios.
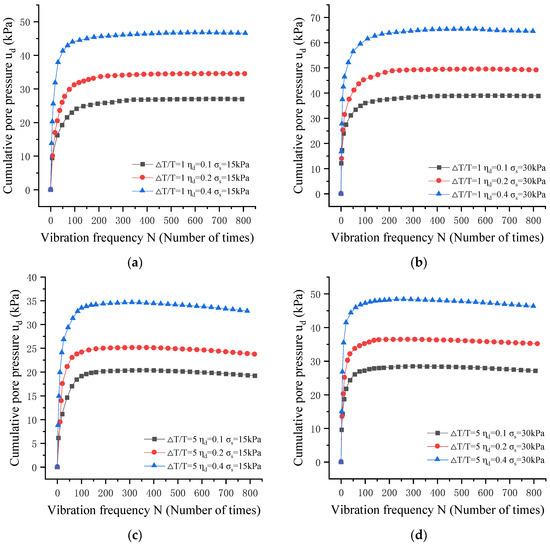
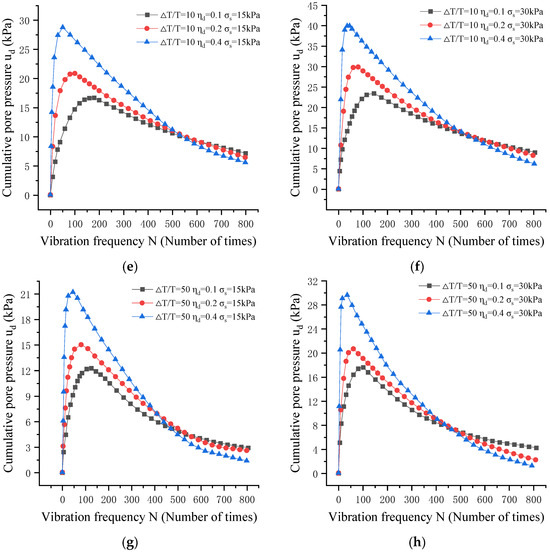
Figure 9.
Development curve of accumulated pore pressure with the number of cycles at different cyclic stress ratios. (a) = 1, σs = 15 kPa; (b) = 1, σs = 30 kPa; (c) = 5, σs = 15 kPa; (d) = 5, σs = 30 kPa; (e) = 10, σs = 15 kPa; (f) = 10, σs = 30 kPa; (g) = 50, σs = 15 kPa; and (h) = 50, σs = 30 kPa.
In Figure 9, (a) to (d) all demonstrate a development trend of “initial rapid growth–mid-term rate deceleration–eventual approximate stabilization”. The higher the cyclic stress ratio is, the larger is the accumulated pore pressure for the same number of cycles. In Figure 9, (e) to (h) all present a development pattern of “rapid growth–reaching a peak–gradual decline”. However, there are intersections in the pore pressure curves for different cyclic stress ratios. Before the intersection point, a higher cyclic stress ratio corresponds to a larger accumulated pore pressure value. After the intersection point, a higher cyclic stress ratio leads to a smaller accumulated pore pressure value.
The influence of the cyclic stress ratio under different conditions is analyzed as follows.
When the intermittent loading ratio = 1, under a static deviator stress of 15 kPa, the maximum accumulated pore pressure values for d = 0.1, d = 0.2, and d = 0.4 are 27.0 kPa, 34.5 kPa, and 46.8 kPa, respectively. Compared with the previous value, the growth rates of accumulated pore pressure are 27.8% and 35.7%, respectively. Under a static deviator stress of 30 kPa, the corresponding maximum accumulated pore pressure values for d = 0.1, d = 0.2, and d = 0.4 are 39.0 kPa, 49.5 kPa, and 65.4 kPa, respectively, with growth rates of 27.1% and 32.2%, respectively.
When the intermittent loading ratio = 5, but under a static deviator stress of 15 kPa, the maximum accumulated pore pressure values for d = 0.1, d = 0.2, and d = 0.4 are 20.4 kPa, 25.1 kPa, and 34.6 kPa, respectively. The growth rates of accumulated pore pressure under different cyclic stress ratios are 23.1% and 38.0%, respectively. Under a static deviator stress of 30 kPa, the corresponding maximum accumulated pore pressure values for d = 0.1, d = 0.2, and d = 0.4 are 28.5 kPa, 36.5 kPa, and 48.4 kPa, respectively, with growth rates of 28.0% and 32.8%, respectively.
When the intermittent loading ratio = 10, under a static deviator stress of 15 kPa, the maximum accumulated pore pressure values for d = 0.1, d = 0.2, and d = 0.4 are 16.7 kPa, 20.9 kPa, and 28.8 kPa, respectively. The differences in maximum accumulated pore pressure peak values compared with the previous one have increased by 25.0% and 37.9%, respectively. Under a static deviator stress of 30 kPa, the corresponding maximum accumulated pore pressure values for d = 0.1, d = 0.2, and d = 0.4 are 23.4 kPa, 29.8 kPa, and 39.9 kPa, respectively, with increases of 27.5% and 33.7%, respectively.
When the intermittent loading ratio = 50, under a static deviator stress of 15 kPa, the maximum accumulated pore pressure values for d = 0.1, d = 0.2, and d = 0.4 are 12.3 kPa, 15.0 kPa, and 21.2 kPa, respectively. The differences in maximum accumulated pore pressure peak values compared with the previous one have increased by 22.4% and 41.3%, respectively. Under a static deviator stress of 30 kPa, the corresponding maximum accumulated pore pressure values for d = 0.1, d = 0.2, and d = 0.4 are 17.6 kPa, 20.7 kPa, and 29.6 kPa, respectively, with increases of 17.5% and 43%, respectively.
It can be concluded that, under different test conditions, the influence of static deviator stress on the maximum or peak accumulated pore pressure varies, but the pore pressure growth rates fluctuate within the range of 17.5% to 43%.
4. Conclusions
The influence pattern of dynamic pore pressure in expansive soil under subway loading was investigated through indoor cyclic triaxial tests. Additionally, variations in the form of accumulated pore pressure curves under different loading conditions were analyzed, along with the impact of three factors on the accumulated pore pressure in expansive soil samples: intermittent loading ratio, cyclic stress ratio, and static deviator stress. From these investigations, the following conclusions can be drawn:
(1) Under both intermittent and continuous subway loading, the development trends of accumulated pore pressure in saturated remolded expansive soil differ. Under continuous subway loading, the accumulated pore pressure initially increases rapidly, followed by a slower increase, and eventually stabilizes towards the end of the cyclic loading. In the case of intermittent subway loading, the accumulated pore pressure curve exhibits a pattern of “rapid ascent to a peak, followed by a gradual decrease with the number of cycles”.
(2) Under intermittent subway loading, with other conditions held constant, a larger intermittent loading ratio leads to smaller accumulated pore pressure values at the same number of cyclic loading cycles, and a smaller initial development rate of accumulated pore pressure during the early cycles.
(3) Static deviatoric stress significantly affects the accumulated pore pressure, and, under the same number of cycles, the accumulated pore pressure increases with an increase in static deviatoric stress. Depending on the intermittent loading ratio, the influence rate of static deviatoric stress on the growth of accumulated pore pressure falls within the range of 38% to 45%. The shape of the accumulated pore pressure curves varies with different static deviatoric stresses, primarily depending on the duration of the intermittent loading. When the intermittent loading ratio is small, the accumulated pore pressure curve closely resembles that under continuous loading conditions, going through a sequence of “rapid growth–slow growth–stabilization”. As the intermittent loading ratio increases, the accumulated pore pressure curve changes, decreasing after reaching its peak value.
(4) The influence of the cyclic stress ratio on the accumulated pore pressure in expansive soil varies with different intermittent loading ratios, with the pore pressure growth rate fluctuating within approximately 17.5% to 43%. When = 1 and = 5, a larger cyclic stress ratio corresponds to a larger accumulated pore pressure value for the same number of cycles. However, when = 10 and = 50, before the intersection point, a larger cyclic stress ratio results in a larger accumulated pore pressure value, while, after the intersection point, a larger cyclic stress ratio leads to a smaller accumulated pore pressure value. Nevertheless, under different cyclic stress ratio conditions, the initial development rate of accumulated pore pressure increases with an increase in the cyclic stress ratio.
(5) Under intermittent subway loading, the experiments are conducted with partial drainage conditions, and, under these conditions, the dynamic pore pressure of the soil increases initially to a peak and then gradually decreases. The dissipation of pore pressure leads to an increase in strain. Therefore, after normal subway operation, it is essential to monitor the deformation of the soil to prevent significant deformations caused by the dissipation of pore pressure due to multiple intermittent cycles of subway loading, which could potentially affect the normal operation of the subway system.
Author Contributions
Conceptualization, L.Q. and L.Z.; methodology, L.Z.; software, Y.G.; validation, L.Z., Y.G. and G.C.; formal analysis, L.Q.; data curation, Y.G.; writing—original draft preparation, L.Q.; writing—review and editing, L.Z., Y.G. and G.C.; project administration, L.Z.; funding acquisition, L.Q. and L.Z. All authors have read and agreed to the published version of the manuscript.
Funding
This research was funded by [2020 Natural Science Foundation of Anhui Province] grant number [2008085ME168] and by [2021 Project on Cultivation of Outstanding Top Talents in Universities].
Data Availability Statement
Not applicable.
Conflicts of Interest
The authors declare no conflict of interest.
References
- Zhang, X.; Luo, Y. Research on the Dynamic Shear Modulus Characteristics of Loess Under Bidirectional Dynamic Loads. Rock Soil Mech. 2015, 36, 2591–2598. [Google Scholar]
- Wang, R.; Wang, L.; Hu, Z.; Zhao, Z.; Li, X.; Wang, Q. Influence of Static Deviator Stress Caused by Traffic Loads on the Dynamic Characteristics of Compacted Loess. J. China Railw. Soc. 2019, 41, 110–117. [Google Scholar]
- Tang, F.; Zhang, W.; Tang, X.; Liu, C. Research on the Dynamic Characteristics of Geogrid-Reinforced Loess Under Cyclic Loading. Water Resour. Hydropower Eng. 2023, 1–17, (In Chinese and English). [Google Scholar]
- Qiao, F.; Chang, C.; Bo, J.; Wang, L.; Wang, J. Study on the Dynamic Characteristics of Loess. Sustainability 2023, 15, 5428. [Google Scholar]
- Wei, X.; Zhuang, J.; Ding, Z.; Cai, Z. Research on Hysteresis Curves and Damping Ratio Characteristics of Frozen-Thawed Soil Under Metro Cyclic Loads. Chin. J. Rock Mech. Eng. 2019, 38, 2092–2102. [Google Scholar]
- Ding, Z.; Zheng, Y.; Wei, X.; Zhang, M. Experimental Study on the Influence of Different Loading Frequencies and Cyclic Stress Levels on the Dynamic Characteristics of Artificial Frozen-Thawed Soft Soil. J. China Railw. Soc. 2020, 42, 122–128. [Google Scholar]
- Guan, J.; Zhang, X.; Chen, X.; Ding, M.; Wang, W.; Yu, S. Influence of seasonal freezing-thawing soils on seismic performance of high-rise cap pile foundation in permafrost regions. Cold Reg. Sci. Technol. 2022, 199. [Google Scholar]
- Feng, D.; Zhu, X.; Wang, J.; Cai, Y.; Guo, L.; Du, Y.; Hu, X. The effects of cyclic loading on the reconsolidation behaviours of marine sedimentary clays under intermittent drainage conditions. Soil Dyn. Earthq. Eng. 2020, 106510. [Google Scholar]
- Chen, Q. Experimental Study on the Dynamic Characteristics of Limestone Expansive Soil Under Cyclic Loads; Southwest Jiaotong University: Chengdu, China, 2019. [Google Scholar]
- Ding, Z.; Zhang, T.; Wei, X. Experimental Study on Metro Train Cyclic Load Test. J. Earthq. Eng. 2015, 37, 789–793+802. [Google Scholar]
- Zheng, Q.; Xia, T.; Zhang, M.; Zhou, F. Strain Prediction Model of Intact Silty Clay Under Intermittent Cyclic Load. J. Zhejiang Univ. Eng. Sci. 2020, 54, 889–898. [Google Scholar]
- GB/T50123-2019; Standard Test Methods for Geotechnical Investigation. GB Standards: Taiwan, China, 2019.
- GB/T50112-2013; Technical Code for Buildings in Expansive Soil Regions. GB Standards: Taiwan, China, 2013.
- Wang, C.; Chen, Y. Experimental Study on the Influence of Static Deviator Stress Caused by Traffic Load on Unconsolidated Undrained Cyclic Behavior of Saturated Soft Clay. Chin. J. Geotech. Eng. 2007, 1742–1747. [Google Scholar]
- Zang, M.; Kong, L.; Guo, A. Dynamic Characteristics of Zhanjiang Structural Clay Under Static Deviator Stress. Rock Soil Mech. 2017, 38, 33–40. [Google Scholar]
- Wang, Y. Study on the Dynamic Stability of Subway Tunnel-Soil Interaction Under Cyclic Loading. Master’s Thesis, Tongji University School of Civil Engineering, Shanghai, China, 2002. [Google Scholar]
- Nie, R.; Li, Y.; Guo, Y.; Dong, J. Resilient modulus of fine-grained subgrade soil considering load interval: An experimental study. Soil Dyn. Earthq. Eng. 2021, 142, 106558. [Google Scholar]
- Zhang, Y.; Bai, B. Simulation of Vibration Load on Tunnel Structure Caused by Metro Train Vibration. J. Vib. Shock. 2000, 70–72+78+96. [Google Scholar]
- Lei, S.; Hui, H. Comparative Analysis of Static and Dynamic Properties of Expansive Soils and Improved Soils. Rock Soil Mech. 2004, 23, 3003–3008. [Google Scholar]
- Zhou, X. Study on the Dynamic Characteristics and Subgrade Response Characteristics of Expansive Soil Under Bidirectional Cyclic Loading; Institute of Rock and Soil Mechanics, Chinese Academy of Sciences: Beijing, China, 2010. [Google Scholar]
- Zhuang, J. Research on the Dynamic Characteristics and Microscopic Tests of Soft Clay Under Yuejiang Metro Cyclic Loads; Zhejiang University: Hangzhou, China, 2019. [Google Scholar]
- He, S.; Zheng, Q.; Xia, T.; Gan, X.; Dan, H. Experimental Study on the Long-Term Dynamic Properties of Marine Soft Soil Under Metro Train Cyclic Loads Considering Time Interval Effect. J. Rock Mech. Eng. 2019, 38, 353–364. [Google Scholar]
Disclaimer/Publisher’s Note: The statements, opinions and data contained in all publications are solely those of the individual author(s) and contributor(s) and not of MDPI and/or the editor(s). MDPI and/or the editor(s) disclaim responsibility for any injury to people or property resulting from any ideas, methods, instructions or products referred to in the content. |
© 2023 by the authors. Licensee MDPI, Basel, Switzerland. This article is an open access article distributed under the terms and conditions of the Creative Commons Attribution (CC BY) license (https://creativecommons.org/licenses/by/4.0/).