
A Methodological Approach for the Smartification of a University Campus: The Smart ESI Use Case

 ,
,  ,
,  ,
,  and
and
Abstract
:1. Introduction
2. Related Works
2.1. Smart University
2.2. Smartification
2.2.1. Methodologies for Smartification
3. A Methodology for the Smartification of Universities and Campuses
3.1. Smartification Framework Description
Theory of Smartification
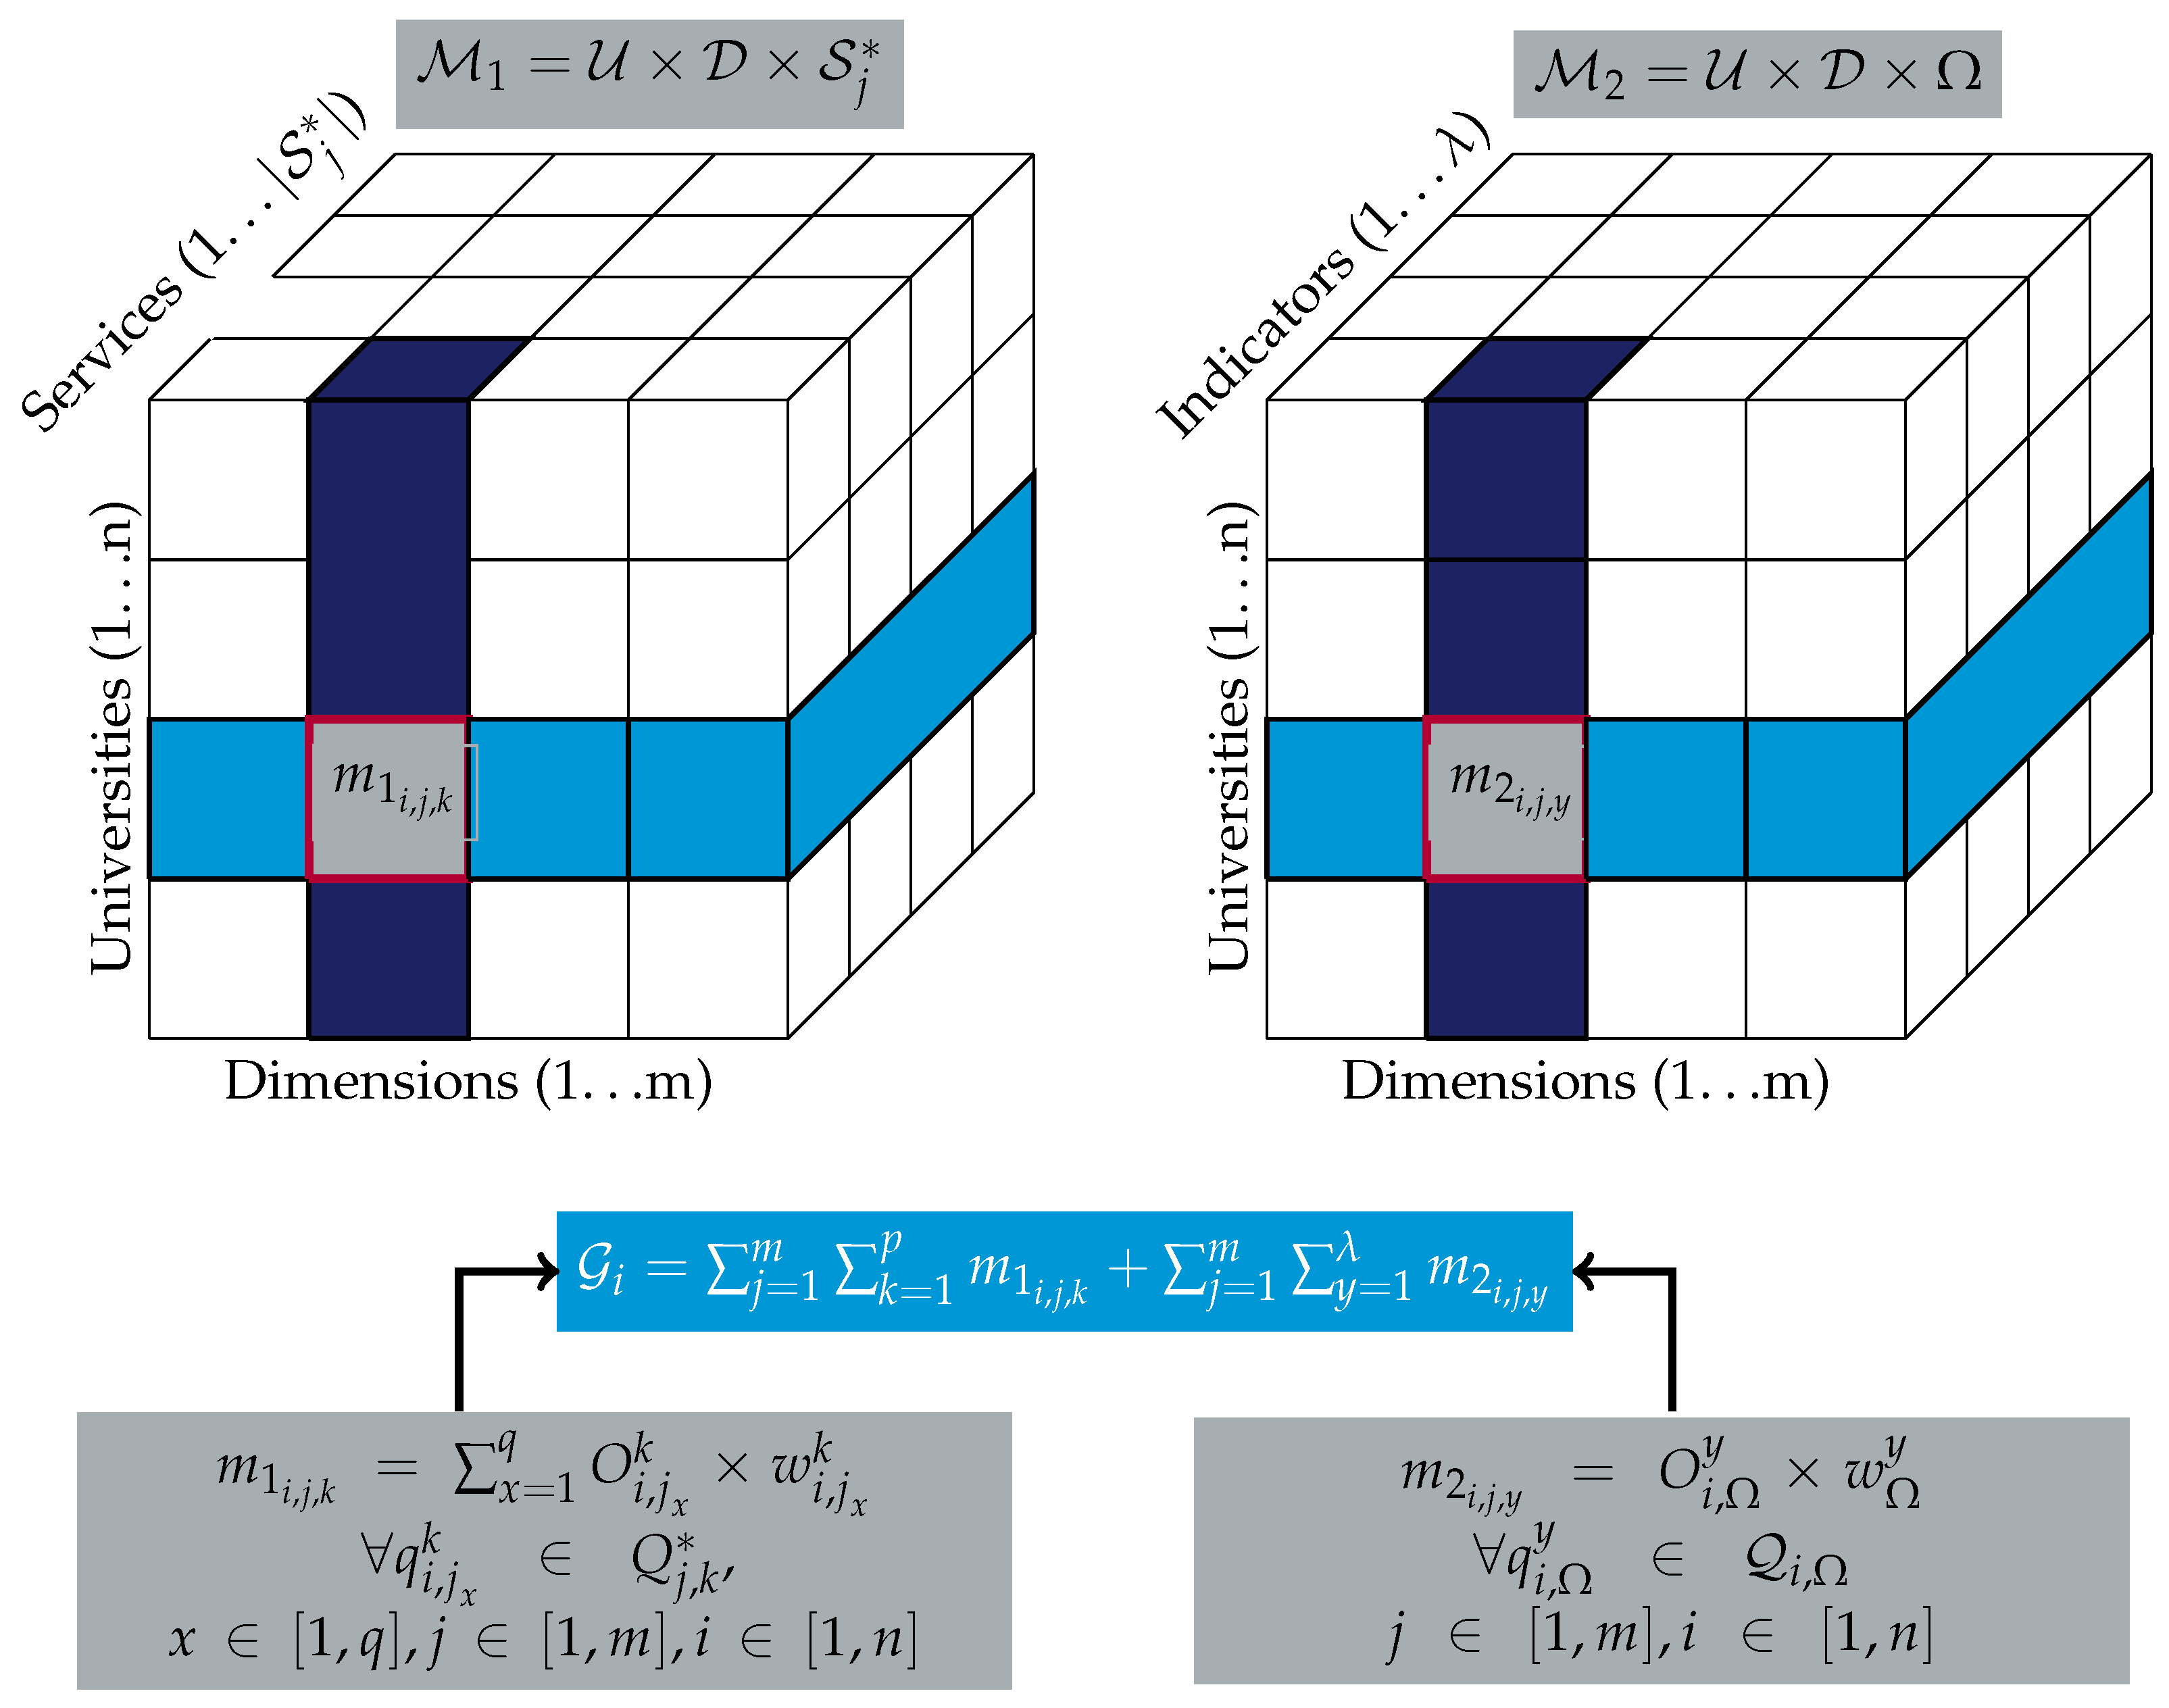
3.2. A Graphical Example
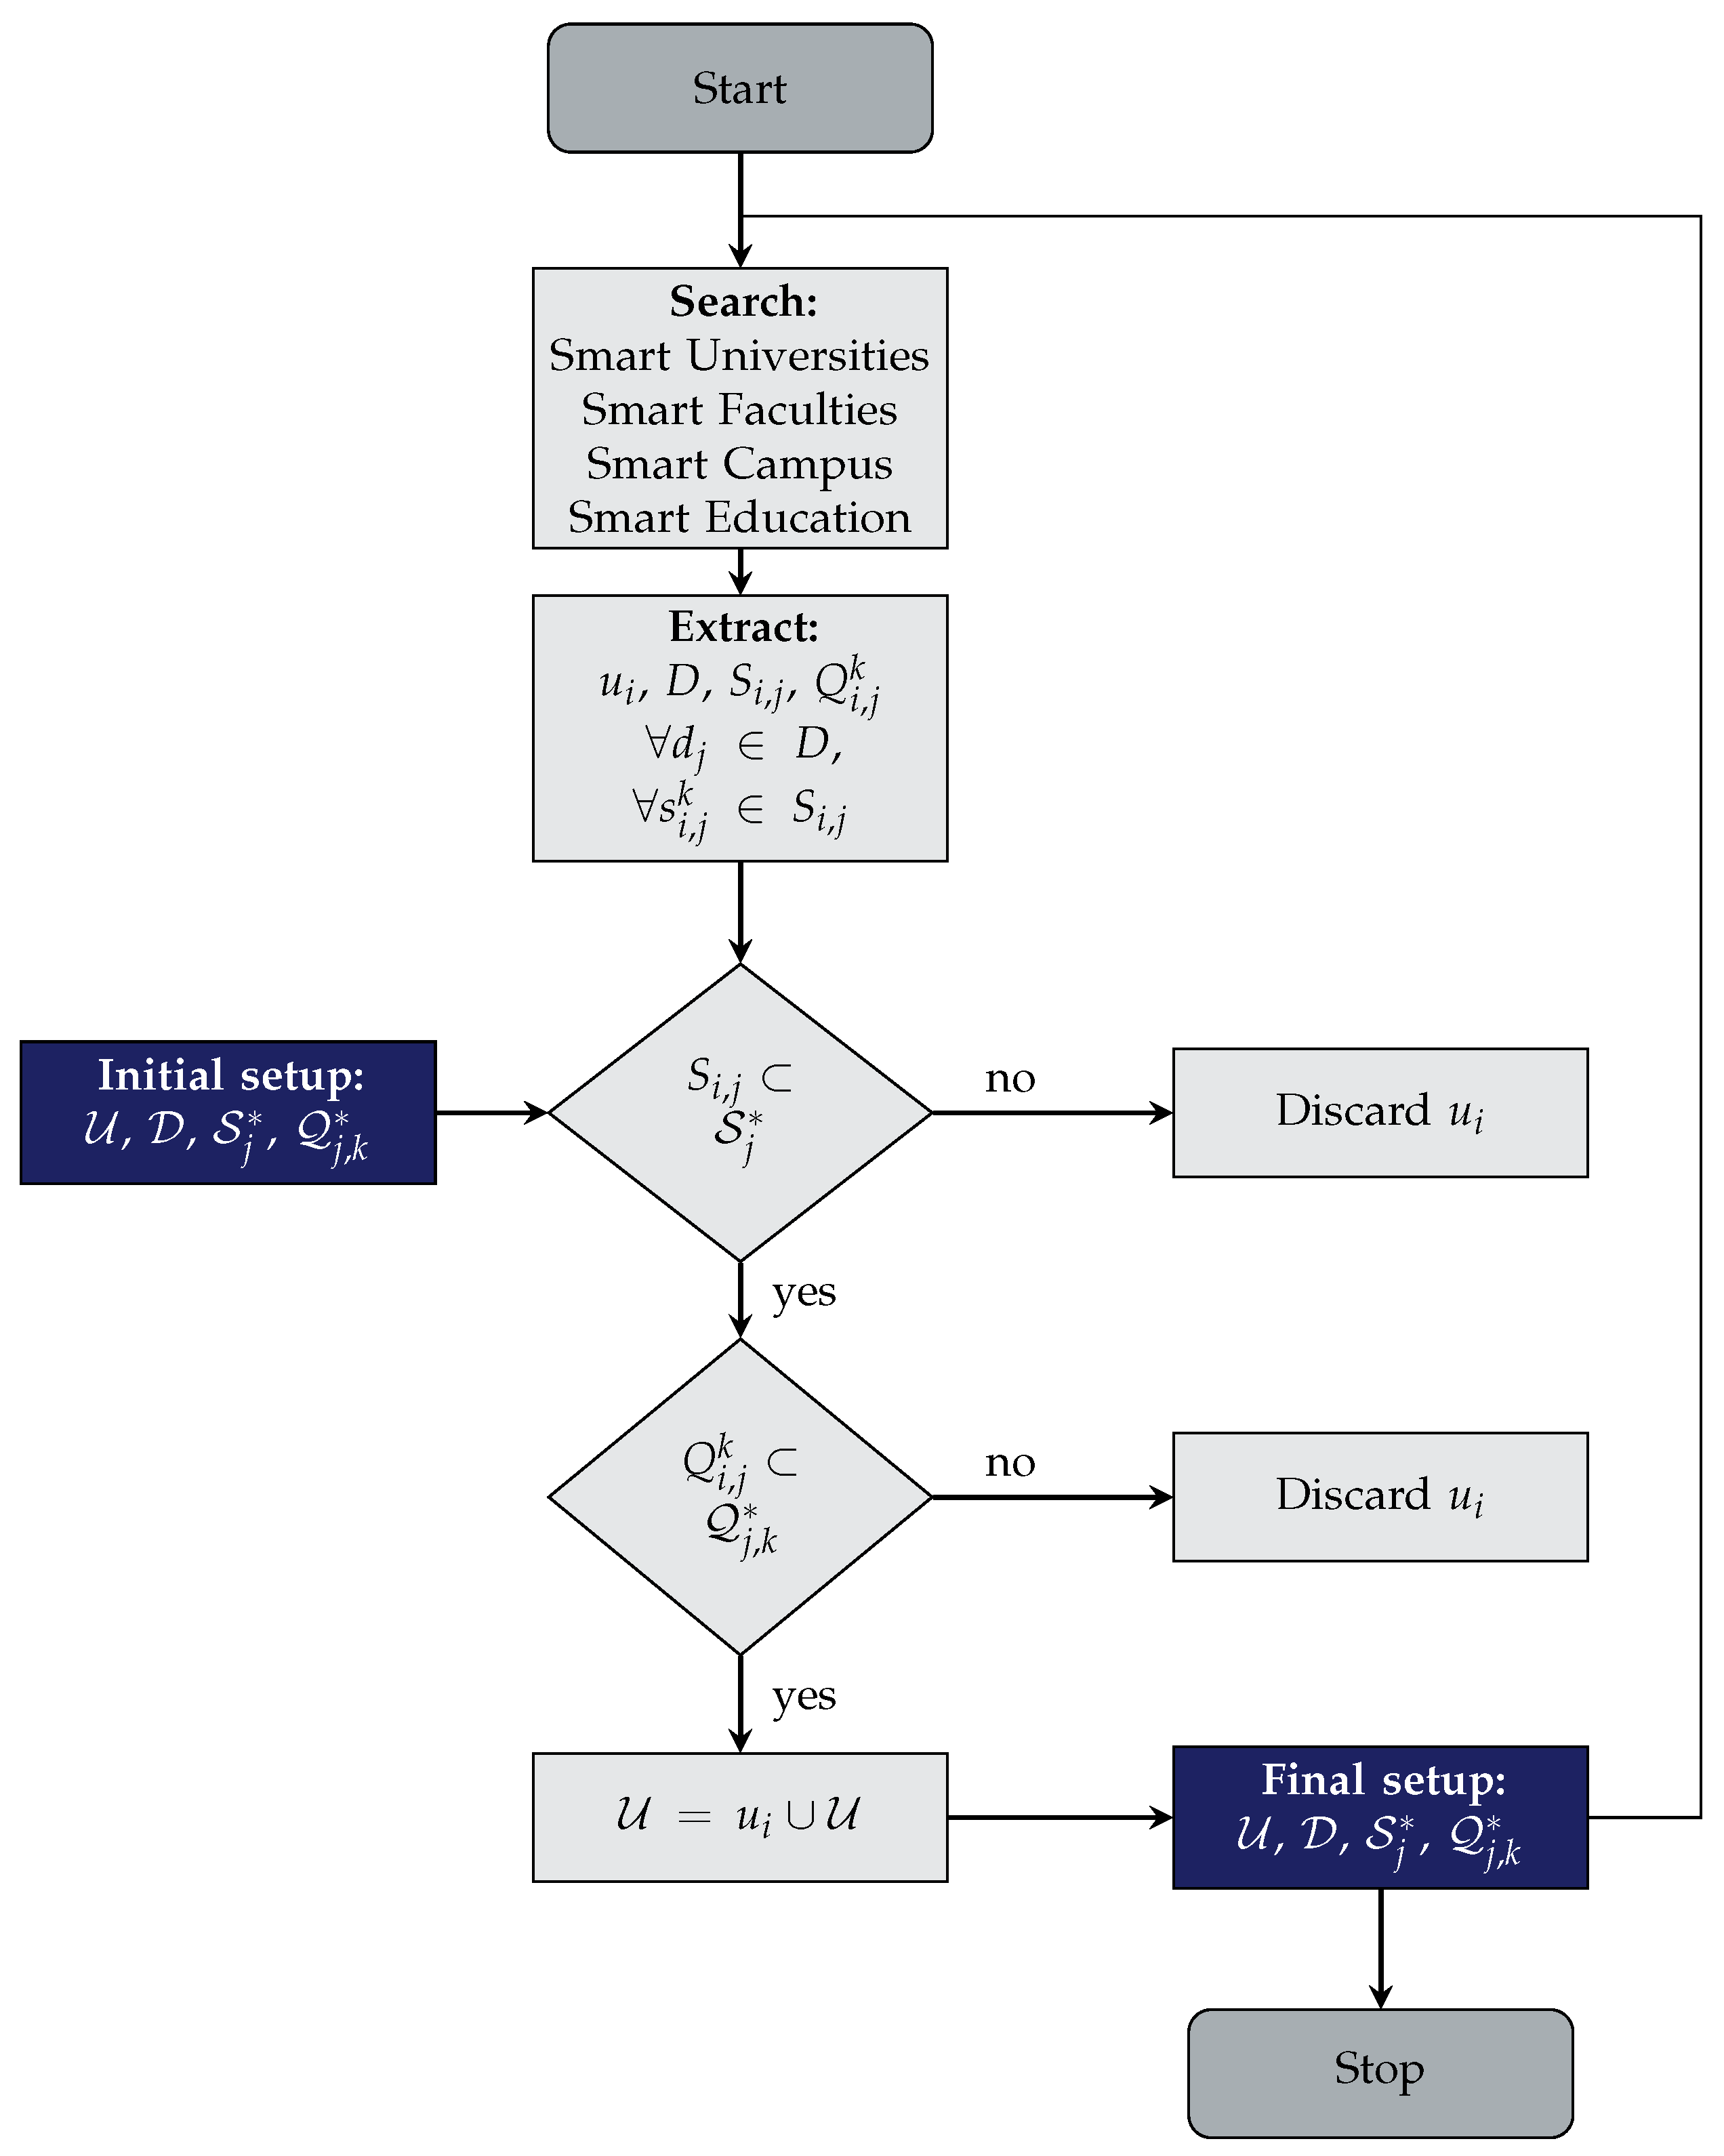
3.3. Iterative Method for Data Collection
4. Smart ESI: A New Model of School
4.1. The Context
4.2. Smart ESI: Mission, Objectives and Design Principles
- To offer the ESI, and the university community in general, an agile and flexible framework for the cohesion and demonstration of cutting-edge technologies (e.g., IoT, renewable energies, cloud computing, artificial intelligence, augmented reality or computer vision), research and innovation carried out by the different research groups.
- To provide society with a catalog of intelligent services that can be articulated via the previous framework, aimed at increasing the level of knowledge about the different elements and spaces of the school, its conditions and state, and its environment.
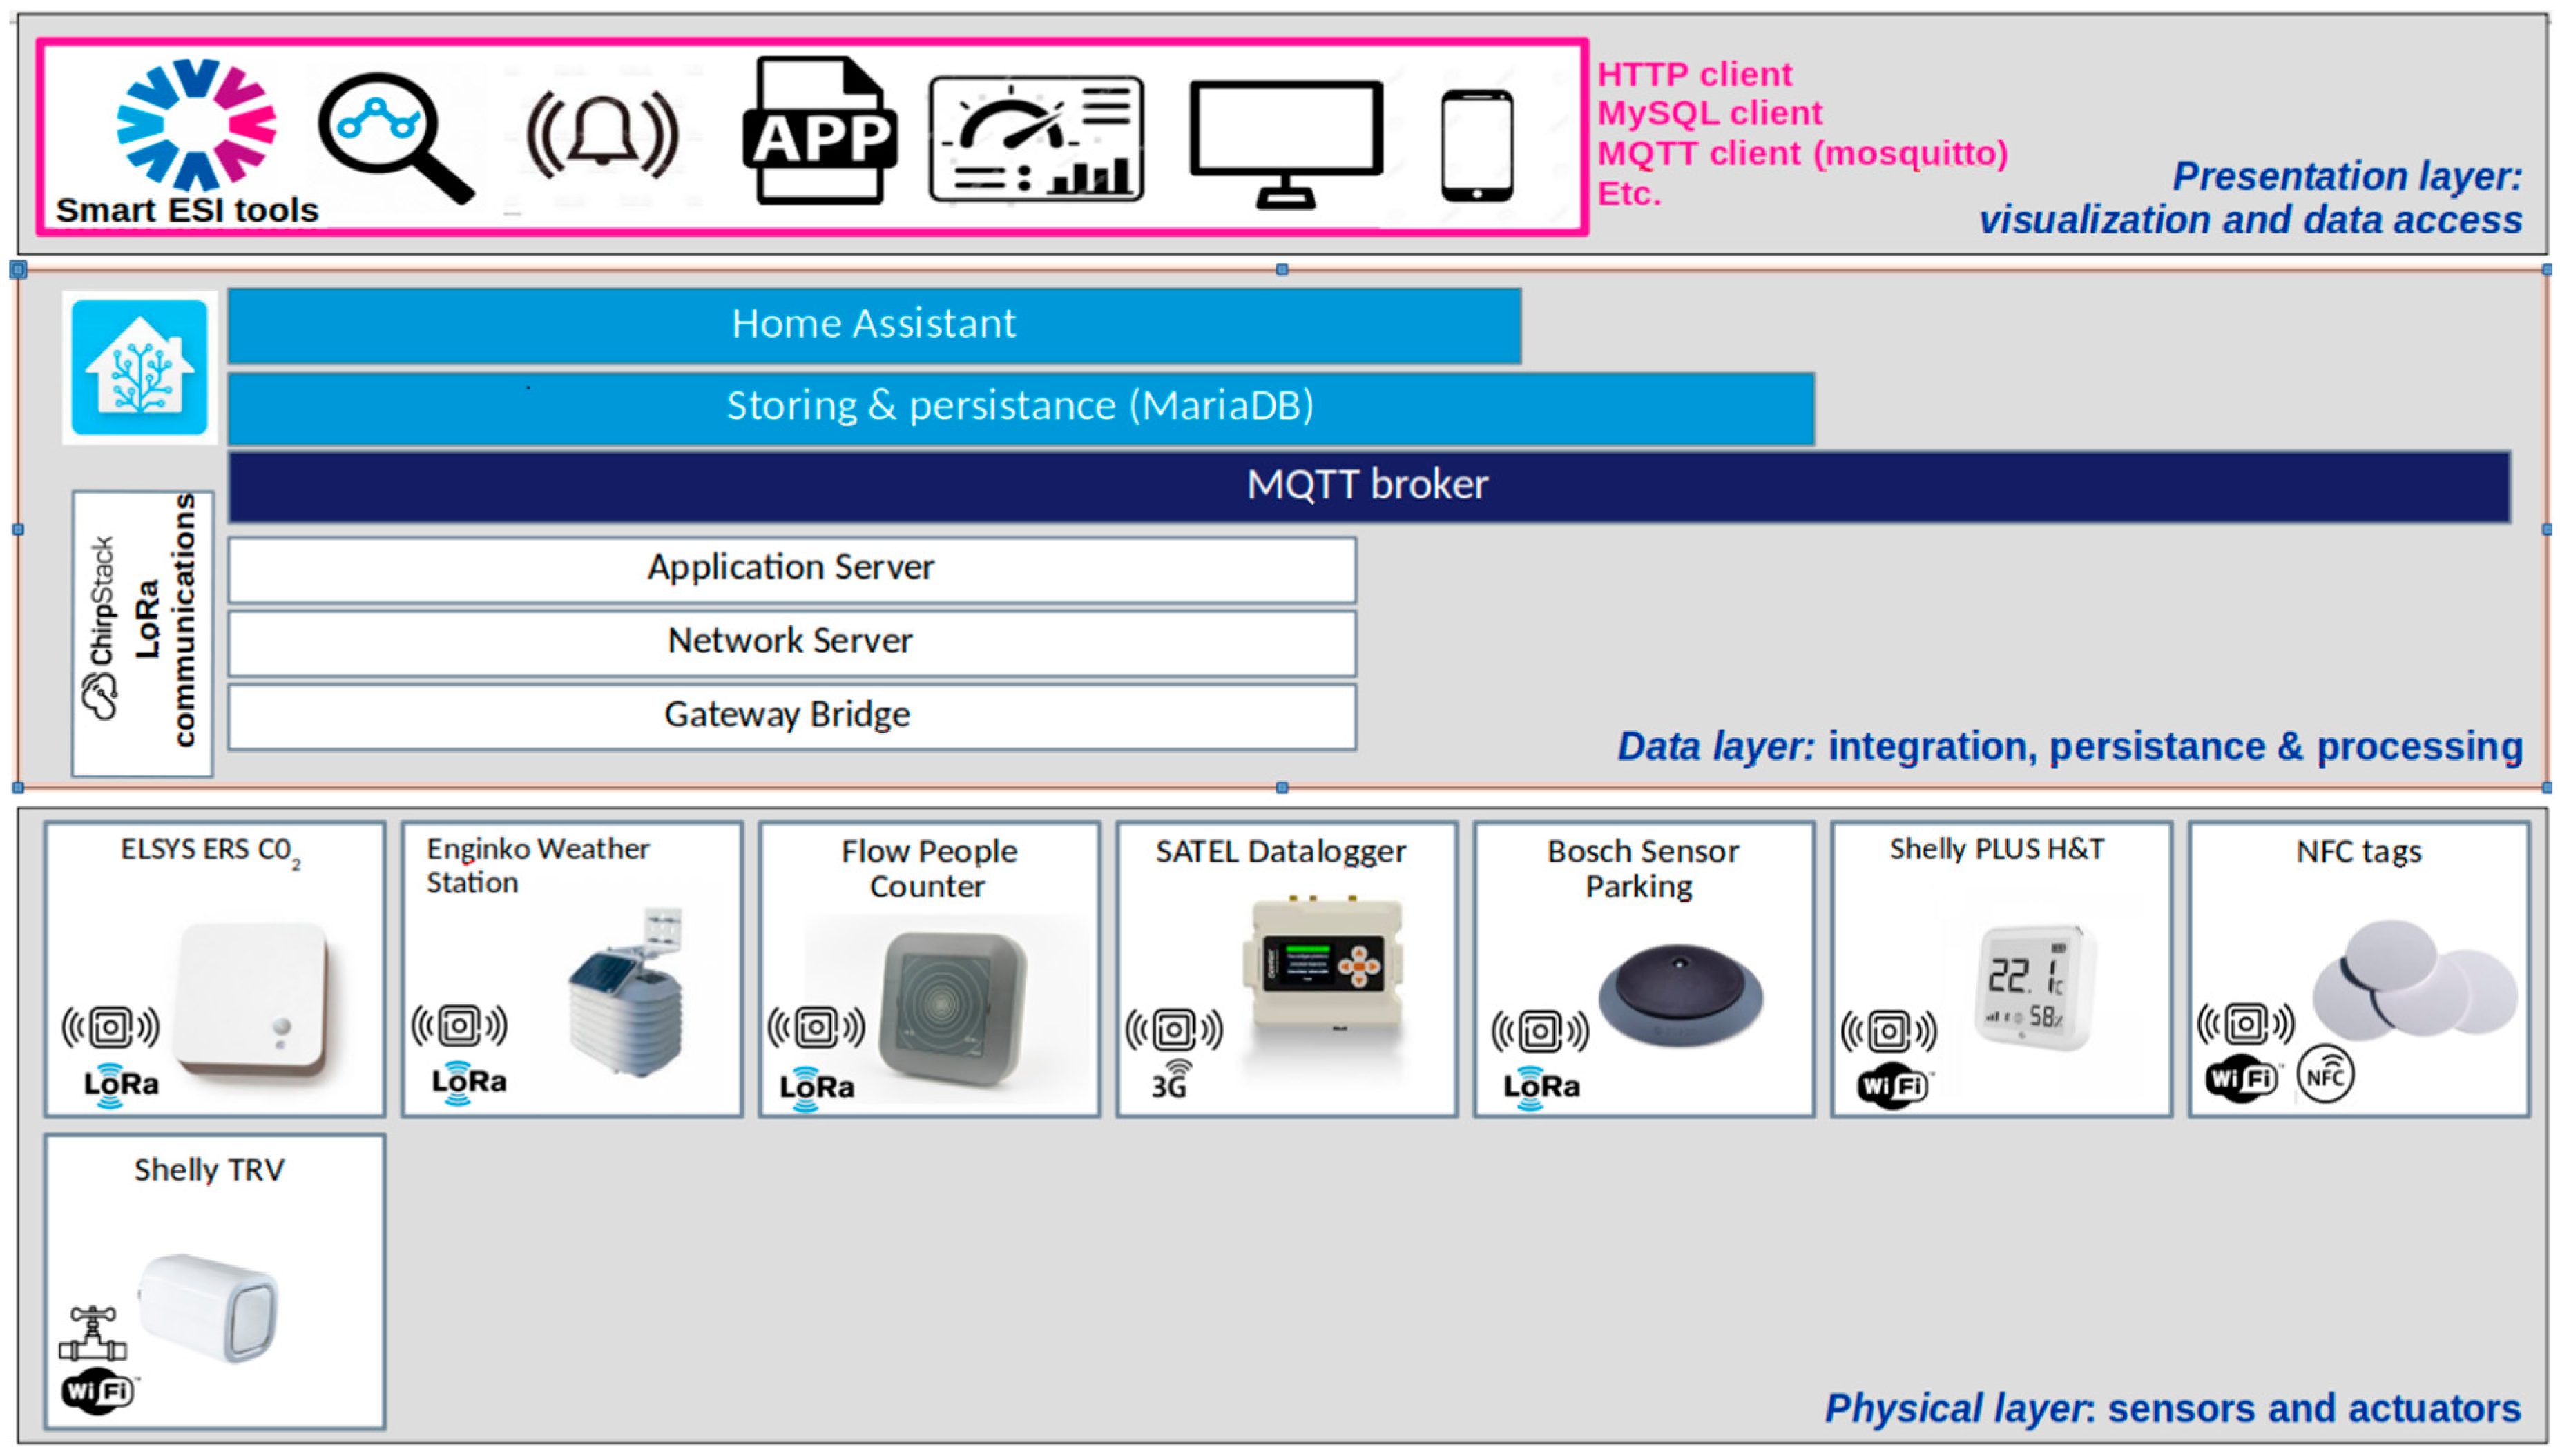
4.3. System Architecture
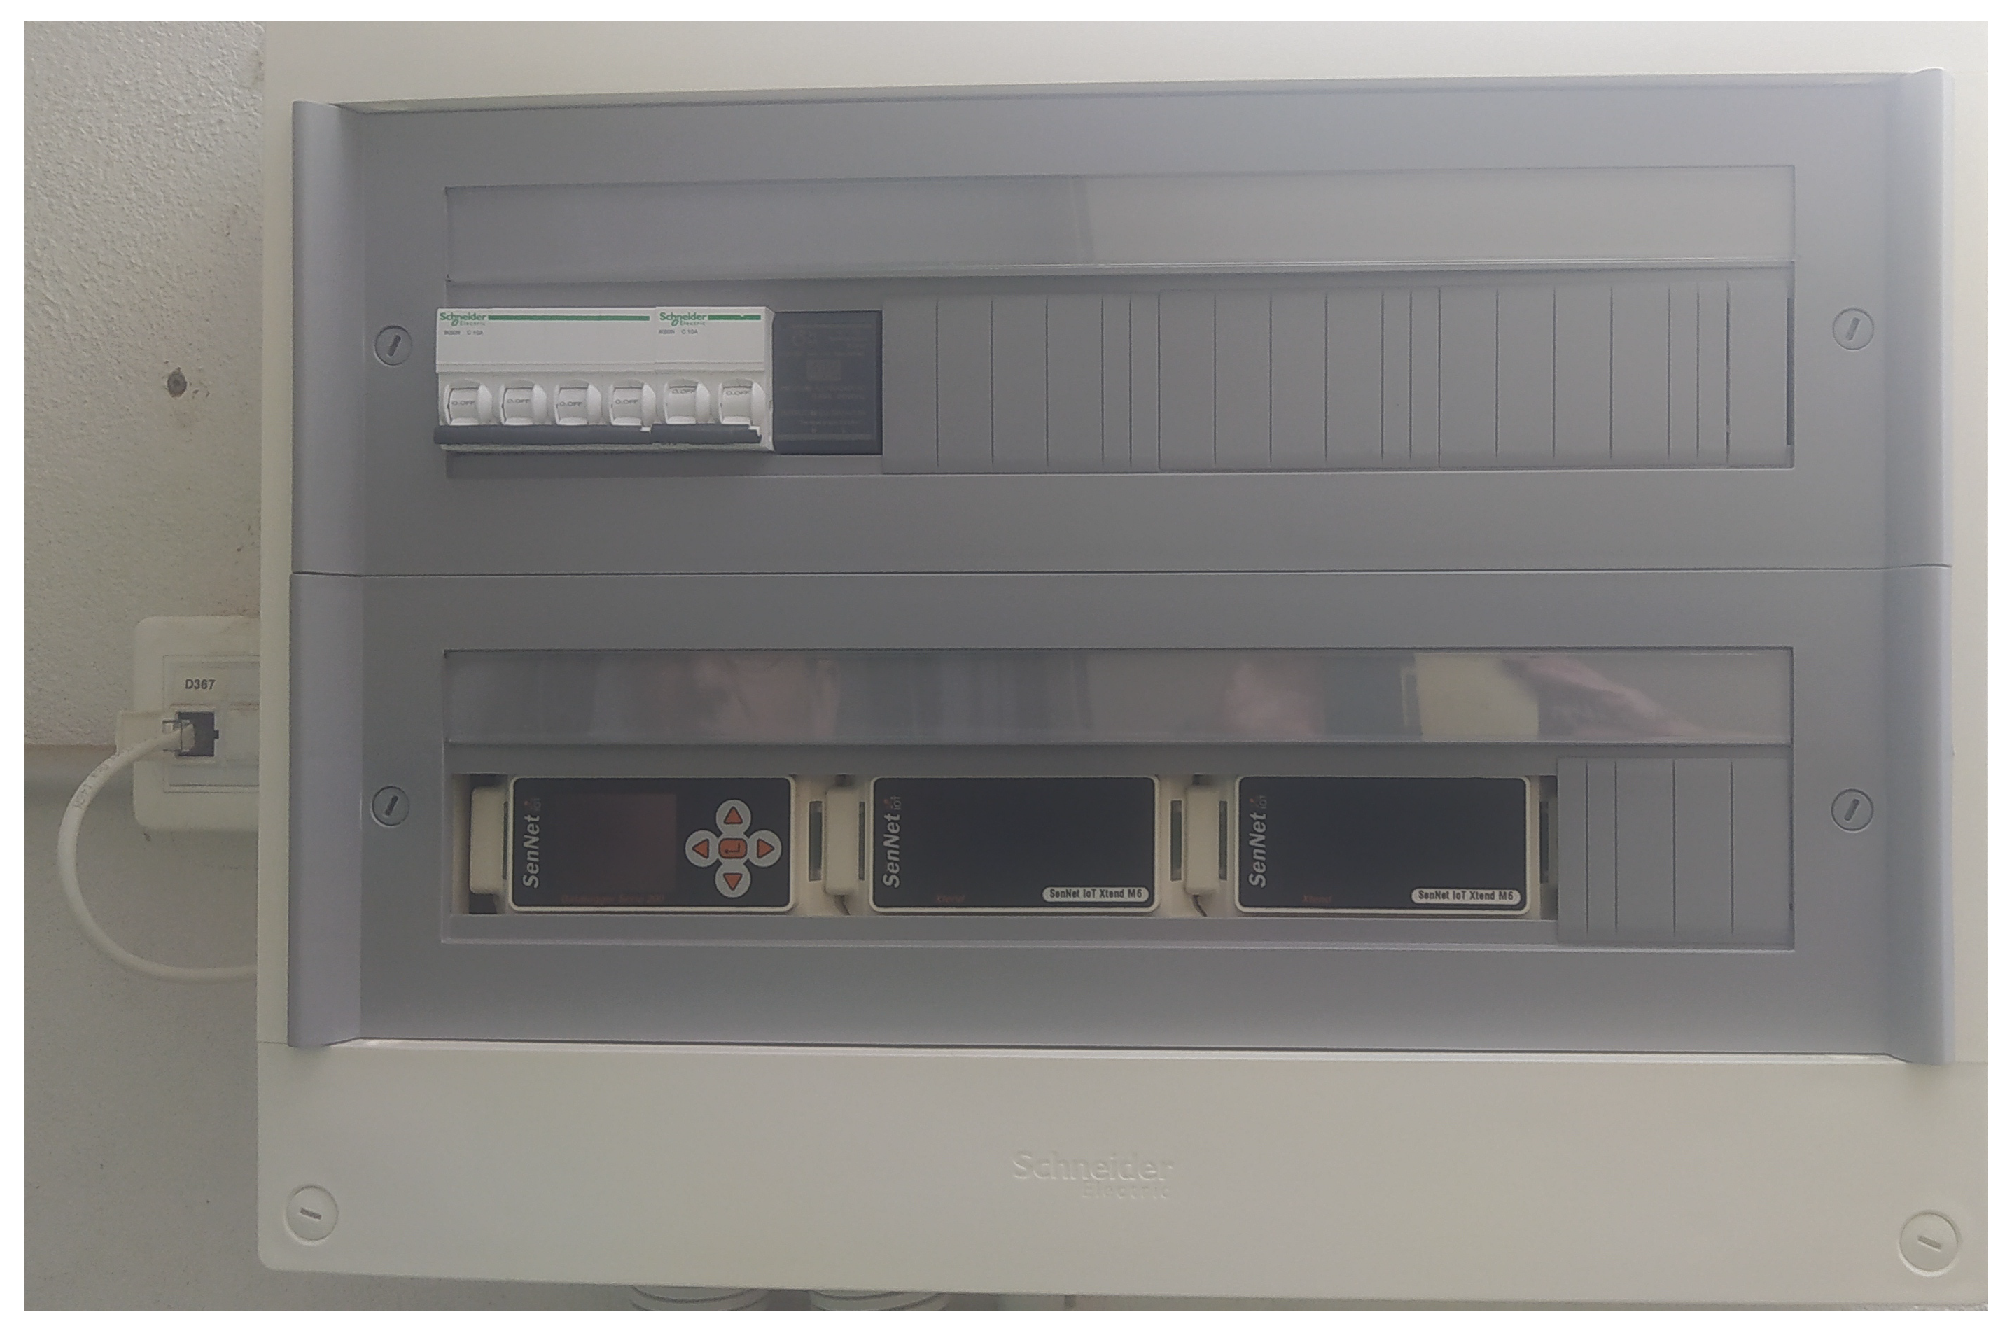
4.3.1. Physical Layer: Sensors and Actuators
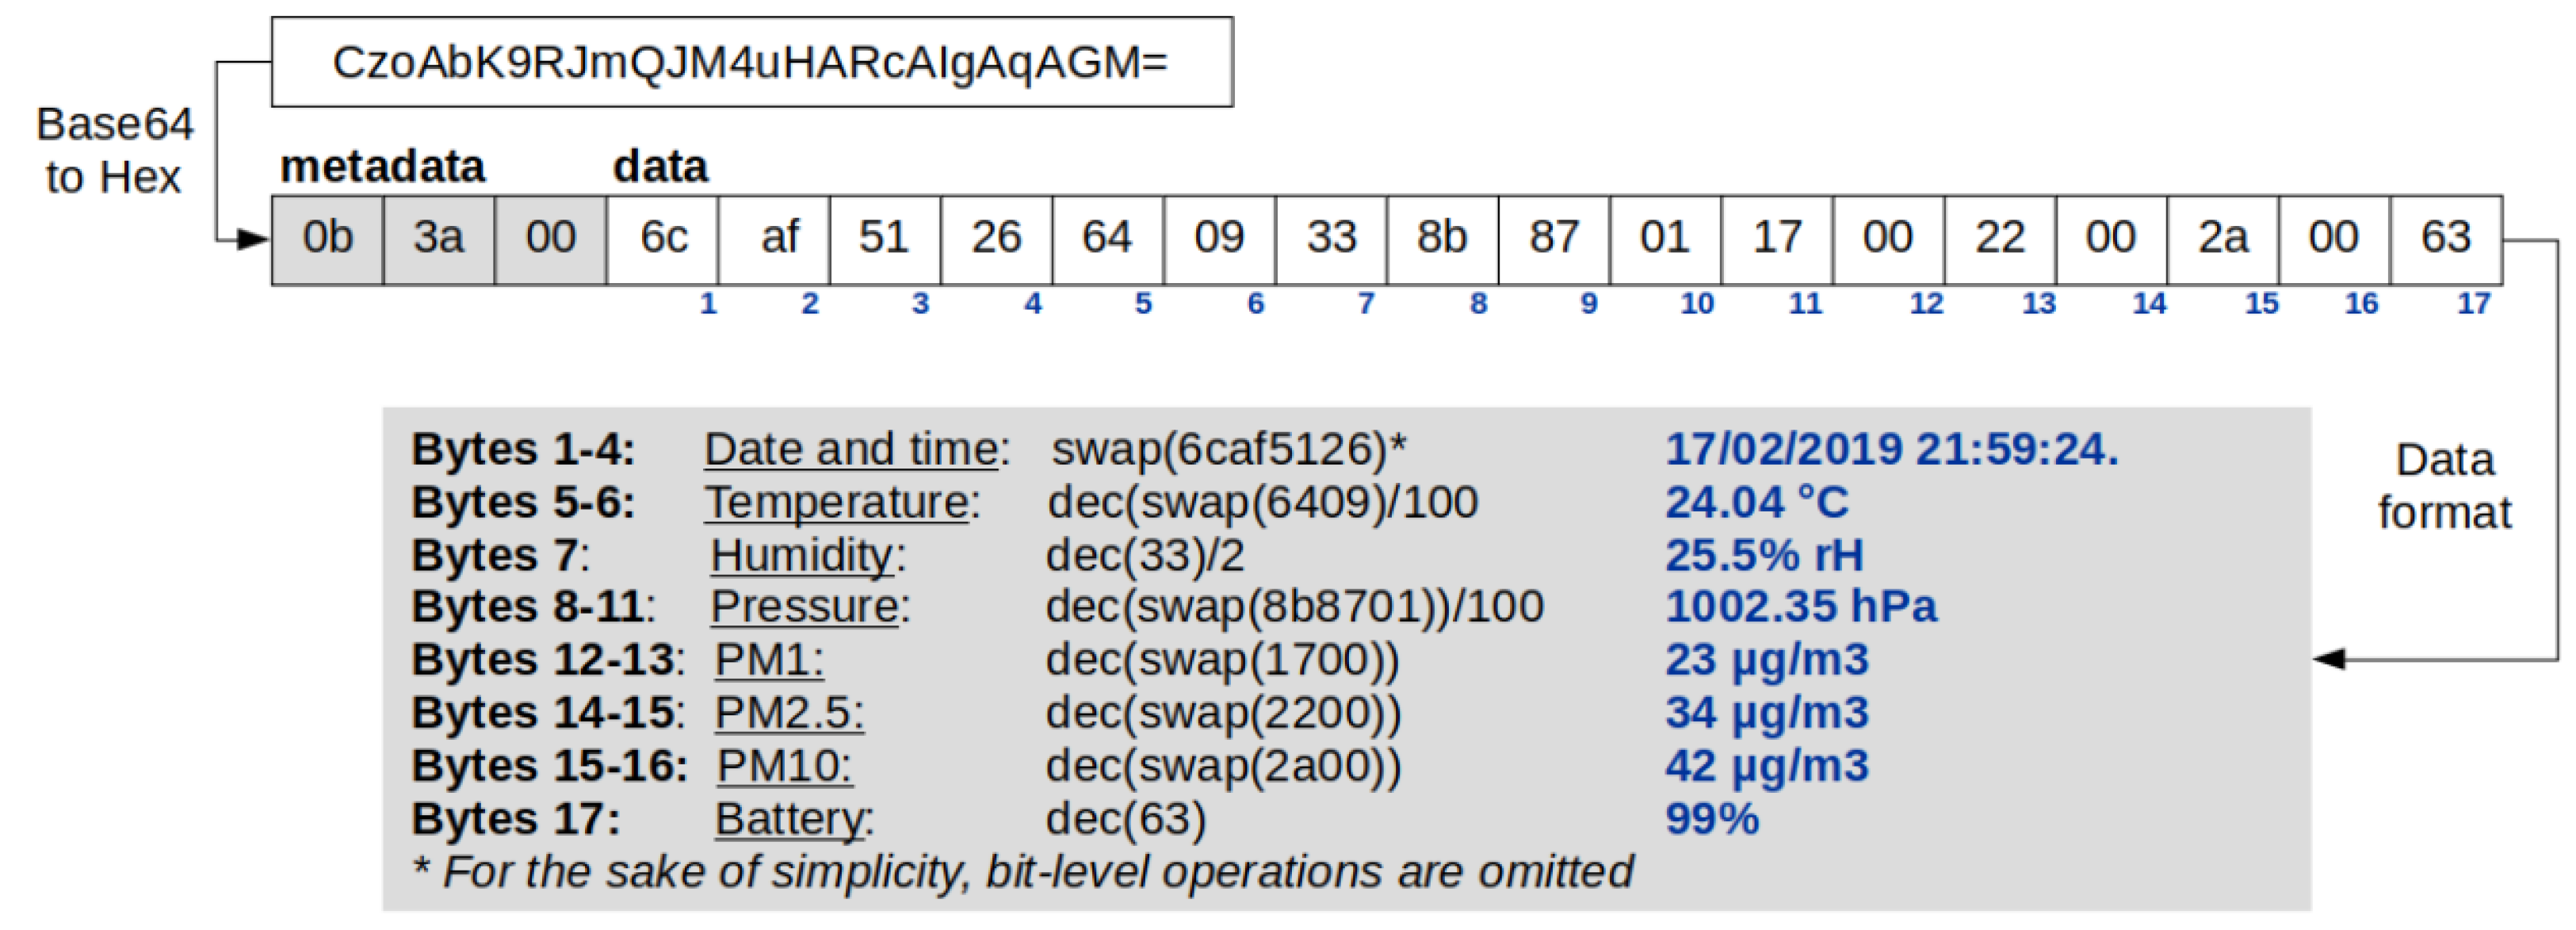
4.3.2. Data Layer: Integration, Persistence and Storing
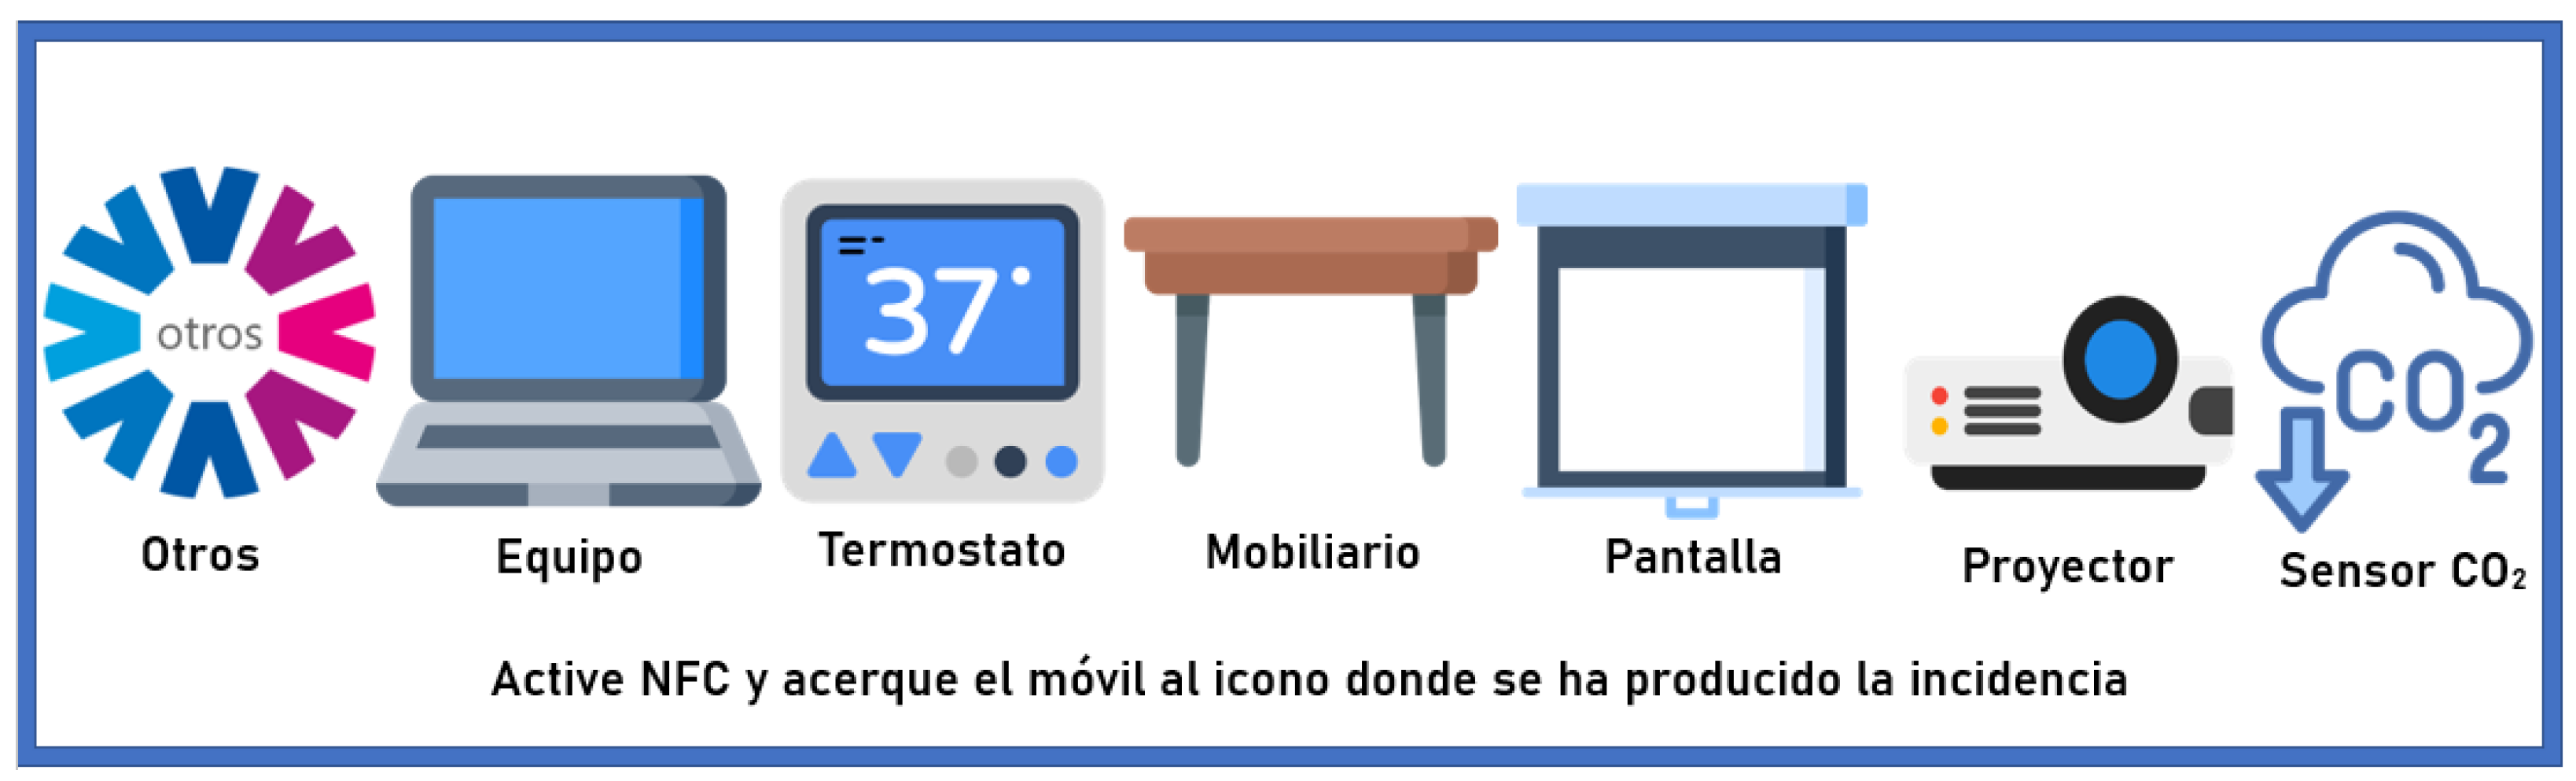
4.3.3. Presentation Layer: Visualization and Data Access
4.4. Method: Initial Setup and Computation of G
5. Discussion
Theoretical and Practical Implications for Stakeholders
6. Conclusions
Author Contributions
Funding
Data Availability Statement
Conflicts of Interest
References
- Ashton, K. That ‘Internet of Things’ Thing. RFID J. 1999, 22, 97–114. [Google Scholar]
- Escolar, S.; Villanueva, F.J.; Santofimia, M.J.; Villa, D.; del Toro, X.; López, J.C. A Multiple-Attribute Decision Making-based approach for smart city rankings design. Technol. Forecast. Soc. Chang. 2019, 142, 42–55. [Google Scholar] [CrossRef]
- Benavente-Peces, C. On the Energy Efficiency in the Next Generation of Smart Buildings—Supporting Technologies and Techniques. Energies 2019, 12, 4399. [Google Scholar] [CrossRef]
- Directive 2010/31/EU of the European Parliament and of the Council of 19 May 2010 on the Energy Performance of Buildings (Recast). 2010. Available online: https://eur-lex.europa.eu/eli/dir/2010/31/oj (accessed on 8 October 2023).
- Economidou, M.; Todeschi, V.; Bertoldi, P.; D’Agostino, D.; Zangheri, P.; Castellazzi, L. Review of 50 years of EU energy efficiency policies for buildings. Energy Build. 2020, 225, 110322. [Google Scholar] [CrossRef]
- Metallidou, C.K.; Psannis, K.E.; Egyptiadou, E.A. Energy Efficiency in Smart Buildings: IoT Approaches. IEEE Access 2020, 8, 63679–63699. [Google Scholar] [CrossRef]
- Daissaoui, A.; Boulmakoul, A.; Karim, L.; Lbath, A. IoT and Big Data Analytics for Smart Buildings: A Survey. Procedia Comput. Sci. 2020, 170, 161–168. [Google Scholar] [CrossRef]
- Schuh, G.; Zeller, V.; Hicking, J.; Bernardy, A. Introducing a methodology for smartification of products in manufacturing industry. Procedia CIRP 2019, 81, 228–233. [Google Scholar] [CrossRef]
- Luckyardi, S.; Hurriyati, R.; Disman, D.; Dirgantari, P. A Systematic Review of the IoT in Smart University: Model and Contribution. Indones. J. Sci. Technol. 2022, 7, 529–550. [Google Scholar] [CrossRef]
- Sauer, C.; Kheirkhahzadeh, A.; Roth-Berghofer, T. Data Literacy in the Smart University approach. In Proceedings of the Learning Analytics and Knowledge Conference, Edinburgh, UK, 25–29 April 2016. [Google Scholar]
- Maresca, P.; Coccoli, M.; Guercio, A.; Stanganelli, L. Smarter universities: A vision for the fast changing digital era. J. Vis. Lang. Comput. 2014, 25, 1003–1011. [Google Scholar] [CrossRef]
- Areniz-Arévalo, Y.; Barrientos-Avendaño, E. Universidad inteligente: Oportunidades y desafíos desde la Industria 4.0. Rev. Ingenio 2019, 16, 56–60. [Google Scholar] [CrossRef]
- Bargaoui, H.; Bdiwi, R. Smart classroom: Design of a gateway for ubiquitous classroom. In Proceedings of the 2014 International Conference on Web and Open Access to Learning (ICWOAL), Dubai, United Arab Emirates, 25–27 November 2014; pp. 1–4. [Google Scholar] [CrossRef]
- Kaneko, A.; Sugino, N.; Suzuki, T.; Ishijima, S. A step towards the Smart Campus: A venture project based on distance learning by a hybrid video conferencing system. In Proceedings of the SMC 2000 Conference Proceedings, 2000 IEEE International Conference on Systems, Man and Cybernetics, “Cybernetics Evolving to Systems, Humans, Organizations, and Their Complex Interactions”, Nashville, TN, USA, 8–11 October 2000; Volume 1, pp. 38–43. [Google Scholar] [CrossRef]
- Prandi, C.; Monti, L.; Ceccarini, C.; Salomoni, P. Smart Campus: Fostering the Community Awareness through an Intelligent Environment. Mob. Netw. Appl. 2020, 25, 945–952. [Google Scholar] [CrossRef]
- Fernández-Caramés, T.M.; Fraga-Lamas, P. Towards Next Generation Teaching, Learning, and Context-Aware Applications for Higher Education: A Review on Blockchain, IoT, Fog and Edge Computing Enabled Smart Campuses and Universities. Appl. Sci. 2019, 9, 4479. [Google Scholar] [CrossRef]
- Maciá Pérez, F.; Berna-Martinez, J.; Fonseca, I. Modelling and Implementing Smart Universities: An IT Conceptual Framework. Sustainability 2021, 13, 3397. [Google Scholar] [CrossRef]
- Silva-da Nóbrega, P.I.; Chim-Miki, A.F.; Castillo-Palacio, M. A Smart Campus Framework: Challenges and Opportunities for Education Based on the Sustainable Development Goals. Sustainability 2022, 14, 9640. [Google Scholar] [CrossRef]
- Min-Allah, N.; Alrashed, S. Smart campus—A sketch. Sustain. Cities Soc. 2020, 59, 102231. [Google Scholar] [CrossRef]
- Montalbán Pozas, B.; Muriel Holgado, B.; Lucas Bonilla, M.; Barroso Ramírez, S.; Bustos García de Castro, P. Iterative Optimization of a Social Inmotics-Based Method in Order to Make Buildings Smart and Resilient. Sustain. Cities Soc. 2022, 82, 103876. [Google Scholar] [CrossRef]
- Montalbán Pozas, B.; Muriel Holgado, B.; Lucas Bonilla, M. Metodología para mejorar el confort y la calidad del aire en edificios públicos con tecnología de bajo coste = Methodology to improve comfort and air quality in public buildings with low-cost technology. An. De Edif. 2021, 6, 27. [Google Scholar] [CrossRef]
- Luis-Ferreira, F.; Sarraipa, J.; Goncalves, R. Smartification of Home Appliances for Safety Assessment and Risk Alert. IFAC-PapersOnLine 2019, 52, 207–211, In Proceedings of the 13th IFAC Workshop on Intelligent Manufacturing Systems IMS 2019, Oshawa, ON, Canada, 12–14 August 2019. [Google Scholar] [CrossRef]
- Bello, O.; Zeadally, S. Toward efficient smartification of the Internet of Things (IoT) services. Future Gener. Comput. Syst. 2019, 92, 663–673. [Google Scholar] [CrossRef]
- Eisenhardt, K.M. Building Theories from Case Study Research. Acad. Manag. Rev. 1989, 14, 532–550. [Google Scholar] [CrossRef]
- Porsche Consulting. Too Smart to Use? How Increased User Involvement Is Key to Make Smart Building Concepts Thrive. 2022. Available online: https://newsroom.porsche.com/en/2022/company/porsche-consulting-too-smrt-to-use-smart-buildings-30459.html (accessed on 8 October 2023).
- Hwang, C.; Yoon, K. Multiple Attribute Decision Making: Methods and Applications—A State-of-the-Art Survey; Lecture Notes in Economics and Mathematical Systems; Springer: Berlin/Heidelberg, Germany, 1981; Volume 186. [Google Scholar] [CrossRef]
- David, B.; Chalon, R.; Yin, C. Design Methodology for “Smartification” of Cities: Principles and Case Study. In Proceedings of the 2022 IEEE 25th International Conference on Computer Supported Cooperative Work in Design (CSCWD), Hangzhou, China, 4–6 May 2022; pp. 1486–1491. [Google Scholar] [CrossRef]
- Zanakis, S.H.; Solomon, A.; Wishart, N.; Dublish, S. Multi-attribute decision making: A simulation comparison of select methods. Eur. J. Oper. Res. 1998, 107, 507–529. [Google Scholar] [CrossRef]
- Kamani, G.; Parmar, R.; Ghodasara, Y. Data Normalization in Data Mining Using Graphical User Interface a Pre-Processing Stage. Gujarat J. Ext. Educ. 2022, 30, 106–109. [Google Scholar]
- Sánchez Domínguez, A.; Barrena García, M.; García Rodríguez, P.; Montalbán Pozas, B.; Bustos García, P. SmartPolitech: Un experimento en inmótica social. In Proceedings of the XXII Jornadas de Ingeniería del Software y Base de Datos, La Laguna, Spain, 19–21 July 2017. [Google Scholar]


| Smart Dimension | Other Designation | Smart Common Services | Other Services |
|---|---|---|---|
| Learning | iLearning [9] | Personalized Learning | Safe Learning Environment |
| Educational Services [19] | Educational Assessments | Smart Education Technologies | |
| Smart Education [18] | Smart Classroom | Internet Access | |
| Library Management System | Smart Tools | ||
| Teaching Management System | Community needs awareness | ||
| Learning Management System | Results-based learning | ||
| Governance | iGovernance [9] | Financial System | Office System |
| Government [17] | Transparency | ||
| Improved Services [19] | Taxation | ||
| Smart Technology [18] | Service efficiency | ||
| Smart Governance [16] | IT tools | ||
| Risk Mitigation | |||
| Unified Information Systems | |||
| Business Processes | |||
| Internet Technologies | |||
| Data Management | |||
| Information Systems | |||
| Environment | iGreen [9] | Smart Building | Pollution |
| Environment [17] | Waste/water management | Natural resource management | |
| Microgrid [19] | Environmental protection | ||
| Smart Environm. [16,18] | Energy efficiency | ||
| Energy storage | |||
| Energy generators | |||
| IoT Enabled Loop | |||
| Renewable Energies | |||
| Electric vehicles | |||
| Biodiversity | |||
| Eco-friendly resources | |||
| Recycling | |||
| Sustainable Development Goals | |||
| People | iSocial [9] | News Management System | Market Management System |
| People [17] | Safety and Security | Citizen participation | |
| People Management [19] | Social inclusion | Sociocultural level | |
| Living [17] | Health Facilities | Cashless payment | |
| Smart Living [16,18] | Smart Attendance | ||
| Smart People [16] | People Management System | ||
| iHealth [9] | Smart appliances | ||
| Special Needs Services | |||
| Life and property security | |||
| Quality of Life | |||
| Leisure | |||
| Extracurricular activities | |||
| Smart objects | |||
| Management | iManagement [9] | People Identification | Smart Attendance |
| Smart Management [18] | Smart Parking | Safe Learning Environment | |
| Resource Management [19] | Bathroom Management System | Campus Geographic Information | |
| Smart Security [17] | Location-based services | Eco friendly Campus | |
| Sustainable management | |||
| Transparency | |||
| Participation | |||
| Process Efficiency | |||
| Disaster Prevention | |||
| Security | |||
| Biosecurity | |||
| Cybersecurity | |||
| Mobility | Smart Mobility [16,18] | Regional connectivity | Smart Logistics |
| Signaling | |||
| Smart Traffic | |||
| Economy | Economy [17] | Employability | Industry diversification |
| Smart Economy [16,18] | Local development | Eco-efficient tourism | |
| Green clusters | |||
| Support for the green economy | |||
| Tax incentives and aid | |||
| Electronic services | |||
| Entrepreneur/Innovation support | |||
| Collaborative Economy |
| Building | Floor | Classroom (C)/Labs (L)/Conference Rooms (R)/Offices (O) |
|---|---|---|
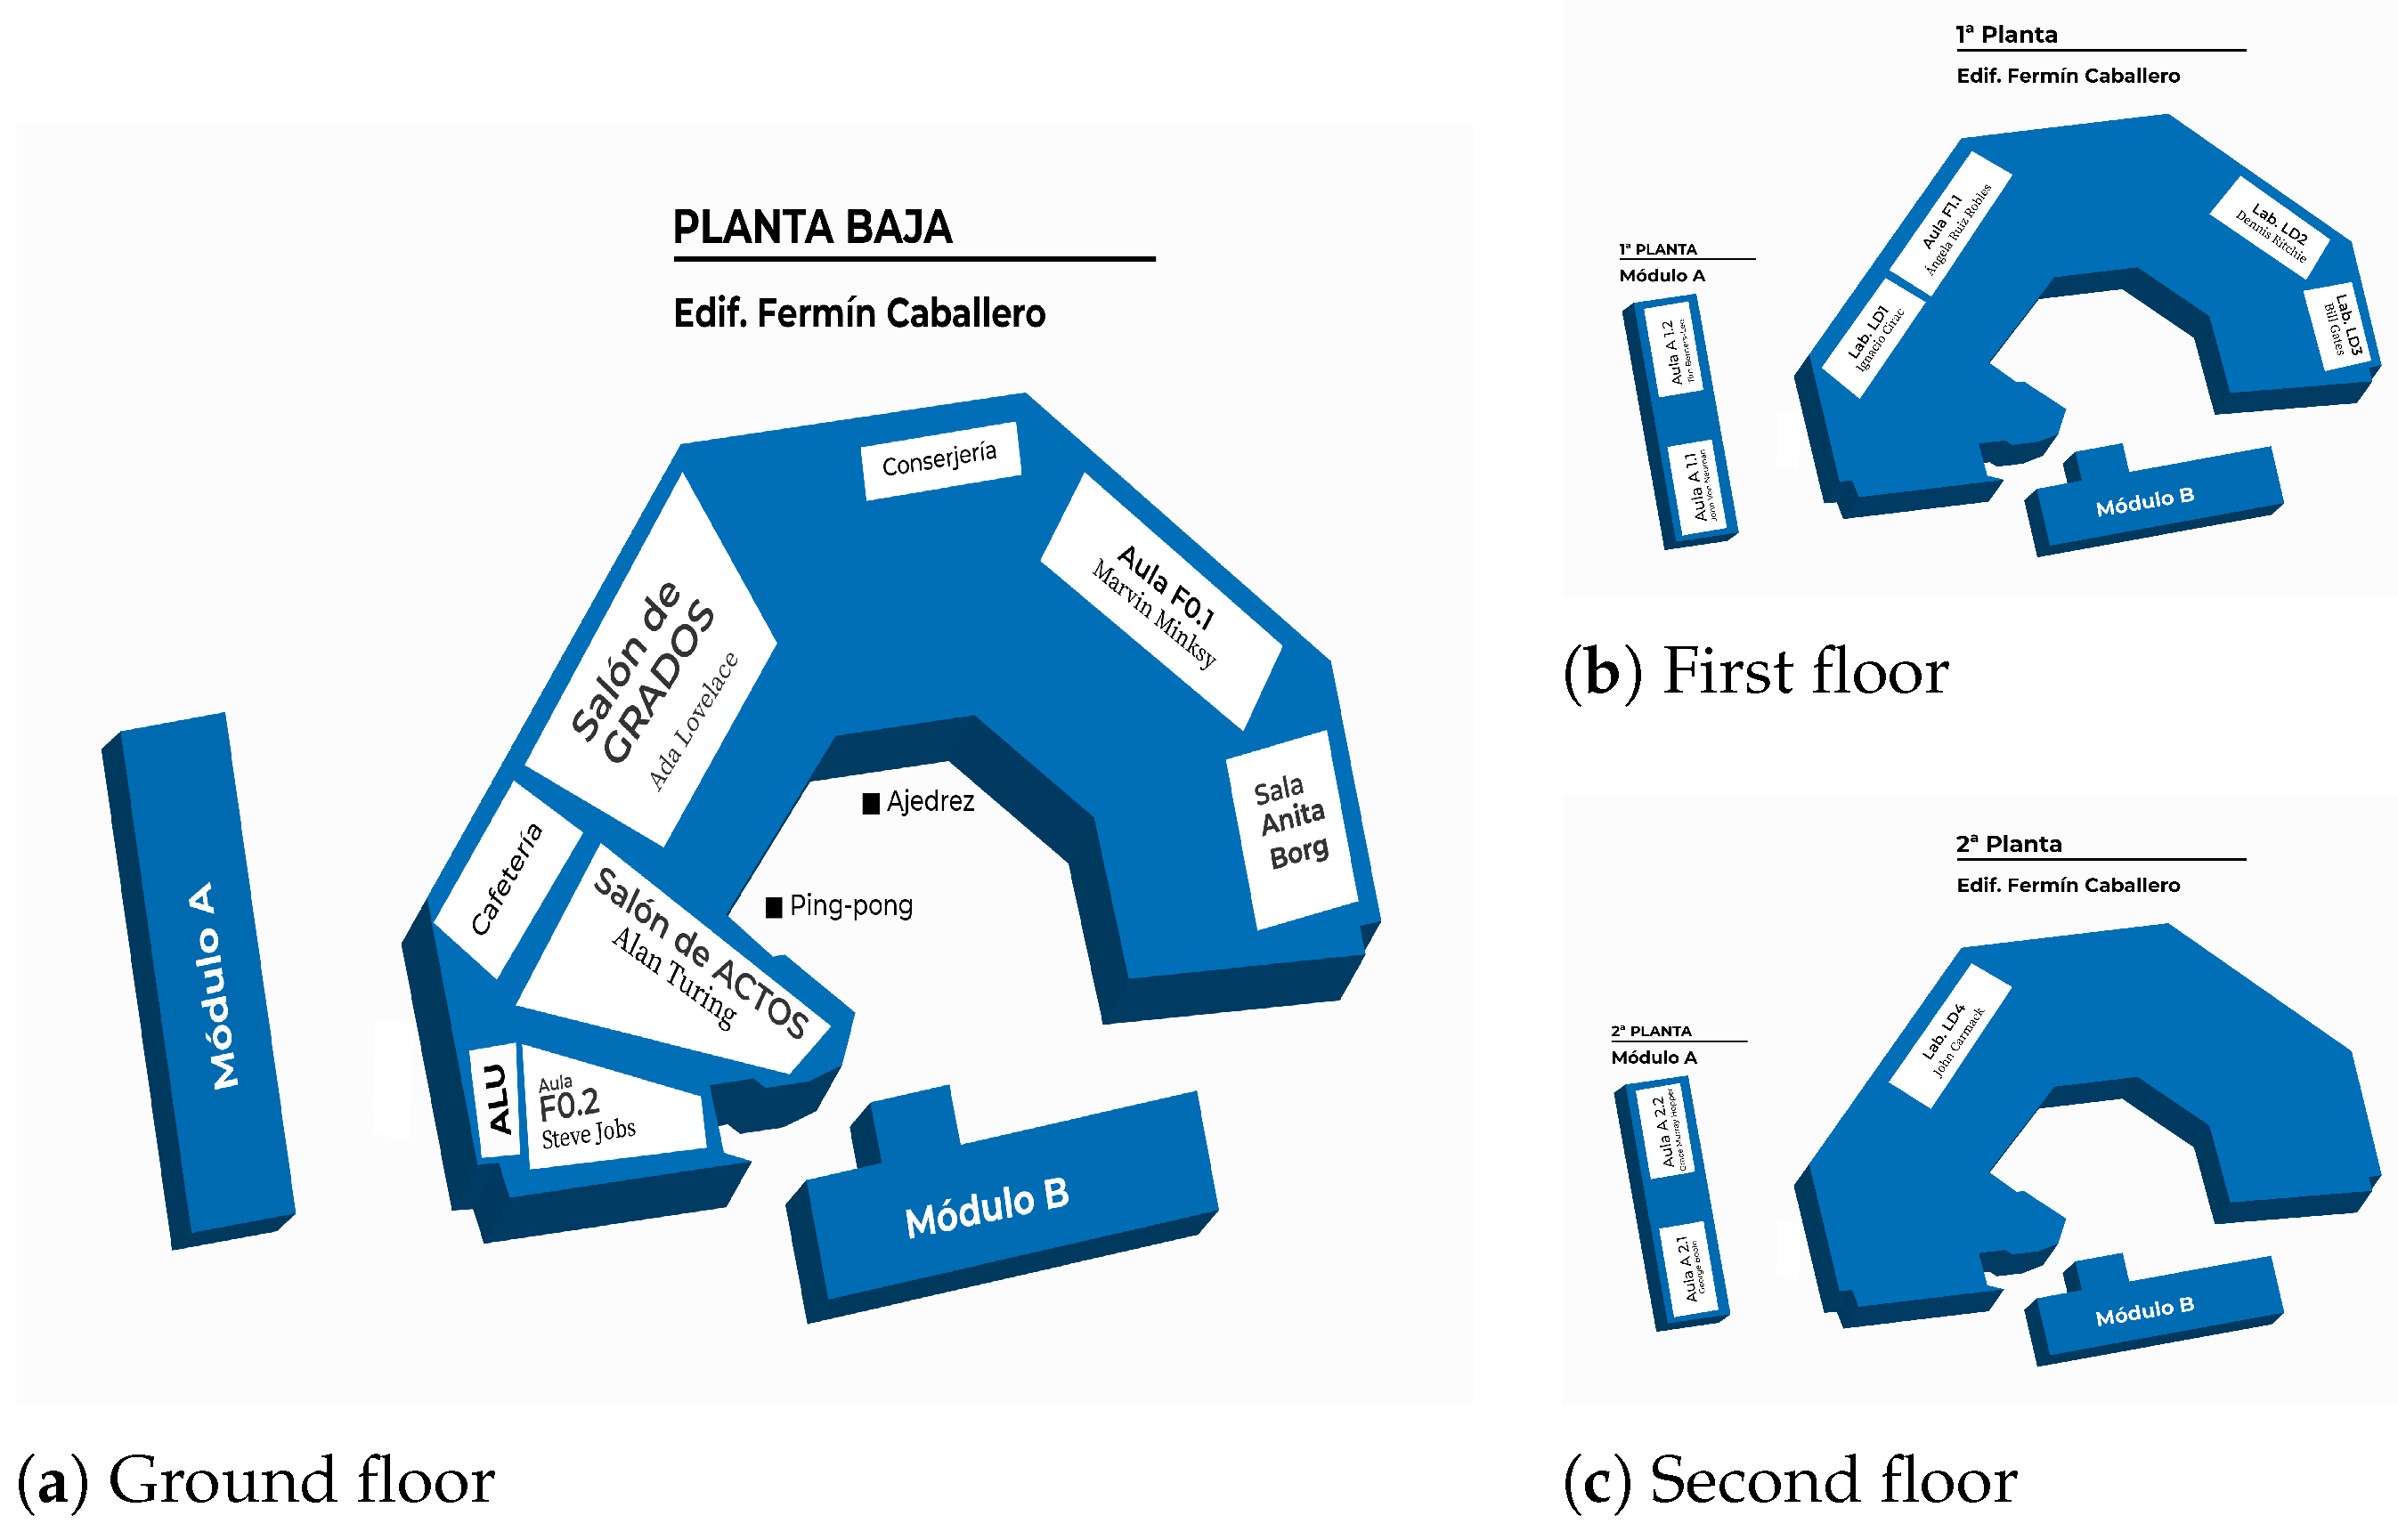
| Fermín C. | Ground | C: Marvin Minsky, Steve Jobs; R: Alan Touring, Anita Borg, Ada Lovelace; O: 3 offices |
| Fermín C. | First | C: Ángela Ruiz R.; L: Ignacio Cirac, Dennis Ritchie, Bill Gates; R: Mónico Sánchez |
| Fermín C. | Second | L: John Carmack; O: 2.01–2.20 (11 offices) |
| Fermín C. | Third | O: 3.03–3.17 (14 offices); R: Colegio Universitario |
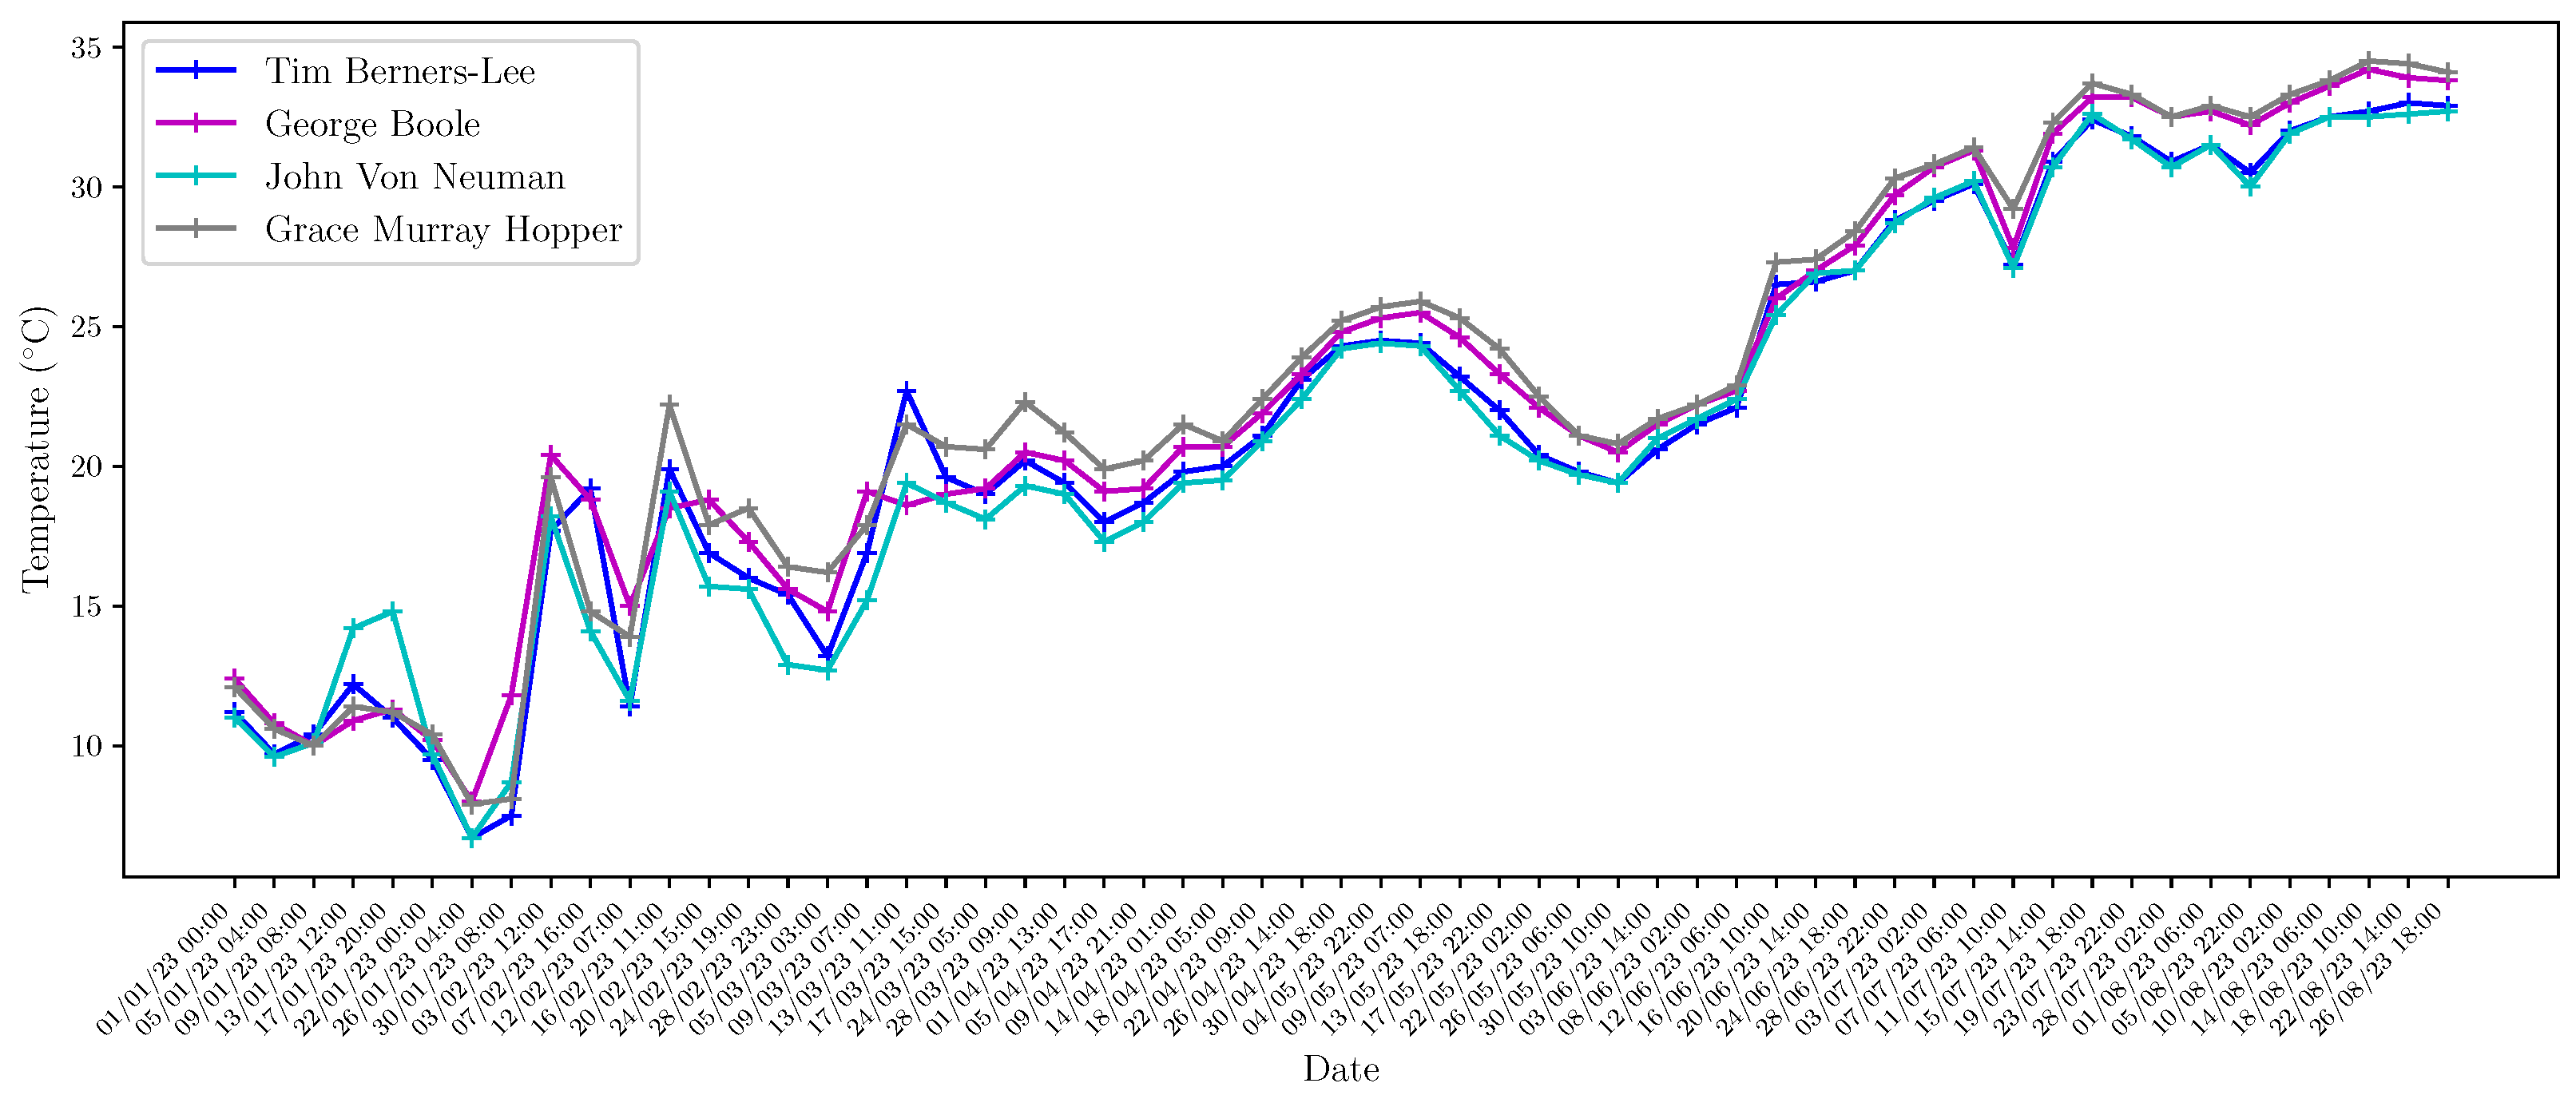
| Module B | First | C: John Von Neuman, Tim Berners-Lee |
| Module B | Second | C: George Boole, Grace Murray Hopper |
| Module A | First | O: A1.01–A1.09 (9 offices) |
| # | S/A | Model | Parameters | Net | Loc |
|---|---|---|---|---|---|
| 4 | S | Elsys ER2 | Temp., Humidity, , Light, Movement, Batt. | LoRa | B |
| 4 | S | Bosch Parking | Car occupation | LoRa | O |
| 1 | S | MCF-LW12TERPM | Temp., Humidity, Pressure, PM1, PM2.5, PM10, Batt. | LoRa | O |
| 1 | S | Parametric PCR2 | People flow counter: LTR, RTL | LoRa | F |
| 14 | S | Shelly Plus H&T | Temp., Humidity, Batt. | WiFi | F |
| 4 | A | Shelly TRV | Temp. | WiFi | F |
| 28 | S | NFC tags | Room, Alert, Object, User | NFC+WiFi | B |
| 3 | S | Satel Datalogger | Energy consumption, Power, Current, Voltage | 3G | F |
| Indicator | Description | Smart Service | |
|---|---|---|---|
| Learning | RPR | Students/Professor rate | Educational Assessments |
| LEA | Avg. no. of accesses to the learning platform | Smart Tools | |
| ONL | Online vs. total classes rate | Smart Education Technologies | |
| GRA | Avg. time to submit the Final Degree Thesis | Results-based learning | |
| MAS | Avg. time to submit the Master’s Thesis | Results-based learning | |
| TFG | Avg. number of Final Degree Thesis submissions in a year | Educational Assessments | |
| TFM | Avg. number of Master’s Thesis submissions in a year | Educational Assessments | |
| OUT | Undergraduate dropout rate | Results-based learning | |
| GRR | Graduation rate | Results-based learning | |
| Governance | ESI | Size of the ESI community (teachers, student staff) | Transparency |
| RGS | Ratio of professors to research groups | Transparency | |
| VOT | Teachers Participation rate in the last elections | Citizen participation | |
| ROO | Total vs. monitored classrooms rate | Smart Tools | |
| TRA | No. of pages in transparency website | Transparency | |
| BUD | Avg. number of participatory budget requests | Transparency | |
| PAR | Average annual number of proposed governance activities | Open government | |
| EXT | Avg. no. of people participating in extracurricular events | Extracurricular activities | |
| CUR | Avg. no. of people participating in curricular events | Curricular activities | |
| Environment | PM2 | Average daily particulate matter concentration | Pollution |
| CO2 | Avg. daily concentration | Smart Building | |
| POW | Avg. duration of power outages | Smart Building | |
| ENE | Avg. annual electricity consumption | Waste/water management | |
| WAT | Avg. annual water consumption | Waste/water management | |
| GAS | Avg. annual gas consumption | Waste/water management | |
| SUN | Avg. number of solar hours per year | Renewable Energies | |
| PRD | Avg. daily solar production per country | Renewable energies | |
| GRE | Ratio of green areas to total surface area | Natural resource management | |
| PAN | % of area covered by solar panels | Renewable Energies | |
| MAX | Monthly/yearly average of maximum daily temperatures (C) | Natural resource management | |
| MIN | Monthly/yearly average of minimum daily temperatures (C) | Natural resource management | |
| People | ENR | Average number of students enrolled/graduate course | Open government |
| FEM | % of female teachers in the ESI community | Open government | |
| FES | % of female students in the ESI community | Open government | |
| RSS | % of RRSS users in the ESI community | News Management System | |
| NAP | % of people using apps | ||
| Mgt. | PRK | Total vs. monitored parking spaces rate | Smart Parking |
| VEH | Avg. daily number of parked cars | Connectivity | |
| AGL | Avg. daily number of people | Safety and Security | |
| Mobi. | PUB | Public transport transfer rate | Local Connectivity |
| PRV | Avg. daily number of private vehicles (cars and motorcycles) | Local Connectivity | |
| BIK | Ratio of people arriving at the building on bike | Quality of Life | |
| WAL | Ratio of people arriving at the building on foot | Quality of Life | |
| Econo. | FOR | Students in paid employment | Employability |
| TFW | Employment rate | Employability | |
| COW | Percentage of coworking classrooms | Collaborative Economy | |
| SPI | Number of spinoffs | Entrepreneur support | |
| Smartness | NMA | No. of distinct magnitudes to be monitored | |
| SEN | No. of sensors deployed | ||
| ACT | No. of actuators deployed | ||
| NBR | No. of bridges/gateways | ||
| NSD | No. of smart dimensions of interest for the university | ||
| CAS | Coverage area of devices (%) | ||
| FLS | % of devices with automatic reprogramming capability | ||
| SIZ | Avg. size of data (in MB) collected per day | ||
| NOO | No. of daily observations | ||
| NCT | No. of network technologies | ||
| WIF | No. of WIFI Access Points | ||
| LOR | No. of LoRa gateways | ||
| USN | Daily avg. no. of people connected to Wi-Fi network | ||
| WFR | ESI to number of bridges ratio | ||
| INT | % of devices that are able to communicate with others | ||
| PSI | % of devices implementing semantic compatibility | ||
| ALM | Alarms management (Yes/No) | ||
| RTM | Real-time support for decision making process (Yes/No) | ||
| DAT | Data analytics (e.g., Big Data, data mining) (Yes/No) | ||
| NOP | No. of nodes in the smart university platform | ||
| SEC | Security mechanisms (Yes/No) | ||
| WIU | Writing interface for users (Yes/No) | ||
| RIU | Reading interface for users (Yes/No) | ||
| API | SDK availability to write applications (e.g., Yes/No) | ||
| APP | No. of apps developed related to the smart university | ||
| APU | Avg. percentage of use of smart applications | ||
| DAC | No. of data access APIs | ||
| OPE | Number of open data sets | ||
| WEB | No. of web page views | ||
| NSN | No. of social networks for the ESI community | ||
| NST | No. of standards related to smart domains | ||
| KPI | No. of known metrics to determine the progress achieved | ||
| AVK | Avg. percentage of improvement achieved by KPI | ||
| No. | Indicator | , | , | Observations |
|---|---|---|---|---|
| 1 | RPR | 8.89 | 0.889 | Students: 693; Professor: 78 1 |
| 2 | LEA | 2,267,704.75 | 0.226 | Own Elaboration 1 |
| 3 | ONL | 0 | 0.000 | |
| 4 | GRA | NA | 0.000 | |
| 5 | MAS | NA | 0.000 | |
| 6 | TFG | 77.5 | 0.775 | Data obtained since 2017/2018, Portal de Transparencia: 2 |
| 7 | TFM | 10.75 | 0.107 | Data obtained since 2017/2018 2 |
| 8 | OUT | 35 | −0.350 | Own Elaboration 2 R.D.861/2010: 3 |
| 9 | GRR | 31.265 | 0.313 | Own Elaboration 23 |
| 10 | ESI | 779.2 | 0.779 | |
| 11 | RGS | 5.57 | 0.557 | Research groups: 14 2 |
| 12 | VOT | 0.150 | 0.150 | Votes cast: 111; Census: 754; Elecciones al rector 4 |
| 13 | ROO | 0.810 | 0.810 | Total classrooms: 21; Sensed classrooms: 17, Infraestructuras 2 |
| 14 | TRA | 3 | 0.300 | Enrollees, graduates and internships 2 |
| 15 | BUD | 4 | 0.400 | Open gobernance 2 |
| 16 | PAR | 12 | 0.12 | |
| 17 | EXT | 20 | 0.20 | |
| 18 | CUR | 40 | 0.40 | |
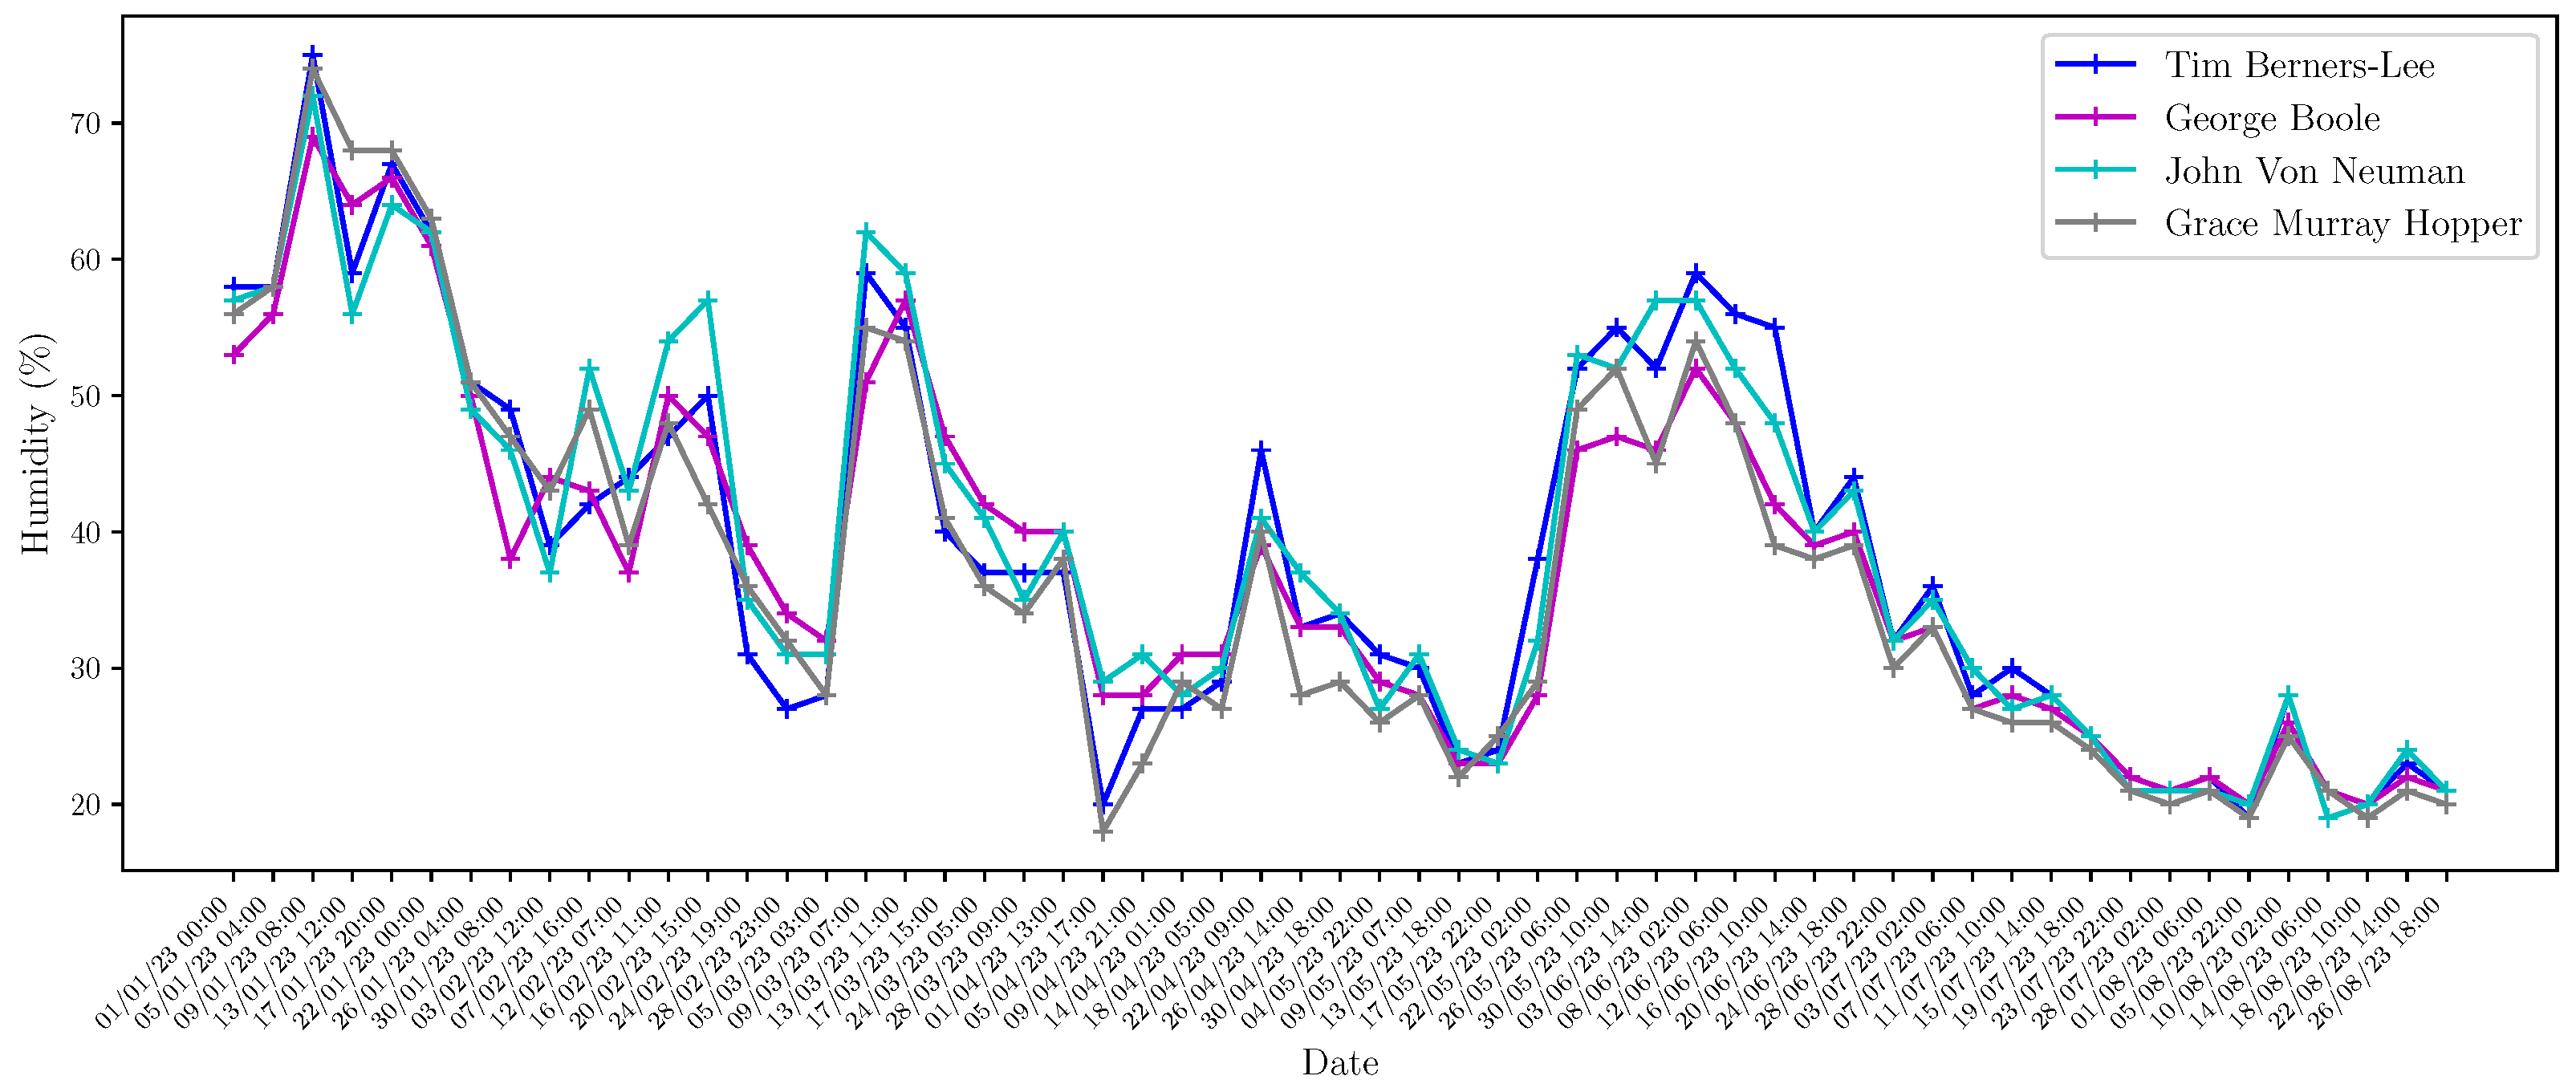
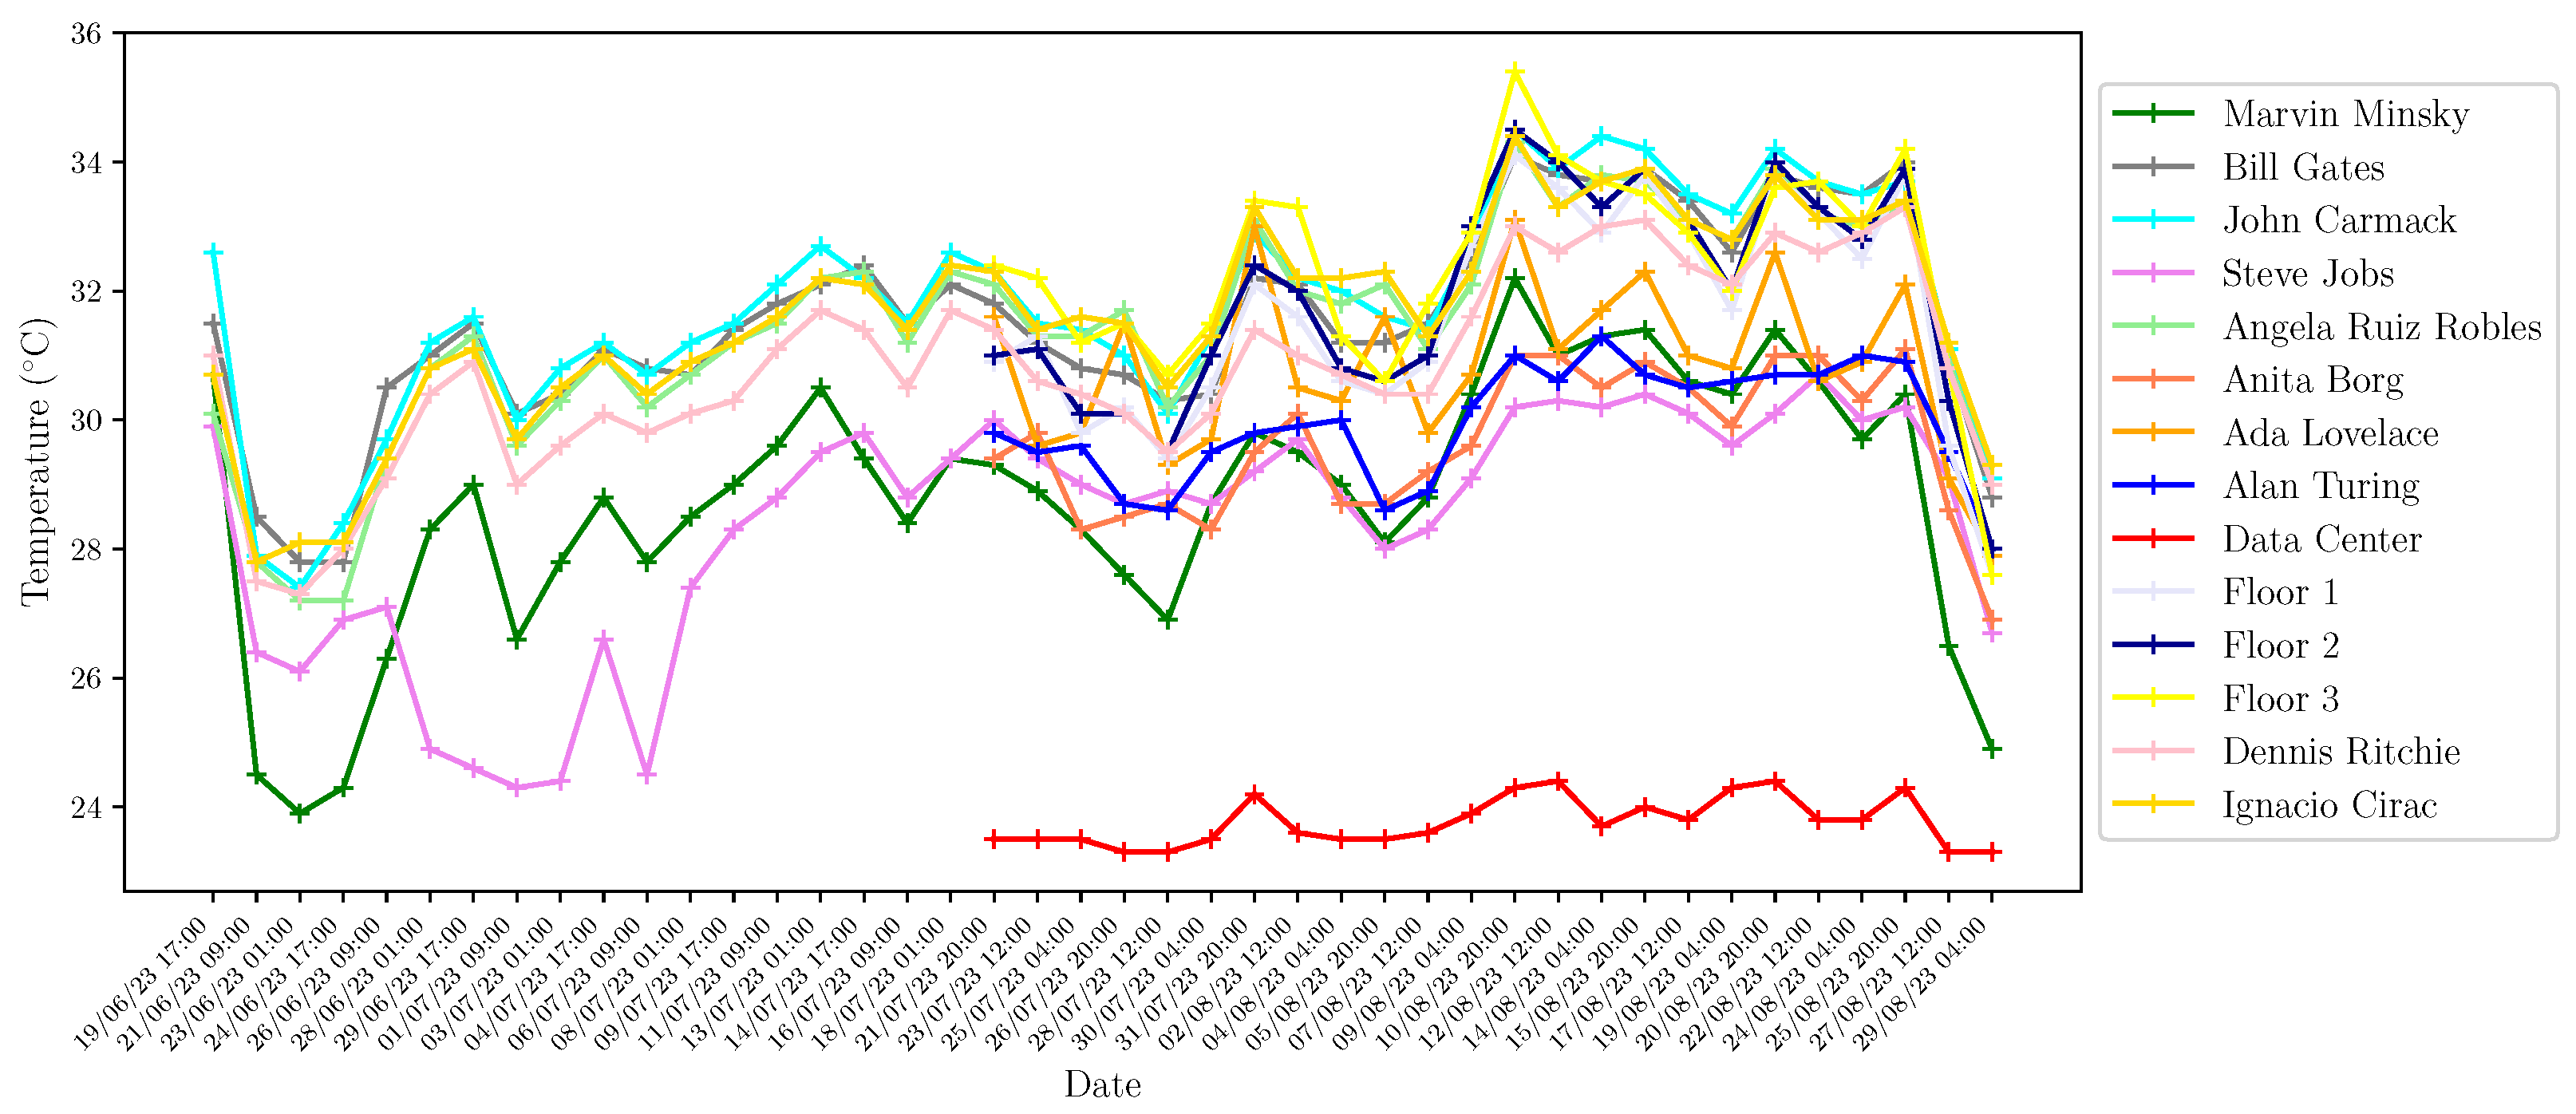
| 19 | PM2 | 33.22 | −0.332 | PM1 obtained since 01/01/23 to 29/9/23 |
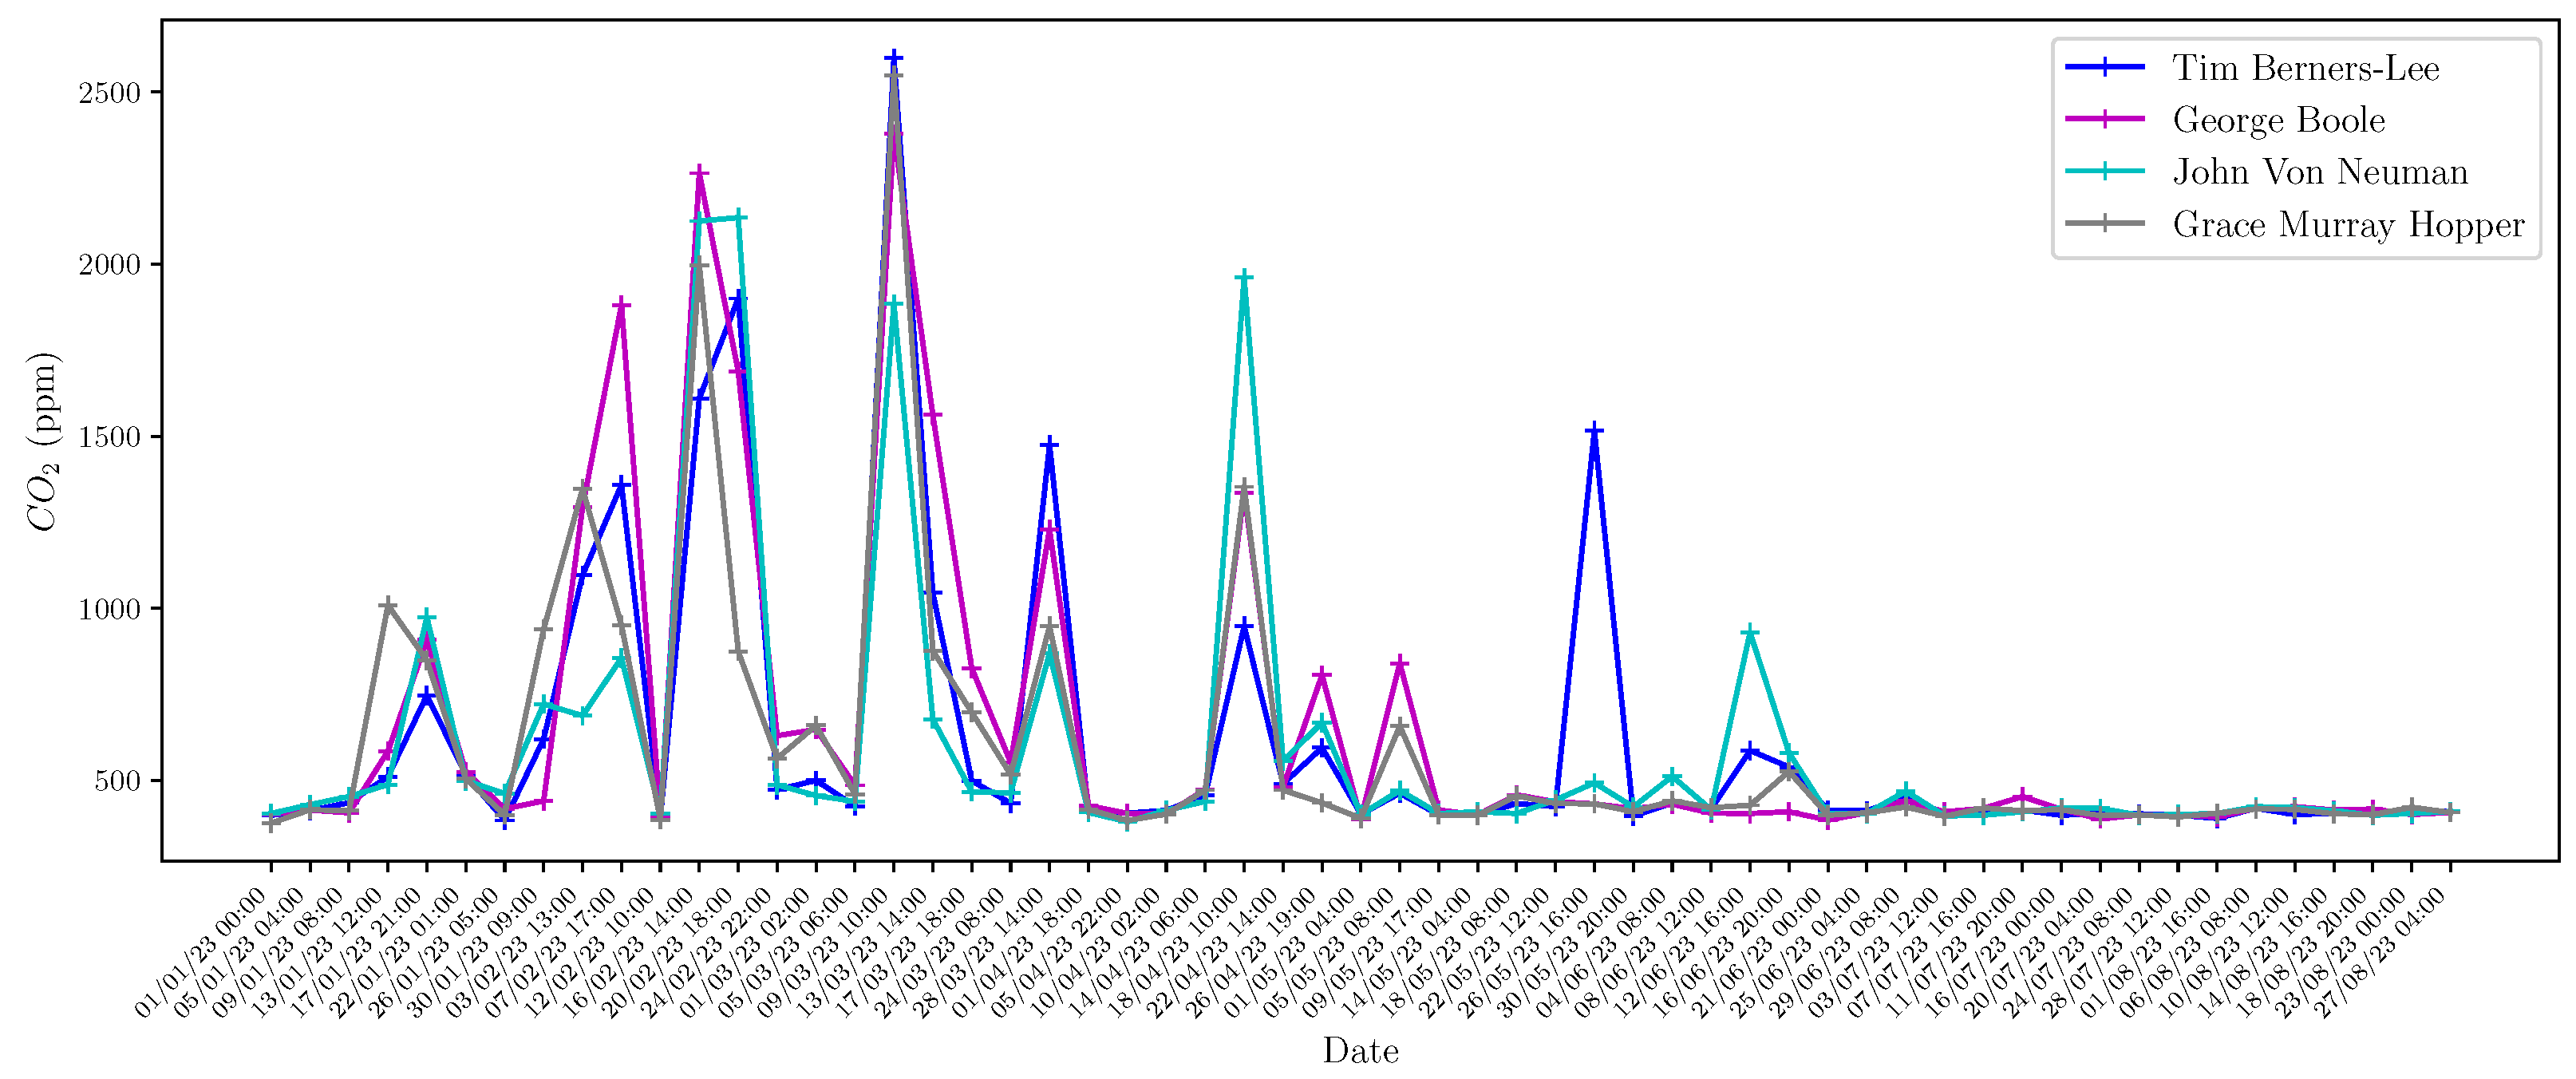
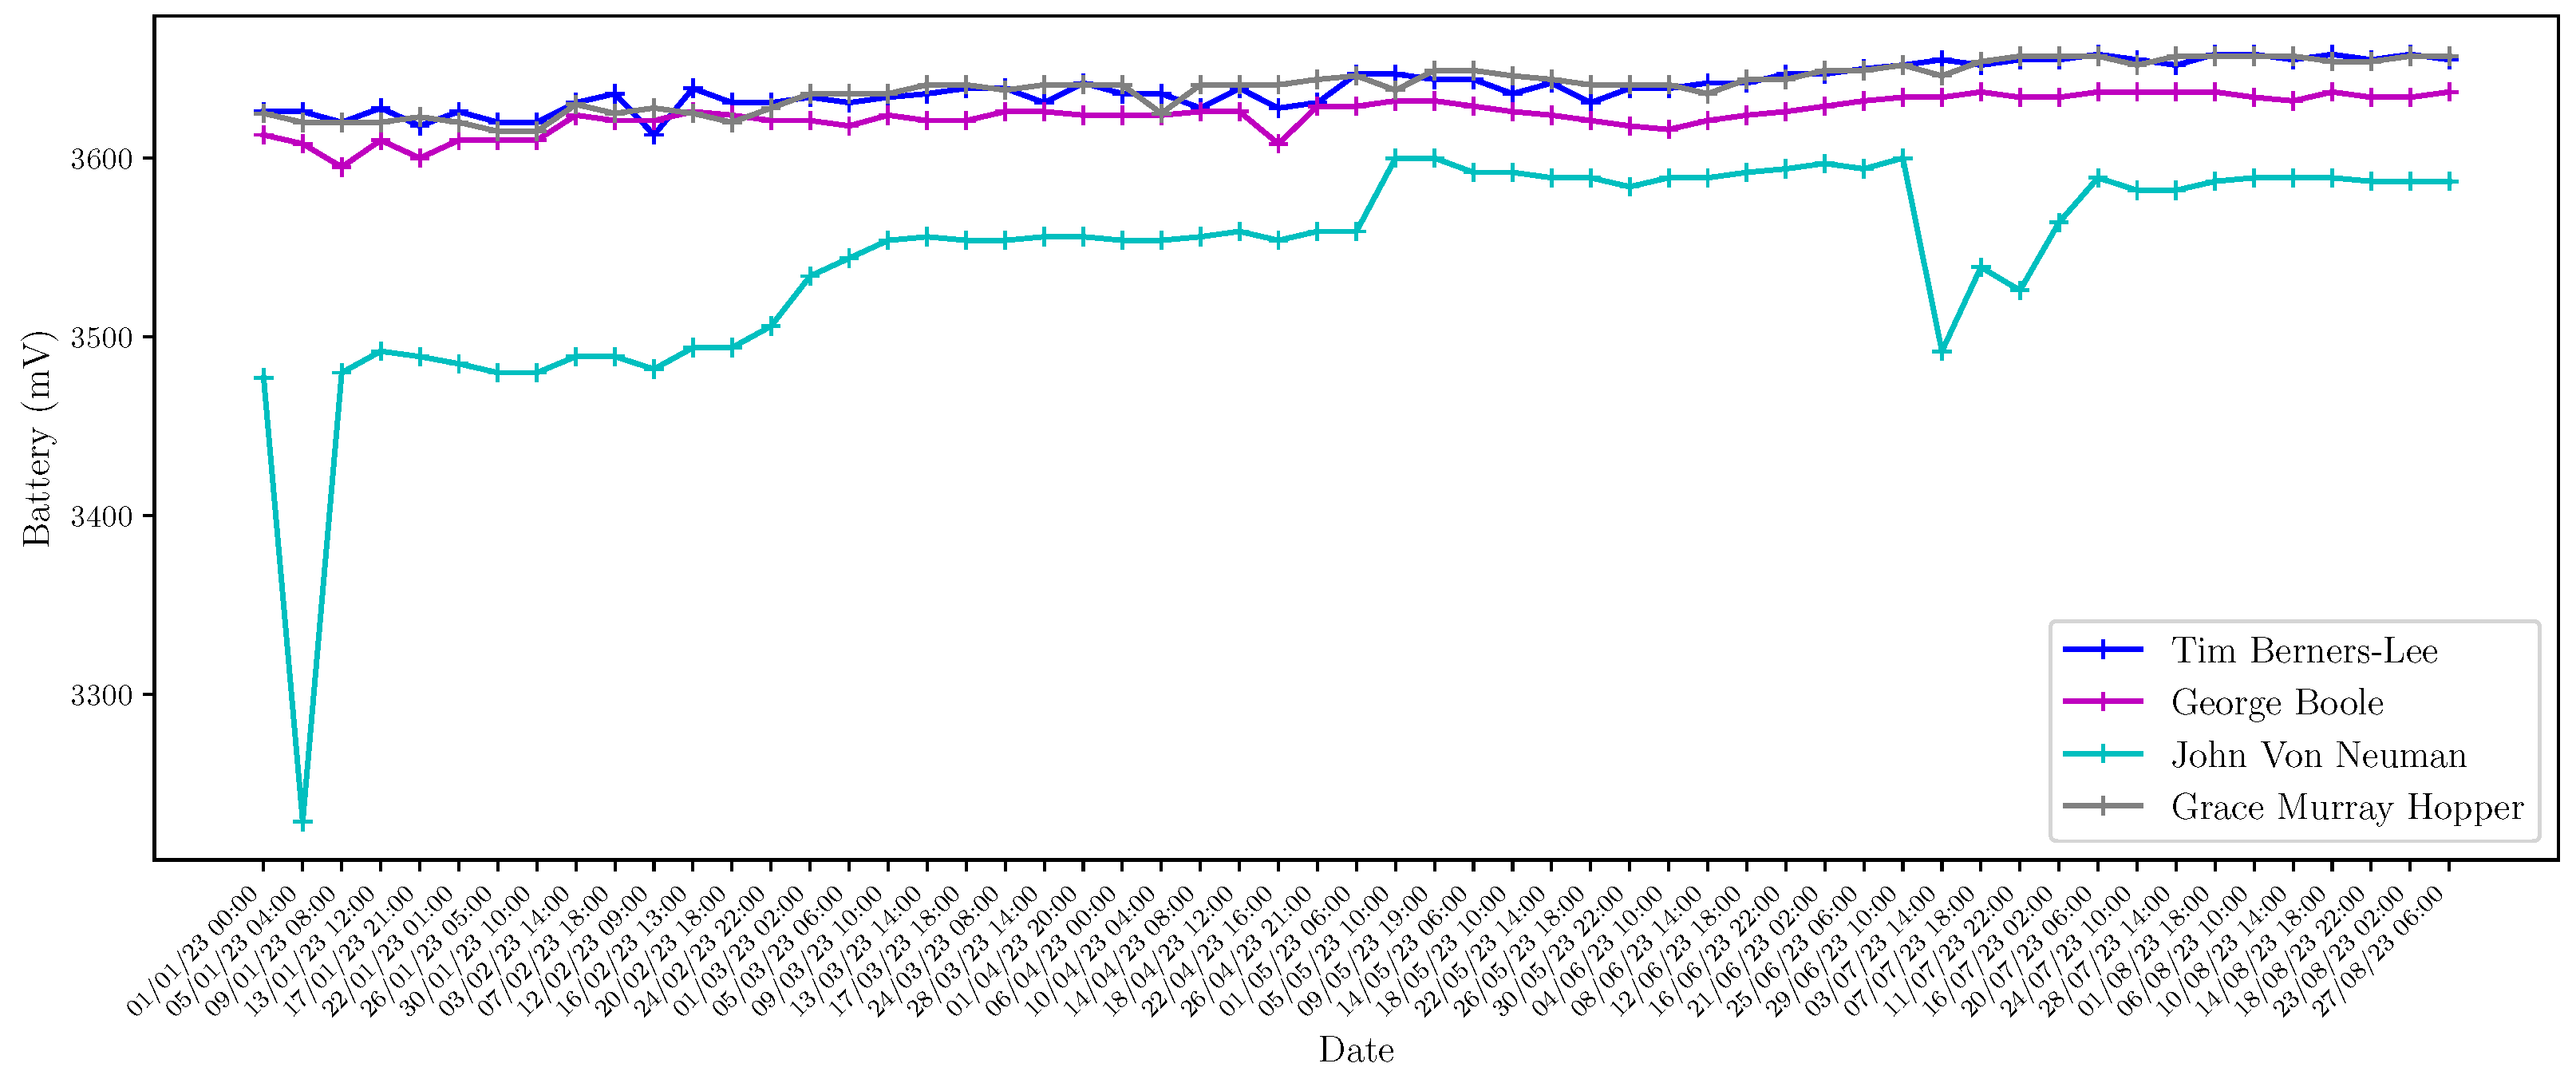
| 20 | CO2 | 485 | −0.021 | in Tim Berners-Lee since 01/01/23 to 29/9/23 |
| 21 | POW | 0 | 0.000 | No general outages in the last year |
| 22 | ENE | 31,740.58 | −0.317 | Data provided by UCLM |
| 23 | WAT | NA | 0.000 | |
| 24 | GAS | NA | 0.000 | |
| 25 | SUN | 2664 | 0.266 | Agencia Estatal de Meteorología (AEMET): 5 |
| 26 | PRD | 73,334 | 0.733 | Solar Power by country 6 |
| 27 | GRE | NA | 0.000 | |
| 28 | PAN | 0 | 0.000 | |
| 29 | MAX | 21.8 | 0.218 | AEMET 5 |
| 30 | MIN | 9.3 | 0.930 | AEMET 5 |
| 31 | ENR | 693.2 | 0.693 | |
| 32 | FEM | 9.8 | 0.098 | Igualdad en cifras 4 |
| 33 | FES | 13.8 | 0.138 | AEMET 4 |
| 34 | RSS | 100 | 0.999 | |
| 35 | NAP | NA | NA | |
| 36 | PRK | 0.13 | 0.130 | Monitored: 4; Not monitored: 32 (only cars) |
| 37 | VEH | 58.5 | 0.585 | Own elaboration (75% of professors) |
| 38 | AGL | 121.77 | 0.122 | Data collected for Fermin C. building, excluding non-working days |
| 39 | PUB | NA | 0.000 | |
| 40 | PRV | 60 | −0.600 | VEH + people arriving on motorcycles (only professors) |
| 41 | BIK | NA | NA | |
| 42 | WAL | NA | NA | |
| 43 | FOR | 97.4 | 0.974 | Portal de Transparencia 2 |
| 44 | TFW | 96.3 | 0.963 | Fundación CYD: Tasa de empleo, estabilidad y salario 2 |
| 45 | COW | 0.1 | 0.100 | |
| 46 | SPI | 3 | 0.300 | Spin offs 2 |
| 47 | NMA | 17 | 0.170 | Own elaboration: Table 3 |
| 48 | SEN | 55 | 0.530 | Own elaboration: Table 3 |
| 49 | ACT | 4 | 0.400 | Own elaboration: Table 3 |
| 50 | NBR | 11 | 0.110 | At this moment, sum of LOR+WIF |
| 51 | NSD | 7 | 0.700 | Own elaboration: Table 4 |
| 52 | CAS | 100 | 0.100 | Total space covered by sensors |
| 53 | FLS | 100 | 0.100 | |
| 54 | SIZ | 184.19 | 0.184 | Data collected since 19 May 2022; Total data size: 87.67 GB |
| 55 | NOO | 14,937 | 0.149 | Own elaboration |
| 56 | NCT | 4 | 0.400 | LoRa, WiFi, 3G, NFC |
| 57 | WIF | 10 | 0.100 | |
| 58 | LOR | 1 | 0.100 | |
| 59 | USN | NA | NA | |
| 60 | WFR | 70.84 | 0.708 | ESI/NBR |
| 61 | INT | 100 | 0.100 | |
| 62 | PSI | 0 | 0.000 | |
| 63 | ALM | Yes | 0.999 | |
| 64 | RTM | Yes | 0.999 | |
| 65 | DAT | No | 0.000 | |
| 66 | NOP | 1 | 0.100 | |
| 67 | SEC | Yes | 0.999 | User authentication, ciphered |
| 68 | WIU | No | 0.000 | Users cannot post data |
| 69 | RIU | Yes | 0.999 | Users may access data through multiple interfaces |
| 70 | API | No | 0.000 | |
| 71 | APP | 2 | 0.200 | Incident and Home Assistant app |
| 72 | APU | NA | NA | |
| 73 | DAC | 0 | 0.000 | |
| 74 | OPE | 0 | 0.000 | |
| 75 | WEB | 640.24 | 0.640 | Own elaboration |
| 76 | NSN | 6 | 0.600 | Twitter, Instagram, Linkedin, Facebook, Youtube, Twitch 2 |
| 77 | NST | NA | NA | |
| 78 | KPI | 0 | 0.000 | There is no standardized metrics in this domain |
| 79 | AVK | NA | NA | The improvement based on KPI cannot be measured |
| 22.054 | ||||
| Stakeholder | Theoretical (Th) and Practical (Pr) Implications |
| Managers | Th1: Detection of weaknesses and opportunities for improvements. |
| Th2: Design of strategies specifically aimed at increasing the smartification degree. | |
| Th3: To enable a fair comparison with other universities, which results into a ranking for smart universities. | |
| Ph1: Design savings plans oriented to increase the energy efficiency and sustainability of buildings, which result in important economic savings and increased comfort for users. | |
| Teachers/students | Ph2: An increase in the comfortability degree of users across the different spaces |
| Ph3: An increased agility in the detection and resolution of incidents, which results in better classroom utilization. | |
| Technical Staff | Ph4: They are responsible for the maintenance of the monitoring and control infrastructure and the data integration platform, communications security and user management. |
| Society | Ph5: The transfer of knowledge from the university to society, including companies, may contribute to its digital transformation. |
| Researchers | Th4: The article reveals the need for research into new methodological perspectives to evaluate the smartification process. |
Disclaimer/Publisher’s Note: The statements, opinions and data contained in all publications are solely those of the individual author(s) and contributor(s) and not of MDPI and/or the editor(s). MDPI and/or the editor(s) disclaim responsibility for any injury to people or property resulting from any ideas, methods, instructions or products referred to in the content. |
© 2023 by the authors. Licensee MDPI, Basel, Switzerland. This article is an open access article distributed under the terms and conditions of the Creative Commons Attribution (CC BY) license (https://creativecommons.org/licenses/by/4.0/).
Share and Cite
Escolar, S.; Rincón, F.; Barba, J.; Caba, J.; de la Torre, J.A.; López, J.C.; Bravo, C. A Methodological Approach for the Smartification of a University Campus: The Smart ESI Use Case. Buildings 2023, 13, 2568. https://doi.org/10.3390/buildings13102568
Escolar S, Rincón F, Barba J, Caba J, de la Torre JA, López JC, Bravo C. A Methodological Approach for the Smartification of a University Campus: The Smart ESI Use Case. Buildings. 2023; 13(10):2568. https://doi.org/10.3390/buildings13102568
Chicago/Turabian StyleEscolar, Soledad, Fernando Rincón, Jesús Barba, Julián Caba, José Antonio de la Torre, Juan Carlos López, and Crescencio Bravo. 2023. "A Methodological Approach for the Smartification of a University Campus: The Smart ESI Use Case" Buildings 13, no. 10: 2568. https://doi.org/10.3390/buildings13102568
APA StyleEscolar, S., Rincón, F., Barba, J., Caba, J., de la Torre, J. A., López, J. C., & Bravo, C. (2023). A Methodological Approach for the Smartification of a University Campus: The Smart ESI Use Case. Buildings, 13(10), 2568. https://doi.org/10.3390/buildings13102568