Abstract
The flat slab-flanged wall (FSFW) coupled system has gained popularity in recent years; however, its seismic performance remains an issue, as beams and columns in it are commonly eliminated. To tackle this problem, embedding concrete-filled steel tubes (CFSTs) in wall piers has been proposed to strengthen the system; the viability of this approach has been verified at the member level. Along this line, this study embarks on a shaking table testing of a 1/8-scale five-story FSFW structure equipped with CFSTs in walls, with an aim to understand the overall seismic behavior of such an enhanced system. As with the practice in many countries, the plan layout of the test structure consisted of four rows of wall piers, thus presenting a ‘fish-bone’ floor configuration that relied only upon the walls to resist gravity and lateral loads. The structure was subjected to a suite of input ground motions along with white-noise excitations. By so doing, its damage progression, pattern and dynamic characteristics were clearly identified. Furthermore, a non-linear time history analysis was conducted using PERFORM-3D, and the goodness-of-fit of the computed responses to the experimental records was examined. Findings indicated that the application of CFSTs was instrumental in resisting the simulated earthquake loads acting on the FSFW system, hence the global response limits required by codes of practice were met, even in the case of extremely strong earthquakes. Nevertheless, the junction between the shear walls and floor slabs was found to be the weakest links in the whole system. Designers are thus cautioned to implement proper detailing in those regions to prevent local distress, though it did not appear to acutely impair the system’s collapse-resisting capacity.
1. Introduction
The reinforced concrete (RC) flat slab-flanged wall (FSFW) coupled system has emerged as an appealing structural form to address ever-increasing design challenges. Historically, it evolves from the dual wall-frame system. The difference between the two is that in the former—as its name suggests—structural columns and beams are often removed, leading to the unique feature of shear walls only, connected by floor slabs, bearing the lateral forces caused by wind or seismic disturbances.
Yet a lot of advantages can be achieved by adopting such an alternative: (1) clear ceiling height can be maximized; (2) utility ducts and pipes do not need to pass through girders anymore; (3) both architectural flexibility and unobstructed space can be obtained, accompanied by an enhanced indoor aesthetic; and (4) the FSFW buildings have a great opportunity to be panelized via prefabricated modular elements, thereby resulting in a bolstered construction efficiency. Due to these benefits, FSFW structures have been popular for years, especially for office and residential buildings [1,2,3,4,5].
However, there is still a great concern regarding the system’s seismic safety, due simply to the complete elimination of beams and columns in it. Under seismic conditions, the load transfer between the floor diaphragms and wall groups will get increasingly complex, which could even provoke slab punching failure. Moreover, if slender wall piers are used (a common practice now), the system would be predisposed to a high risk of suffering severe damages under strong earthquake excitations [6,7].
It is worth noting that shear wall failures observed in recent seismic events (the 2010 Chile and 2011 New Zealand earthquakes) indicate a dire need for enhancing the robustness of shear wall buildings. These failures, with limited ductility, were found to be related to a number of inadequacies [8,9,10,11], such as high wall-to-floor-area ratio, poor boundary element confinement, and high axial stresses in walls. As a result, the stability and lateral deflection capacity of these shear walls declined drastically during the earthquakes, resulting in rebar buckling and concrete crushing in the wall boundaries, and, worst, the total collapse of several shear wall buildings [12,13].
Analytical studies have been conducted extensively to apprehend the structural behavior of slab-wall sub-assemblages or entire buildings. The first systematic study was reported by Qadeer and Smith [14], who employed the finite-difference method to determine the coupling stiffness, effective width, and stresses in uniformly spaced plane walls. Then, Coull and his colleagues [15,16,17,18] contributed greatly to the understanding of the interactions between laterally loaded walls and connecting floor slabs. They indicated that the dimensions and shape of walls (plane walls, flanged walls, and box cores), wall spacing, and slab dimensions have significant influence on the effective width and stiffness of the slabs. Their appraisal also led to a design procedure for checking against punching shear failure of the slabs. Balkaya and Kalkan [3] numerically analyzed the three-dimensional effect of a slab-wall system with openings. They showed that the stress flow and cracking pattern around the openings of the so-called pierced walls are vastly different from those observed with 2D models. This was attributed to the nonexistence of contra-flexure points when modeling the 3D behavior. In addition, within the walls, the tension-compression coupling mechanism was highly affected by the size and locations of openings. More recently, two existing shear wall buildings representative of Chilean practice were analyzed by Ugalde et al. [19] using finite-element models. They observed that the total inter-story drift deformation of the buildings takes considerable values at some shear walls, and the axial-flexural demands and strains at wall boundaries are indeed significant. Similarly, Ramos and Hube [7] assessed via numerical simulation the seismic response of an RC shear wall building with coupling slabs. It was found that the shear forces transferred through slabs result in a significant variation in the axial load of walls. Furthermore, a larger amount of slab reinforcement tends to transfer a higher axial load to the compressed walls, generating remarkable changes in their flexural capacity. Pavel et al. [20] considered a numerical model that represents a class of slab-core wall structures in order to evaluate their seismic performance. The structure modeled was shown to be able to sustain significant seismic loads without suffering much damage; a large lateral deformation could be borne by the slab-wall connections as well.
In terms of experimental research, there are a few efforts devoted specifically to slab-wall structures. An effective slab-wall connection was proposed and experimentally validated by Pantazopoulou and Imran [21]. It was revealed that the vertical loads affect the in-plane stiffness and shear resistance of the floor slabs, particularly in the vicinity of the slab-wall connections. Moreover, the continuous reinforcement through the connections is capable of preventing sliding shear failure in these critical regions. The results of a shake table testing of a slice from a full-scale seven-story shear wall building were reported by Panagiotou et al. [22]. The building, which was tested in a single direction parallel to the web wall, responded satisfactorily to the ground motions reproduced by the shake table and met all performance objectives. Nevertheless, the interaction effects between the walls and slabs caused a notable increase in the system overturning moment as well as in the shear force demand in the web wall. Greeshma and Jaya [23] addressed the reinforcement detailing within and around slab-wall connections. They observed that the slab bars bent at 90 degrees in the joint core is a superior method of connecting slabs to walls than the conventional U hooks. Brunesi et al. [24] conducted a cyclic test on a full-scale one-story wall-slab-wall specimen. During the testing, severe damage of concrete occurred at both the wall base and slab-wall connections, showing the vulnerability of a large stock of slab-wall structures which have been designed with little seismic consideration. A shaking table test of a five-story coupled wall structure, representing part of a typical apartment building with a high wall-to-floor area ratio, was performed by Fischinger et al. [25]. It was observed that the lightly confined free edges of the wall flanges (using U hooks) behaved satisfactorily in the case of moderate seismic demand. However, the interactions between the slabs and walls had a negative impact, causing a brittle shear failure of the wall piers under bidirectional excitations.
It should be stressed that concrete confinement in wall boundaries is highly desirable in shear wall buildings [9,10,11], especially at the extremities of walls having T, L, or other similarly shaped cross sections [2]. This is understandable because it has been demonstrated in [7] that the compressive strain in wall boundaries reaches the failure strain earlier when considering the coupling effects of slabs. In addition, a larger flexural strength of slabs increases the axial load compression in wall piers, which increases their deformation demand considerably.
To get to grips with these problems, the authors of [26,27,28] have proposed a novel type of shear wall that incorporates a number of stiff concrete-filled steel tubes (CFSTs) at the corners and/or at the web–flange intersections of the walls. These CFSTs are purposely arranged at these key regions so that the entire wall unit can exhibit excellent seismic performance, even under tension-shear loadings [26]. Such a steel-concrete composite wall provides a new and compelling alternative to conventional concrete walls. Note, however, that this concept has only been discussed at the member level. Therefore, in order to examine the overall lateral load-resisting capacity of FSFW structures equipped with such composite walls, a large-scale system-level test is genuinely needed.
Motivated by the aforementioned considerations, a shake table testing of an FSFW structure with CFSTs embedded in its wall piers was conducted, and the main findings are presented in this paper. The remainder of this paper is organized as follows: first, the design of the test structure is introduced, followed by the description of the experimental procedure and loading sequence. Test results are then discussed with emphasis on describing the local and global behaviors of the structure observed in the tests. A numerical study was finally performed to reproduce the dynamic responses of the test structure, and to compare the seismic behaviors of the structures with and without embedded CFSTs in wall piers. It is believed that the outcomes of this work will contribute to the understanding of the overall seismic performance of the FSFW systems concerned, and, ultimately, promote the application of the highly ductile wall components embedded with CFSTs.
2. Test Program
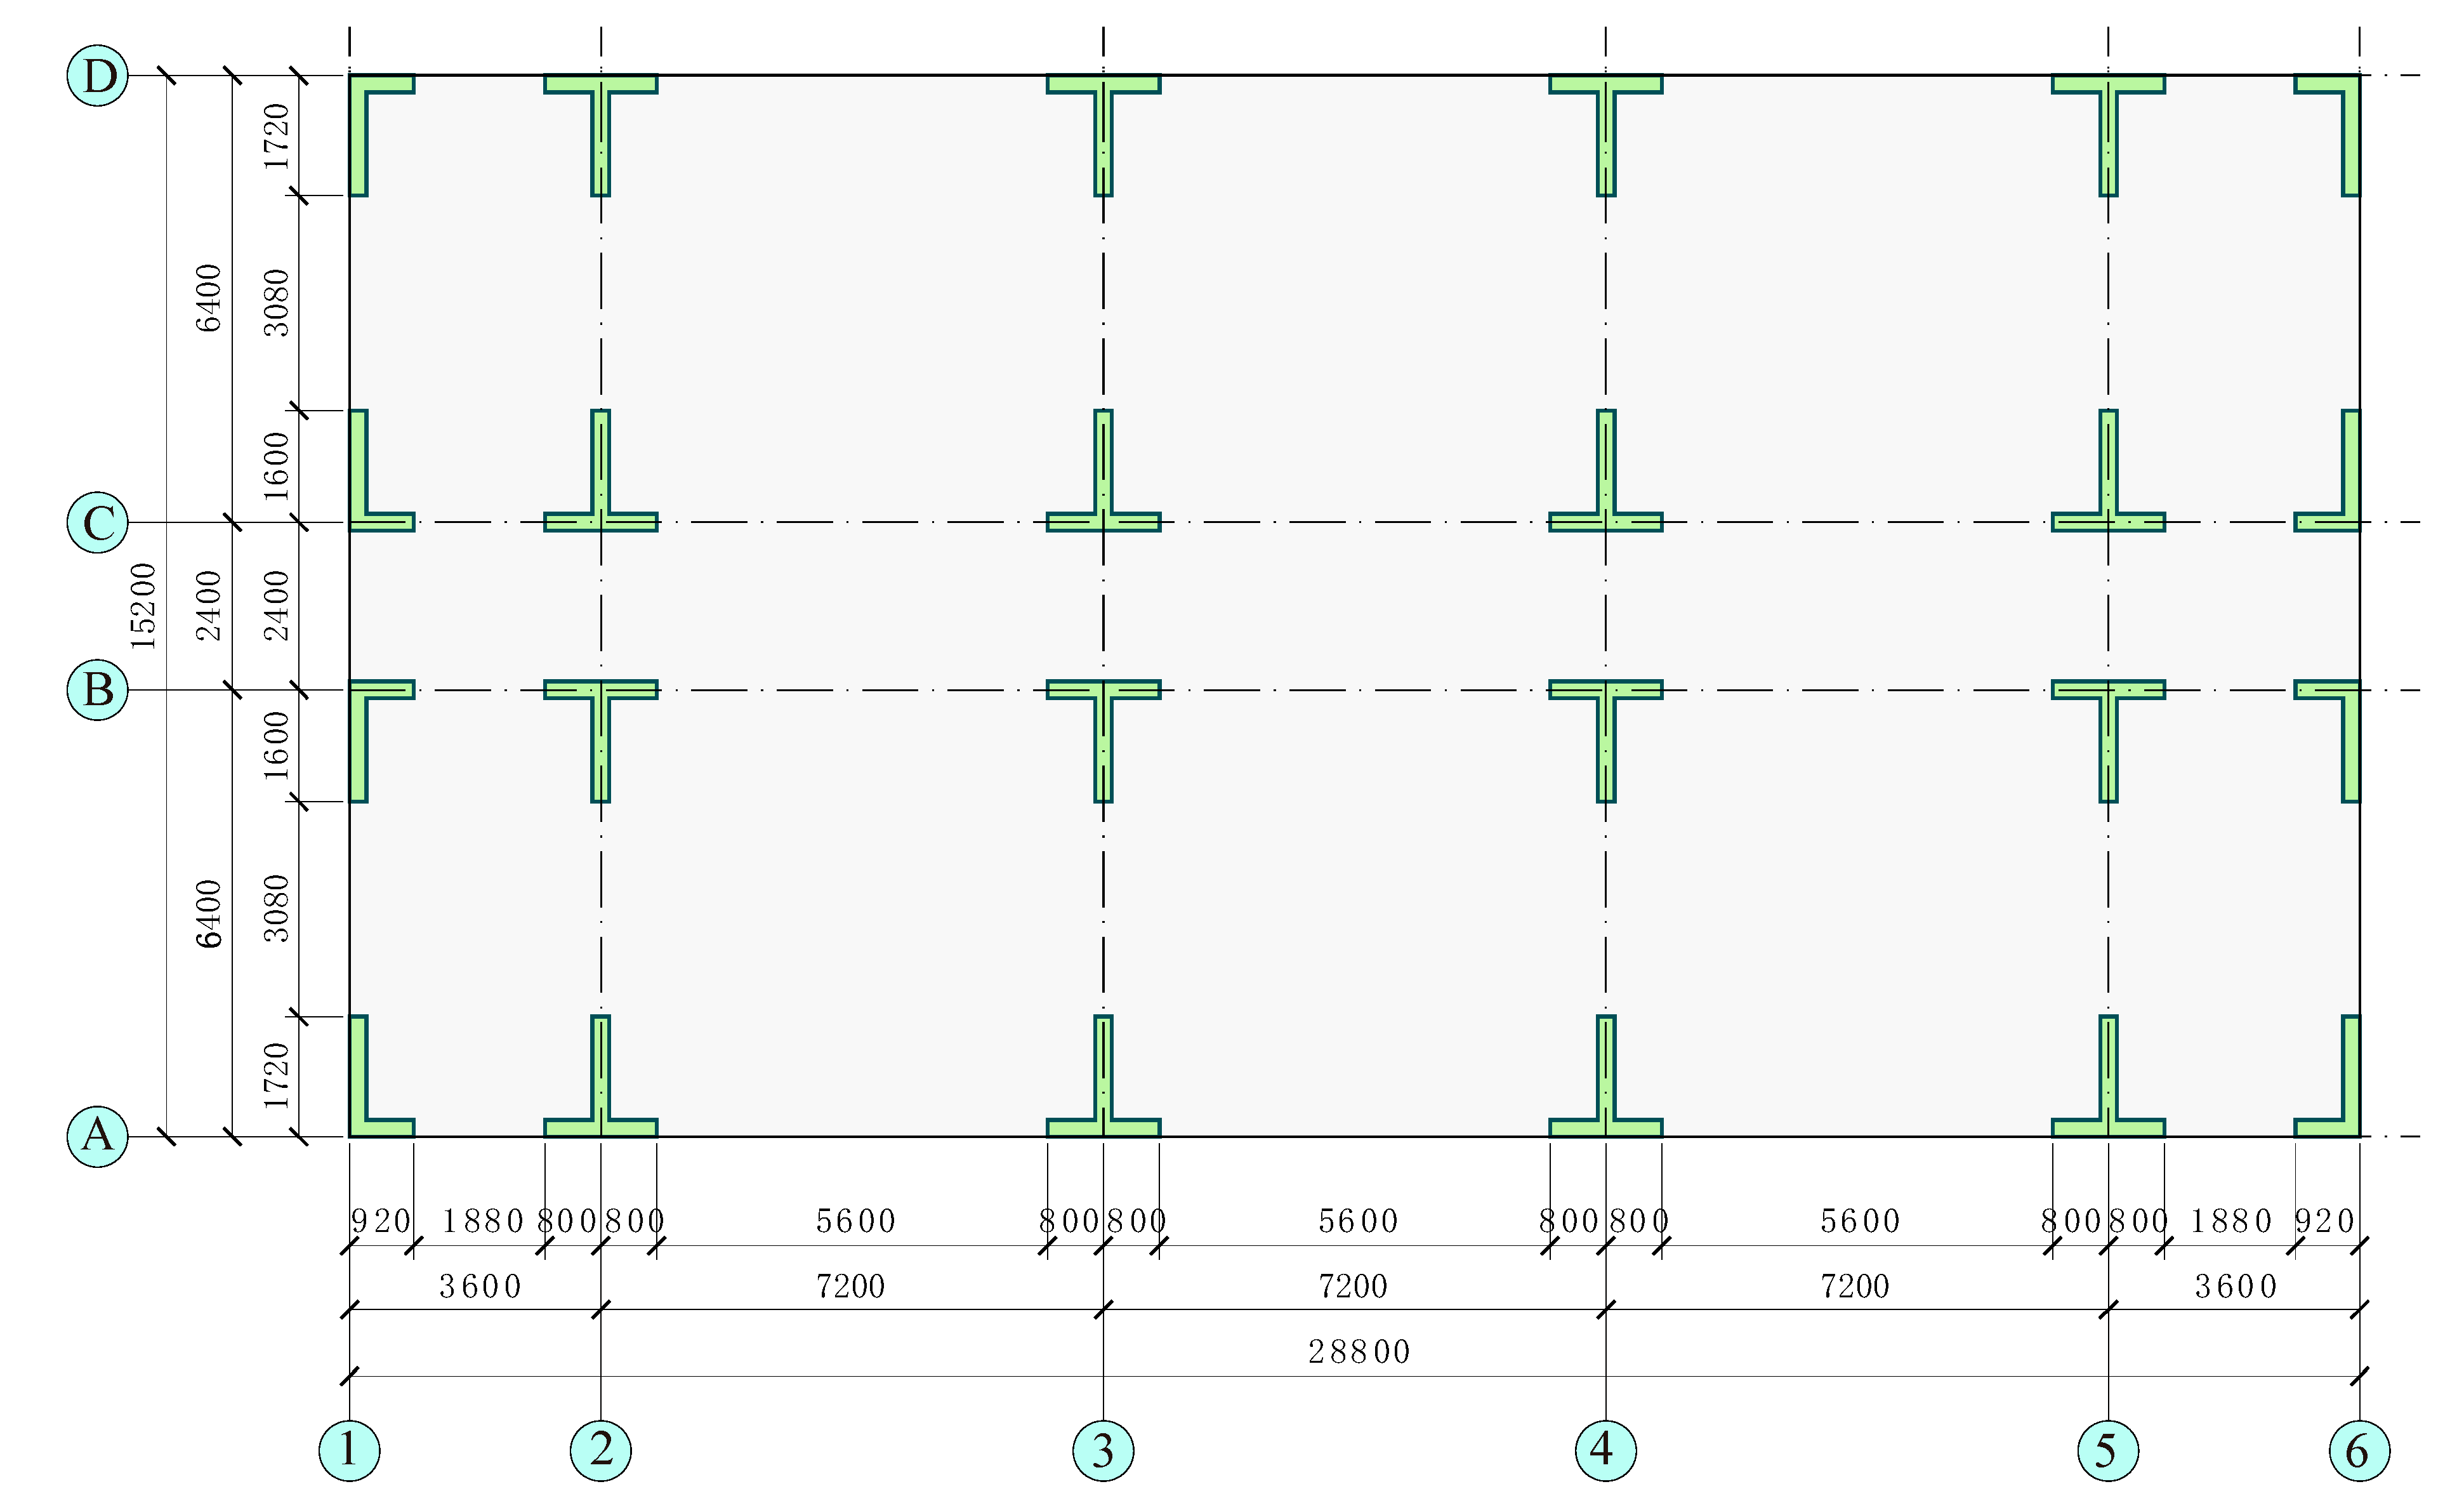
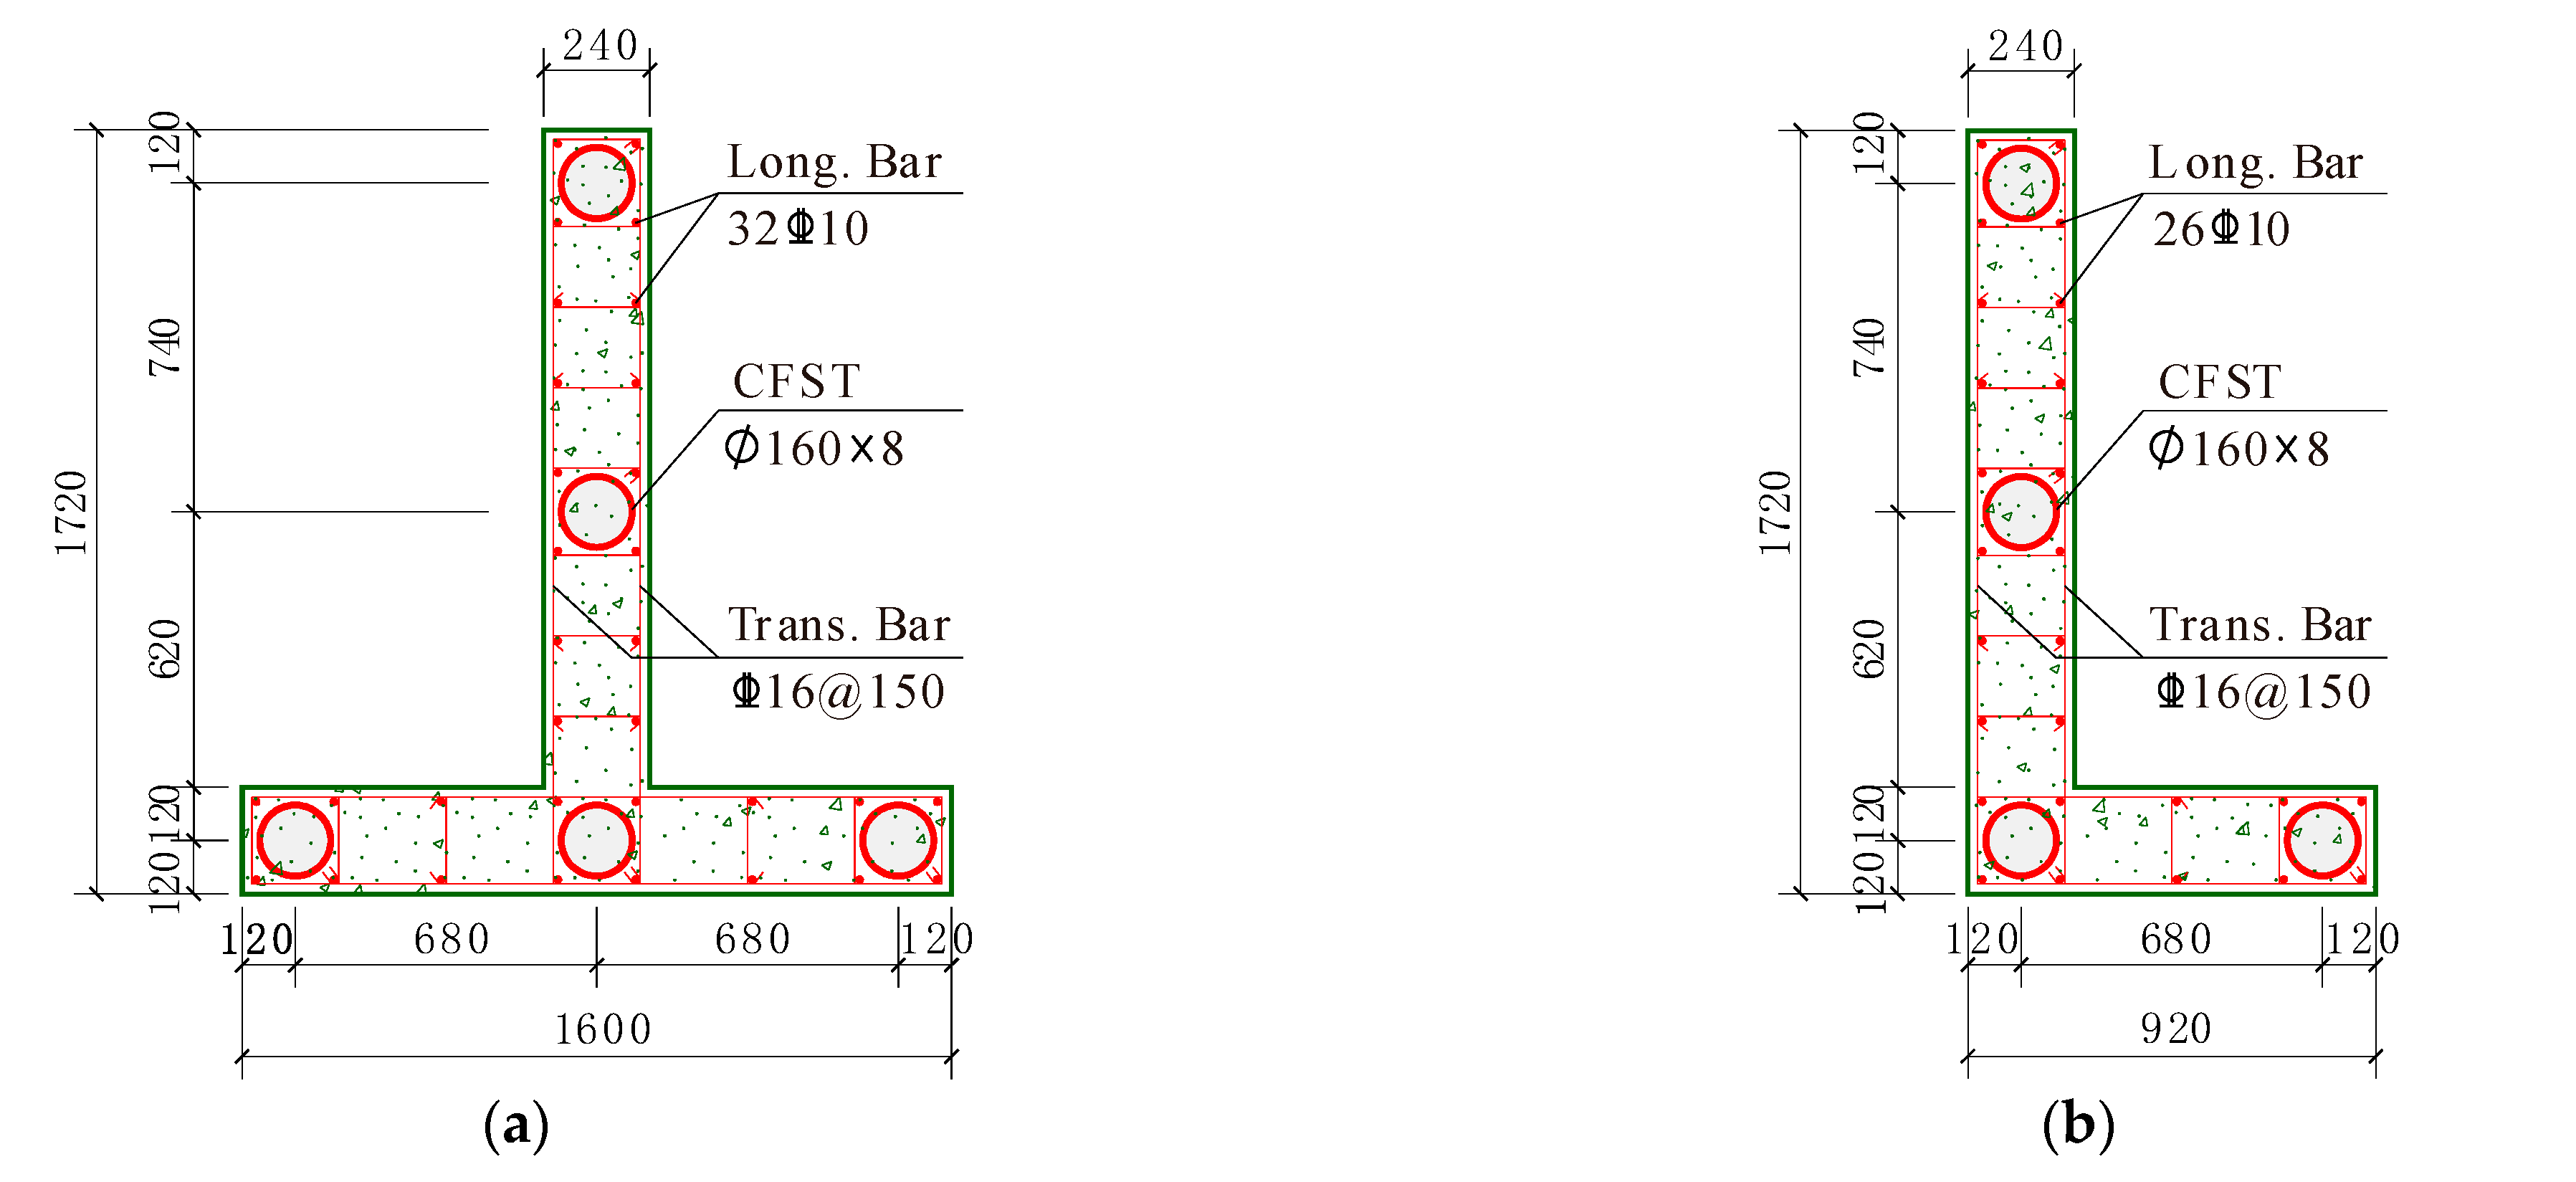
2.1. Description of the Prototype and Test Structure
A 1/8 scale five-story FSFW structure was designed in this study, based on an RC prototype office building located in Guangzhou with seismic intensity degree 7 as per Chinese seismic code provisions [29] (China’s earthquake intensity is roughly equivalent to the Modified Mecalli Intensity [30]). The site soil belonged to Category III, defined in [29] as that the thickness of the site soil is greater than 50 m, and the average shear wave velocity in the soil is between 150 m/s and 250 m/s.
The prototype structure had five stories with a total height of 30 m, each story being 6 m high. All of the floor slabs were of the same thickness, 400 mm. The maximum span of the slabs was 7.2 m. There were no beams in the structure. According to the length scaling factor (1/8), the test structure was hence 3.75 m high (0.75 m high per story), adopting 50 mm thick flat slabs that had the role of coupling all the wall piers with specially-shaped cross sections (L or T).
To accommodate architectural requirements, the prototype structure presented a ‘fish-bone’ floor configuration consisting of four rows of wall piers, with a longitudinal corridor running through the middle of each floor, as is the practice in many countries [10,11]. Figure 1 shows the plan layout of a typical floor of the prototype structure. Each wall pier possessed the same cross-sectional size throughout the building height. The wall-to-floor-area ratio was 3.75%. A 3D view of this structure is displayed in Figure 2.
Figure 1.
Plan layout of the prototype structure (Unit: mm).
Figure 2.
Three-dimensional rendering of the prototype structure.
Each wall pier was characterized by a T or L-sectional shape. For the prototype structure, the wall thickness was uniformly 240 mm, irrespective of the wall shape. Two curtains of steel bars were used to reinforce these walls, while CFSTs were arranged in them to serve as strengthening elements. Grade C30 concrete was used to cast both the slabs and walls, while C40 concrete was applied to fill the CFSTs.
As detailed in Figure 3, the CFSTs were inserted at the wall boundaries, web–flange intersection, and center of the longer wall segment. The circular steel tube of the CFSTs was made with Q235 plate. The tube’s outer diameter and thickness were 160 mm and 8 mm, respectively. Due to the absence of columns, the axial load ratio of the walls on the ground floor was about 0.5; thus the CFSTs were expected to carry a significant portion of the building’s gravity and lateral loads.
Figure 3.
Dimensions and reinforcement details of the wall piers in the prototype structure (Unit: mm): (a) T-shaped wall pier; (b) L-shaped wall pier.
Steel bars made of HRB400 (i.e., Hot-rolled Ribbed Bars [31]) were used as reinforcement for the prototype structure. Figure 3 shows their details in the walls. As for each floor slab, two-way D16@150 and D14@150HRB400 steel bars were used as the top and bottom reinforcement, respectively.
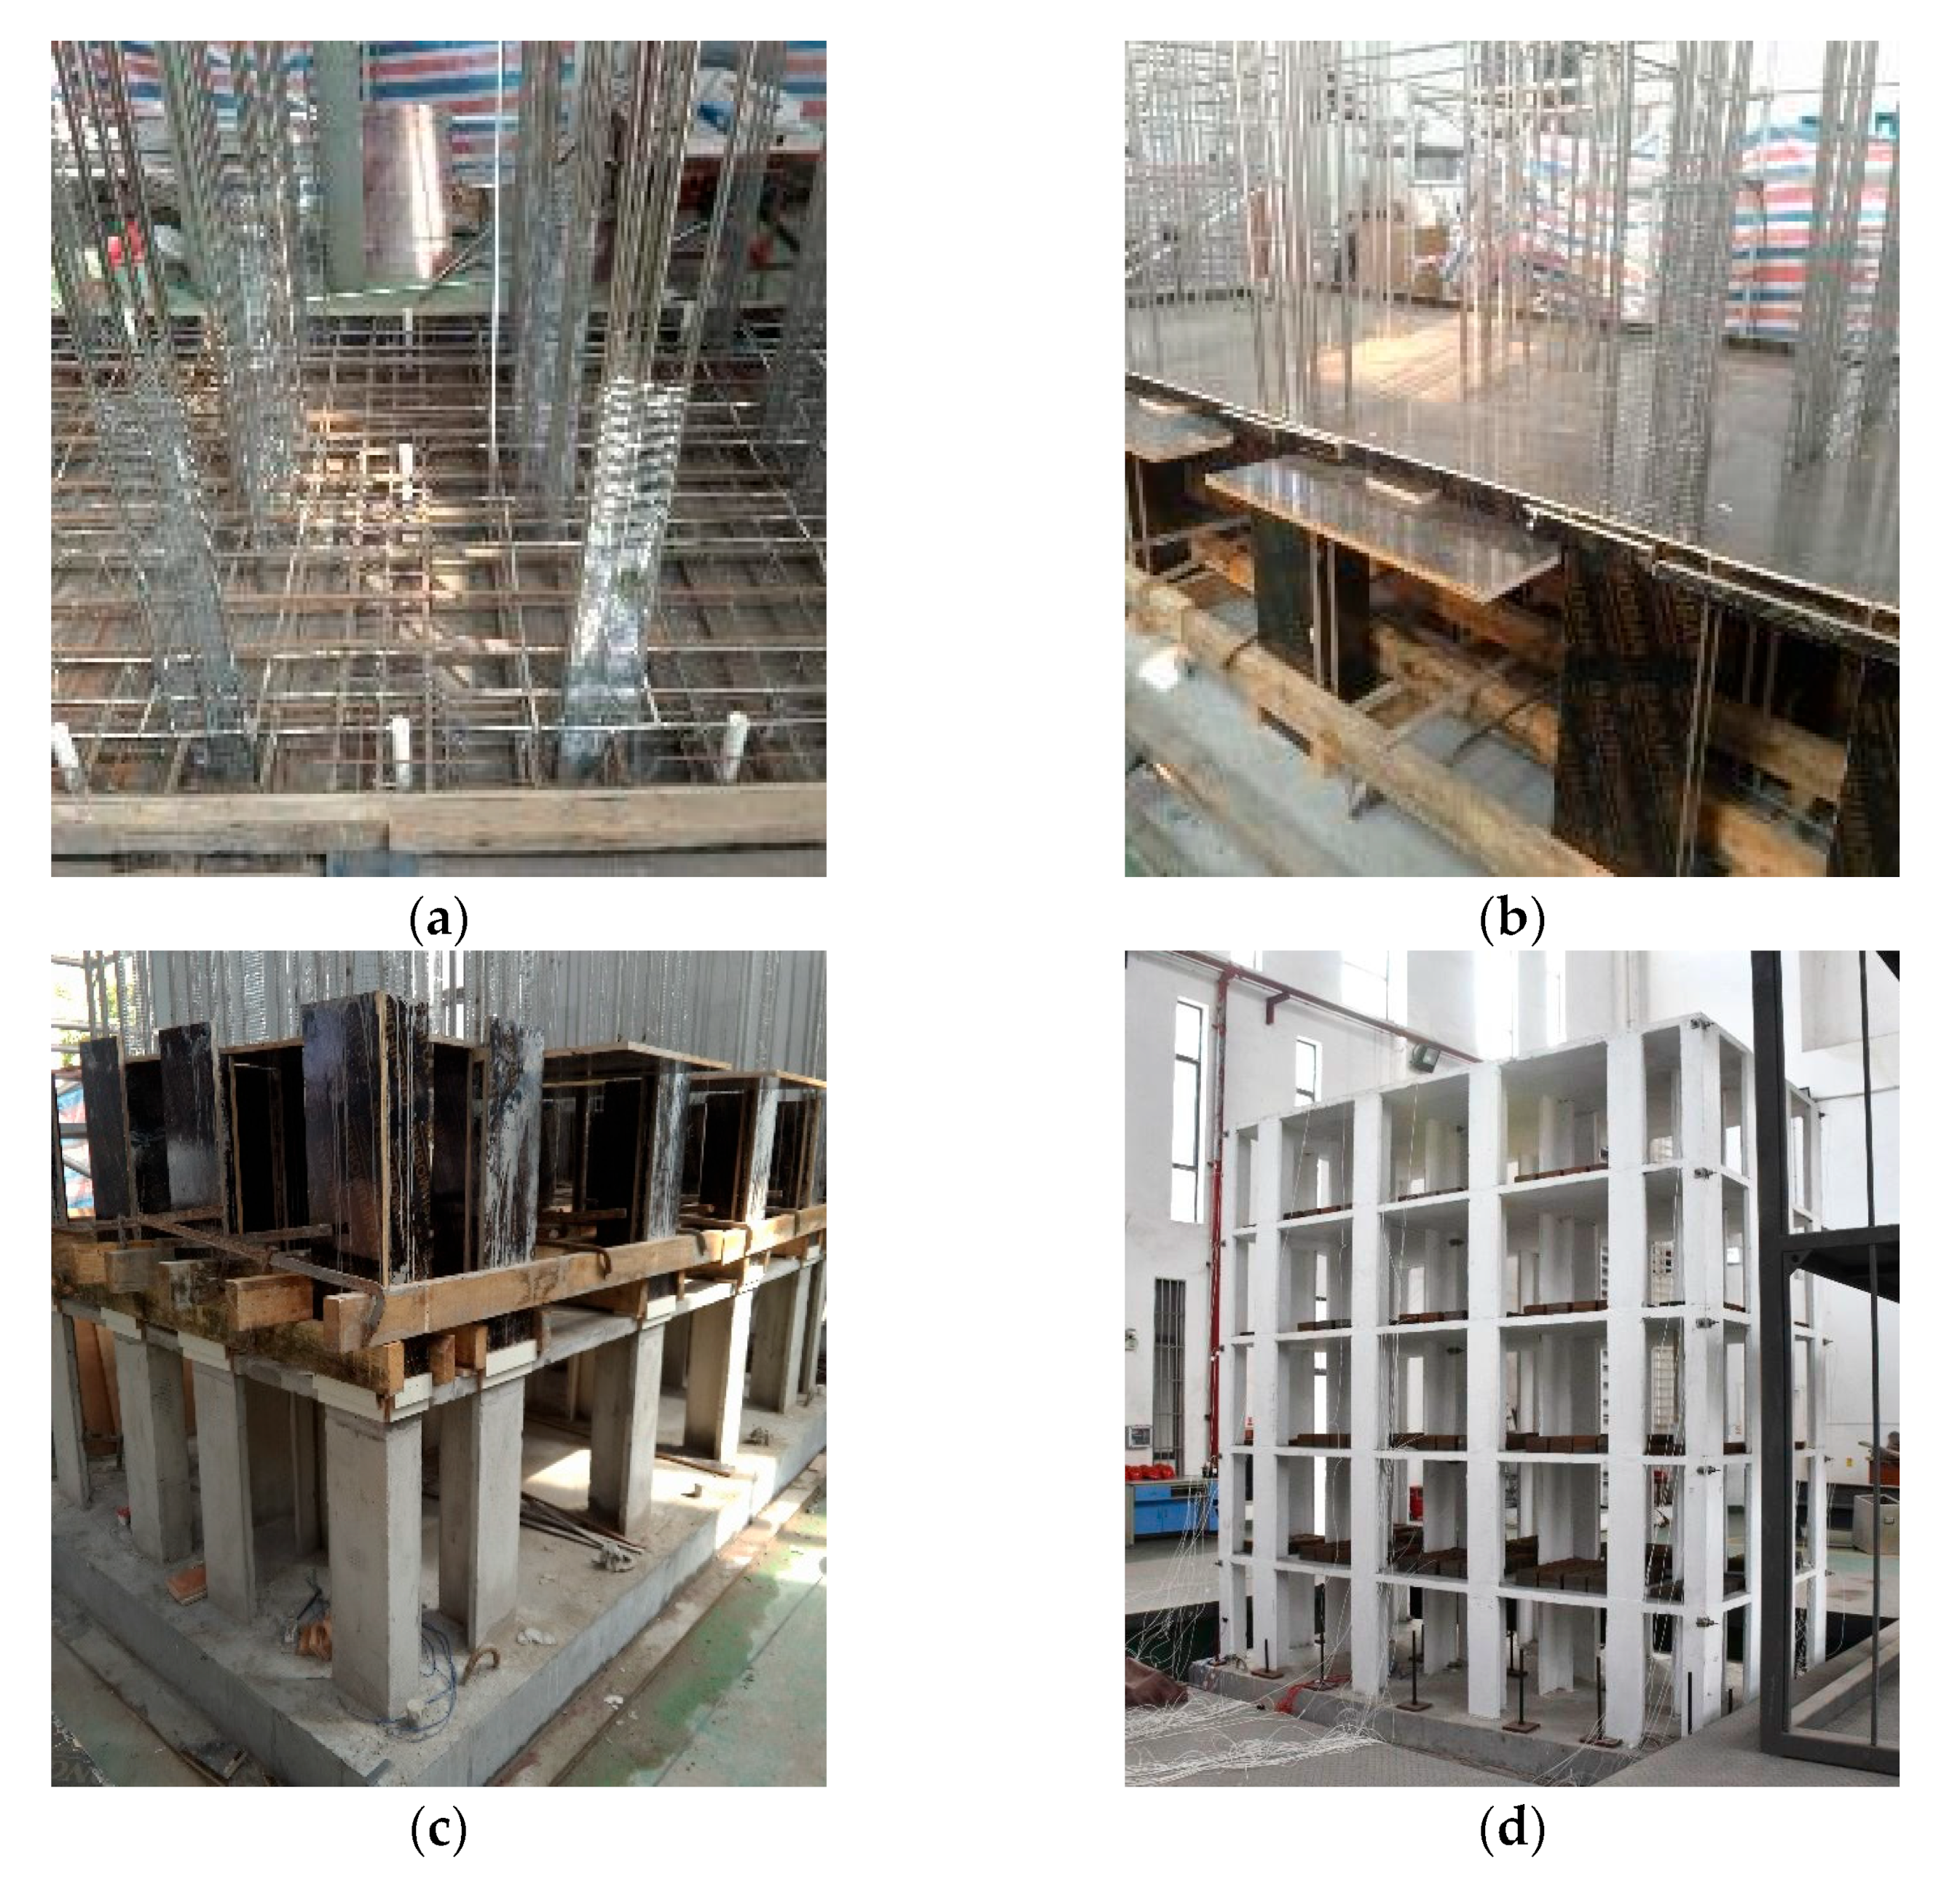
2.2. Scaling Factors, Construction Materials and Manufacture of the Test Structure
According to the similitude theory [32,33], the primary scaling factors for the current tests, which are independent of each other, were determined as follows: (i) the length scaling factor was Sl = 1/8; (ii) the stress scaling factor was Sσ = 1/4.24; and (iii) the acceleration scaling factor was Sa = 2.5. Other scaling factors could be readily derived from the above three factors [32].
The length scaling factor Sl was set to 1/8 in this work for two reasons: (i) the plane size of the prototype structure was 28.8 m × 15.2 m, which meant that the length scaling factor should not be greater than 1/8, otherwise the shaking table (4 m × 4 m, as detailed later) could not accommodate the scaled-down structure; (ii) the total weight of the test structure was 12.809 t, which was exactly within the maximum payload of the shaking table (20 t).
Micro-aggregate concrete (i.e., cement mortar) and fine meshes were used to construct the RC elements. The round tube of the CFSTs was simulated by a #304 stainless steel pipe due to the latter’s similar yielding properties to Q235 steel. Table 1 reports the measured mechanical properties of the construction materials used for the test structure. Figure 4 shows some construction scenarios and the appearance of the specimen before testing.
Table 1.
Main mechanical properties of the construction materials.
Figure 4.
Fabrication of the test structure: (a) tying of steel reinforcement; (b) casting of concrete; (c) installation of forms and shores for upper story; (d) appearance of the structure before testing.
2.3. Capacity of the Shake Table and Mass Applied to the Test Structure
The testing was carried out on a shake table at the South China University of Technology (SCUT). The table is capable of generating six-degree-of-freedom excitations. With a projection dimension of 4 × 4 m, the shake table is driven by eight electro-hydraulic servo actuators. The maximum payload is 200 kN. The maximum acceleration is 1.0 g with full payload, and the maximum velocity is 1000 mm/s. The effective frequency ranges from 0.1 to 50 Hz. Table 2 lists the main parameters of this facility.
Table 2.
Parameters of the shake table at SCUT.
To mimic the gravity load applied to the prototype structure, a number of lead weights were attached to each floor such that the weight of the test structure plus the subsidiary lead produced nominal axial stresses approximately equivalent to those produced by gravity loads (dead load plus half of live load) in the prototype building. The resulting axial load ratio was approximately 0.5 in the first-story walls. Figure 5 shows the distribution of the lead blocks on a typical floor. Table 3 gives the mass of the prototype and the test structures.
Figure 5.
Distribution of the lead blocks on a typical floor.
Table 3.
Mass of the prototype and test structures.
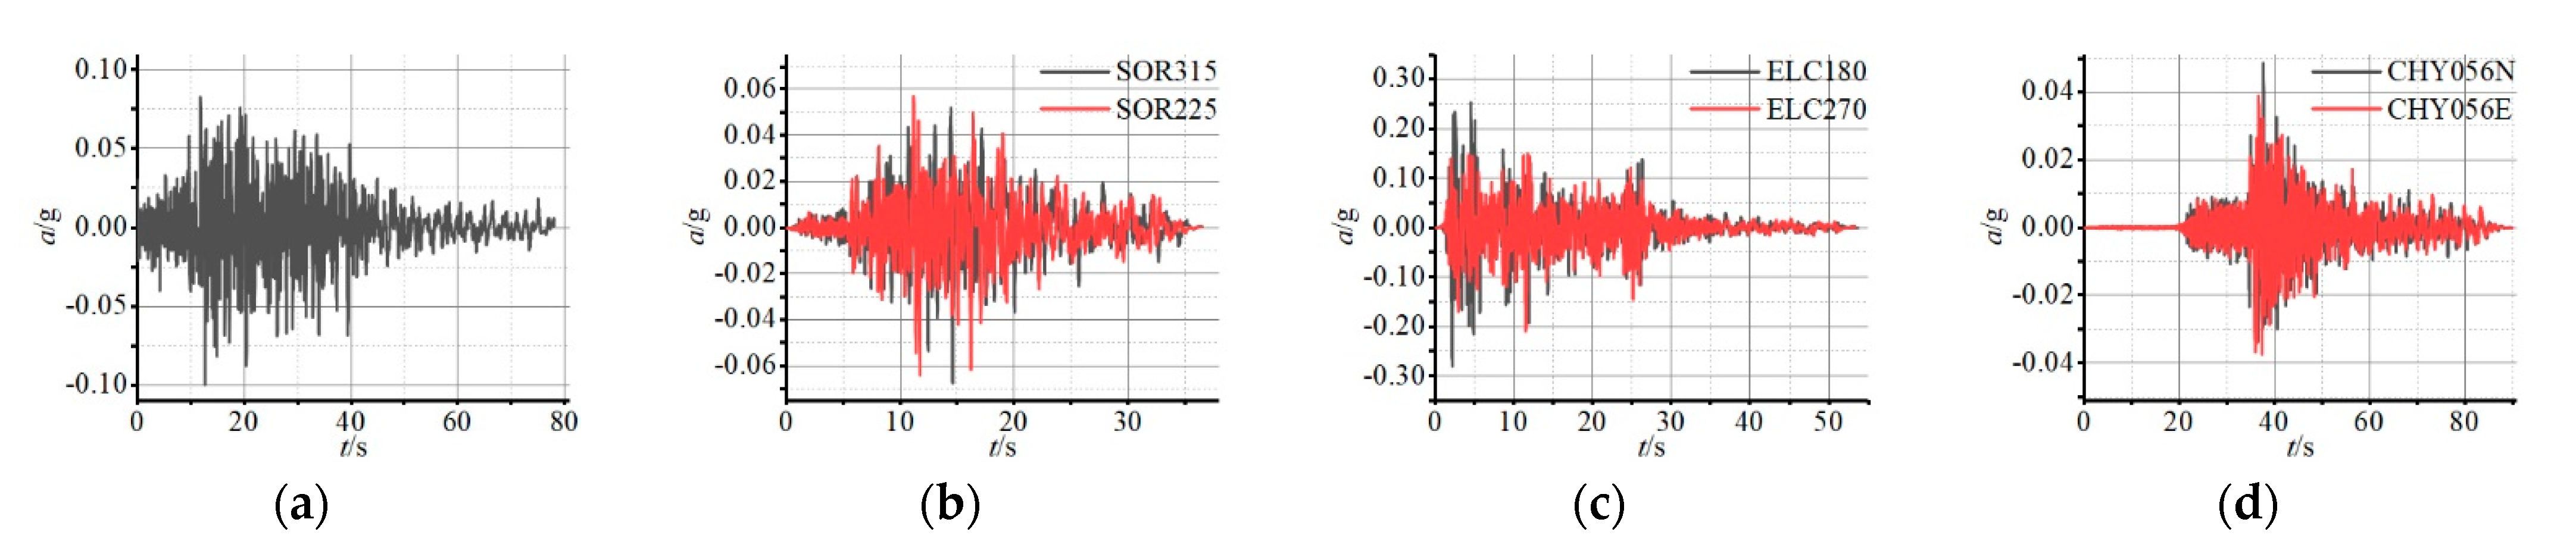
2.4. Input Ground Motions
According to China’s seismic code [29], buildings in seismic areas should have the ability to withstand earthquakes of minor, moderate, and major levels. The corresponding 50-year probabilities of exceedance for those different hazard levels are approximately 63.2%, 10%, and 2%, with the return periods of 50, 475, and 2475 years, respectively. In specific terms, when a building is designed to resist a minor (frequent) earthquake, it should be intact or only slightly damaged; when subjected to an earthquake of design intensity (i.e., a moderate earthquake), it is expected to be damaged but can still be serviceable after limited repair; finally, in the event of a major (rare) earthquake, the building should neither collapse nor suffer life-threatening damages.
In compliance with these codified requirements, one artificial ground motion wave and three natural seismic records were used as the input excitations for the test structure, as shown in Table 4. The RGW wave, dominated by low-frequency long-period components, was generated by fitting the design response spectrum specified in [29]. The acceleration-time history curves of these selected ground motions are plotted in Figure 6.
Table 4.
Input ground motions for the shake table testing.
Figure 6.
Acceleration-time history curves of the selected ground motions: (a) RWG; (b) Northridge; (c) El Centro; (d) Chi-Chi.
2.5. Instrumentation
An array of accelerometers (66 in total) along the X, Y and Z directions of the test structure were installed, at its centroid and at the four corners of each floor. In addition, linear variable displacement transducers (LVDTs) were deployed at the base beam of each floor to measure the vibration displacement of the specimen.
In order to monitor the dynamic strain response of the walls and embedded CFSTs near the ground level, strain gauges were attached to each steel tube of the interior T-shaped wall, and of the L-shaped wall in the southwest corner, as marked in Figure 7. In addition, strain gauges were mounted on the concrete surface of the aforementioned walls. Therefore, a total of 13 strain monitoring points were established.
Figure 7.
Positions of the strain gauges on the first-story walls (S# is the number of strain gauges).
2.6. Loading Protocol
The shaking table testing was conducted in four phases (I~IV), with increasing magnitudes of input ground motions corresponding, in turn, to the frequent, moderate, and rare levels of intensity 7, and all the way to the rare level of intensity 8. In each phase, the four seismic waves aforesaid were successively input as multi-directional excitations into the test structure, thus resulting in a total of 28 loading cases, as summarized in Table 5. Moreover, the low-amplitude white-noise loading cases were applied to the structure to obtain its changes in dynamic characteristics.
Table 5.
Input excitations in the shake table testing.
In the tests, the effect of prior seismic damages on subsequent responses was not particularly considered, just as in previous shaking table tests (e.g., [22,30,34]).
3. Test Results
3.1. General Observations
Based on the inspections during the course of testing, the damage progression of the test structure can be summarized as follows:
- (1)
- After the excitations equivalent to the frequent level of intensity 7 (Phase I, PGA below 0.1 g), no visible cracks were found on the concrete surface of the entire test structure. The results of the white-noise test (i.e., W2 in Table 5) also indicated that after this level of shaking, the first three natural frequencies of the specimen were reduced only slightly, by 4.88%, 5.39%, and 4.41% in turn, compared to the results of W1. Thus it can be said that the FSFW structure was well within the elastic state in this phase, satisfying the performance objective (remaining almost undamaged) specified by the seismic design code [29];
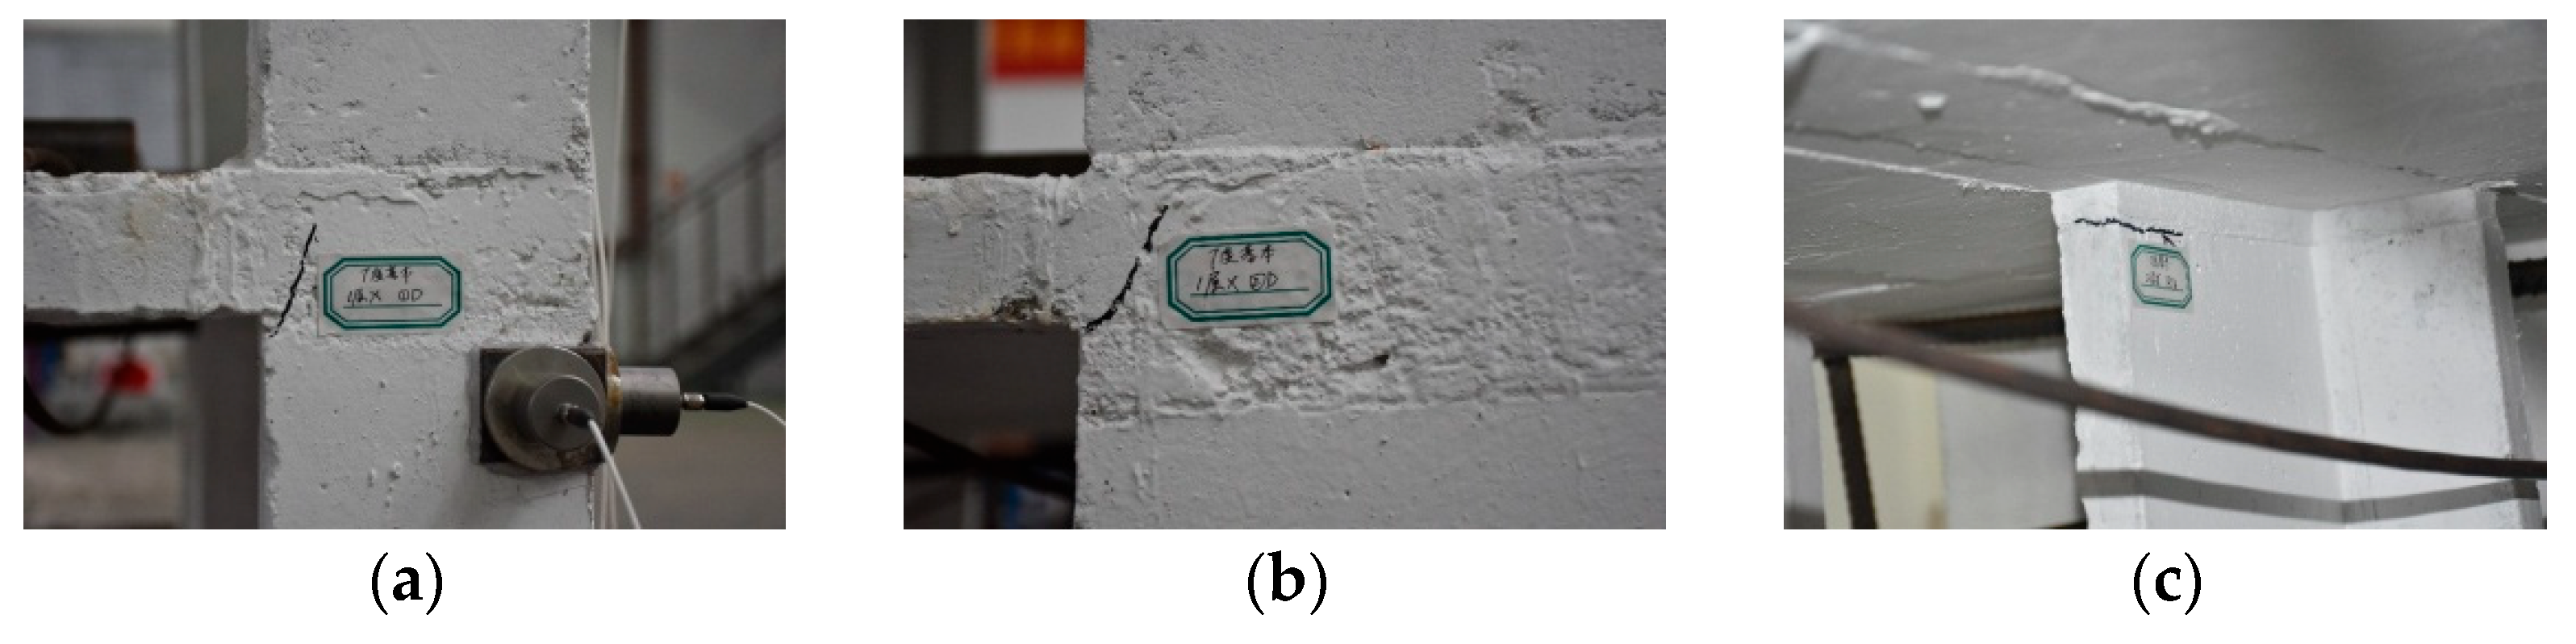
- (2)
- Upon the loadings equivalent to the moderate level of intensity 7 (Phase II, the design intensity, with PGA ≤ 0.25 g), the white-noise test (W3) indicated that the natural frequencies were reduced by 17.38%, 14.26%, and 8.65%, relative to those obtained after Phase I. As shown in Figure 8, a few minor cracks were observed in this stage, mainly concentrated on the first and second stories, in the vicinity of slab-wall connections. Nevertheless, those visible damages were generally not severe, and still within the expected damage level stipulated by the seismic code;
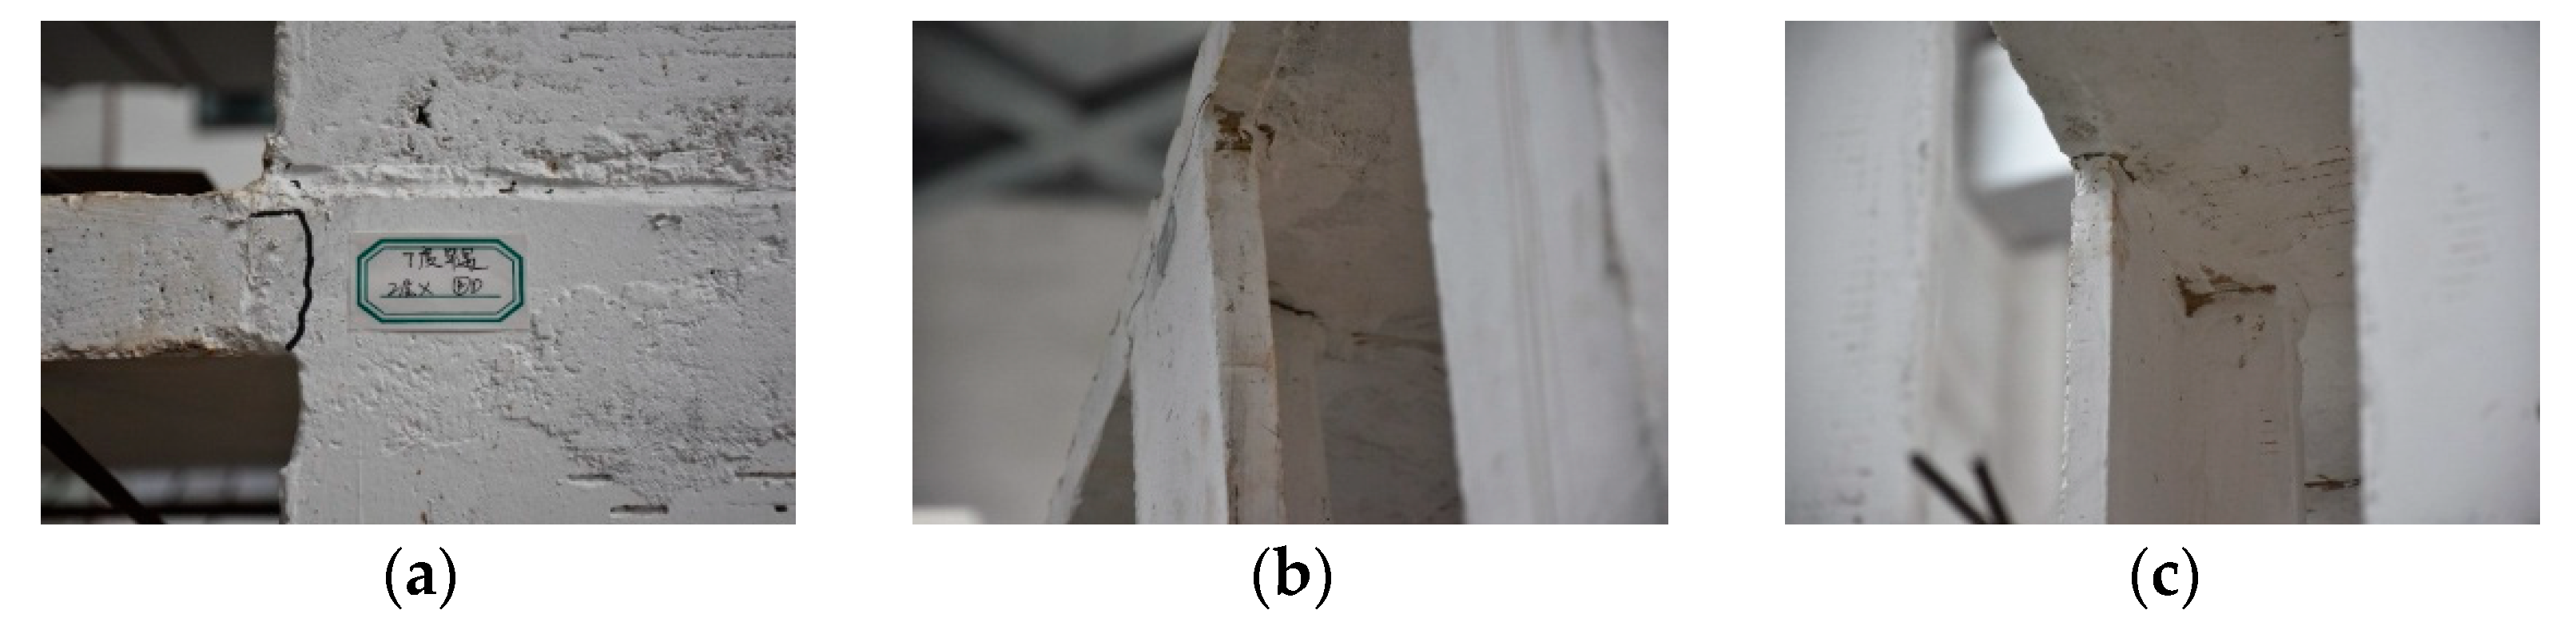
Figure 8. Damages after excitations of the moderate level of intensity 7 (Phase II): (a) a crack at a slab-wall connection; (b) another similar crack; (c) a crack on an L-shaped wall. - (3)
- After a series of shaking representing the rare level of intensity 7 (Phase III, PGA ≤ 0.50 g), the natural frequencies were dropped by 25.17%, 26.37%, and 13.89%, with respect to the prior white-noise test (W3). As shown in Figure 9, cracks formed in the previous phase now extended and widened; new cracks were also observed. However, the structure still performed well, though some local damages were appreciable;
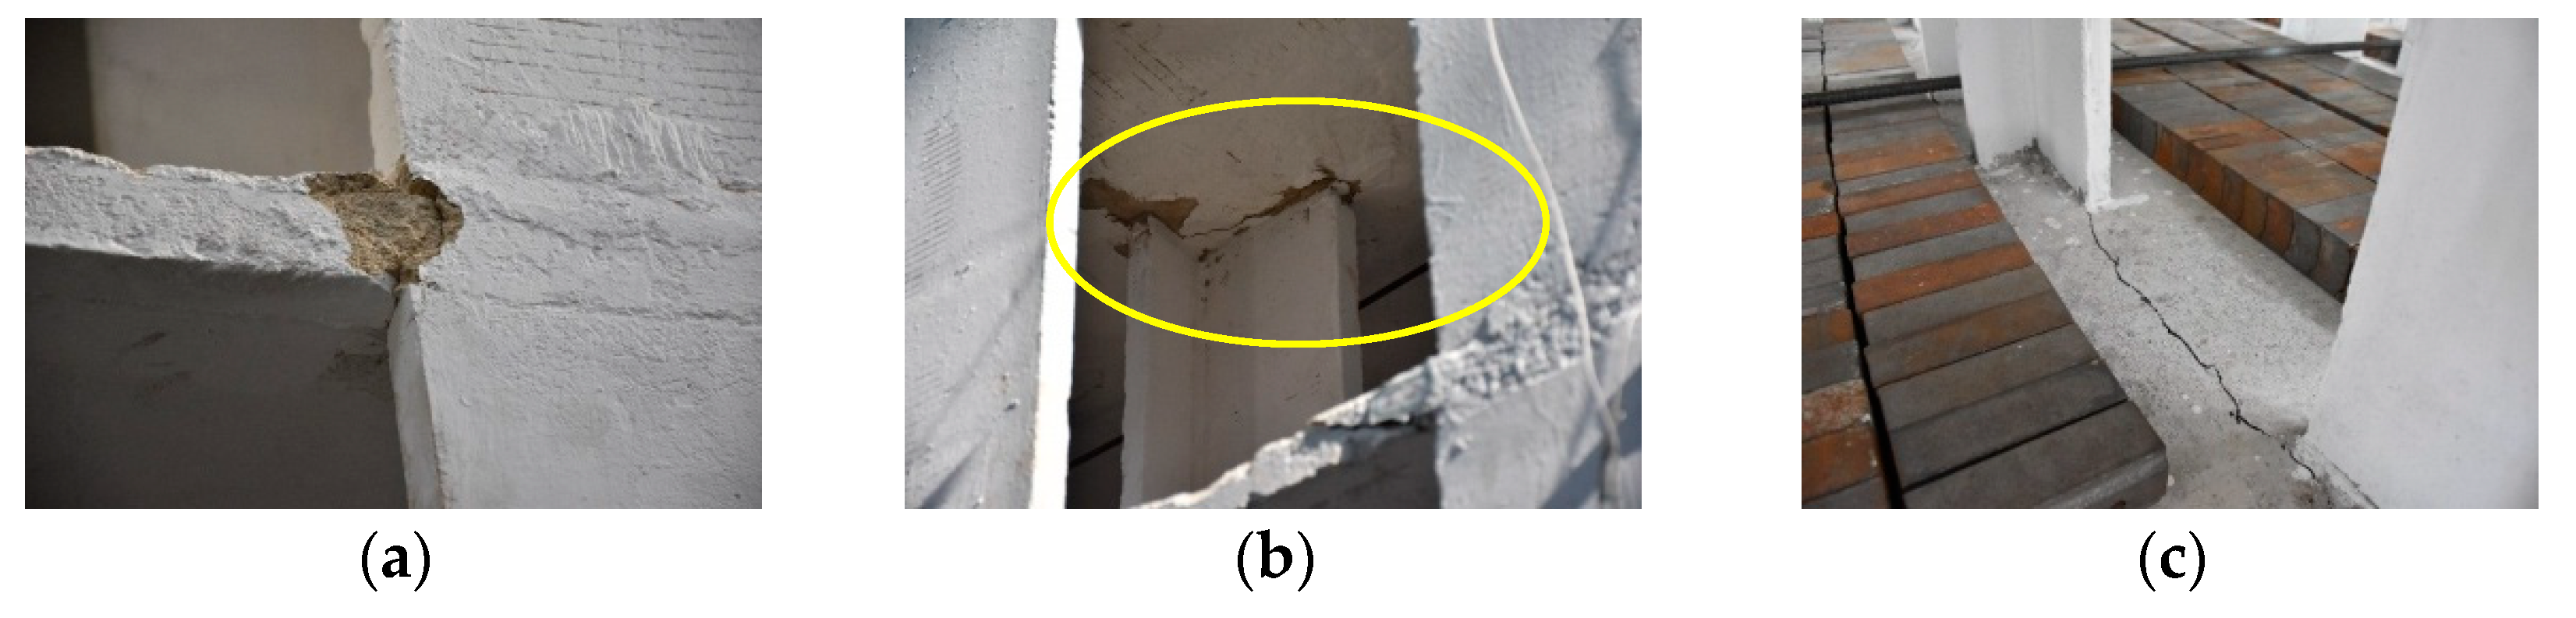
Figure 9. Damages after excitations of the rare level of intensity 7 (Phase III): (a) an extended interface crack; (b) slight crushing of a T-shaped wall; (c) interior view of the structure. - (4)
- To look at how the structure would fare under extremely strong earthquakes, excitations equivalent to the rare level of intensity 8 were exerted on the test structure (Phase IV, PGA ≤ 1.0 g). At the end of this final phase, the first three natural frequencies were decreased by 10.14%, 10.81%, and 17.36% in turn, in comparison with the previous measurements (W4). This suggested a further reduction in the structural stiffness. As shown in Figure 10, previous damages developed more severely. At the proximity of some slab-wall connections, spalling of concrete was obvious (Figure 10a,b). Several cracks even spread from one wall pier to another along the slab (Figure 10c). However, the structure and the walls still remained stable. Neither obvious tilt nor distortion of the specimen was noticed. It can therefore be concluded that the tested FSFW structure was able to resist the rare earthquakes far stronger than the design intensity.
Figure 10. Damages after excitations of the rare level of intensity 8 (Phase IV): (a) crushing at the interface; (b) slab damages around a T-shaped wall; (c) a crack extending from one wall to another.
3.2. Variation of Dynamic Characteristics
Spectral analysis of the white-noise test results was performed to identify the dynamic characteristics of the test structure in different phases. The variations of the frequency and period of the specimen are shown in Table 6.
Table 6.
Dynamic characteristics of the test structure in different phases.
From this table, it is clear that as the excitation intensity increased, the main frequencies of the specimen decreased (as expected), signifying a reduction in the overall structural stiffness. In comparison with the intact structure, in Phase III (the rare level of intensity 7), the value of the first frequency decreased by as much as 40%. This significant loss was in correlation with the observation of severe local damages in the specimen. However, after the devastating seismic inputs (i.e., the rare level of intensity 8), the further loss in the frequency was only marginal (by about 47% compared with the initial value before the test). This could be attributed to most damages being localized only in the vicinity of certain slab-wall connections, whereas the composite walls themselves still performed well. As a result, this prevented the progression of failure into the walls. Note that according to Ramos and Hube’s numerical simulations [7], a local failure of floor slabs has only a limited impact on the collapse behavior of FSFW structures. This is partly corroborated by the current real testing.
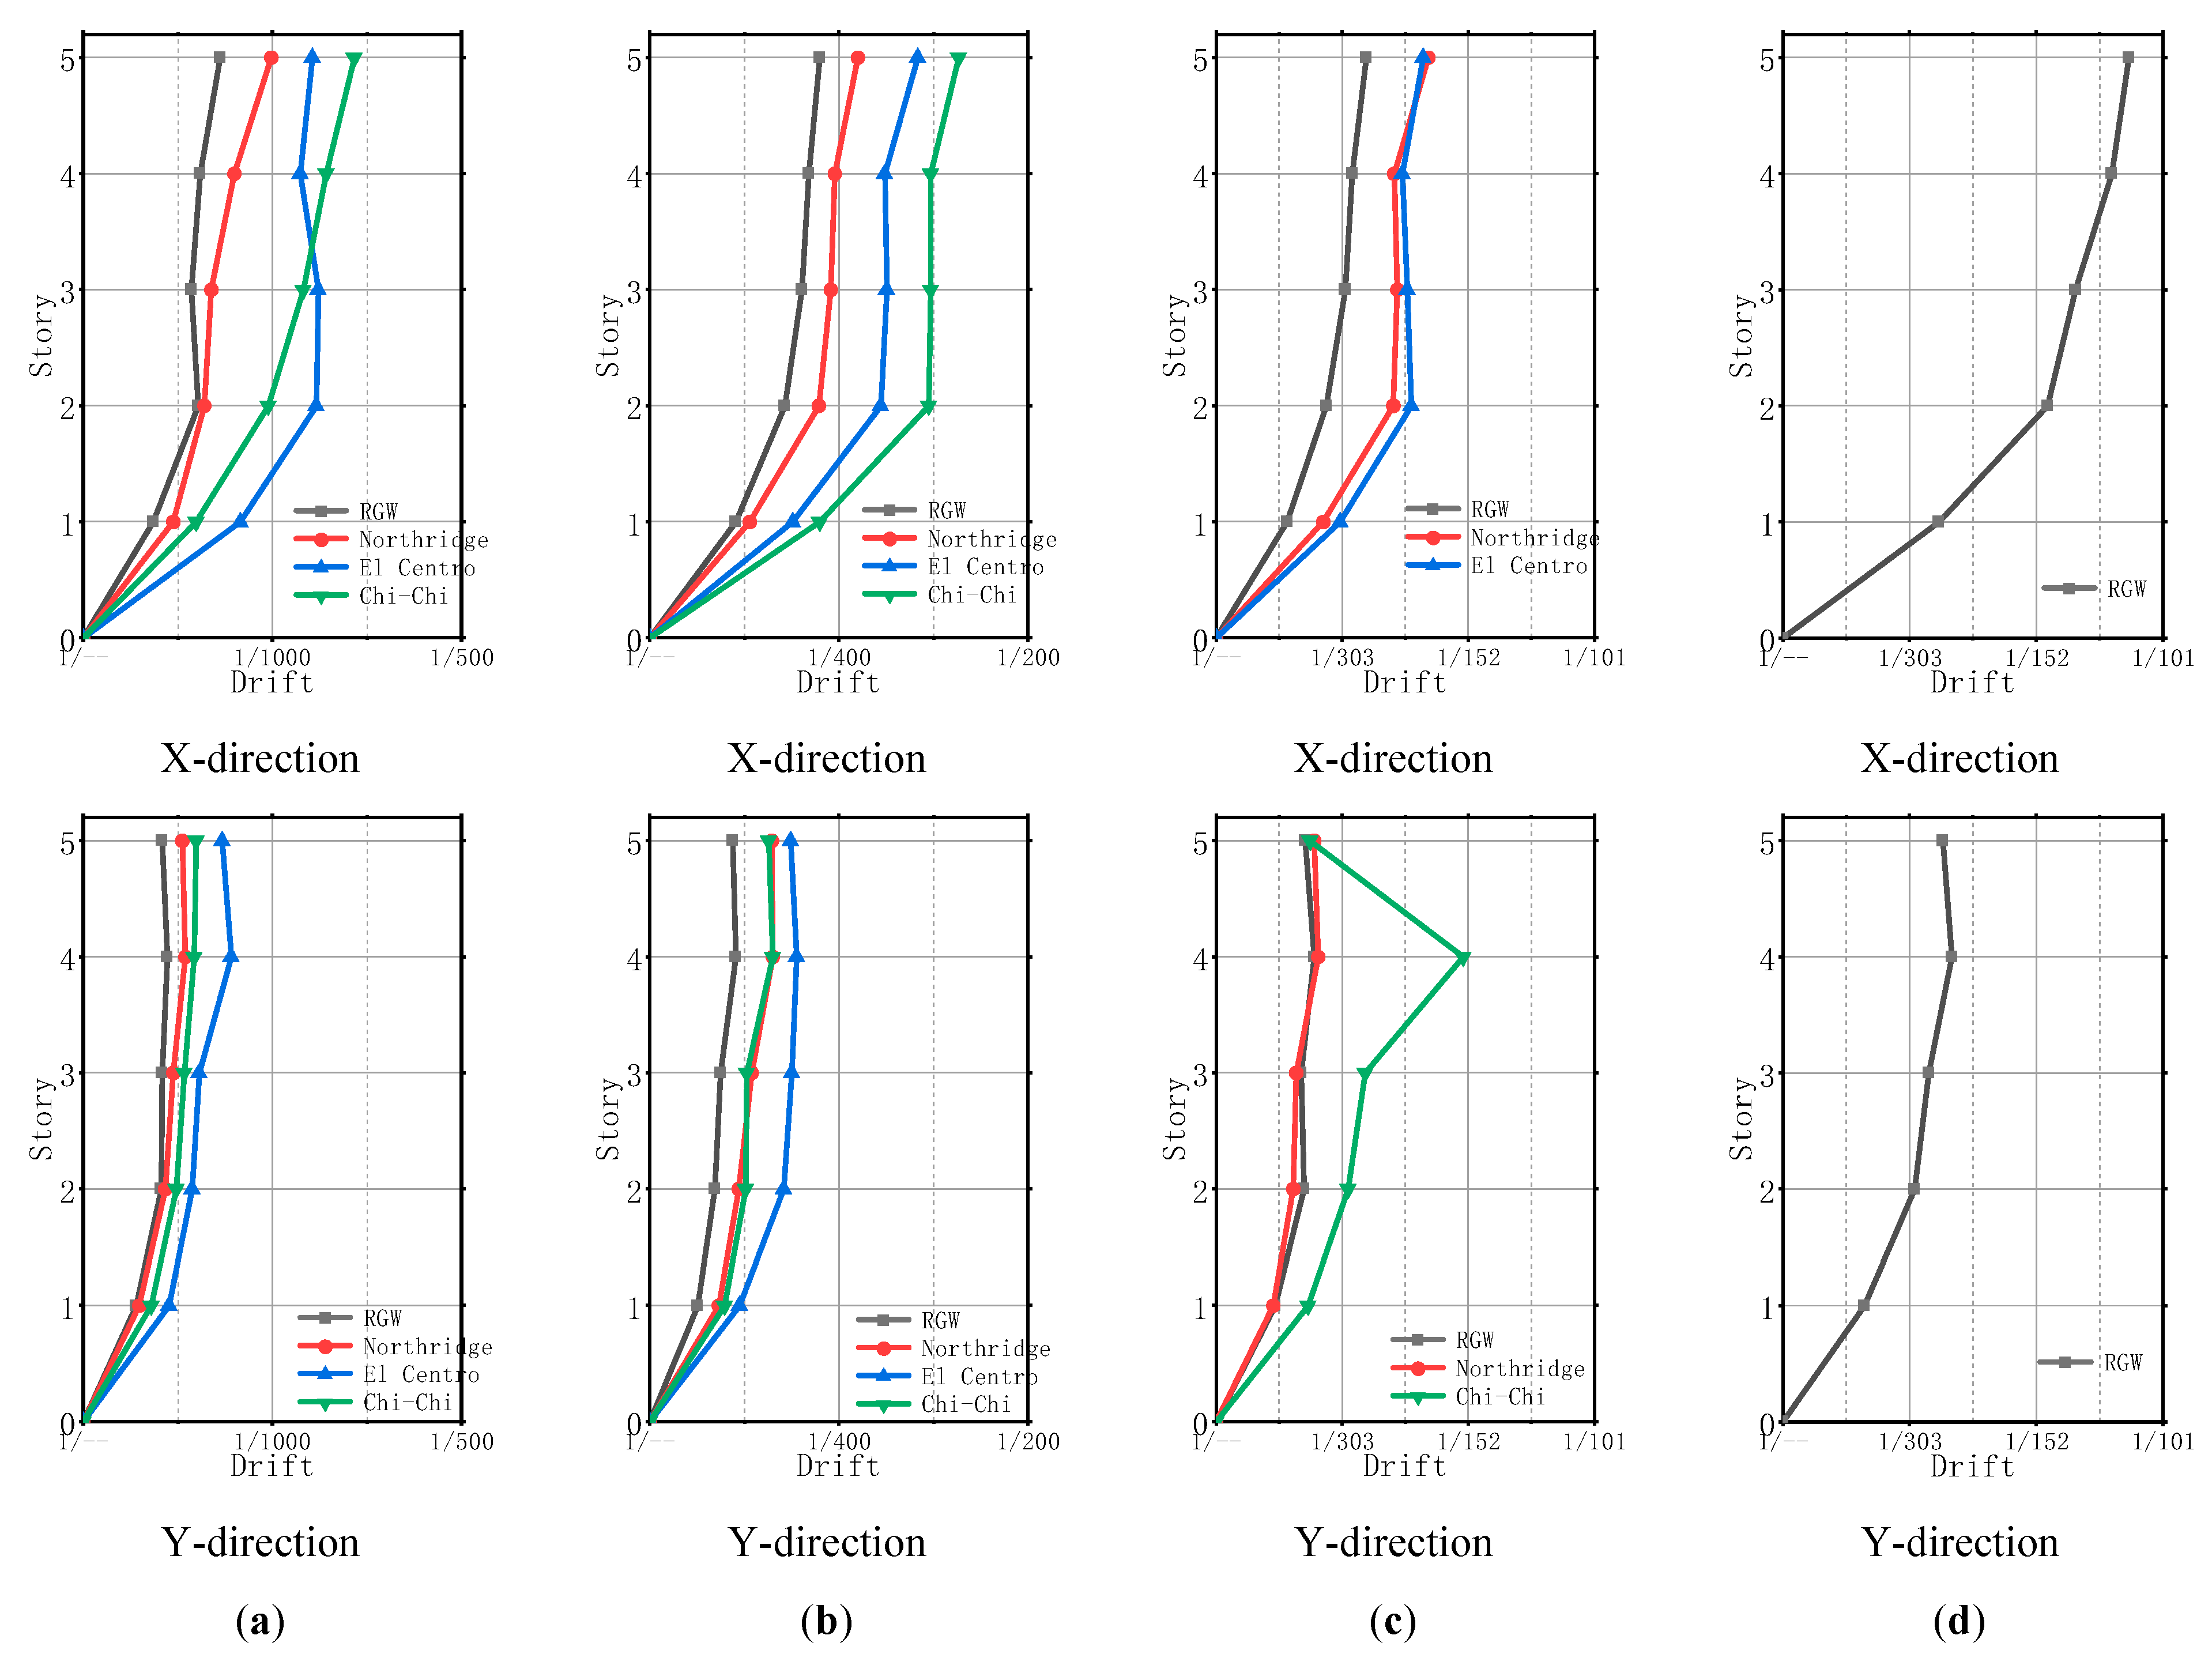
3.3. Drift Ratio Envelope
The inter-story drift ratio is one of the most useful engineering demand parameters (EDPs) that is routinely used to evaluate the overall seismic performance of structures. The envelope diagrams of the inter-story drift ratio along the test structure’s height in different testing phases are shown in Figure 11.
Figure 11.
Development of inter-story drift ratio envelope: (a) Phase I; (b) Phase II; (c) Phase III; (d) Phase IV.
As per China’s seismic code [29], the drift ratio limits for the slab-wall structure are 1/800 and 1/100 under frequent and rare earthquakes, respectively. Clearly, in Phase I the maximum drift ratio was significantly lower than the limit of 1/800, with the exception of the loading case of Chi-Chi seismic wave along the X-direction. This indicates that, overall, an elastic response was exhibited for the specimen. More favorably, in Phase III, and even in Phase IV, the maximum drift ratios were still well below 1/100. This apparently met the performance objective of preventing structural collapse under major (or even larger) earthquakes. In fact, the excessive lateral drift of flat-slab systems has long been a concern [35]. In this experiment, due partly to the strengthening effect of CFSTs, the lateral deformations of the FSFW structure were satisfactorily controlled.
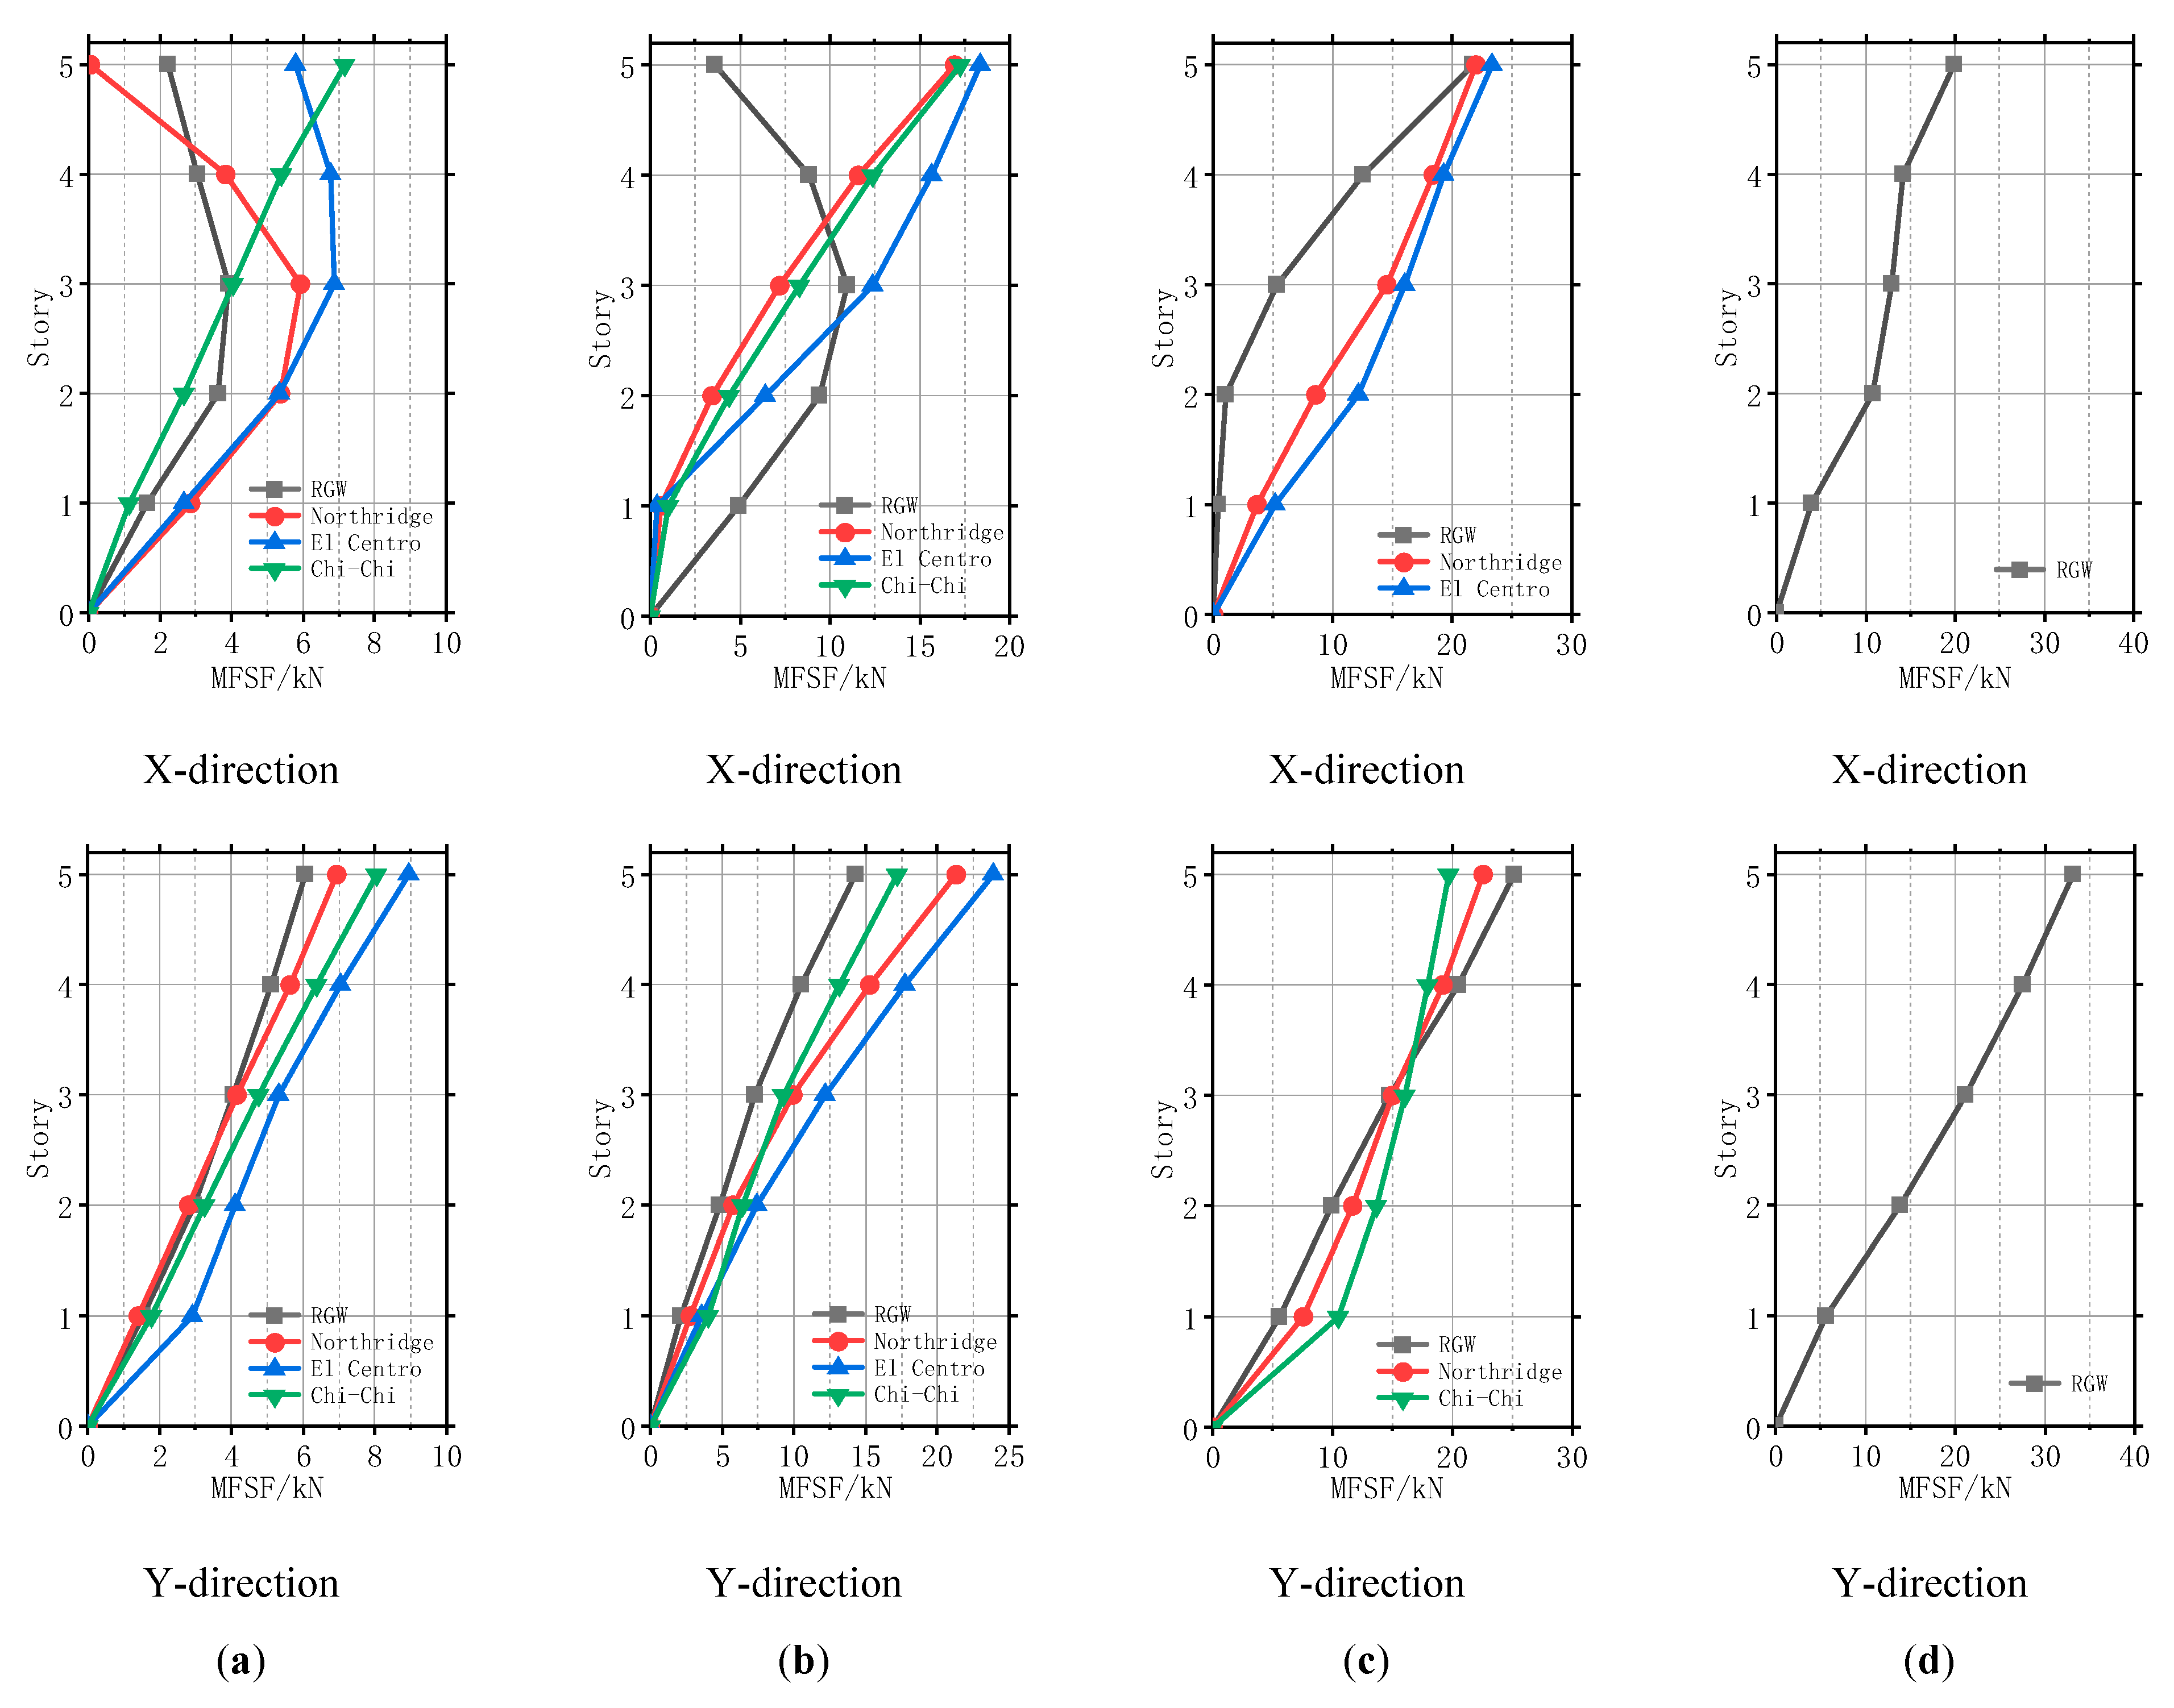
3.4. Maximum Floor Shear Force
The maximum floor shear forces (MFSFs) registered in different testing phases are shown in Figure 12. It is evident that different earthquakes produced different magnitudes of MFSFs. The MFSFs along the Y-direction were generally larger than those along the X-direction. That was because the lateral stiffness along the Y-direction was stronger. Moreover, from Phase III to Phase IV, the MFSFs below floor 4 along the X-direction increased significantly, whereas the corresponding shears along the Y-direction increased more gradually and proportionally, showing a better seismic-resisting capacity.
Figure 12.
Development of MFSFs: (a) Phase I; (b) Phase II; (c) Phase III; (d) Phase IV.
The MFSFs increased along the height of the structure, particularly in the later testing phases. Due to the so-called ‘whiplash’ effect [36], the dynamic response at floor 5 was slightly amplified when the specimen entered into the inelastic state. The MFSFs, nonetheless, were proportionally distributed along the height in most excitation cases; no weak story was formed in the tests.
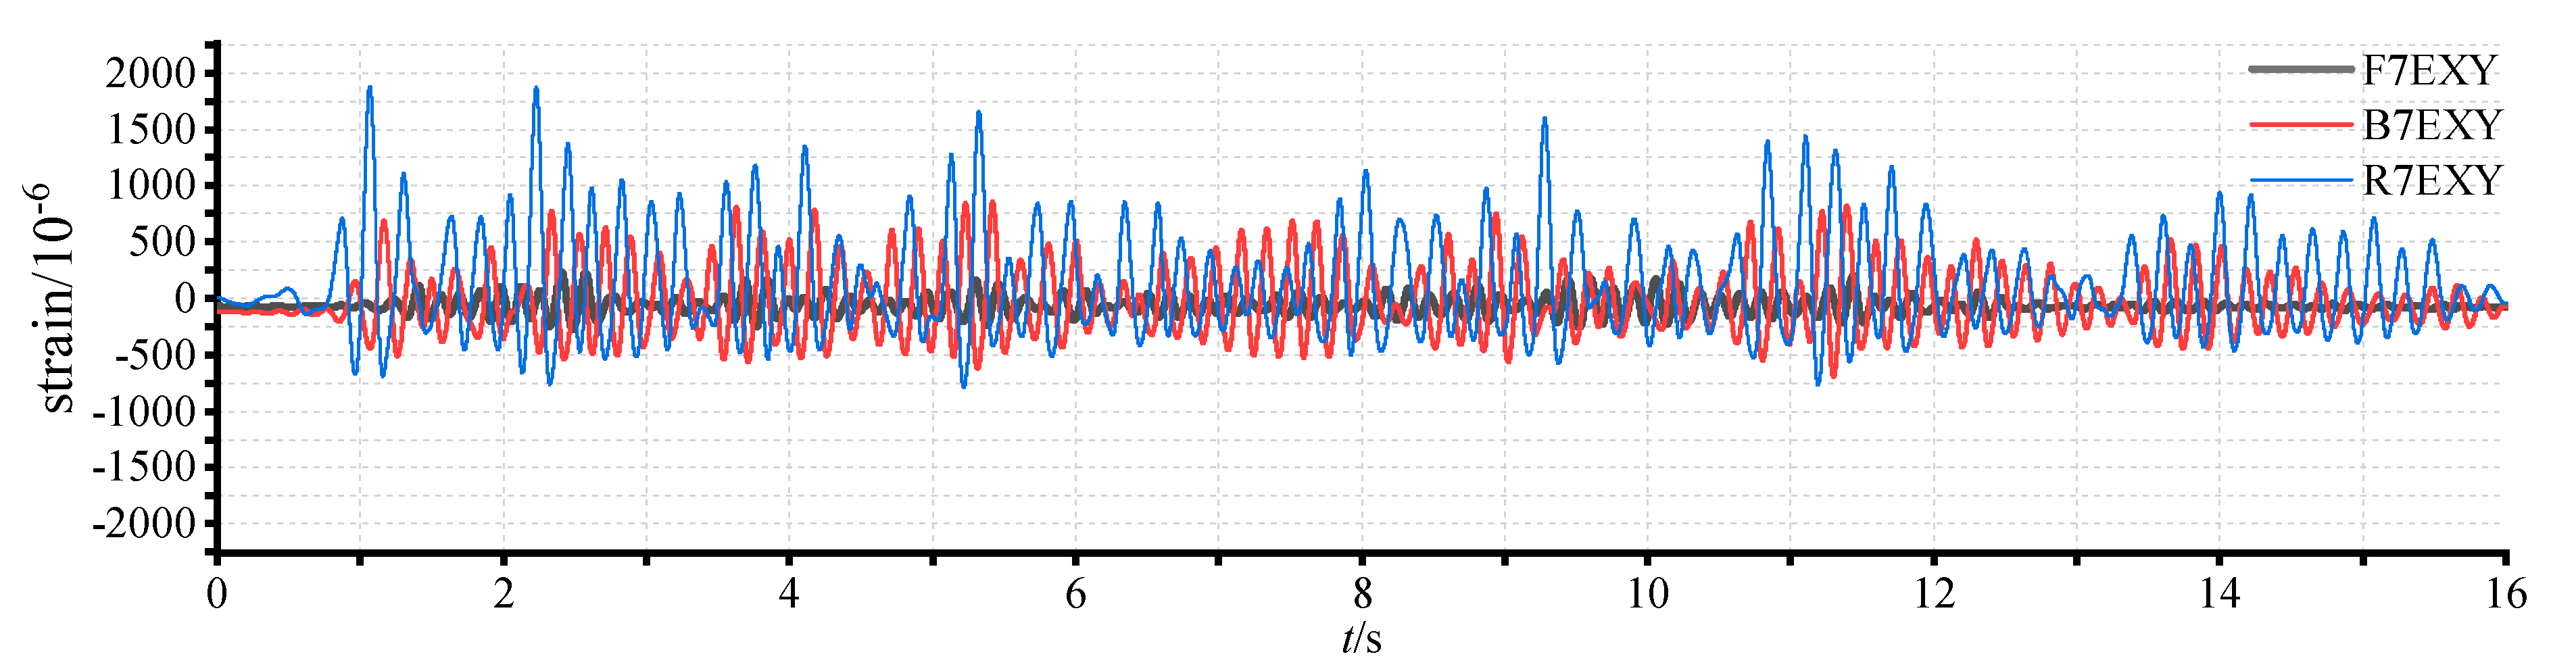
3.5. Strain Response of CFSTs
As mentioned previously, a total of nine measuring points (S1~S9, see Figure 7) were set up to monitor the strains of the CFSTs. Figure 13 and Figure 14 compare the strain developments at S8 and S9, which corresponded to the web–flange intersection and boundary positions of the L-shaped wall indicated in Figure 7.
Figure 13.
Comparison of time-history responses of strain at S8 under different loading cases.
Figure 14.
Comparison of time-history responses of strain at S9 under different loading cases.
The yield strain of the steel tubes used in the CFSTs was roughly 1500 × 10−6. Clearly, in the case of the frequent level of intensity 7 (F7EXY in the figures), the strains at S8 and S9 were well within the elastic range. With the increase in excitation intensity, the strains increased markedly. Under the excitation equivalent to the moderate level of intensity 7 (B7EXY), the steel at S8 attained the yield strain, but that at S9 did not. This highlighted the larger strain demand at the web–flange intersection of the corner of the L-shaped wall. For the loading case of R7EXY (the rare level of intensity 7), both strains at S8 and S9 exceeded the yield strain, indicating the full mobilization of the CFSTs to resist lateral loads.
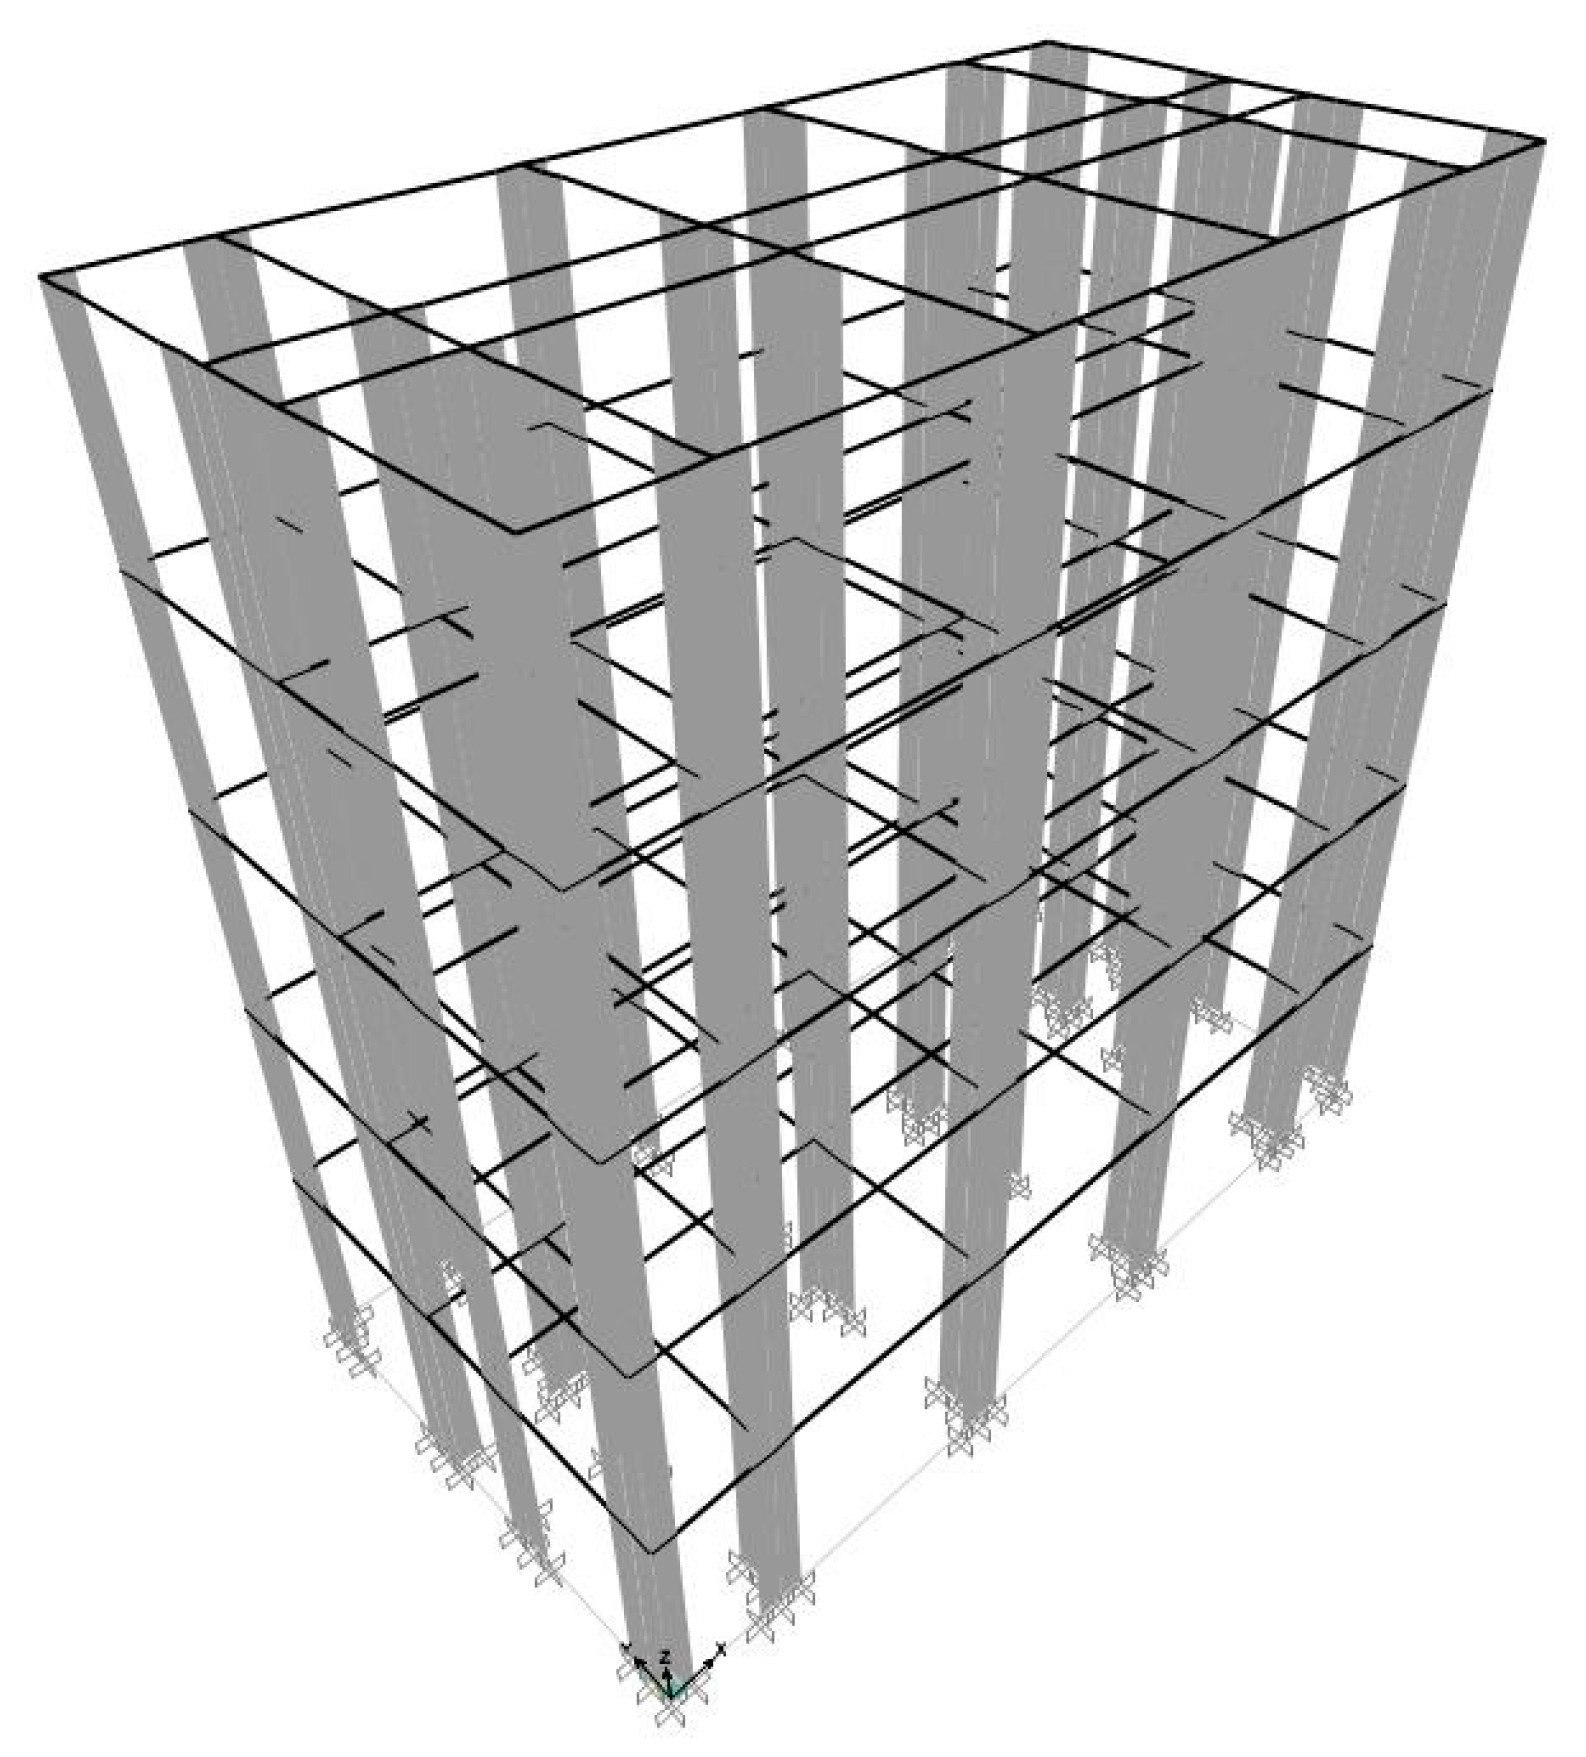
4. Numerical Modeling
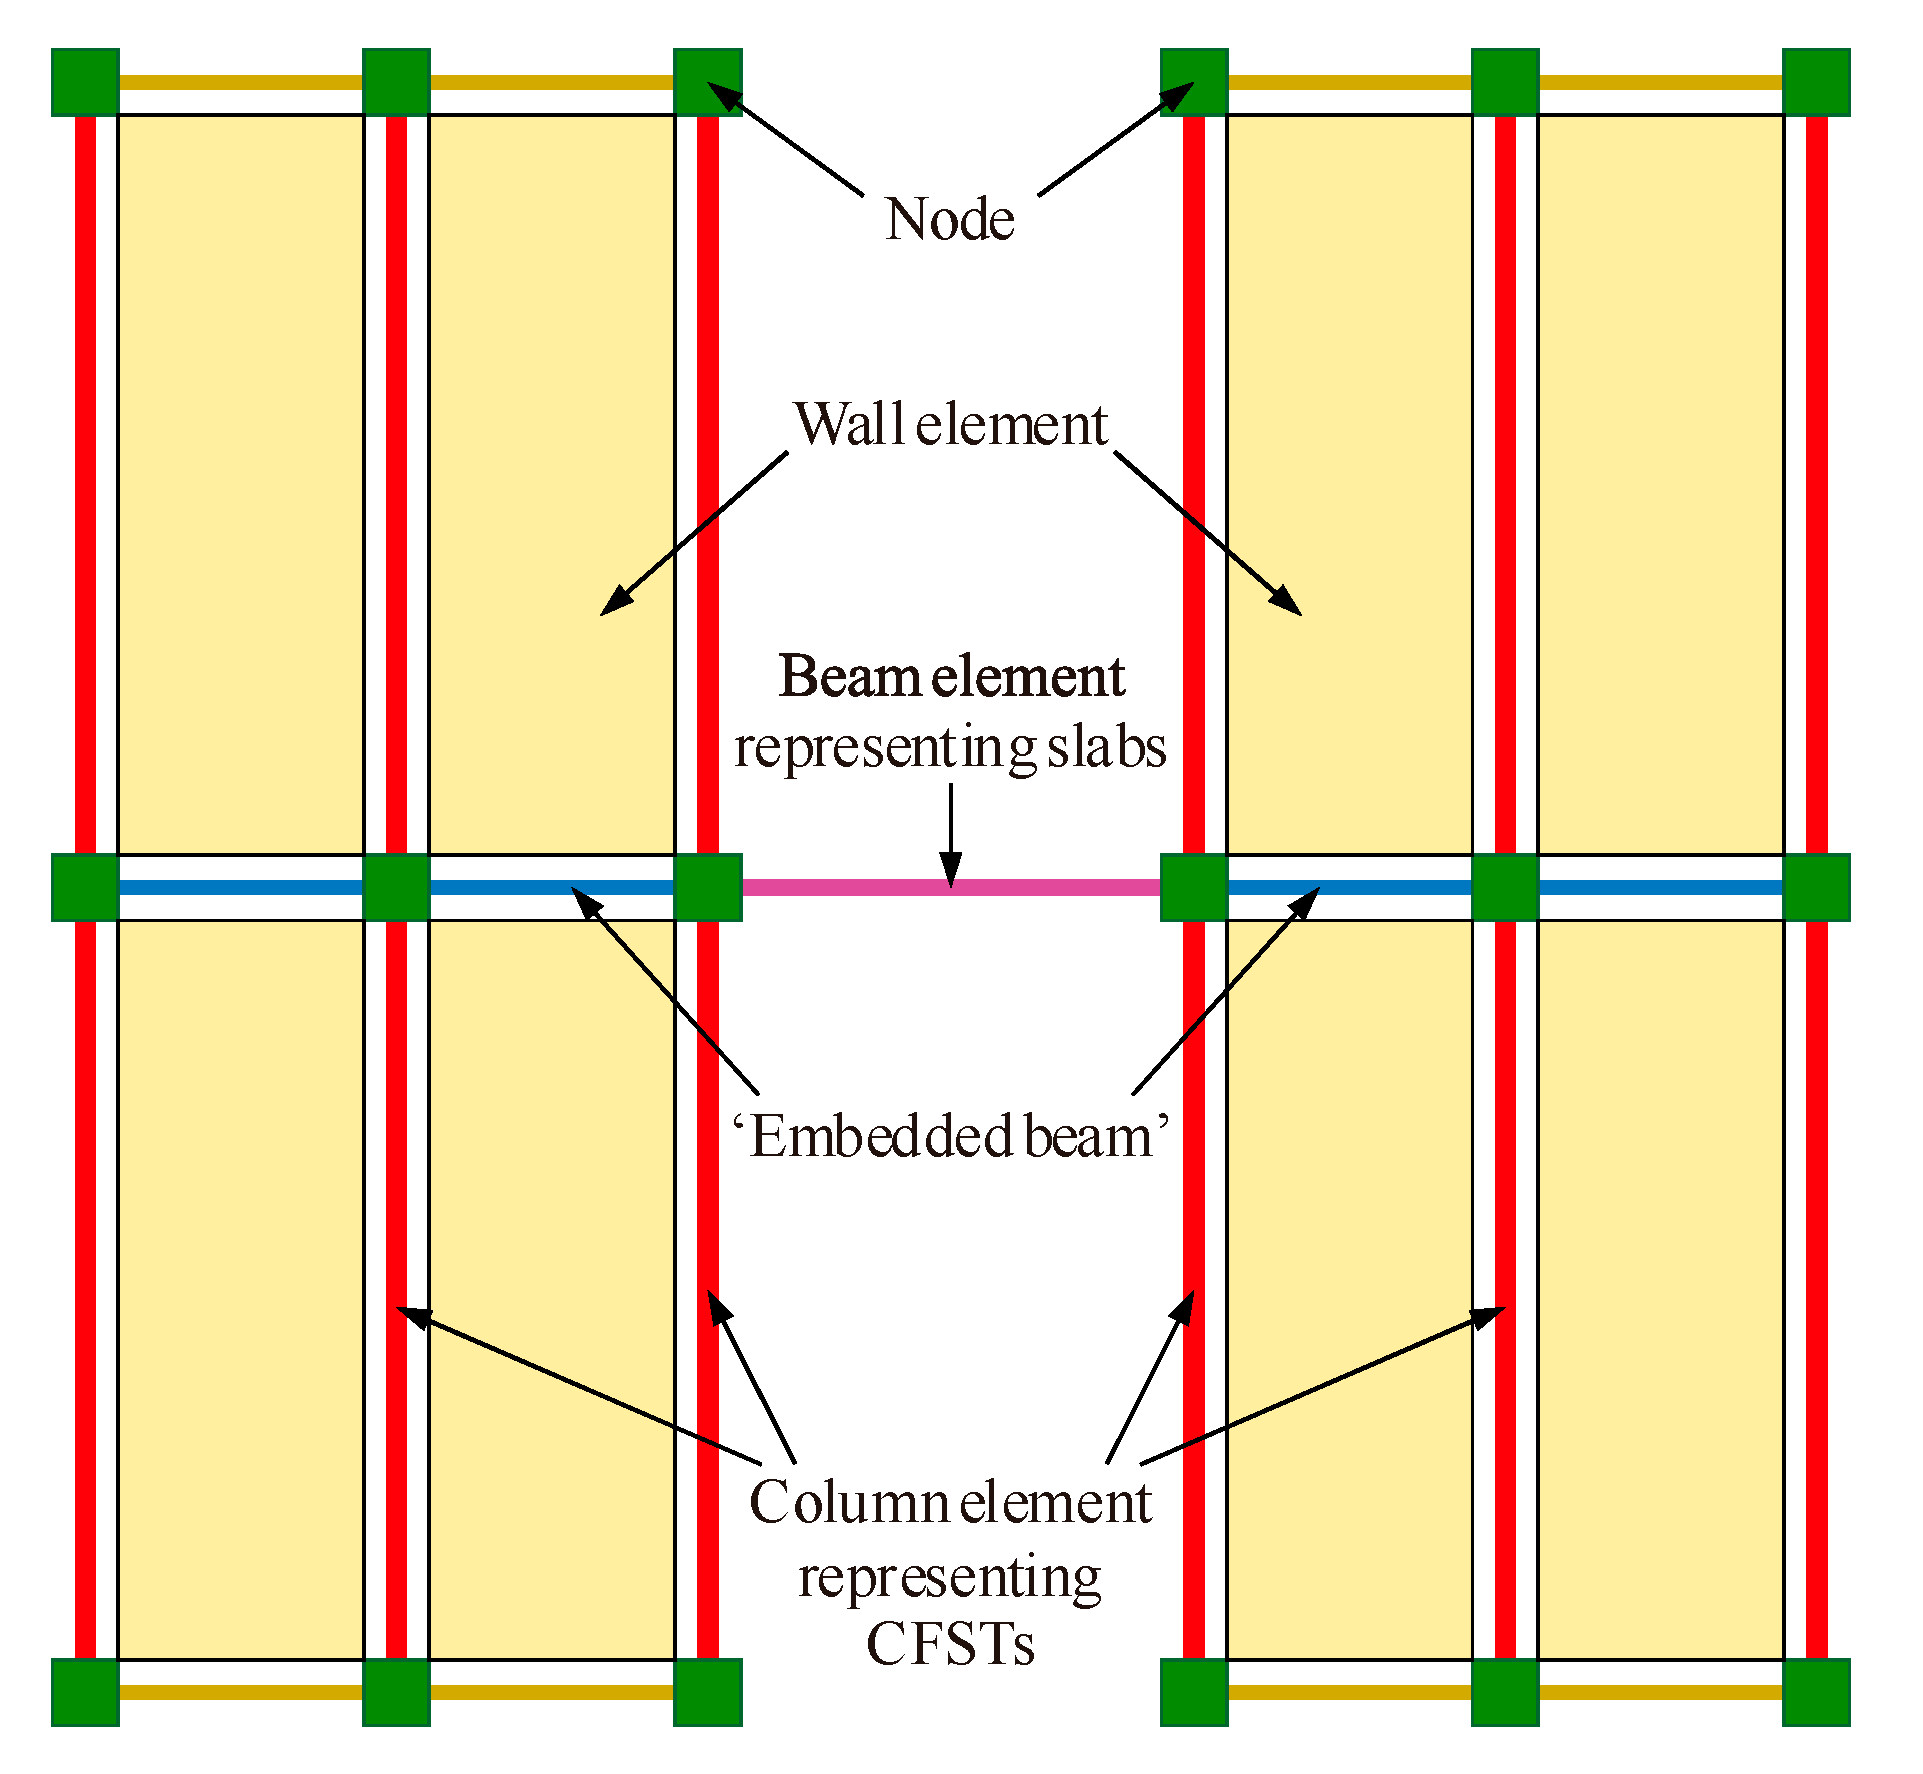
4.1. General Descriptions of Modeling
A 3D non-linear finite-element (FE) model for the test structure was developed using the software PERFORM-3D [37]. The specially-shaped walls were modeled using the 4-node ‘General Wall’ element available in PERFORM-3D, which simplifies non-linear area elements intended for the specific purpose of modeling RC walls [38]. The cross-section of each wall pier was represented by fibers that account for the axial-bending non-linear interactions, but is uncoupled from the shear response.
No element is provided in PERFORM-3D for modeling the composite walls with embedded CFSTs. Thus an ad hoc treatment was adopted in this study. The two-noded fiber-based column (line) elements available in PERFORM-3D were used to model the individual CFSTs in a wall pier, which were connected by the ‘embedded beam’ model [39] to ensure the deformation compatibility of the CFSTs in the same wall pier.
The flat floor slabs were modeled using the elastic beam elements with non-linear hinges. This modeling approach has been proven to have adequate accuracy in capturing the overall out-of-plane non-linear response of floor slabs [13]. These equivalent beam elements have a rectangular section with its width and depth dimensions equal to the effective slab width and total slab thickness. In this study, the effective slab width was determined by the method recommended by Grossman [40]. This width was further multiplied by one-third to consider the impact of concrete cracking [13,40].
Figure 15 shows a schematic diagram of the FE elements used in this study. Figure 16 provides a 3D view of the test structure established in PERFORM-3D.
Figure 15.
Schematic diagram of the FE elements used in this study.
Figure 16.
Three-dimensional view of the structural model in PERFORM-3D.
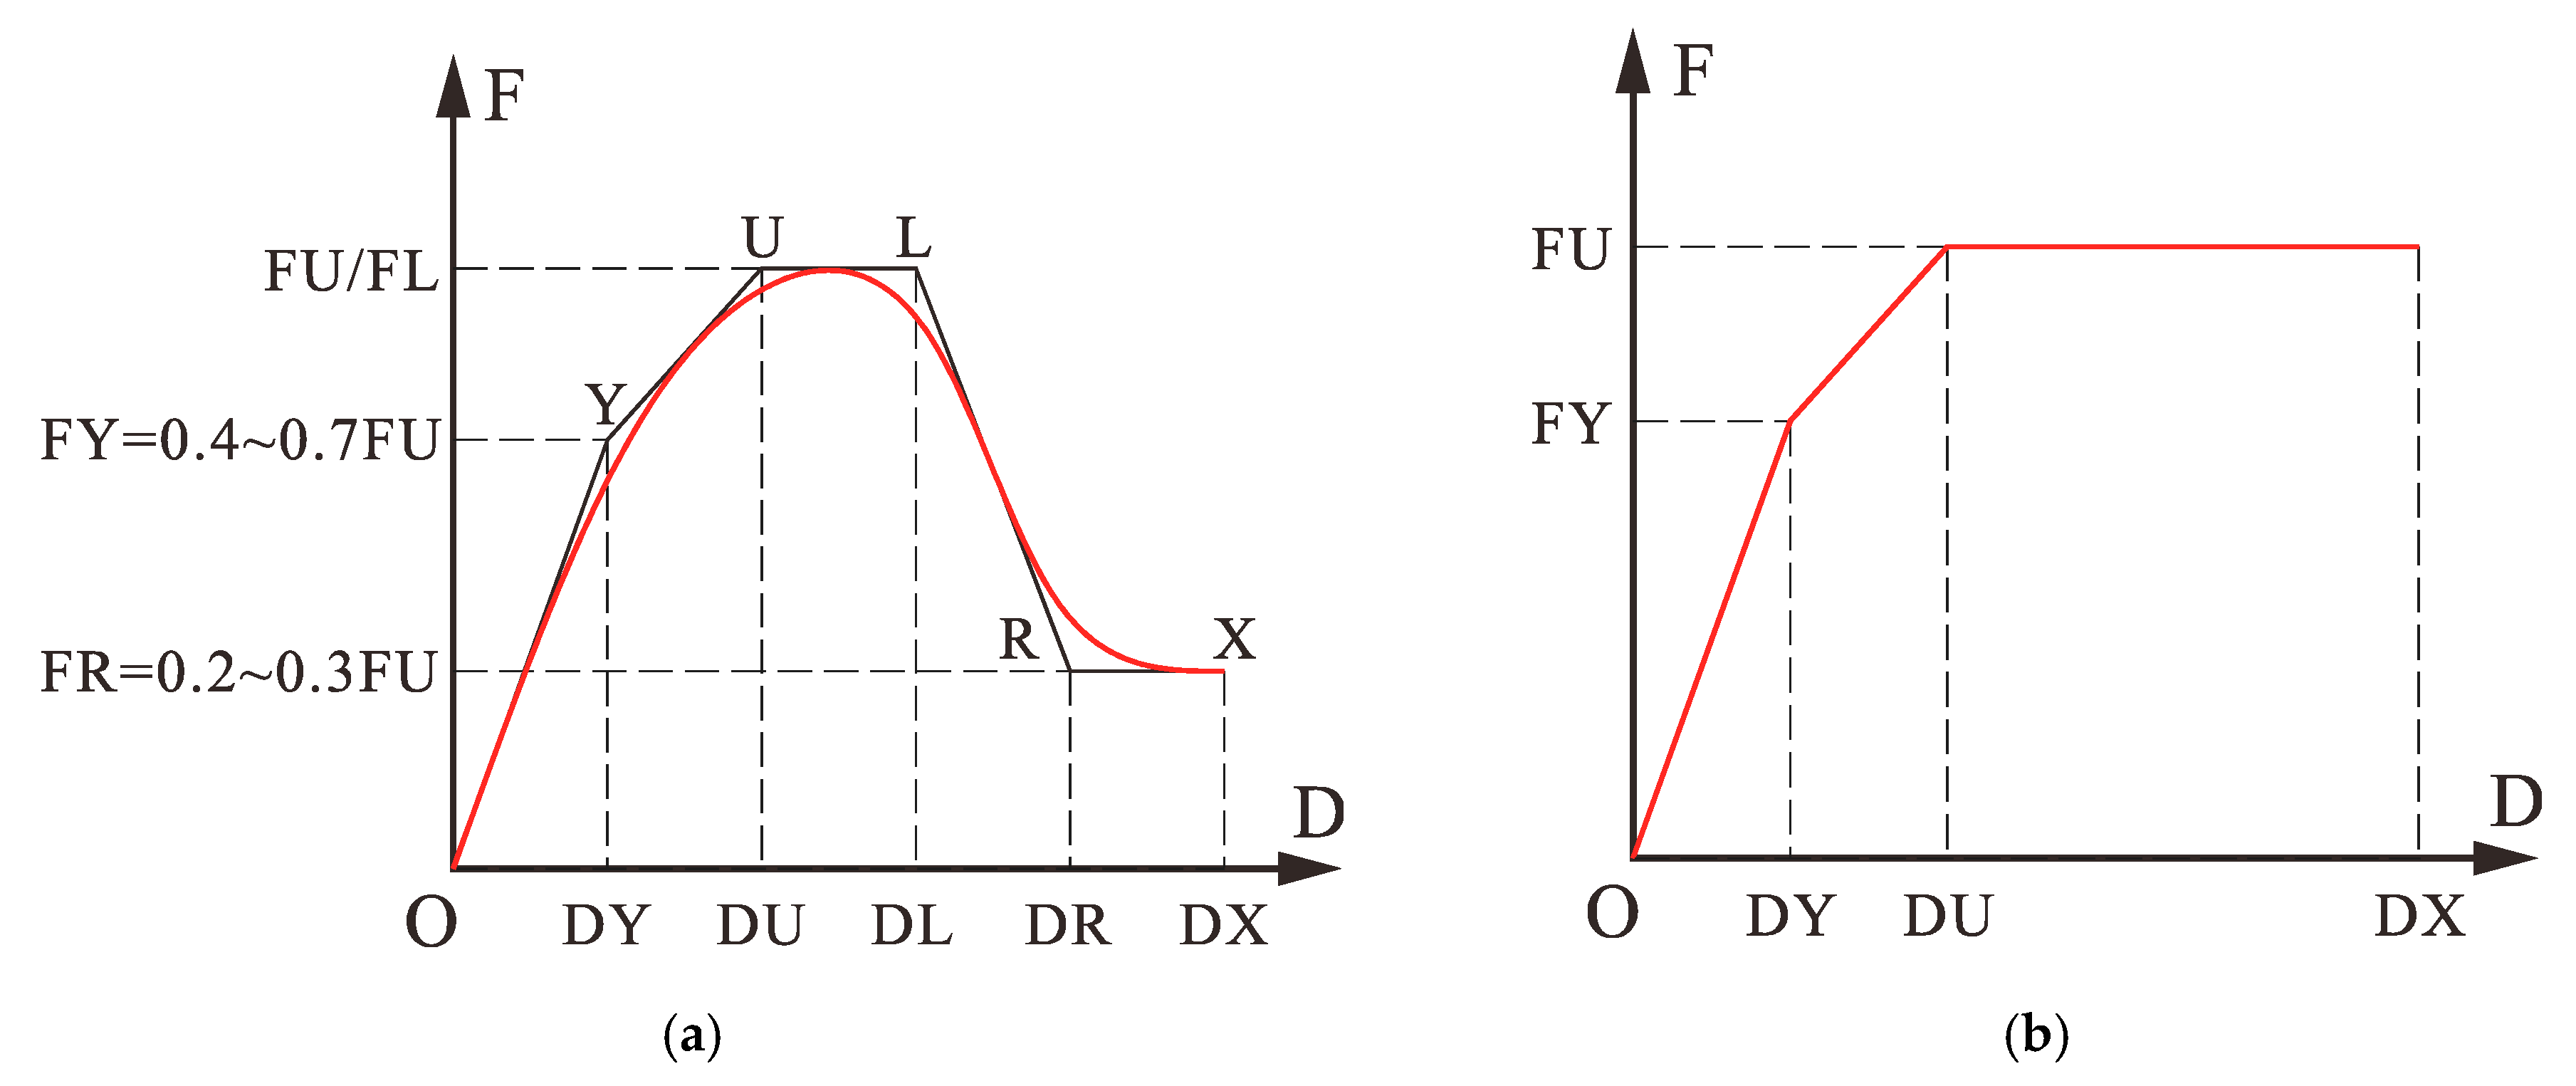
4.2. Material Constitutive Models
The concrete in CFSTs was represented by the model proposed by Tao et al. [41], which takes into account the confinement effect coming from the outer steel tube. The stress–strain relationship recommended in China’s concrete design code [31] was adopted for the concrete in other parts of the test structure; in other words, no confinement effect was considered in these cases. The steel materials used in the test structure (including steel tube and rebar) were represented by the tri-linear stress–strain model [42], ignoring local buckling effect.
Figure 17 illustrates the material constitutive models used for concrete and steel. Note that in PERFORM-3D, all generalized force–displacement (F–D) curves can only be composed of a specific number of line segments. In this study, the principle of equal area criterion (that is, the area under the line segments and the area covered by the constitutive curve are the same) was followed to determine the F–D curves for PERFORM-3D. The fitting diagram of the concrete’s constitutive relationship is shown in Figure 17a, and the tri-linear model for steel is shown in Figure 17b.
Figure 17.
Generalized F–D curves used in PERFORM-3D for: (a) concrete; (b) steel.
4.3. Modeling Results
The first three periods obtained by the FE analysis were 1.132s, 0.912s, and 0.830s, while the corresponding periods of the test structure were measured as 1.212, 0.862, and 0.822s, respectively. The errors between them were less than 7%. This suggests that the FE model closely matched the dynamic characteristics of the test structure.
Figure 18 compares the experimental and numerical time-history displacements at the roof along the X or Y directions under different loading conditions. It is clear that, in general, the calculated results agreed well with the experimental records. However, in the later testing phase (i.e., R7EXY in the figure), the numerical model overestimated the actual roof displacements. This may be due to the limitations of using PERFORM-3D to simulate shear walls, as discussed in depth in [43], or it might likely be ascribed to the excessive reduction in the effective width of the slabs adopted in the modeling. It is noteworthy that although simulations of shear wall buildings have been extensively investigated (e.g., [44,45,46,47]), there are still challenges to accurately reproduce their non-linear behavior, especially when the walls are severely damaged.
Figure 18.
Comparisons of the measured and calculated roof displacements in different loading cases: (a) F7EXY-X; (b) B7EXY-X; (c) R7EXY-X; (d) R7EXY-Y.
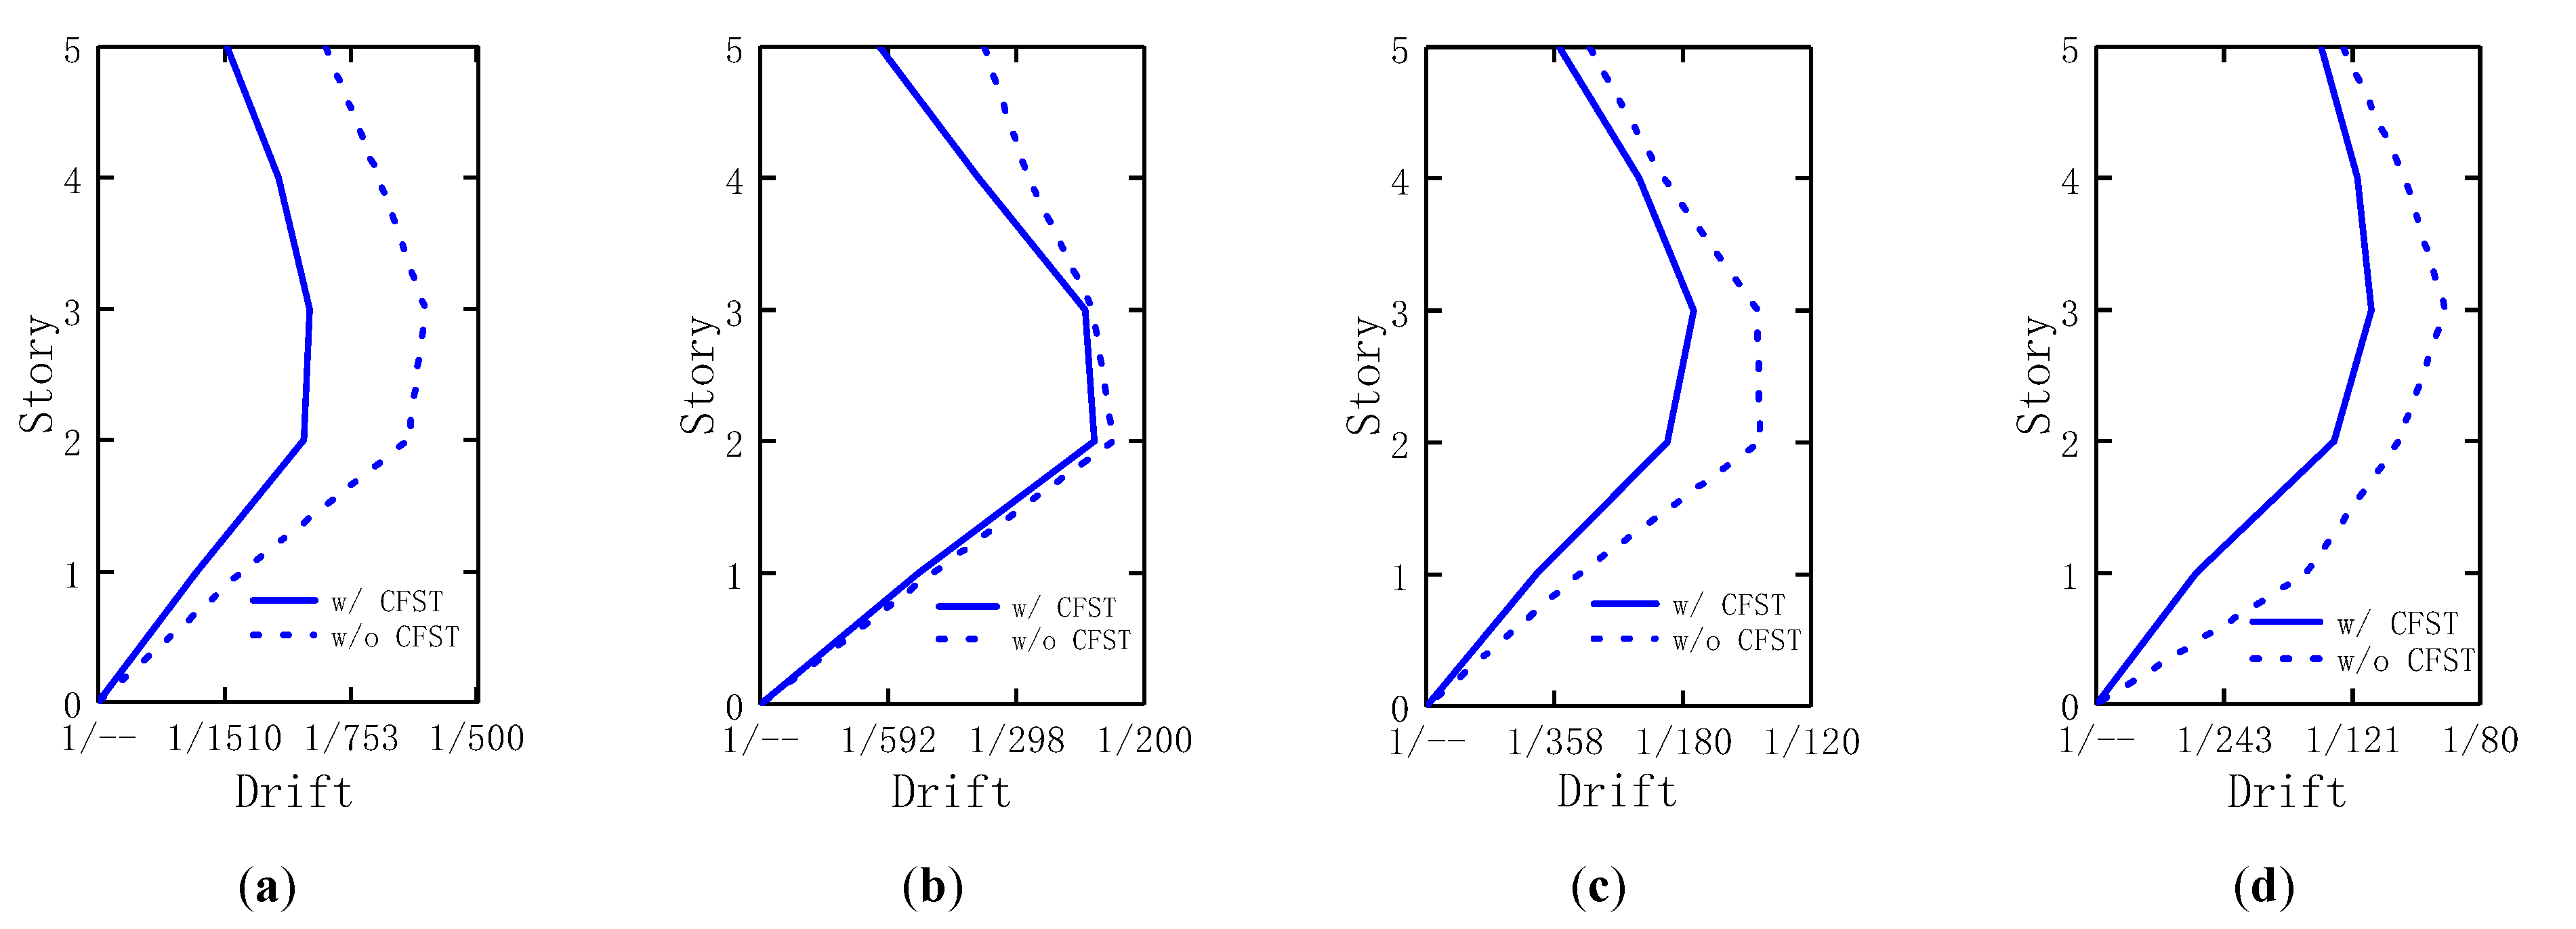
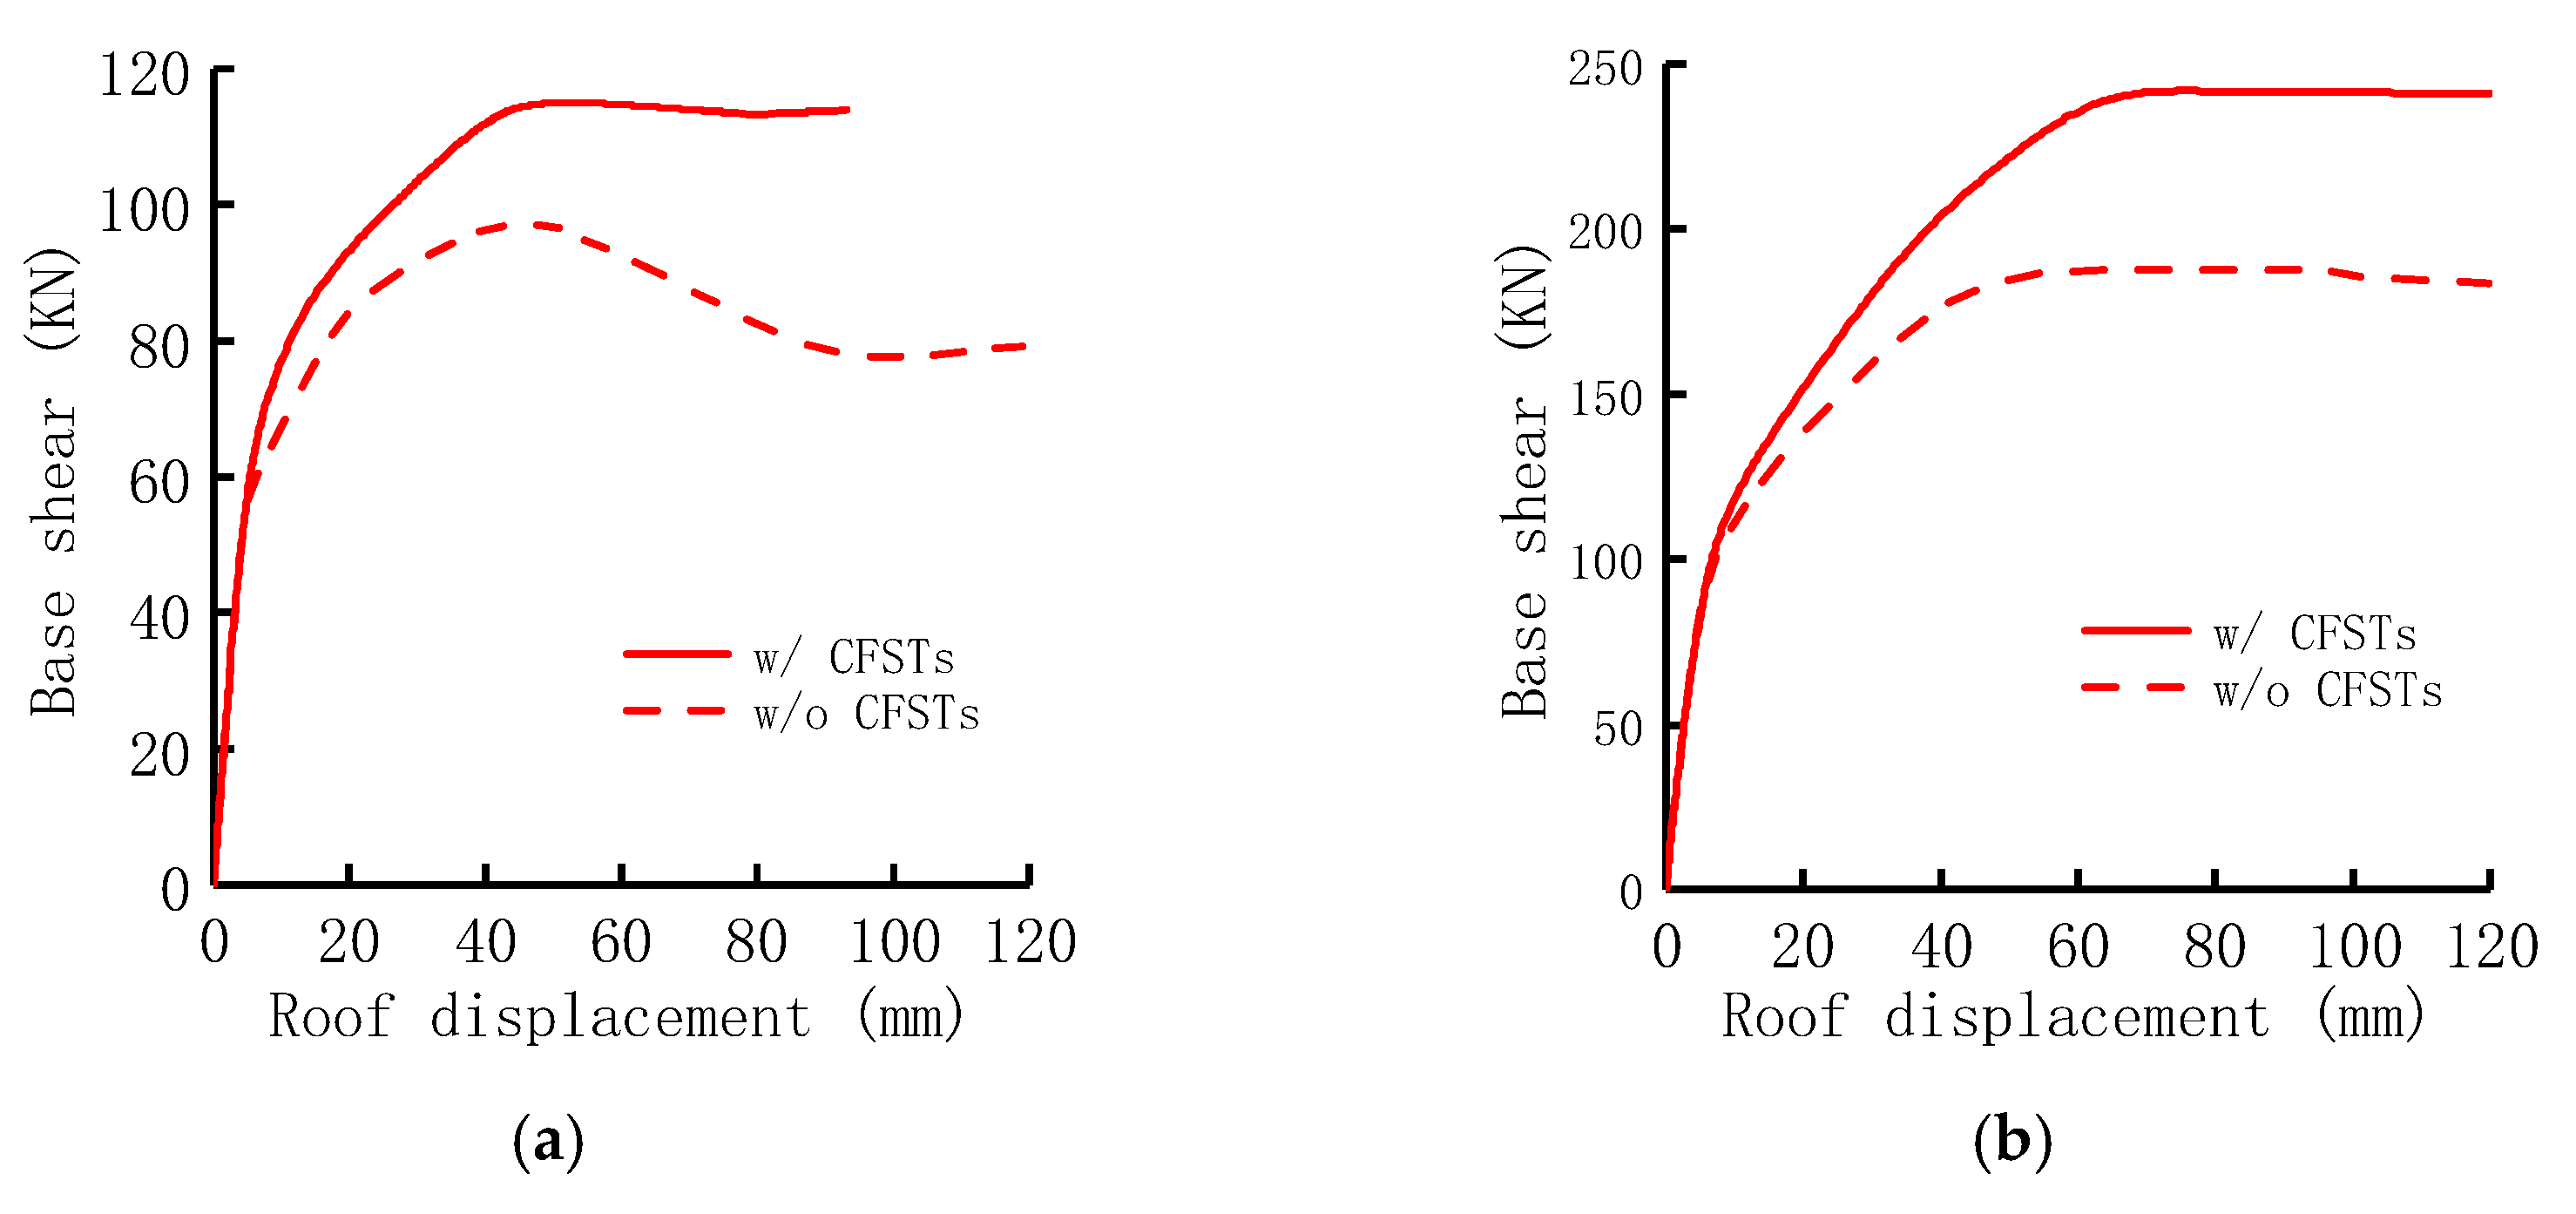
4.4. Comparison of FSFW Systems with and without CFSTs
Finally, to highlight the efficacy of CFSTs embedded in wall piers, two FSFW systems equipped with and without CFSTs were compared in terms of their seismic responses.
Figure 19 shows the comparison results for two scenarios (namely, two FSFW systems with and without CFSTs embedment) in terms of their inter-story drift ratio envelope in different loading cases. Obviously, the presence of CFSTs significantly reduced the lateral deformation of the test structure. In the case of small earthquakes (F7CXY-X), the inter-story drift ratio of the system without CFSTs exceeded the limit value of 1/800. Further, in the case R7NXY-X, the inter-story drift ratio of that system exceeded the limit value of 1/100. By comparison, the FSFW system incorporating CFSTs did meet all those lateral drift requirements.
Figure 19.
Comparison of inter-story drift ratio envelopes in different loading cases: (a) F7CXY-X; (b) B7EXY-X; (c) R7NXY-X; (d) R8RXY-X.
A push-over analysis was further conducted to see how the two systems could behave differently. A monotonically increasing horizontal force with an inverted triangular distribution was applied to the systems [48]. Figure 20 gives the push-over results along the X and Y directions. Despite their similar initial overall stiffness, the CFST-equipped system had considerably higher lateral load-carrying capacity than the system without CFSTs. This significant discrepancy clearly shows the utility of applying CFSTs in wall piers to resist seismic lateral loads.
Figure 20.
Push-over results along two main directions: (a) X direction; (b) Y direction.
5. Conclusions
In this paper, the results of a shake-table testing of a 1/8-scale five-story FSFW structure incorporating CFSTs as strengthening elements are briefly presented. Numerical modeling is also attempted to capture the structure’s non-linear time-history responses. Conclusions can be summarized as the following:
- (1)
- The application of CFSTs in flanged concrete walls helps to resist earthquake loads acting on the FSFW system. Consequently, the performance objectives specified in the seismic code are generally met, even under extremely strong earthquakes;
- (2)
- The seismic damage is mainly localized in the vicinity of slab-wall connections of the tested structure, which leads to a significant loss of natural frequencies (up to 47%). Clearly, these regions are the most vulnerable part of the FSFW structure. As such, detailing of the connections between the walls and slabs should be adequately considered and further addressed;
- (3)
- In spite of the above disadvantages, it is observed that the composite walls themselves performed fairly well, even when subjected to ground motions much stronger than the design intensity. This may partially explain why the FSFW model structure was still standing after the shake table tests;
- (4)
- A 3D non-linear FE model is developed to simulate the dynamic responses of the tested structure. Adopting the method suggested herein for modeling the embedded CFSTs, a good match is found between the FE results and the experimental observations. Nevertheless, a detailed description of the non-linear behavior of slab-wall connections and a rational representation of the floor contribution deserve further investigation.
Author Contributions
Conceptualization, X.-Y.Z., X.-D.F. and F.W.; methodology, X.-Y.Z. and F.W.; software, X.-Y.Z.; validation, X.-Y.Z.; formal analysis, X.-Y.Z. and F.W.; investigation, X.-Y.Z. and F.W.; resources, X.-Y.Z. and F.W.; data curation, X.-Y.Z., F.W. and J.Z.; writing—original draft preparation, X.-Y.Z.; writing—review and editing, F.W.; visualization, X.-Y.Z. and F.W.; supervision, F.W.; project administration, F.W.; funding acquisition, X.-Y.Z. and F.W. All authors have read and agreed to the published version of the manuscript.
Funding
This research was funded by Guangdong Provincial Key Laboratory of Modern Civil Engineering Technology, grant number 2021B1212040003; and by Architectural Design & Research Institute of SCUT Co. Ltd., grant number 2017-001.
Data Availability Statement
Data sharing is not applicable to this article.
Acknowledgments
The authors thank Ze-Rong Lai for his assistance in this study while pursuing his master’s degree.
Conflicts of Interest
The authors declare no conflict of interest.
References
- Paulay, T.; Taylor, R.G. Slab coupling of earthquake-resisting shearwalls. ACI J. Proc. 1981, 78, 130–140. [Google Scholar]
- Wallace, J.W.; Moehle, J.P. Ductility and detailing requirements of bearing wall buildings. J. Struct. Eng.-ASCE 1992, 118, 1625–1644. [Google Scholar] [CrossRef]
- Balkaya, C.; Kalkan, E. Three-dimensional effects on openings of laterally loaded pierced shear walls. J. Struct. Eng.-ASCE 2004, 130, 1506–1514. [Google Scholar] [CrossRef]
- Mwafy, A. Analytically derived fragility relationships for the modern high-rise buildings in the UAE. Struct. Des. Tall. Spec. 2010, 21, 824–843. [Google Scholar] [CrossRef]
- Mwafy, A.; Khalifa, S. Effect of vertical structural irregularity on seismic design of tall buildings. Struct. Des. Tall. Spec. 2017, 26, e1399. [Google Scholar] [CrossRef]
- Massone, L.M.; Sayre, B.L.; Wallace, J.W. Load–deformation responses of slender structural steel reinforced concrete walls. Eng. Struct. 2017, 140, 77–88. [Google Scholar] [CrossRef]
- Ramos, L.; Hube, M.A. Seismic response of reinforced concrete wall buildings with nonlinear coupling slabs. Eng. Struct. 2021, 234, 111888. [Google Scholar] [CrossRef]
- Massone, L.M.; Bonelli, P.; Lagos, R.; Lüders, C.; Moehle, J.P.; Wallace, J.W. Seismic design and construction practices for RC structural wall buildings. Earthq. Spectra. 2012, 28 (Suppl. 1), S245–S256. [Google Scholar] [CrossRef]
- Sritharan, S.; Beyer, K.; Henry, R.S.; Chai, Y.H.; Kowalsky, M.; Bull, D. Understanding poor seismic performance of concrete walls and design implications. Earthq. Spectra. 2014, 30, 307–334. [Google Scholar] [CrossRef]
- Jünemann, R.; de La Llera, J.C.; Hube, M.A.; Cifuentes, L.A.; Kausel, E. A statistical analysis of reinforced concrete wall buildings damaged during the 2010, Chile earthquake. Eng. Struct. 2015, 82, 168–185. [Google Scholar] [CrossRef]
- Jünemann, R.; de la Llera, J.C.; Hube, M.A.; Vásquez, J.A.; Chacón, M.F. Study of the damage of reinforced concrete shear walls during the 2010 Chile earthquake. Earthq. Eng. Struct. Dyn. 2016, 45, 1621–1641. [Google Scholar] [CrossRef]
- Song, C.; Pujol, S.; Lepage, A. The collapse of the Alto Río building during the 27 February 2010 Maule, Chile, earthquake. Earthq. Spectra. 2012, 28 (Suppl. 1), S301–S334. [Google Scholar] [CrossRef]
- Deger, Z.T.; Wallace, J.W. Collapse assessment of the Alto Río building in the 2010 Chile earthquake. Earthq. Spectra. 2015, 31, 1397–1425. [Google Scholar] [CrossRef]
- Qadeer, A.; Smith, B.S. The bending stiffness of slabs connecting shear walls. ACI J. Proc. 1969, 66, 464–473. [Google Scholar]
- Coull, A.; El Hag, A.A. Effective coupling of shearwalls by floor slabs. ACI J. Proc. 1975, 72, 429–431. [Google Scholar]
- Wong, Y.C.; Coull, A. Interaction between floor slabs and shearwalls in tall buildings. ACI Spec. Publ. 1980, 63, 543–574. [Google Scholar]
- Coull, A.; Chee, W.Y. Stresses in slabs coupling flanged shear walls. J. Struct. Eng.-ASCE 1984, 110, 105–119. [Google Scholar] [CrossRef]
- Coull, A.; Chee, W.Y. Cracked coupling slabs in shear wall buildings. J. Struct. Eng.-ASCE 1990, 116, 1744–1748. [Google Scholar] [CrossRef]
- Ugalde, D.; Parra, P.F.; Lopez-Garcia, D. Assessment of the seismic capacity of tall wall buildings using nonlinear finite element modeling. Bull. Earthq. Eng. 2019, 17, 6565–6589. [Google Scholar] [CrossRef]
- Pavel, F.; Vacareanu, R.; Marcu, D. Seismic performance assessment and rating for a flat-slab RC core wall structure in Bucharest, Romania. Structures 2021, 31, 1006–1016. [Google Scholar] [CrossRef]
- Pantazopoulou, S.; Imran, I. Slab-wall connections under lateral forces. ACI Struct. J. 1992, 89, 515–527. [Google Scholar]
- Panagiotou, M.; Restrepo, J.I.; Conte, J.P. Shake-table test of a full-scale 7-story building slice. Phase I: Rectangular wall. J. Struct. Eng.-ASCE 2011, 137, 691–704. [Google Scholar] [CrossRef]
- Greeshma, S.; Jaya, K.P. Effect of slab shear reinforcement on the performance of the shear wall–floor slab connection. J. Perform. Constr. Fac. 2013, 27, 391–401. [Google Scholar] [CrossRef]
- Brunesi, E.; Peloso, S.; Pinho, R.; Nascimbene, R. Cyclic testing and analysis of a full-scale cast-in-place reinforced concrete wall-slab-wall structure. Bull. Earthq. Eng. 2018, 16, 4761–4796. [Google Scholar] [CrossRef]
- Fischinger, M.; Kante, P.; Isakovic, T. Shake-table response of a coupled RC wall with thin T-shaped piers. J. Struct. Eng.-ASCE 2017, 143, 04017004. [Google Scholar] [CrossRef]
- Zhou, J.; Fang, X.D.; Yao, Z.Q. Mechanical behavior of a steel tube-confined high-strength concrete shear wall under combined tensile and shear loading. Eng. Struct. 2018, 171, 673–685. [Google Scholar] [CrossRef]
- Zhou, J.; Li, P.; Guo, N.F. Seismic performance assessment of a precast concrete-encased CFST composite wall with twin steel tube connections. Eng. Struct. 2020, 207, 110240. [Google Scholar] [CrossRef]
- Zhou, J.; Fang, X.D.; Jiang, Y. Cyclic behavior of concrete-encased high-strength concrete-filled steel tube composite walls: An experiment. Struct. Concr. 2021, 22, 691–708. [Google Scholar] [CrossRef]
- GB50011-2016; Code for Seismic Design of Buildings. China Architecture and Building Press: Beijing, China, 2016.
- Lu, X.L.; Zou, Y.; Lu, W.S.; Zhao, B. Shaking table model test on shanghai world financial center tower. Earthq. Eng. Struct. Dyn. 2007, 36, 439–457. [Google Scholar] [CrossRef]
- GB50010-2010; Code for Design of Concrete Structures. China Architecture and Building Press: Beijing, China, 2010.
- Harris, H.G. Structural Modeling and Experimental Techniques, 2nd ed.; CRC Press: Boca Raton, FL, USA, 1999. [Google Scholar]
- Maekawa, K.; Ishida, T.; Kishi, T. Multi-Scale Modeling of Structural Concrete; Taylor & Francis: London, UK, 2009. [Google Scholar]
- Lu, X.L.; Chen, C.; Jiang, H.J.; Wang, S.S. Shaking table tests and numerical analyses of an RC coupled wall structure with replaceable coupling beams. Earthq. Eng. Struct. Dyn. 2018, 47, 1882–1904. [Google Scholar] [CrossRef]
- Erberik, M.A.; Elnashai, A.S. Fragility analysis of flat-slab structures. Eng. Struct. 2004, 26, 937–948. [Google Scholar] [CrossRef]
- Hassan, M.; El-Tawil, S. Inelastic dynamic behavior of hybrid coupled walls. J. Struct. Eng.-ASCE 2004, 130, 285–296. [Google Scholar] [CrossRef]
- Computers & Structures Inc. Perform3D V5 Nonlinear Analysis and Performance Assessment for 3D Structures; Computers & Structures Inc.: Berkeley, CA, USA, 2015. [Google Scholar]
- Correal, J.F.; Hidalgo, V.; Reyes, J.C.; Ángel, C.C. A comparative study of seismic diaphragm design forces for RC dual system buildings. Bull. Earthq. Eng. 2020, 18, 4515–4540. [Google Scholar] [CrossRef]
- Kolozvari, K.; Kalbasi, K.; Orakcal, K.; Wallace, J. Three-dimensional model for nonlinear analysis of slender flanged reinforced concrete walls. Eng. Struct. 2021, 236, 112105. [Google Scholar] [CrossRef]
- Grossman, J.S. Verification of proposed design methodologies for effective width of slabs in slab-column frames. ACI Struct. J. 1997, 94, 181–196. [Google Scholar]
- Tao, Z.; Wang, Z.B.; Yu, Q. Finite element modelling of concrete-filled steel stub columns under axial compression. J. Constr. Steel Res. 2013, 89, 121–131. [Google Scholar] [CrossRef]
- Hu, H.S.; Xu, L.; Guo, Z.X.; Shahrooz, B.M. Behavior of eccentrically loaded square spiral-confined high-strength concrete-filled steel tube columns. Eng. Struct. 2020, 216, 110743. [Google Scholar] [CrossRef]
- Kolozvari, K.; Arteta, C.; Fischinger, M.; Gavridou, S.; Hube, M.; Isakovic, T.; Lowes, L.; Orakcal, K.; Vásquez, J.; Wallace, J. Comparative study of state-of-the-art macroscopic models for planar reinforced concrete walls. ACI Struct. J. 2018, 115, 1637–1657. [Google Scholar] [CrossRef]
- Wallace, J.W. Modelling issues for tall reinforced concrete core wall buildings. Struct. Des. Tall. Spec. 2007, 16, 615–632. [Google Scholar] [CrossRef]
- Shin, M.; Kang, T.H.K.; Grossman, J.S. Practical modelling of high-rise dual systems with reinforced concrete slab-column frames. Struct. Des. Tall. Spec. 2010, 19, 728–749. [Google Scholar] [CrossRef]
- Alwaeli, W.; Mwafy, A.; Pilakoutas, K.; Guadagnini, M. A methodology for defining seismic scenario-structure-based limit state criteria for RC high-rise wall buildings using net drift. Earthq. Eng. Struct. Dyn. 2017, 46, 1325–1344. [Google Scholar] [CrossRef]
- Terzic, V.; Kolozvari, K.; Saldana, D. Implications of modeling approaches on seismic performance of low-and mid-rise office and hospital shear wall buildings. Eng. Struct. 2019, 189, 129–146. [Google Scholar] [CrossRef]
- Kilar, V.; Fajfar, P. Simple push-over analysis of asymmetric buildings. Earthq. Eng. Struct. Dyn. 1997, 26, 233–249. [Google Scholar] [CrossRef]
Publisher’s Note: MDPI stays neutral with regard to jurisdictional claims in published maps and institutional affiliations. |
© 2022 by the authors. Licensee MDPI, Basel, Switzerland. This article is an open access article distributed under the terms and conditions of the Creative Commons Attribution (CC BY) license (https://creativecommons.org/licenses/by/4.0/).