Abstract
The transportation and surface deposition of aerosols from sneezing in a small indoor farmers’ market are studied numerically. The effects of numbers and locations of the entrances and exits of the market are discussed under the condition of natural convection. The results indicate that aerosols leave the indoor environment more quickly when two doors are designed face to face on the walls perpendicular to the natural wind direction compared to other natural ventilation strategies. The concentrations of aerosols accumulated on the surfaces of the stalls and human bodies inside the market are also lower. In this case, the risk of contacting the virus is relatively low among susceptible individuals in the indoor farmers’ markets. Moreover, opening more doors on the walls parallel to the natural wind direction is not beneficial for the fast exhaust of aerosols.
1. Introduction
At present, many countries and regions in the world are suffering from the 2019 novel coronavirus pneumonia (COVID-19) to varying degrees. COVID-19 is a highly infectious disease caused by a coronavirus (SARS-CoV-2) [1]. According to a report by the World Health Organization (WHO) [2], respiratory droplet or aerosol transmission and close contact transmission could be the main transmitting routes of SARS-CoV-2 [3]. In other words, the major way of the virus spreading among the susceptible population is through airborne transmission [4,5]. The infected person exhales virus laden aerosols during conversation, coughing, sneezing, breathing, etc. [6,7]. If another person is near the infected person, the aerosols are directly inhaled by the susceptible person [8,9], or the aerosols are deposited on the surrounding surfaces of the infected person and spread though contact with other people or surfaces. Therefore, it is critical to prevent the aerosols that carry viruses from entering the respiratory system and reduce the deposition of aerosols on the surrounding surface. In this context, it is of significance to understand the indoor transmission characteristics of aerosol in order to cut off the transmitting path of the virus [10,11].
Usually, the purpose of ventilation is to create a comfortable thermal and humid environment for the human body [12,13,14]. Fresh air is induced and organized to dilute indoor contaminants. However, the transportation of contaminants, including aerosols in an indoor environment, are not considered during the design of natural ventilation strategies. However, the invasiveness of diseases is directly related to the transportation trajectories of aerosols. An in-depth study of the transportation characteristic is essential for controlling the spread of diseases in indoor spaces [15,16]. Computational fluid dynamics is a powerful tool that is increasingly used to study a variety of wind and thermal environmental problems. These include air pollution [17], natural ventilation of buildings [18], convective heat transfer [19], and other applications. Computational fluid dynamics are advantageous for simulating the behavior of dispersed aerosols transported by airflow in different indoor environments. Recently, aerosol transmission in various indoor environments has been studied and reported, such as in coach buses [20], hospital wards [21,22], high-speed rail cabins [23], aircrafts [24,25], and classrooms [26]. Moreover, urinals [27] and toilets [28] have been studied to investigate the transmission of aerosols during the flushing process for possible fecal–oral transmission of COVID-19. Various suggestions for restraining the spread of airborne aerosols have been proposed. Yang et al. [20] studied five supplying modes of air-conditioning on buses, and the results suggested that the backward supplying direction is more effective at reducing the risk of cross-infection. The optimal air distribution proposal of the hospital ward suggested by Wang et al. [22] is the bottom-in and top-out mode. Zhang et al. [23] examined four scenarios of air supply and exhaust in high-speed rails with different boundary conditions. It was found that when there is a flow from the front door to the rear, the aerosols are more likely to leave the carriage. According to the findings of Mohamed et al. [26], opening the windows during the operation of the air conditioning system is beneficial for the drainage of aerosols in the classroom.
Although a lot of research has been carried out in the transmission of aerosols in indoor environments, most have focused on spaces with mechanical ventilation systems. The traditional farmers’ market is a typical place where people are often crowded and natural ventilation is utilized. Once a person infected with the virus enters the market, their speech, coughing, and sneezing will increase the risk of the virus spreading in this market. In this paper, the transportation process of aerosols produced by sneezing in a farmers’ market is studied numerically. The model of the farmers’ market in this study is a real-existing small farmers’ market in Nanjing, China. Fresh air is induced into the farmers’ market by natural ventilation through the front door. This paper studies four cases with different designs of entrances and exits for the farmers’ market, including one door, two doors, three doors, and four doors. By comparing the aerosol transportation and the deposition on the surface inside the market, the optimal design of the entrances for public places using natural ventilation is proposed.
2. Methods
2.1. Geometric Model of Farmers’ Market
In order to reduce the time of calculation, a simplified model of the farmers’ market is used, as shown in Figure 1, which is based on a typical farmers’ market in China. In the farmers’ market, the vendors are all behind the stalls and facing the front door. There are some customers talking to the vendors in front of the stalls and some customers walking around the farmers’ market. The three-dimensional size of the farmers’ market is X × Y × Z = 16 × 10 × 4 m. There are three rows of stalls at each side of the central passage in the farmers’ market, which can accommodate a total of 18 vendors. In this study, all stalls are occupied by the vendors. In addition, there are eight customers in the farmers’ market, scattered beside different stalls. All customers and vendors are assumed to have the same dimensions. The human body is simplified into a cuboid body with a size of X × Y × Z = 0.5 × 0.2 × 1.5 m, a cuboid head with a size of X × Y × Z = 0.15 × 0.2 × 0.25 m, and a rectangular mouth surface with a size of X × Z = 0.04 × 0.01 m. The total height of the human body is 1.75 m. As shown in Figure 1, customer A in the corner and customer B near the center aisle are the source of sneezing and are colored red. Moreover, it is assumed that both customers A and B have a fever. Four cases with different ventilation strategies are discussed in this work, as summarized in Table 1.
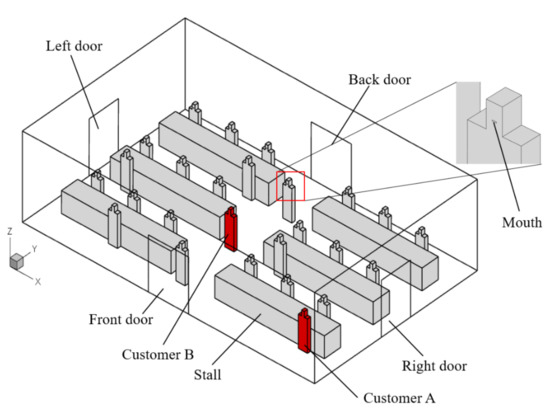
Figure 1.
Geometric model of a small farmers’ market.

Table 1.
Simulation cases.
2.2. Mathematical Model
This study uses the commercial software ANSYS FLUENT 19.0 to simulate the sneezing aerosol transport and indoor airflow. Generally, indoor air flow is considered as turbulent. The Reynolds number for the air ejected from the sneezing mouth is 4.75 × 10⁴, which is calculated by the equation: Re = ρaud/μ. ρa is the density of air at 312 K, u is the velocity of air (velocity refers to the article by Wang et al. [22]), d is the equivalent diameter of the mouth, and μ is the dynamic viscosity of air at 312 K. Thus, the turbulent dissipation should be considered in the sneezing airflow. Among the various popular numerical methods [29,30] for turbulence flow, such as Direct Numerical Simulation (DNS), Large Eddy Simulation (LES), and Reynolds-Averaged Navier–Stokes (RANS), the realizable k-ε model based on RANS is advantageous for reducing computational cost [31], while obtaining accuracy. Hence, a realizable k-ε model is applied in the current simulation.
The governing equation in the general format of the realizable k-ε model is
where ρ is the fluid density, t is the time, U is the velocity vector, and ϕ is a universal variable. Equation (1) represents the equations of continuity, momentum, energy, turbulent kinetic energy k, and turbulent dissipation rate ε when ϕ indicates the corresponding variables. Γϕ is the diffusion coefficient for each variable and Sϕ is the source term for each variable.
Compared to the Euler method, the Lagrangian method is more suitable for studying the movement of the sparse discrete phase. Therefore, the discrete phase model (DPM) is applied in this study to track the trajectory of aerosols from the sneezing customers. For a single aerosol, the force balance equation can be written as follows [32,33]:
where mp is the mass of the particle, upi is the velocity of the aerosol in i direction, Fd is the drag force exerted on unit aerosol mass, G is the gravitation, and Fai is the additional forces exerted on unit aerosol mass except drag force and gravitation including Brownian force and Saffman lift force. In this study, the additional forces included Brownian force and Saffman lift force.
2.3. Boundary Conditions
The following assumptions are adopted in this work: (1) there is no coagulation or fragmentation of aerosols; (2) the evaporation of aerosols is not considered; (3) all aerosols are regarded as a smooth sphere with constant density; and (4) only the strong airflow caused by sneezing is considered in this work, while the airflow caused by the inhaling and exhaling of human breath is neglected. In this study, the wind speed is 1 m/s, according to our measurement in Nanjing during a typical autumn week. The wind is along the positive direction of y-axis and enters the farmers’ market from the front door in all cases studied. The aerosols from the sneezes of customers A and B are ejected along the horizontal direction (y positive) at the same time t = 0. The sneeze lasts for 0.12 s [34]. The time steps are Δt = 0.001 s during 0 s–0.12 s, Δt = 0.01 s during 0.12 s–1 s, Δt = 0.1 s during 1 s–10 s, and Δt = 1 s during 10 s–300 s. The total time for spreading the aerosols is 300 s [16]. Detailed boundary conditions [35,36] are listed in Table 2.
Table 2.
Boundary conditions.
2.4. Mesh Sensitivity Analysis
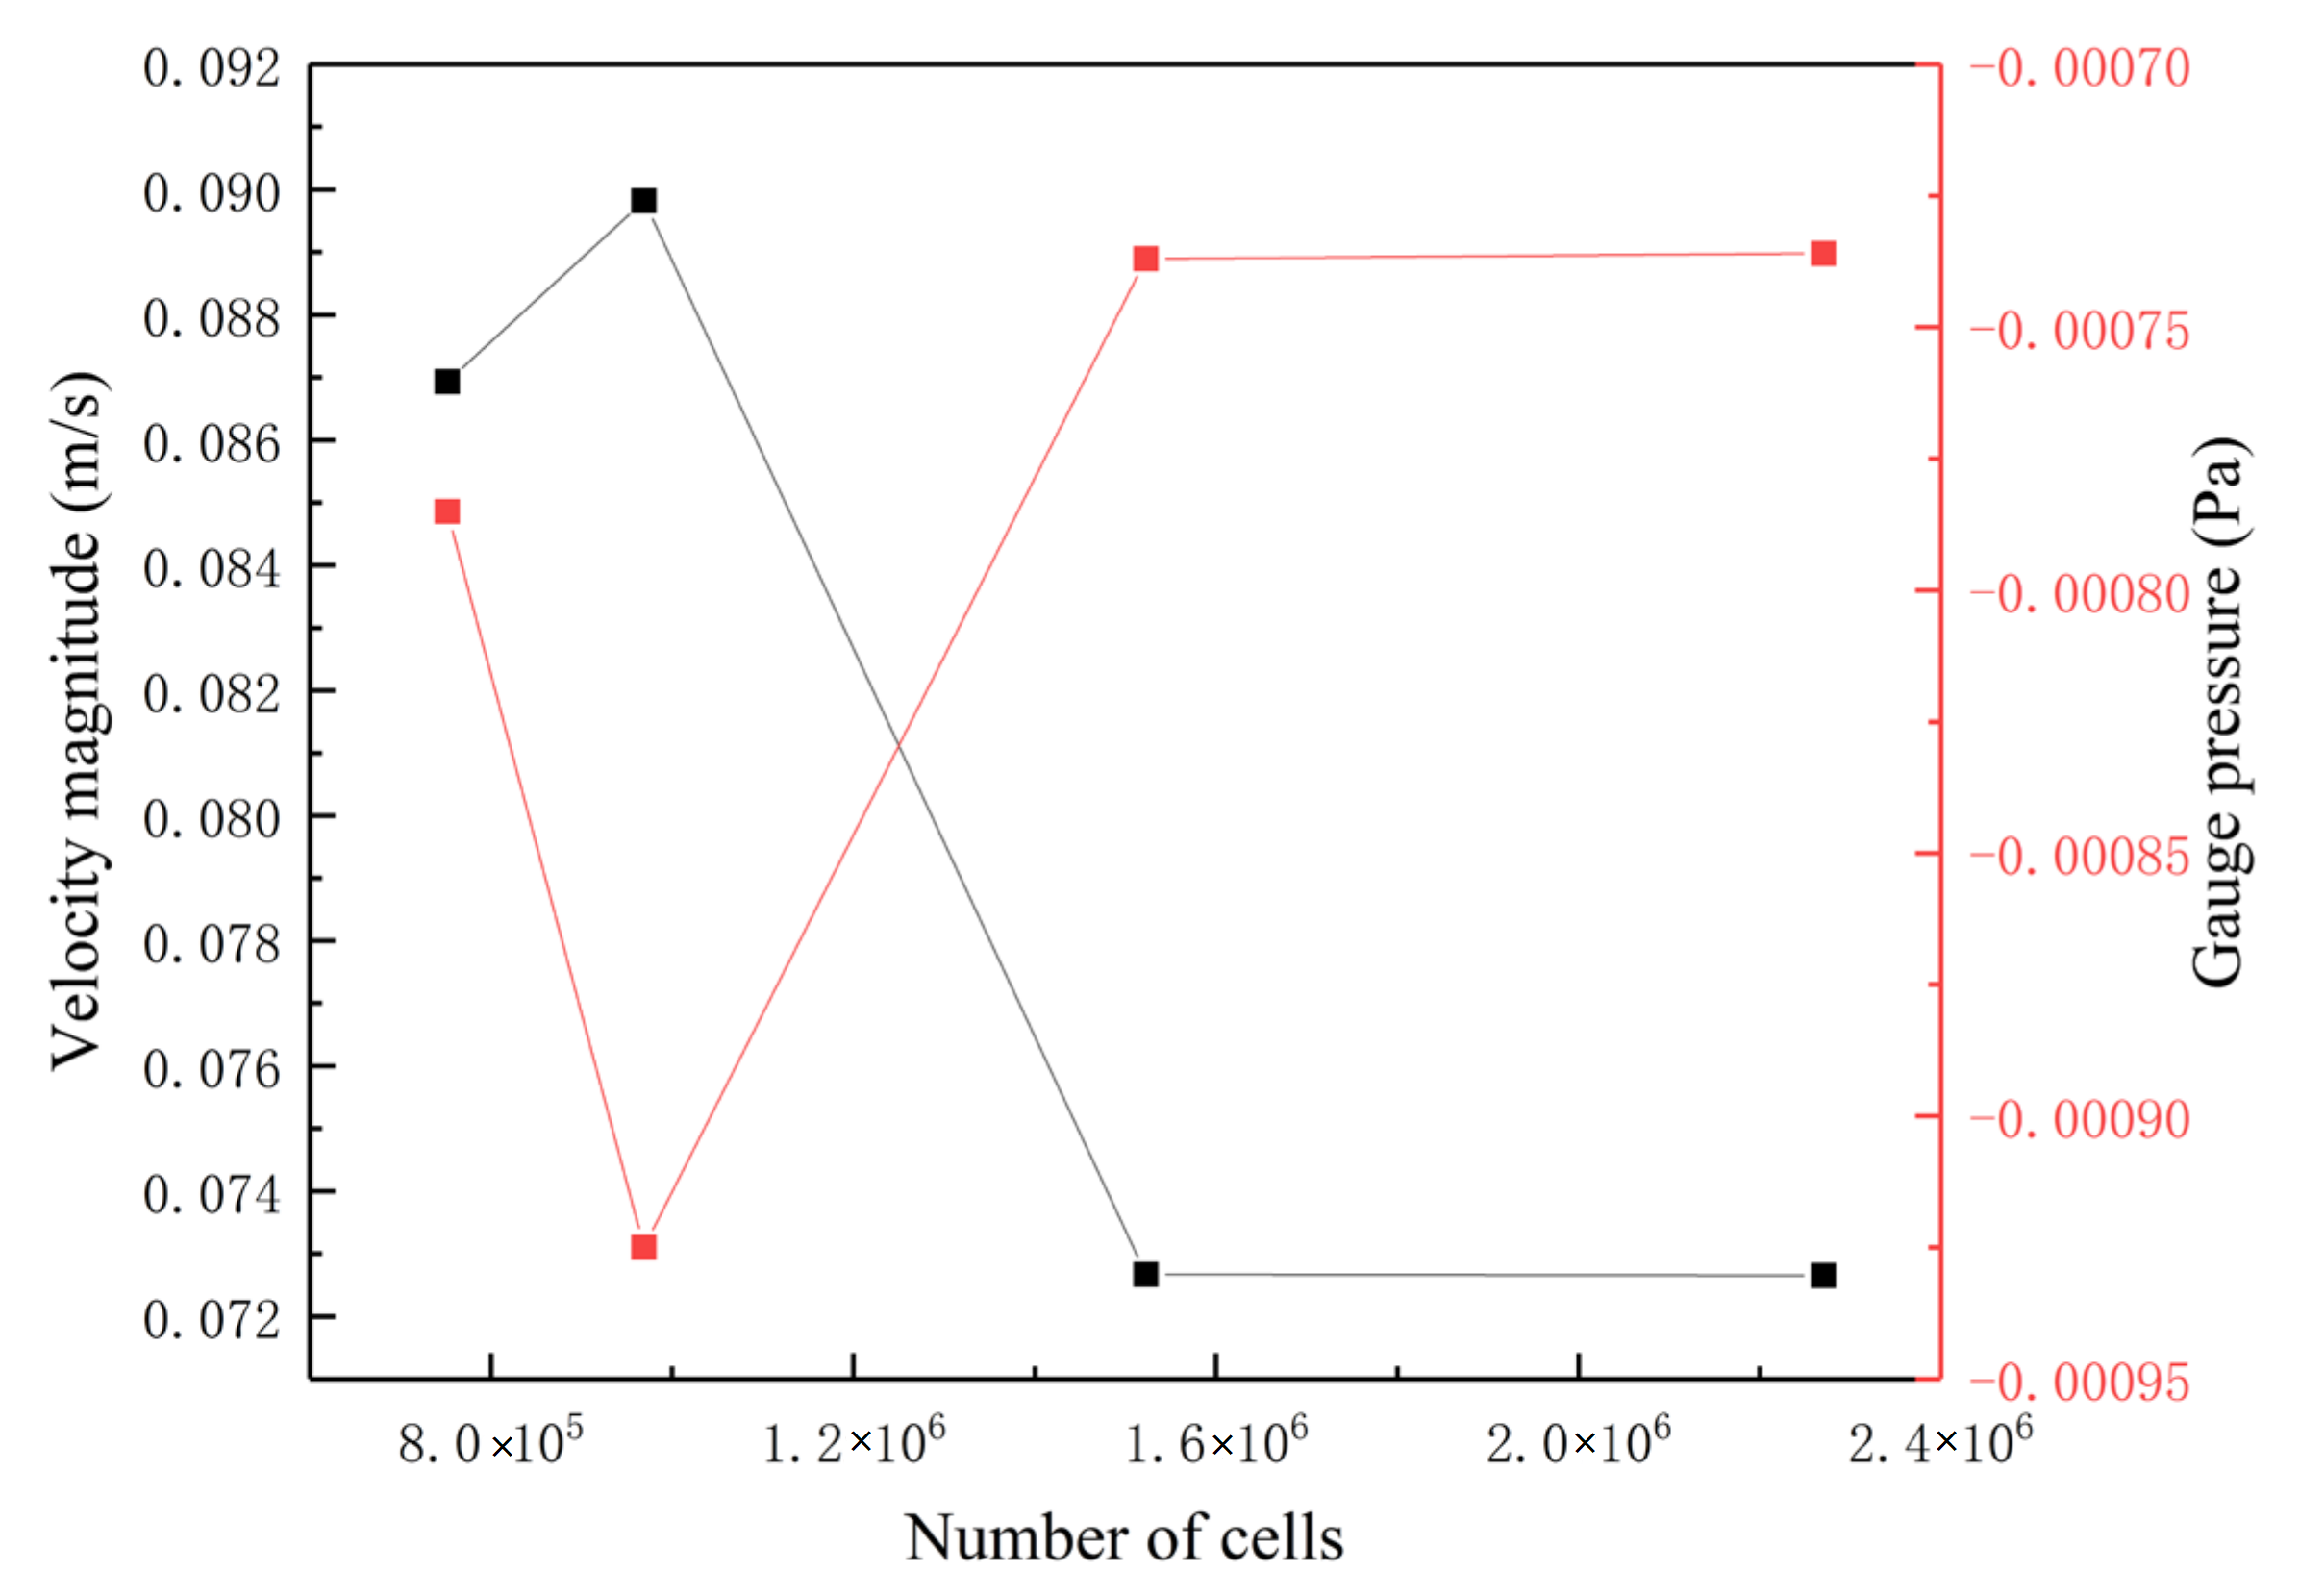
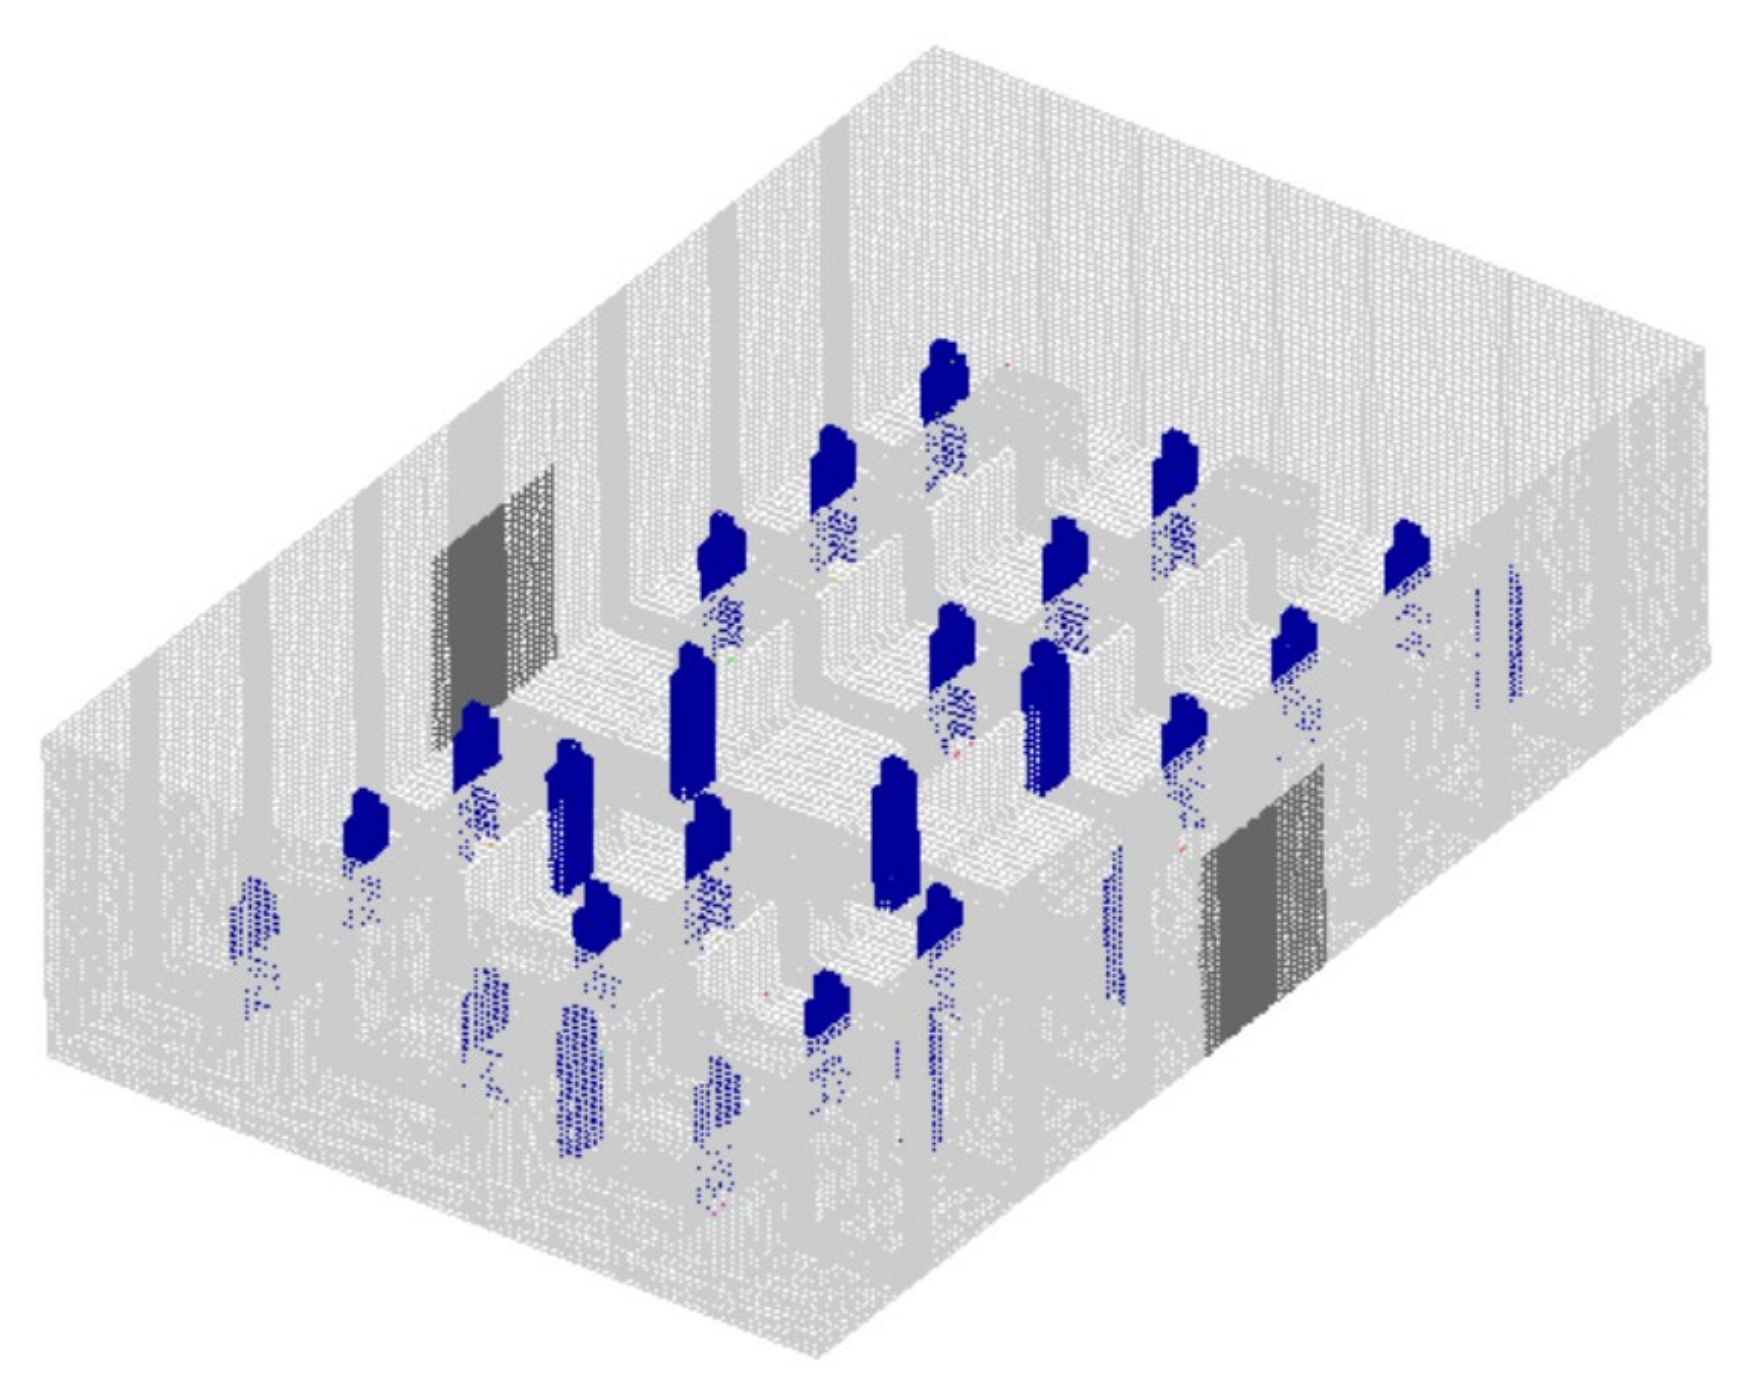
This work uses structured meshes with hexahedral cells, and the mesh is generated by ANSYS ICEM 19.0 (19.0, Ansys Inc., Canonsburg, PA, USA). Four different meshes are used to conduct the mesh independence analysis, and the numerical values compared are velocity magnitude and gauge pressure at the center of the farmers’ market (x = 8 m, y = 5 m, z = 2 m). The details are shown in Table 3. The comparisons of different results are shown in Figure 2. It is indicated that there is almost no difference between the comparison values obtained by M3 and M4. Therefore, M3 with 1,522,644 cells is used to simulate the cases in this work. The 3D distribution of the mesh is shown in Figure 3.
Table 3.
Mesh sensitivity analysis at the center of the farmers’ market.
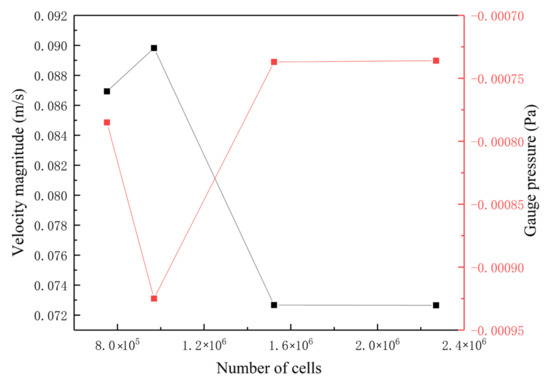
Figure 2.
Mesh sensitivity analysis at the center of the farmers’ market.

Figure 3.
3D distribution of the mesh.
3. Results
3.1. Indoor Airflow
Figure 4 compares the velocity magnitude and stream lines at the height of the human mouth (z = 1.6 m) for the four cases studied in this work. In general, when the air flows through the first person at the central passage, it circulates on both sides of the human body due to obstruction, with increasing speed in all of the cases simulated. Then, the air flows toward the back wall with gradually decreasing speed. In case 1, there is only a front door open in the farmers’ market, and the airflow is relatively smooth. It can be seen in Figure 4a that vortices are generated near the left and right walls, where the airflow stagnates. The updating of air in these areas is slower than other places in the market, which is not conducive for virus control. Compared with case 1, the stagnation area of air in case 2 is much smaller. As the farmers’ market in case 2 has a front door and a back door, the air can quickly flow out of the back door after entering the market. A question arises as to whether adding more openings on the building walls is beneficial for updating the indoor air and preventing the spread of the virus in places utilizing natural ventilation. Hence, two cases with more doors openings of the farmers’ market are examined. In the market (case 3) with one entrance and two exits (shown in Figure 4c), the velocity distribution is much more complicated compared with cases 1 and 2. Airflow enters the market from the front door and flows out through the left and right doors, causing vortices near the left and right doors. At the same time, there are multiple vortices close to the back wall, which makes the airflow stay in the farmers’ market for a relatively longer time than cases 1 and 2. Moreover, vortices are observed near several stalls, which is disadvantageous in virus control. In case 4 where four doors are opened, the air can flow out through the left and right doors as well as the back door. Therefore, compared with case 3, the stagnation of air near the back wall in case 4 is alleviated. However, there is still a certain range of vortices near the left and right doors, which is not conducive for the renewal of indoor air. The general air change rate for each case is shown in Table 4. A rate of 30 ventilation per hour is necessary in a farmer’s market.
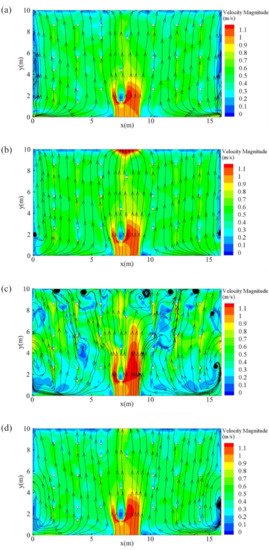
Figure 4.
The velocity magnitude and streamlines at z = 1.6 m cross-section for (a) case 1 (only the front door is open); (b) case 2 (front and back doors are open); (c) case 3 (front, left, and right doors are open); (d) case 4 (front, back, left, and right doors are open).
Table 4.
General air change rate of the farmers’ market.
3.2. Transmission of Sneezed Aerosols
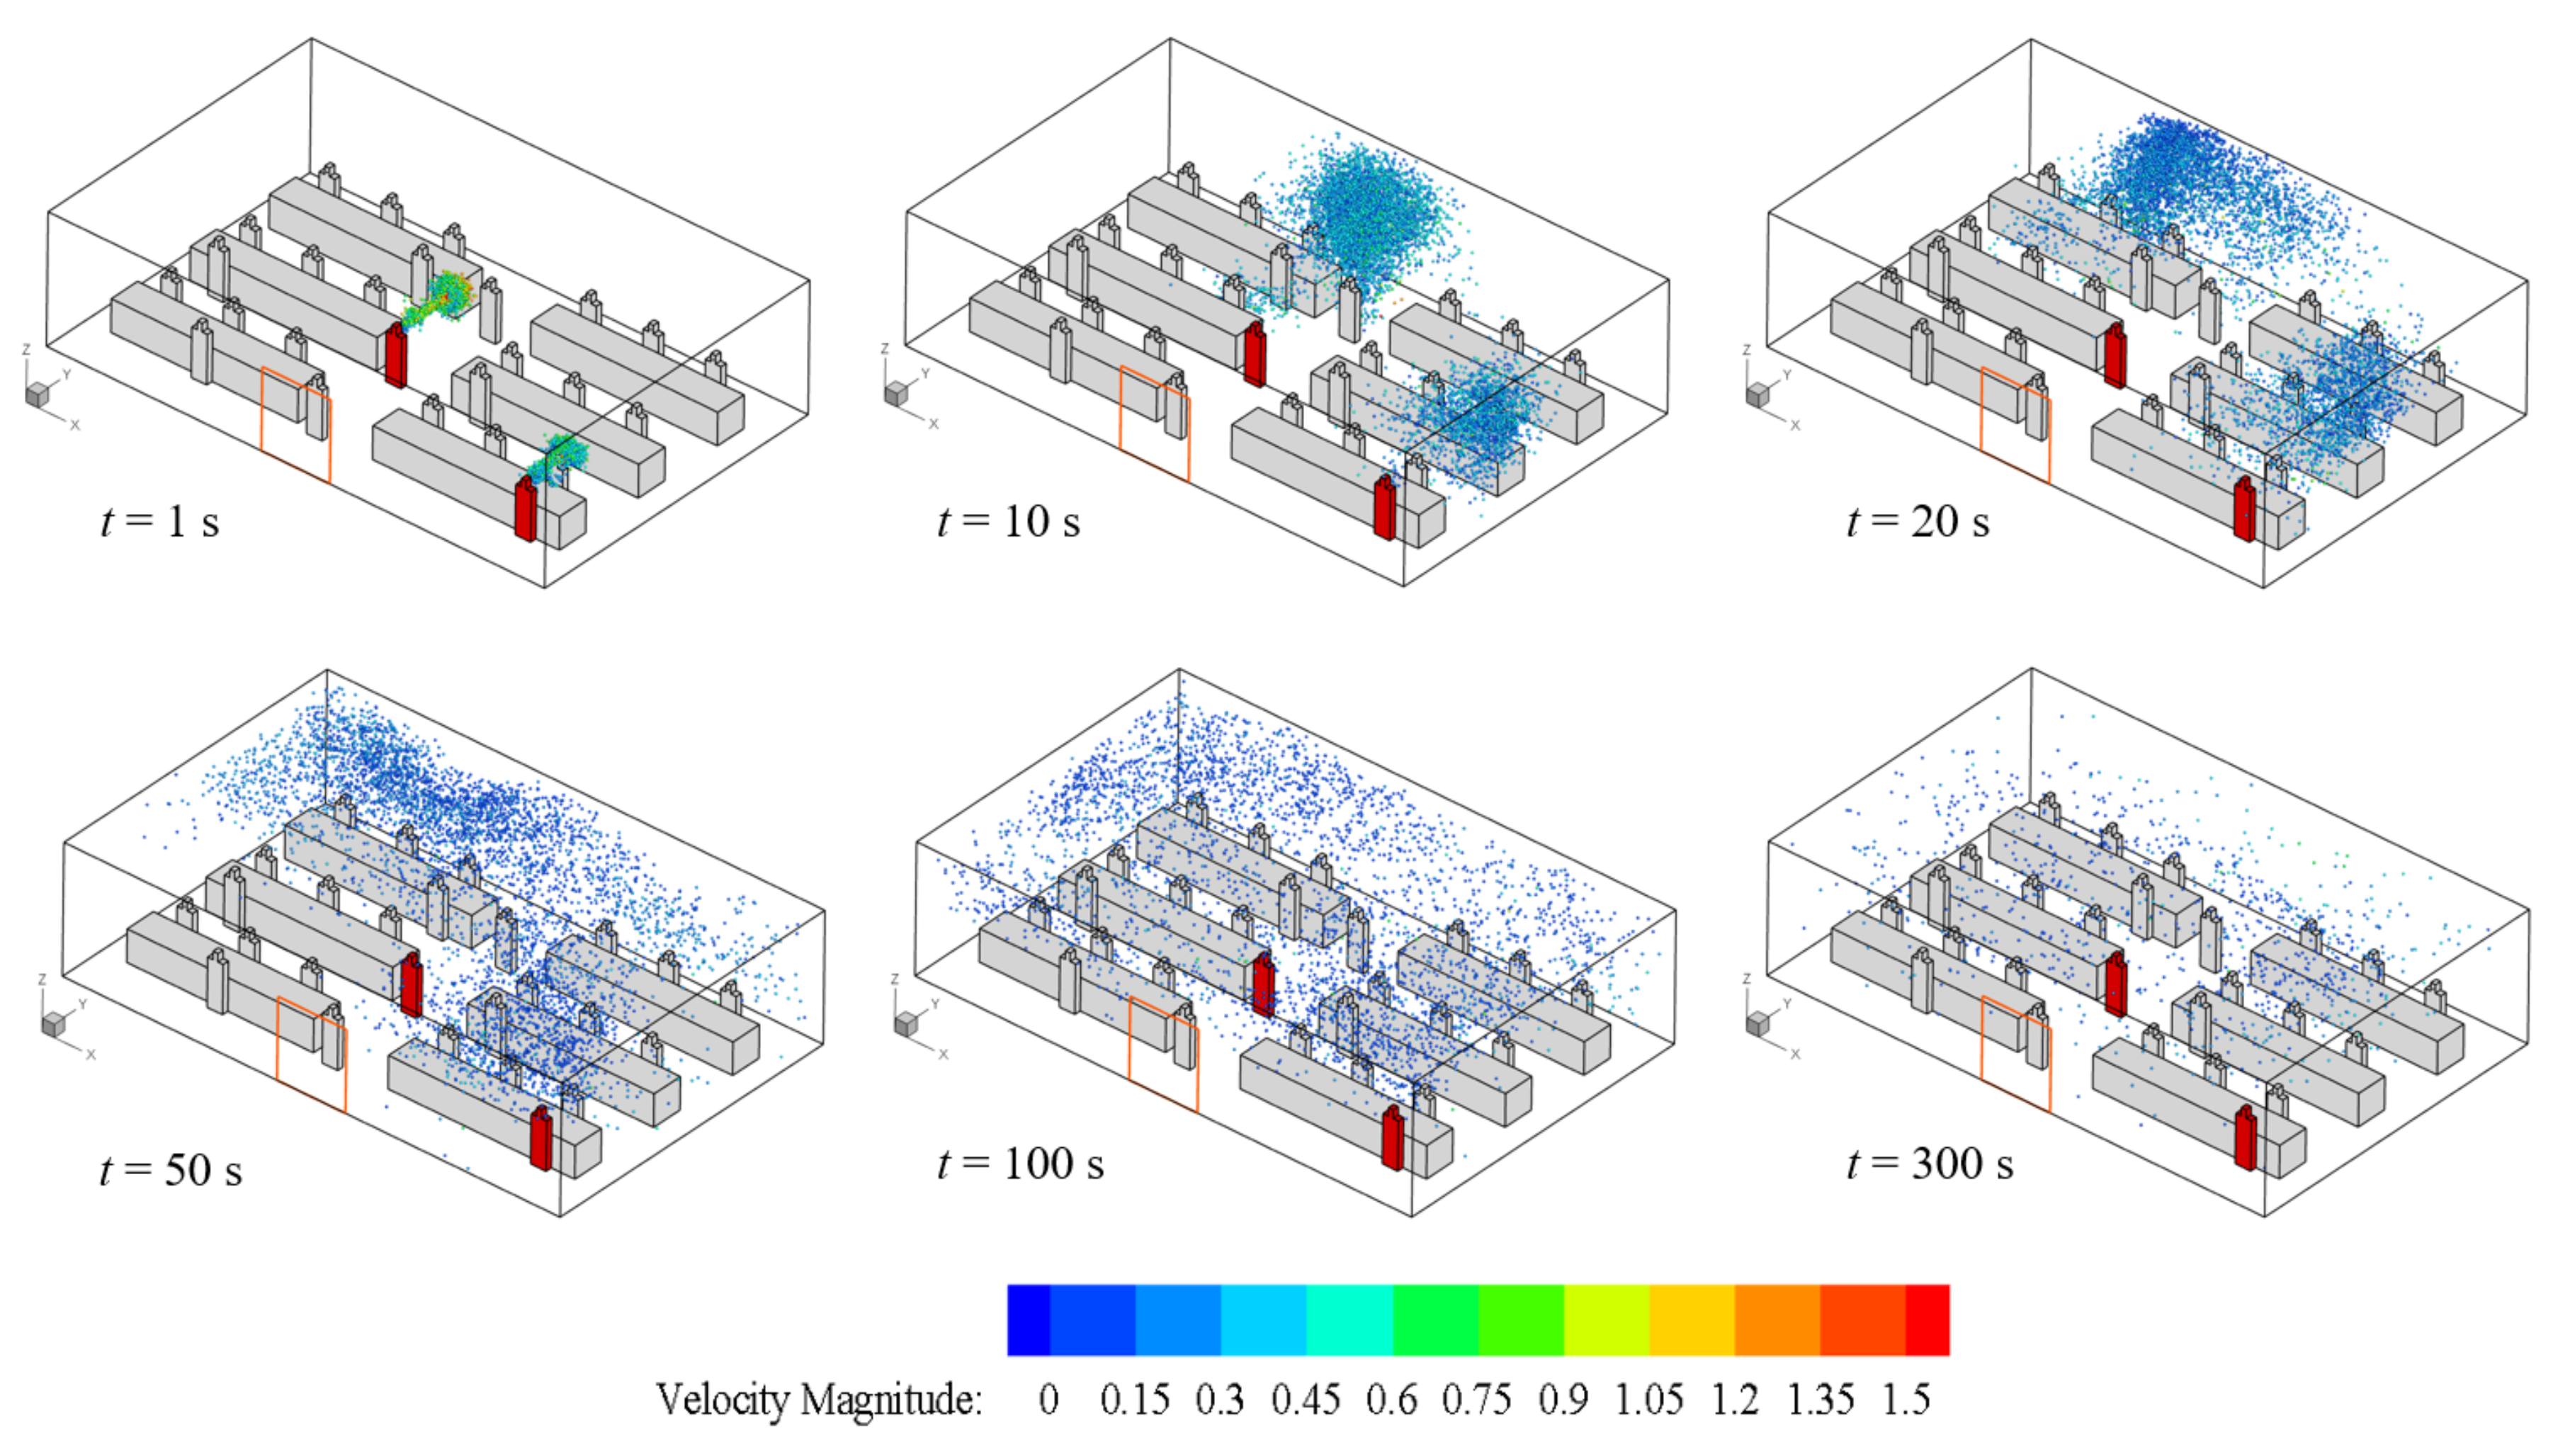
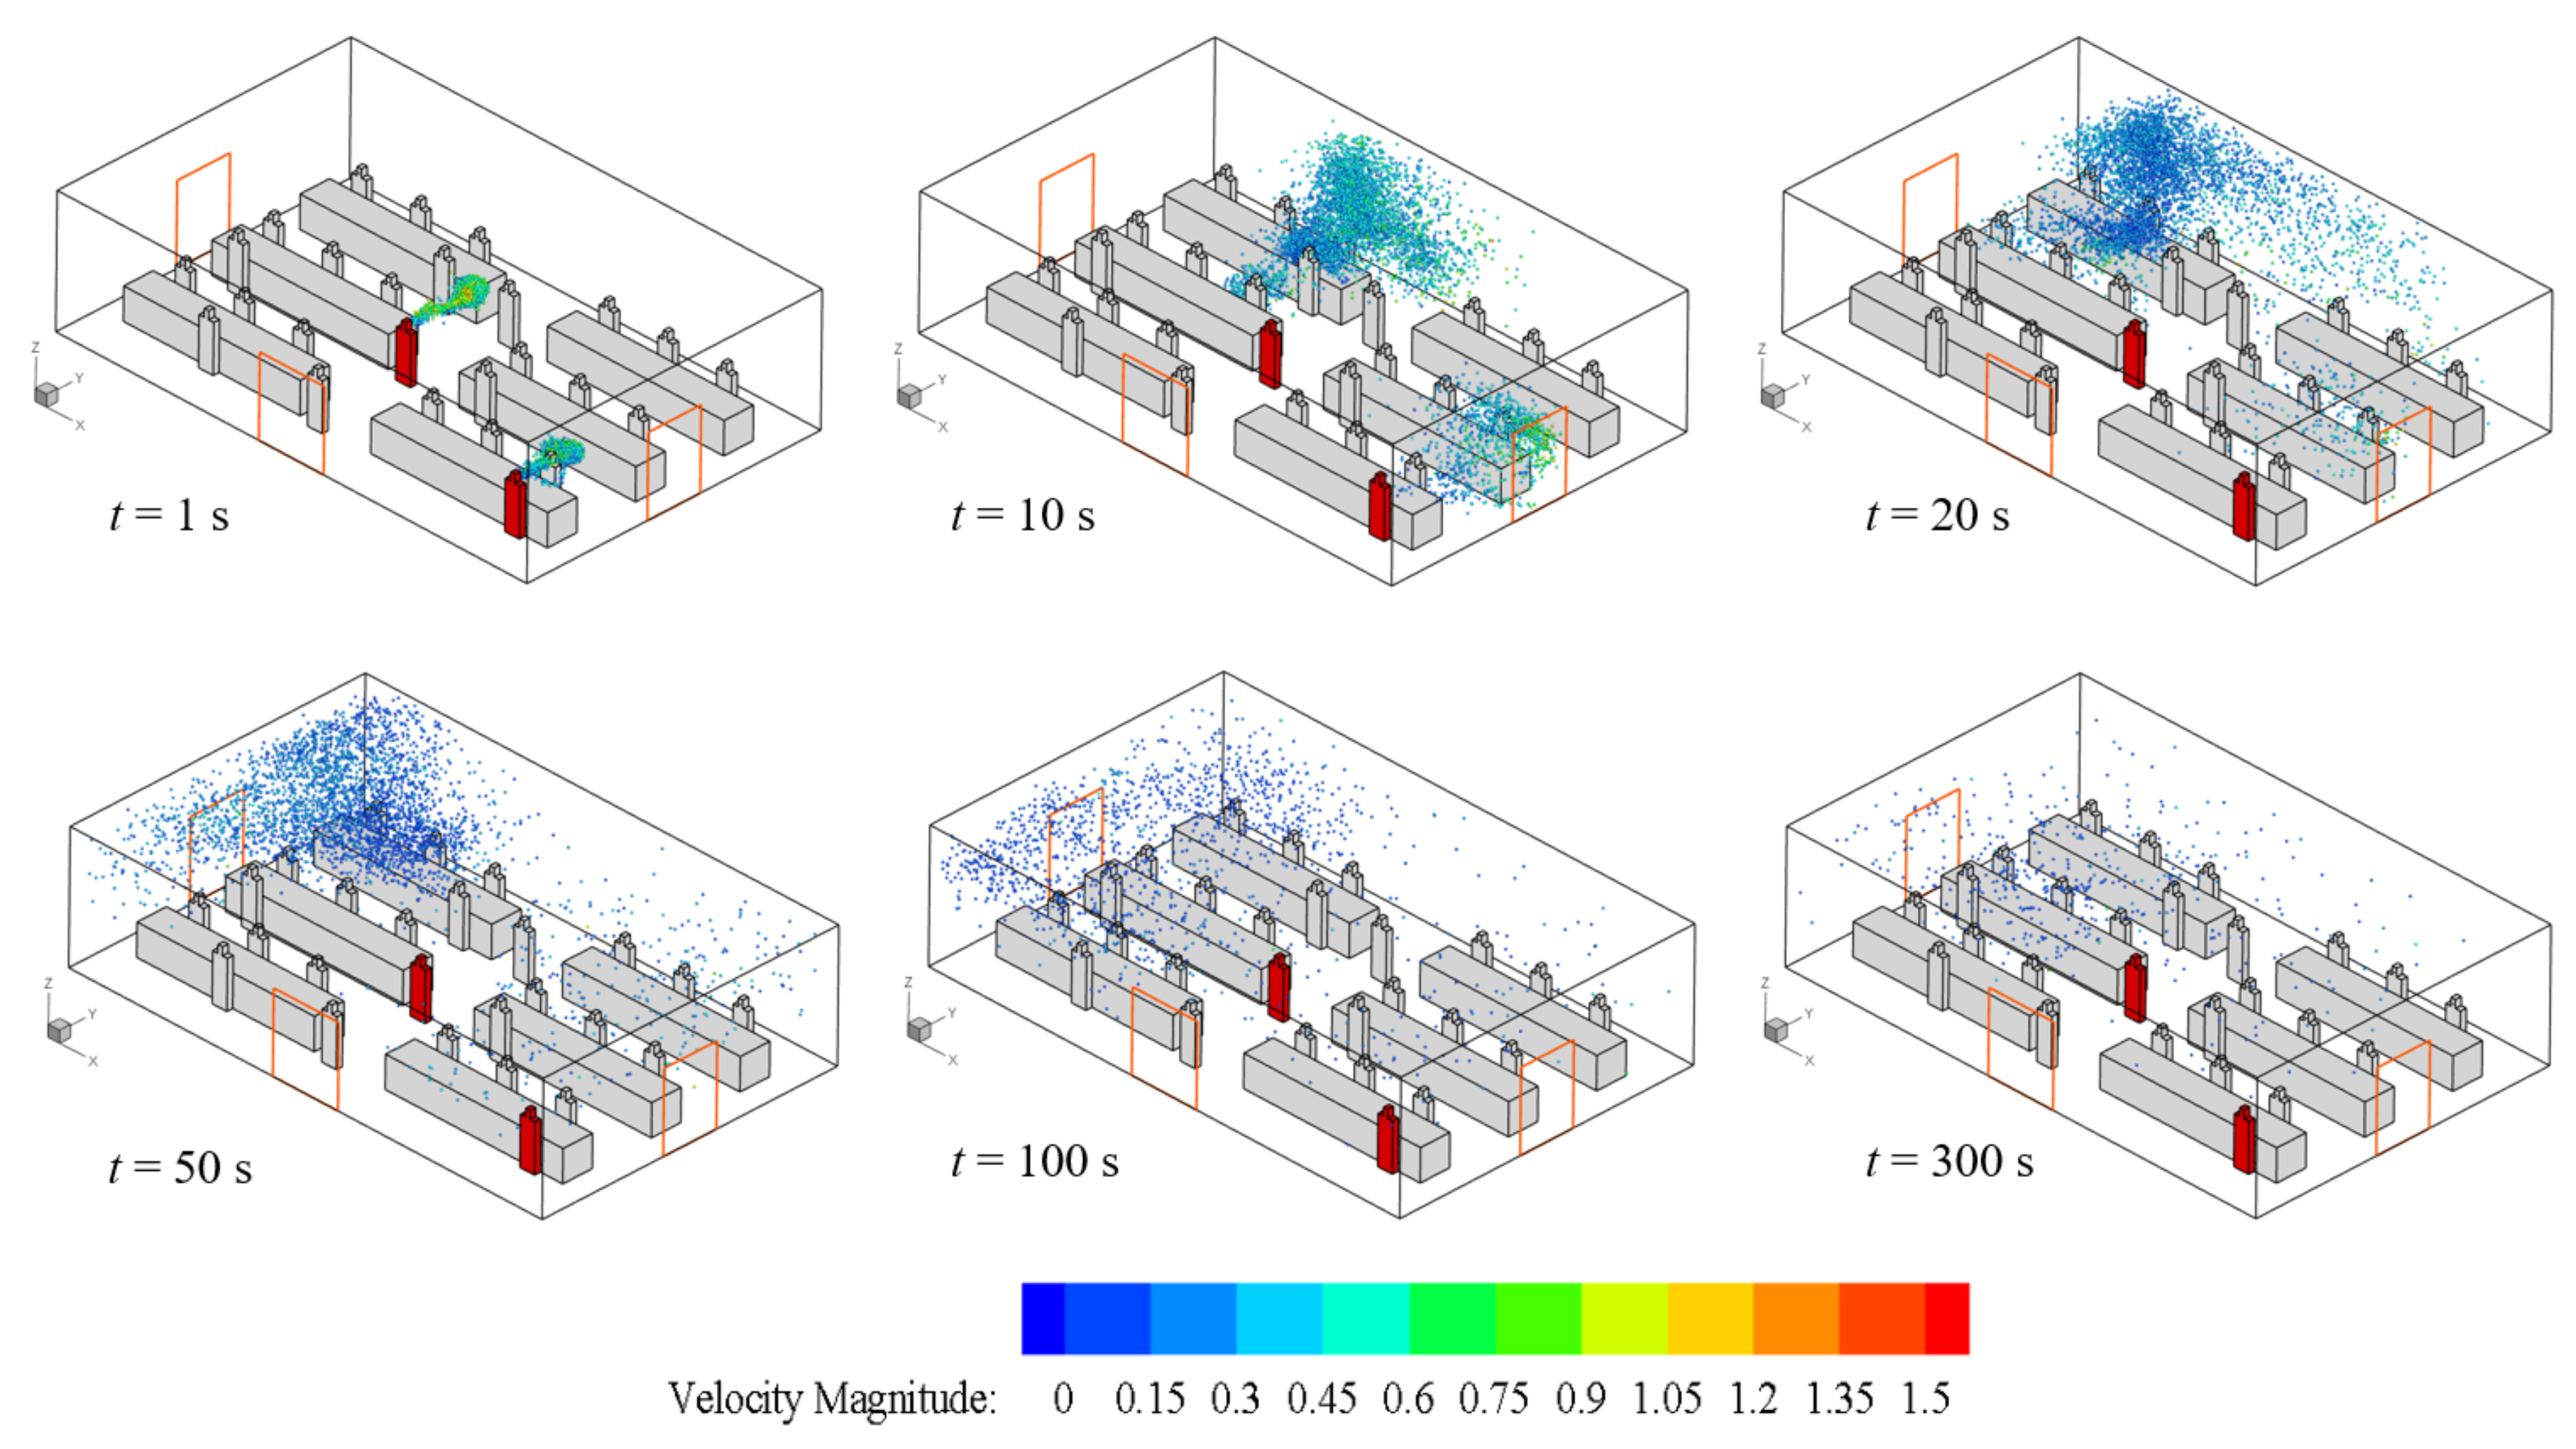
The aerosol distribution at t = 1 s, 10 s, 20 s, 50 s, 100 s, and 300 s after customers A and B sneeze for the four simulated cases is compared in Figure 5, Figure 6, Figure 7 and Figure 8. The aerosols are colored according to their velocity magnitude. After the aerosols leave the mouth, they move straight forward for a short distance due to inertia in all cases. A large number of aerosols gather together and the cloud of aerosols is similar to a cone at t = 1 s in all cases, indicating that the trajectories of the aerosols are not affect by indoor airflow in short period of time. Then, the aerosols decelerate rapidly, and transmit to other spaces in the farmers’ market with the airflow. It is worth noting that the aerosols sprayed by customer A who in the corner position directly gather around at the head of the stall owner, which can easily cause cross-infection. As shown in Figure 5, the aerosols sprayed by customer B approach the back wall and move to the left, while the aerosols sprayed by customer A also move to the left at t = 20 s, caused by the circulation of airflow. When t = 50 s and 100 s, the aerosols are distributed in the entire space of farmers’ market. Meanwhile, the aerosols are deposited on surfaces that are in their trajectories, hence the density of aerosols remaining in the air is low when t = 300 s.
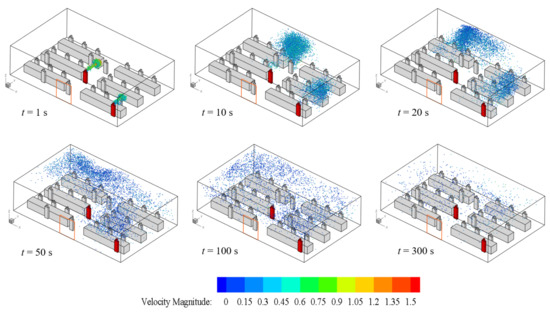
Figure 5.
Distribution of aerosols in case 1 (only the front door is open).
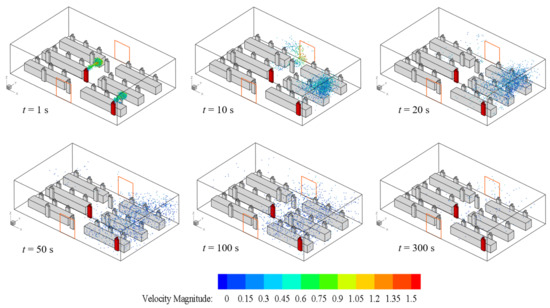
Figure 6.
Distribution of aerosols in case 2 (front and back doors are open).
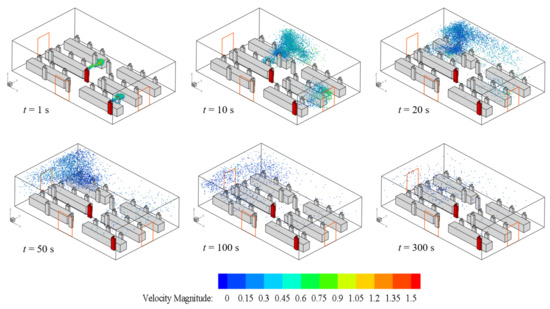
Figure 7.
Distribution of aerosols in case 3 (front, left, and right doors are open).
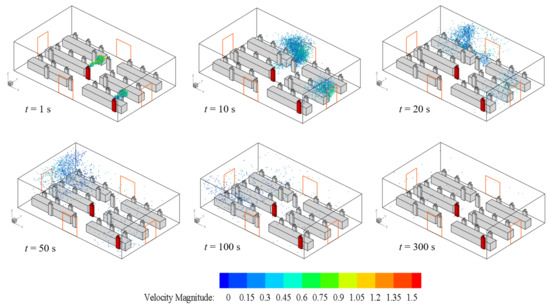
Figure 8.
Distribution of aerosols in case 4 (front, back, left, and right doors are open).
Figure 6 shows the aerosol distribution of case 2. Different from case 1, a large number of aerosols from the sneeze of customer B escape from the back door at t = 10 s due to the draught. The distribution of aerosols sprayed by customer A at different times is similar to that of case 1. Hence, the aerosol distribution in case 2 is mainly in the right-side area of the farmers’ market, causing a greater risk of infection than the left-side area of the market. At t = 300 s, the number of remaining aerosols in the air is much less than that in case 1.
Figure 7 summarizes the aerosol transmission of case 3. At t = 10 s, a large number of aerosols from the sneeze of customer B are transmitted to the left area of the back wall and continue to move towards the left door. The aerosols from the sneeze of customer A move towards the right door and quickly escape through the right door. When t = 50 s, a large number of aerosols are distributed in the left side of the farmers’ market. As customer B is located at the left of the center passage and no back door is open, the aerosols from customer B are carried by the airflow towards the left door. Therefore, the risk of being infected in the left side of the farmers’ market in case 3 is relatively higher than that in right side. Moreover, due to the distance between customer B and the door on both sides and the of sneezing direction, it takes a long time for the aerosols to escape from the allof the doors.
The aerosols in the farmers’ market utilizing the ventilation strategy with four open doors (case 4) is shown in Figure 8. At t = 20 s, most of the aerosols sneezed by customer A escape from the right door. Hence, less aerosols are spread in the right part of the farmers’ market compared to that in cases 1 and 2. As more doors are open, the velocity of the air in the center passage is slower than that in case 2, only a portion of the aerosols from customer B escape from the back door and the rest of them are carried by the airflow towards the left door. When t = 100 s, the number of aerosols in the farmers’ market is less than that in case 3. However, the number of aerosols distributed in the left side of the farmers’ market is still more than that on the right side, similar to case 3.
It can be concluded from Figure 5, Figure 6, Figure 7 and Figure 8 that the transmission of aerosols in the farmers’ market is affected by the human body, stall, and wall. Moreover, the speed of the aerosol decays very quickly, and the speed is lower than 1 m/s within 1 s, and then it moves with the airflow coming in from the front door. This shows that the air movement in the market is crucial to the spread of aerosols. Thus, the situation of the aerosol transmission in Figure 5, Figure 6, Figure 7 and Figure 8 is significantly different when comparing case 1 and case 2, case 3, and case 4. The situation with or without a back door has a greater impact on the deposition of aerosols on the wall. According to case 2 and case 4, aerosols can escape from the back door more quickly when one door is opened on the windward and leeward sides. Although there are three doors in the farmers’ market in case 3, several human bodies and stalls are in the streamlines, and hence the aerosols are easily attached to the surface of the human body and the stalls.
3.3. Accumulation of Aerosols on Indoor Surfaces
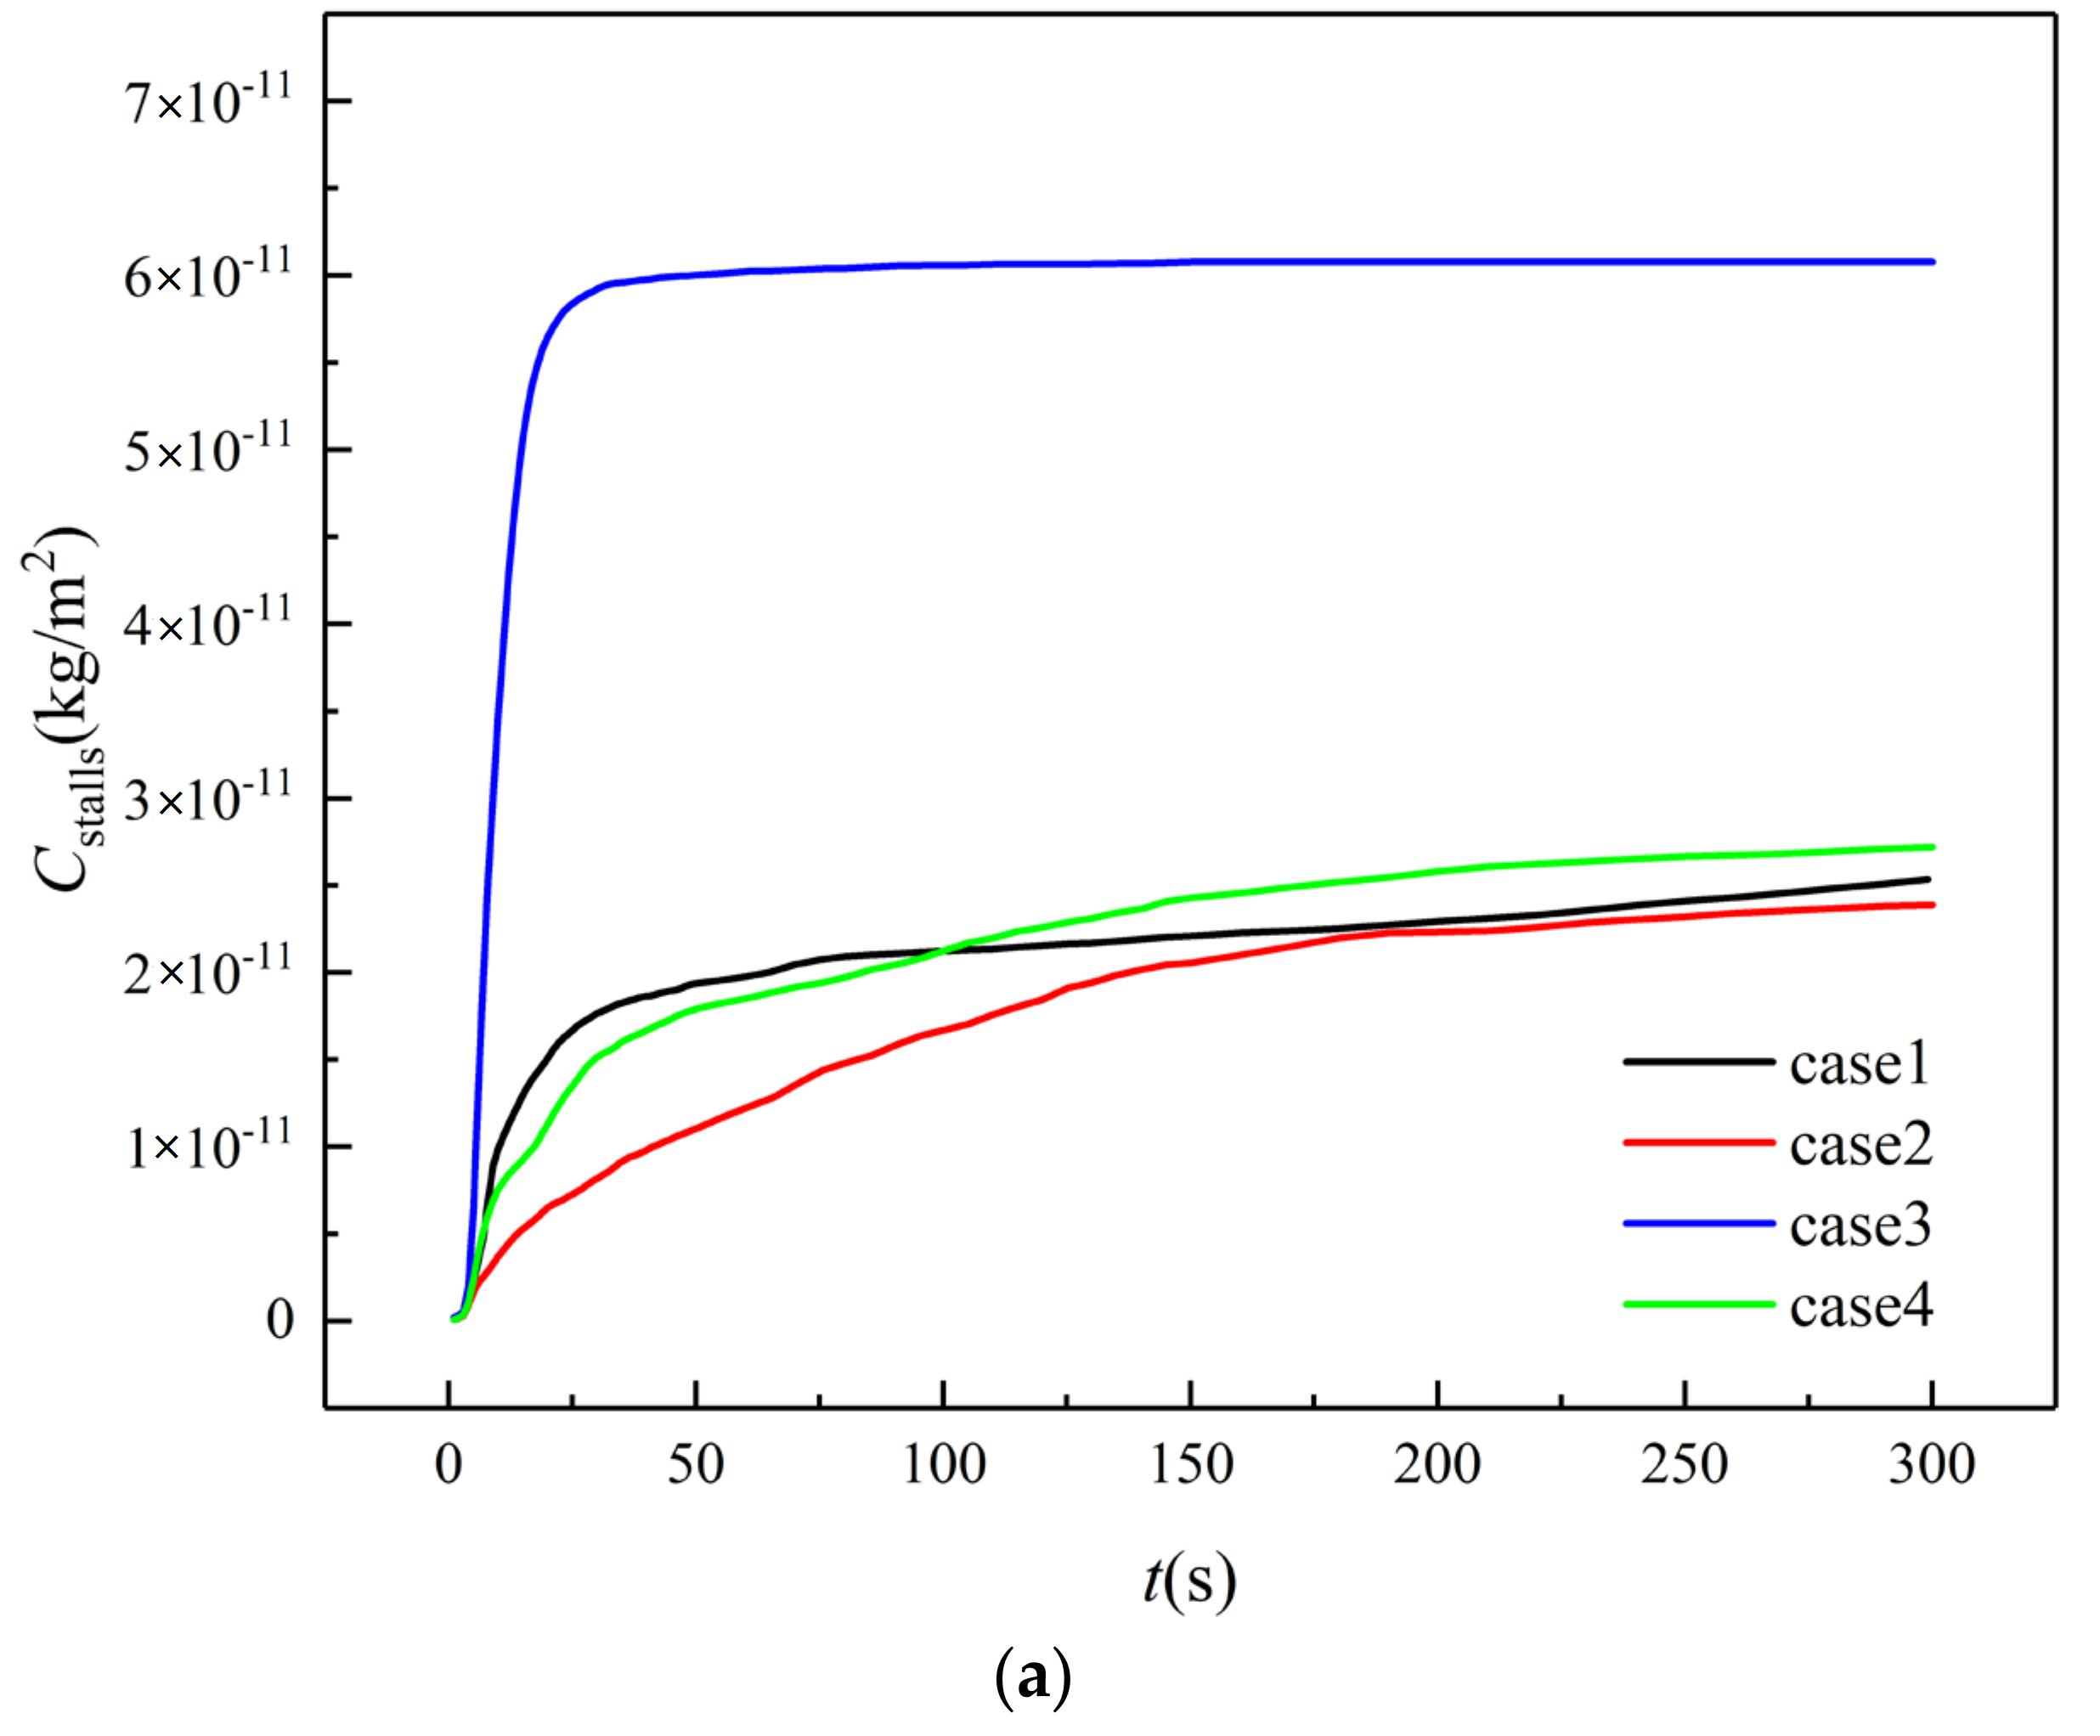
Figure 9 summarizes the variation of the cumulative concentration of the aerosols deposited on the surface of all stalls in the farmers’ market. For a farmers’ market, the hygiene of the stalls is essential for the health of both stall owners and customers. The deposition of virus laden aerosols on the stall can contaminate the vegetables and thus cause secondary infection. It can be seen from Figure 9 that the stalls in all cases are detected with aerosols, despite the ventilation strategy and the cumulative concentration of aerosols, which increases drastically in the first minute after the sneeze. Then, due to the decrease of flowing aerosols in air, less aerosols are deposited on the stalls with time. In cases 1, 2, and 4, the concentration of aerosols on the stalls reaches a maximum value at about 5 min, while in case 3, this concentration reaches a maximum value in 1 min. Moreover, the amount of aerosols deposited on the stalls in case 3 is the highest among all four cases, which is approximately 2.5 times that of case 2 resulting in a much higher risk of second infection. This is attributed to the airflow in case 3, where more vortices are generated inside the farmers’ market. Among all ventilation strategies, the aerosols deposited on the stalls in case 2 is the lowest. A similar variation of cumulative aerosols in cases 1 and 4 is observed. Overall, the difference between the total concentration of aerosols on the stalls of case 1, 2, and 4 are within 15%.
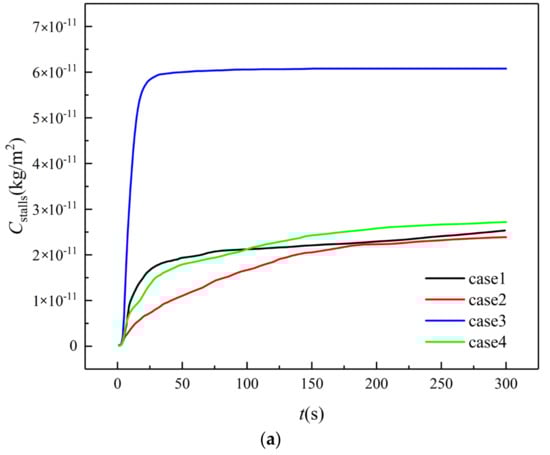
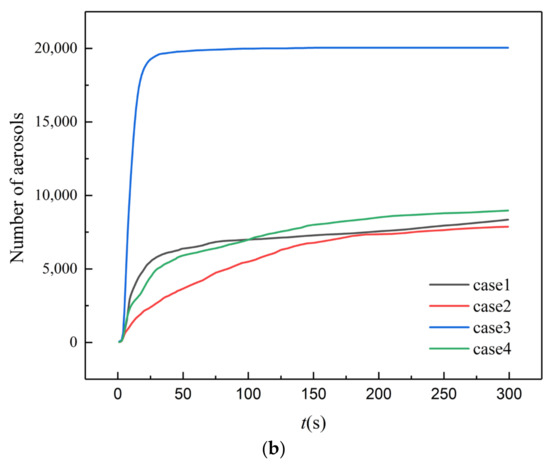
Figure 9.
Aerosols deposited on all stall surfaces. (a) Cumulative concentration; (b) Numbers.
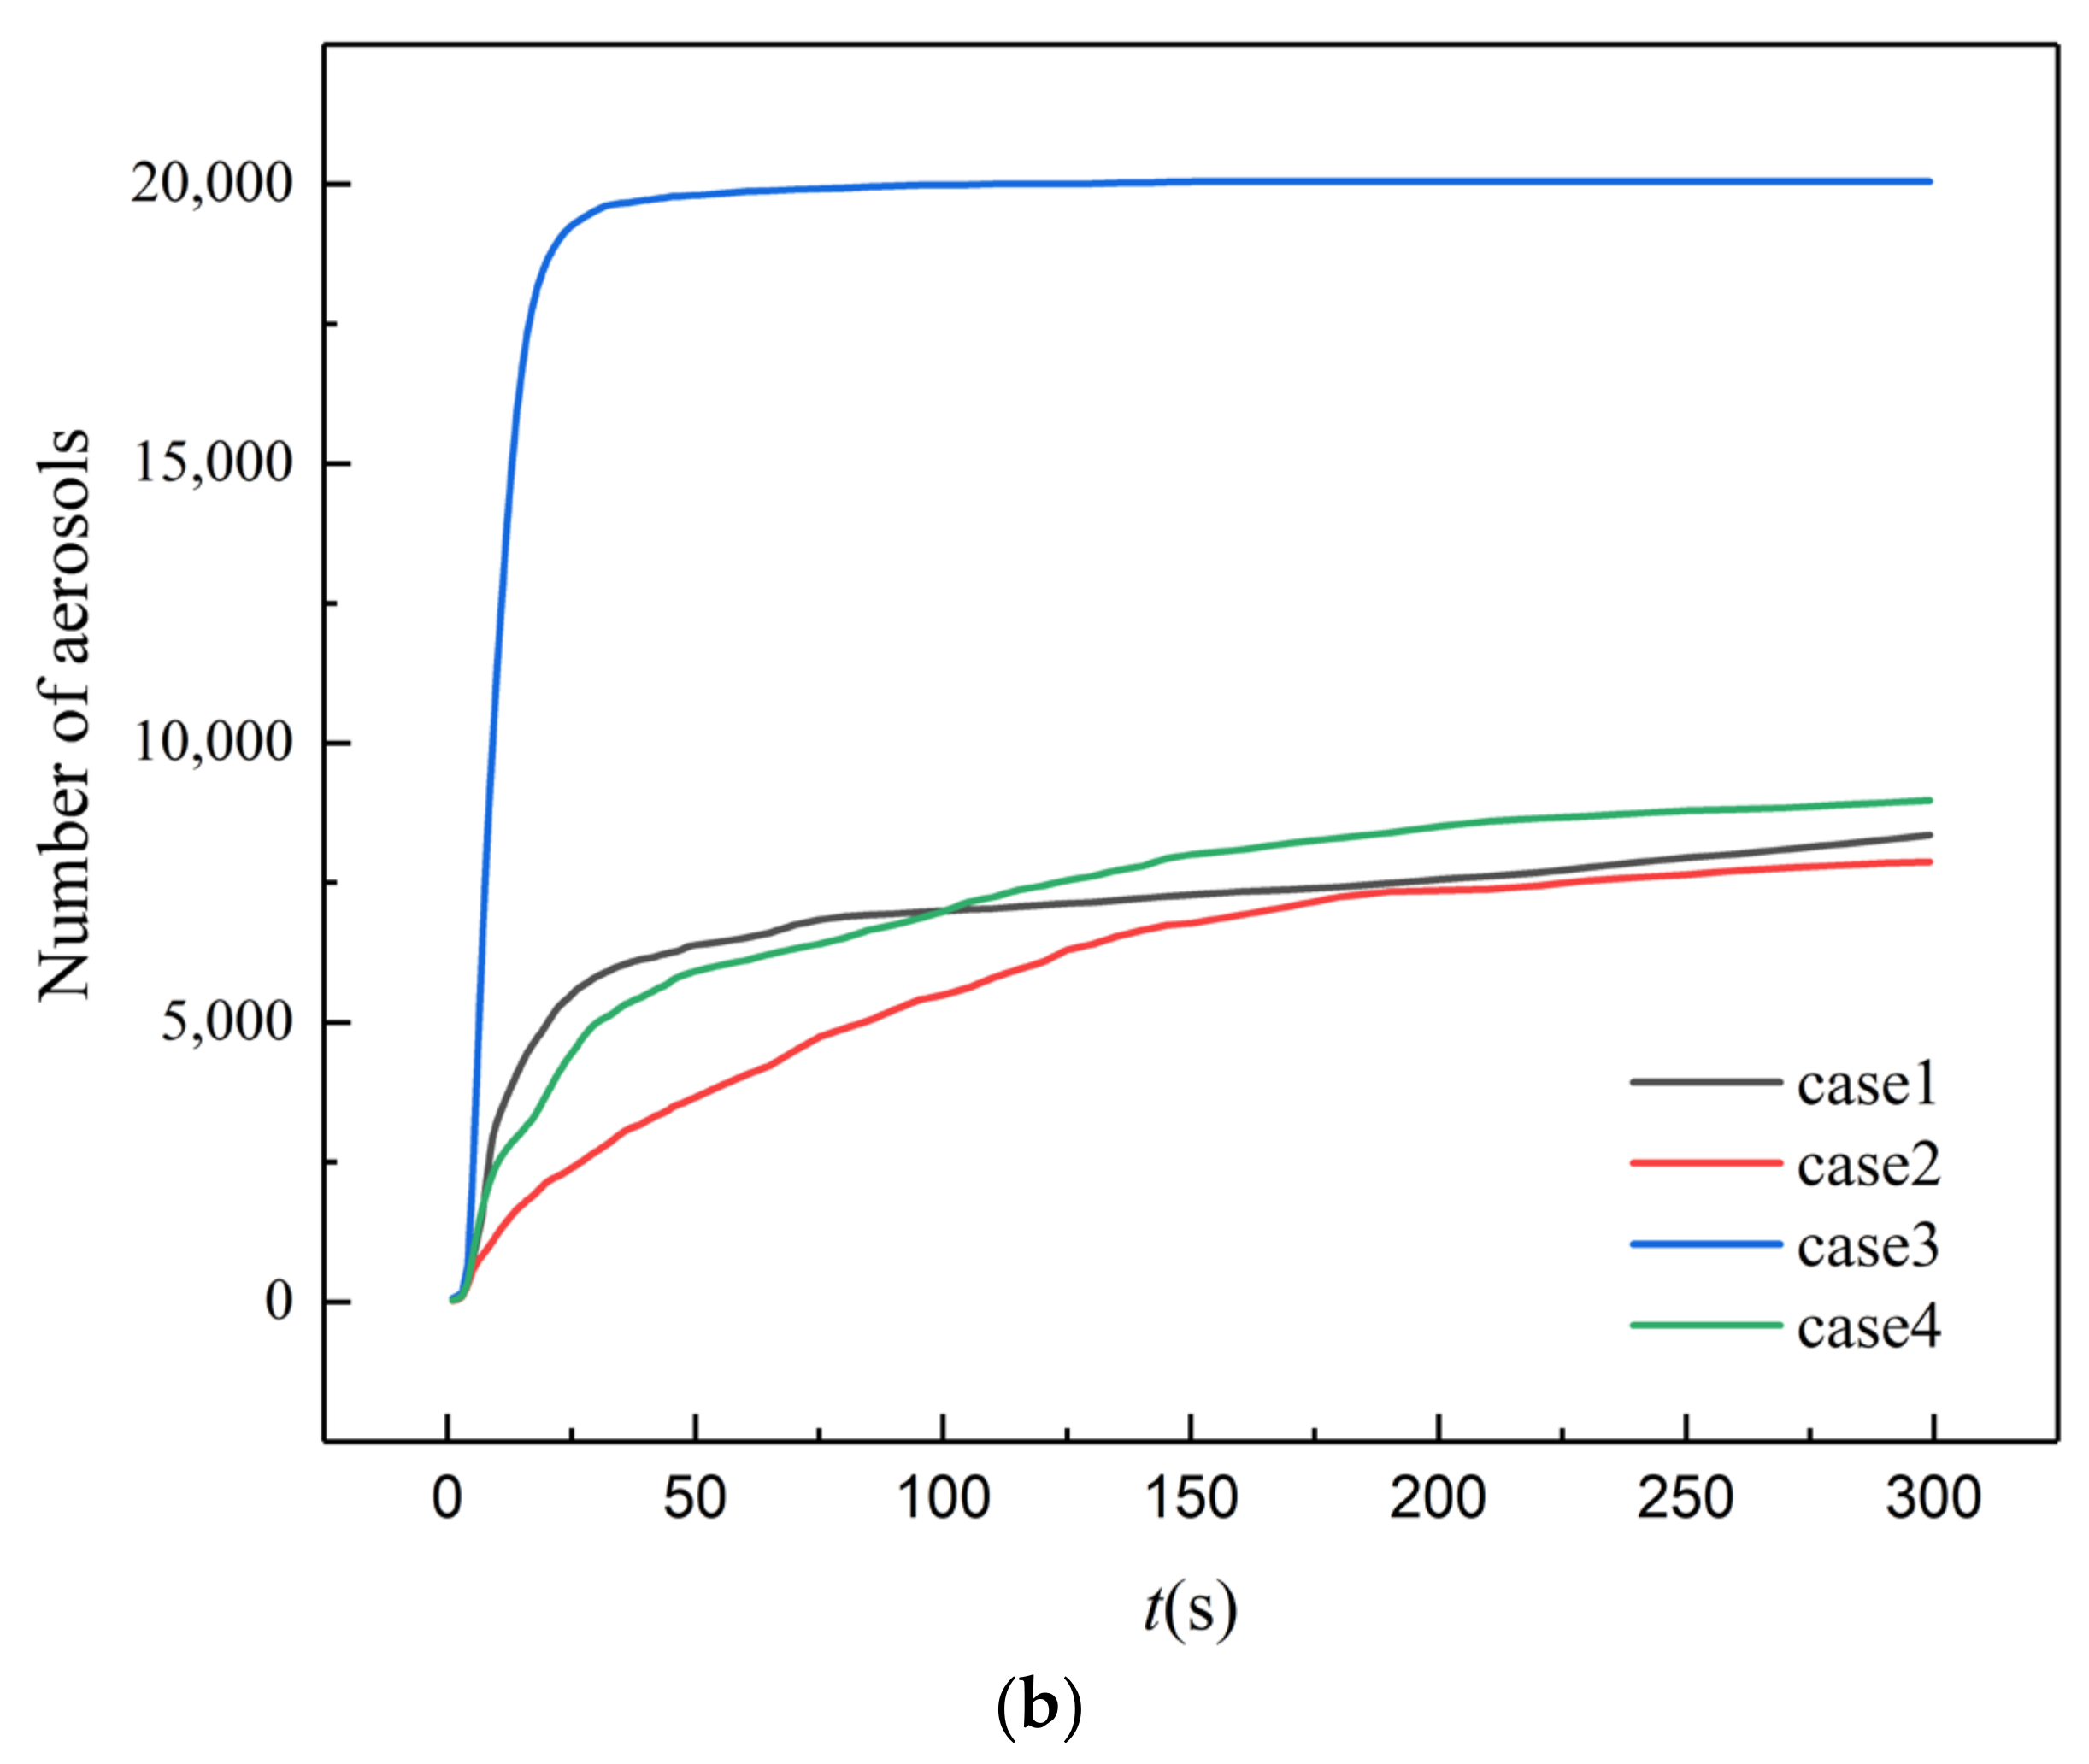
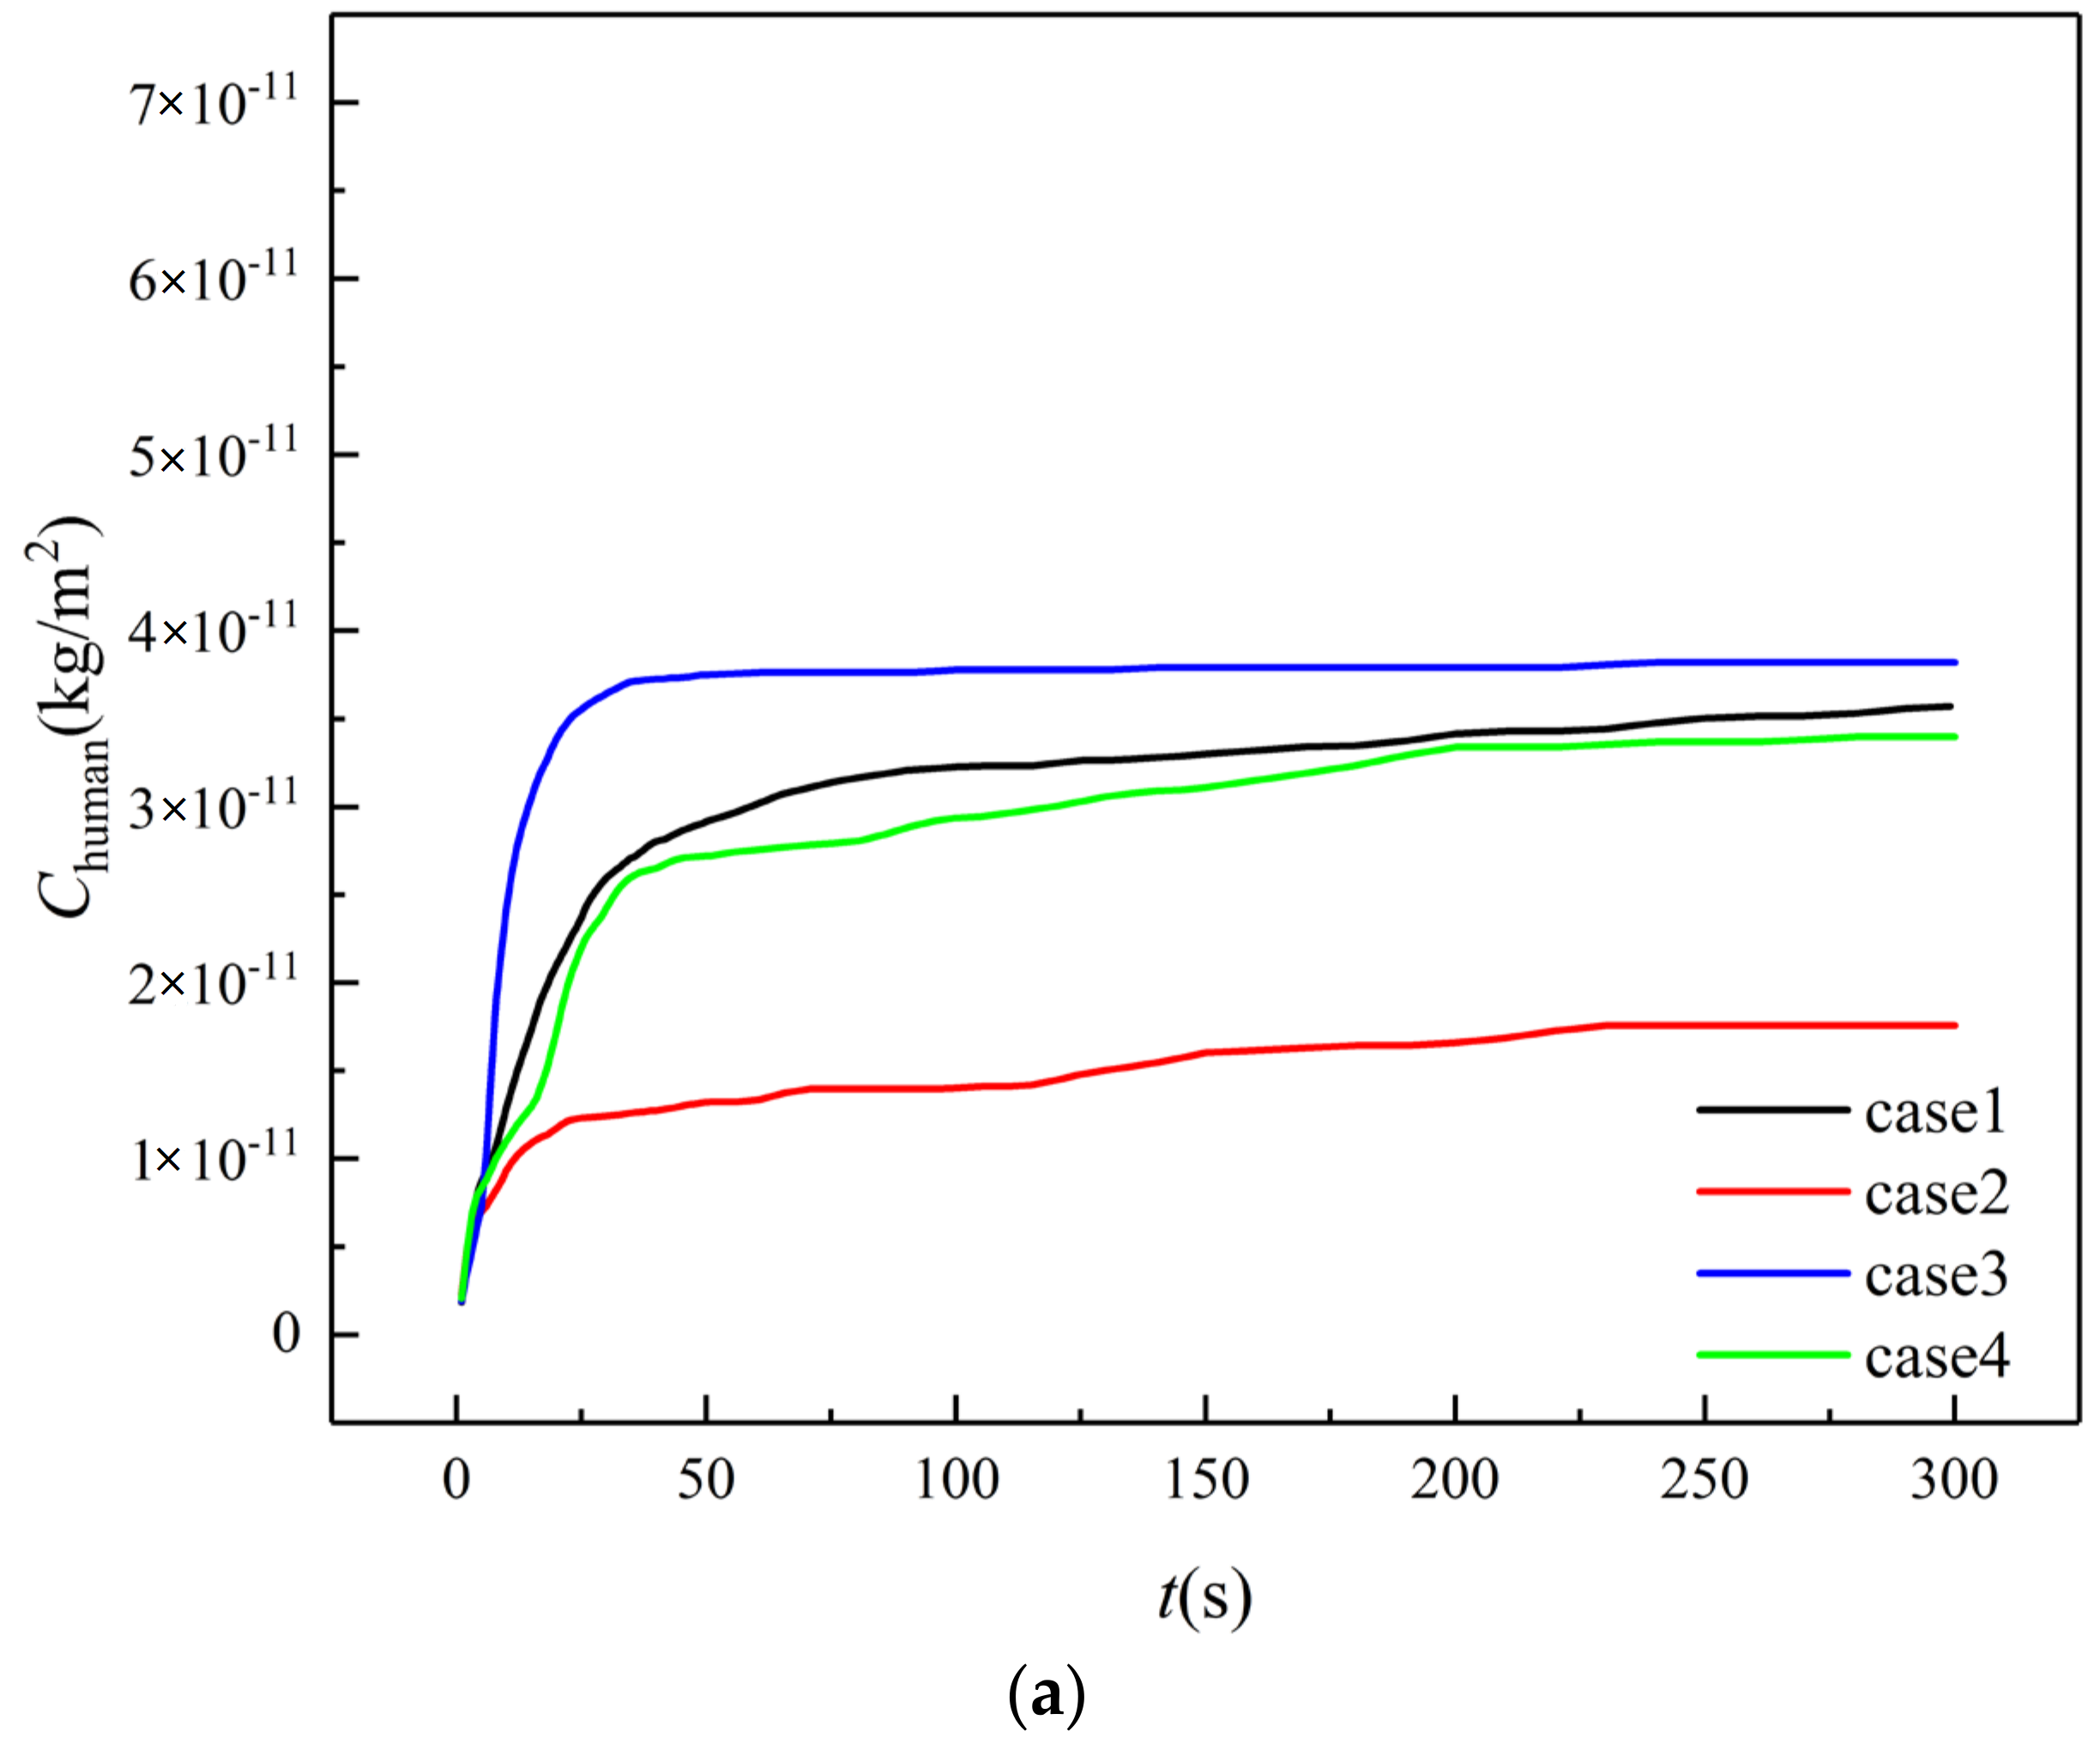
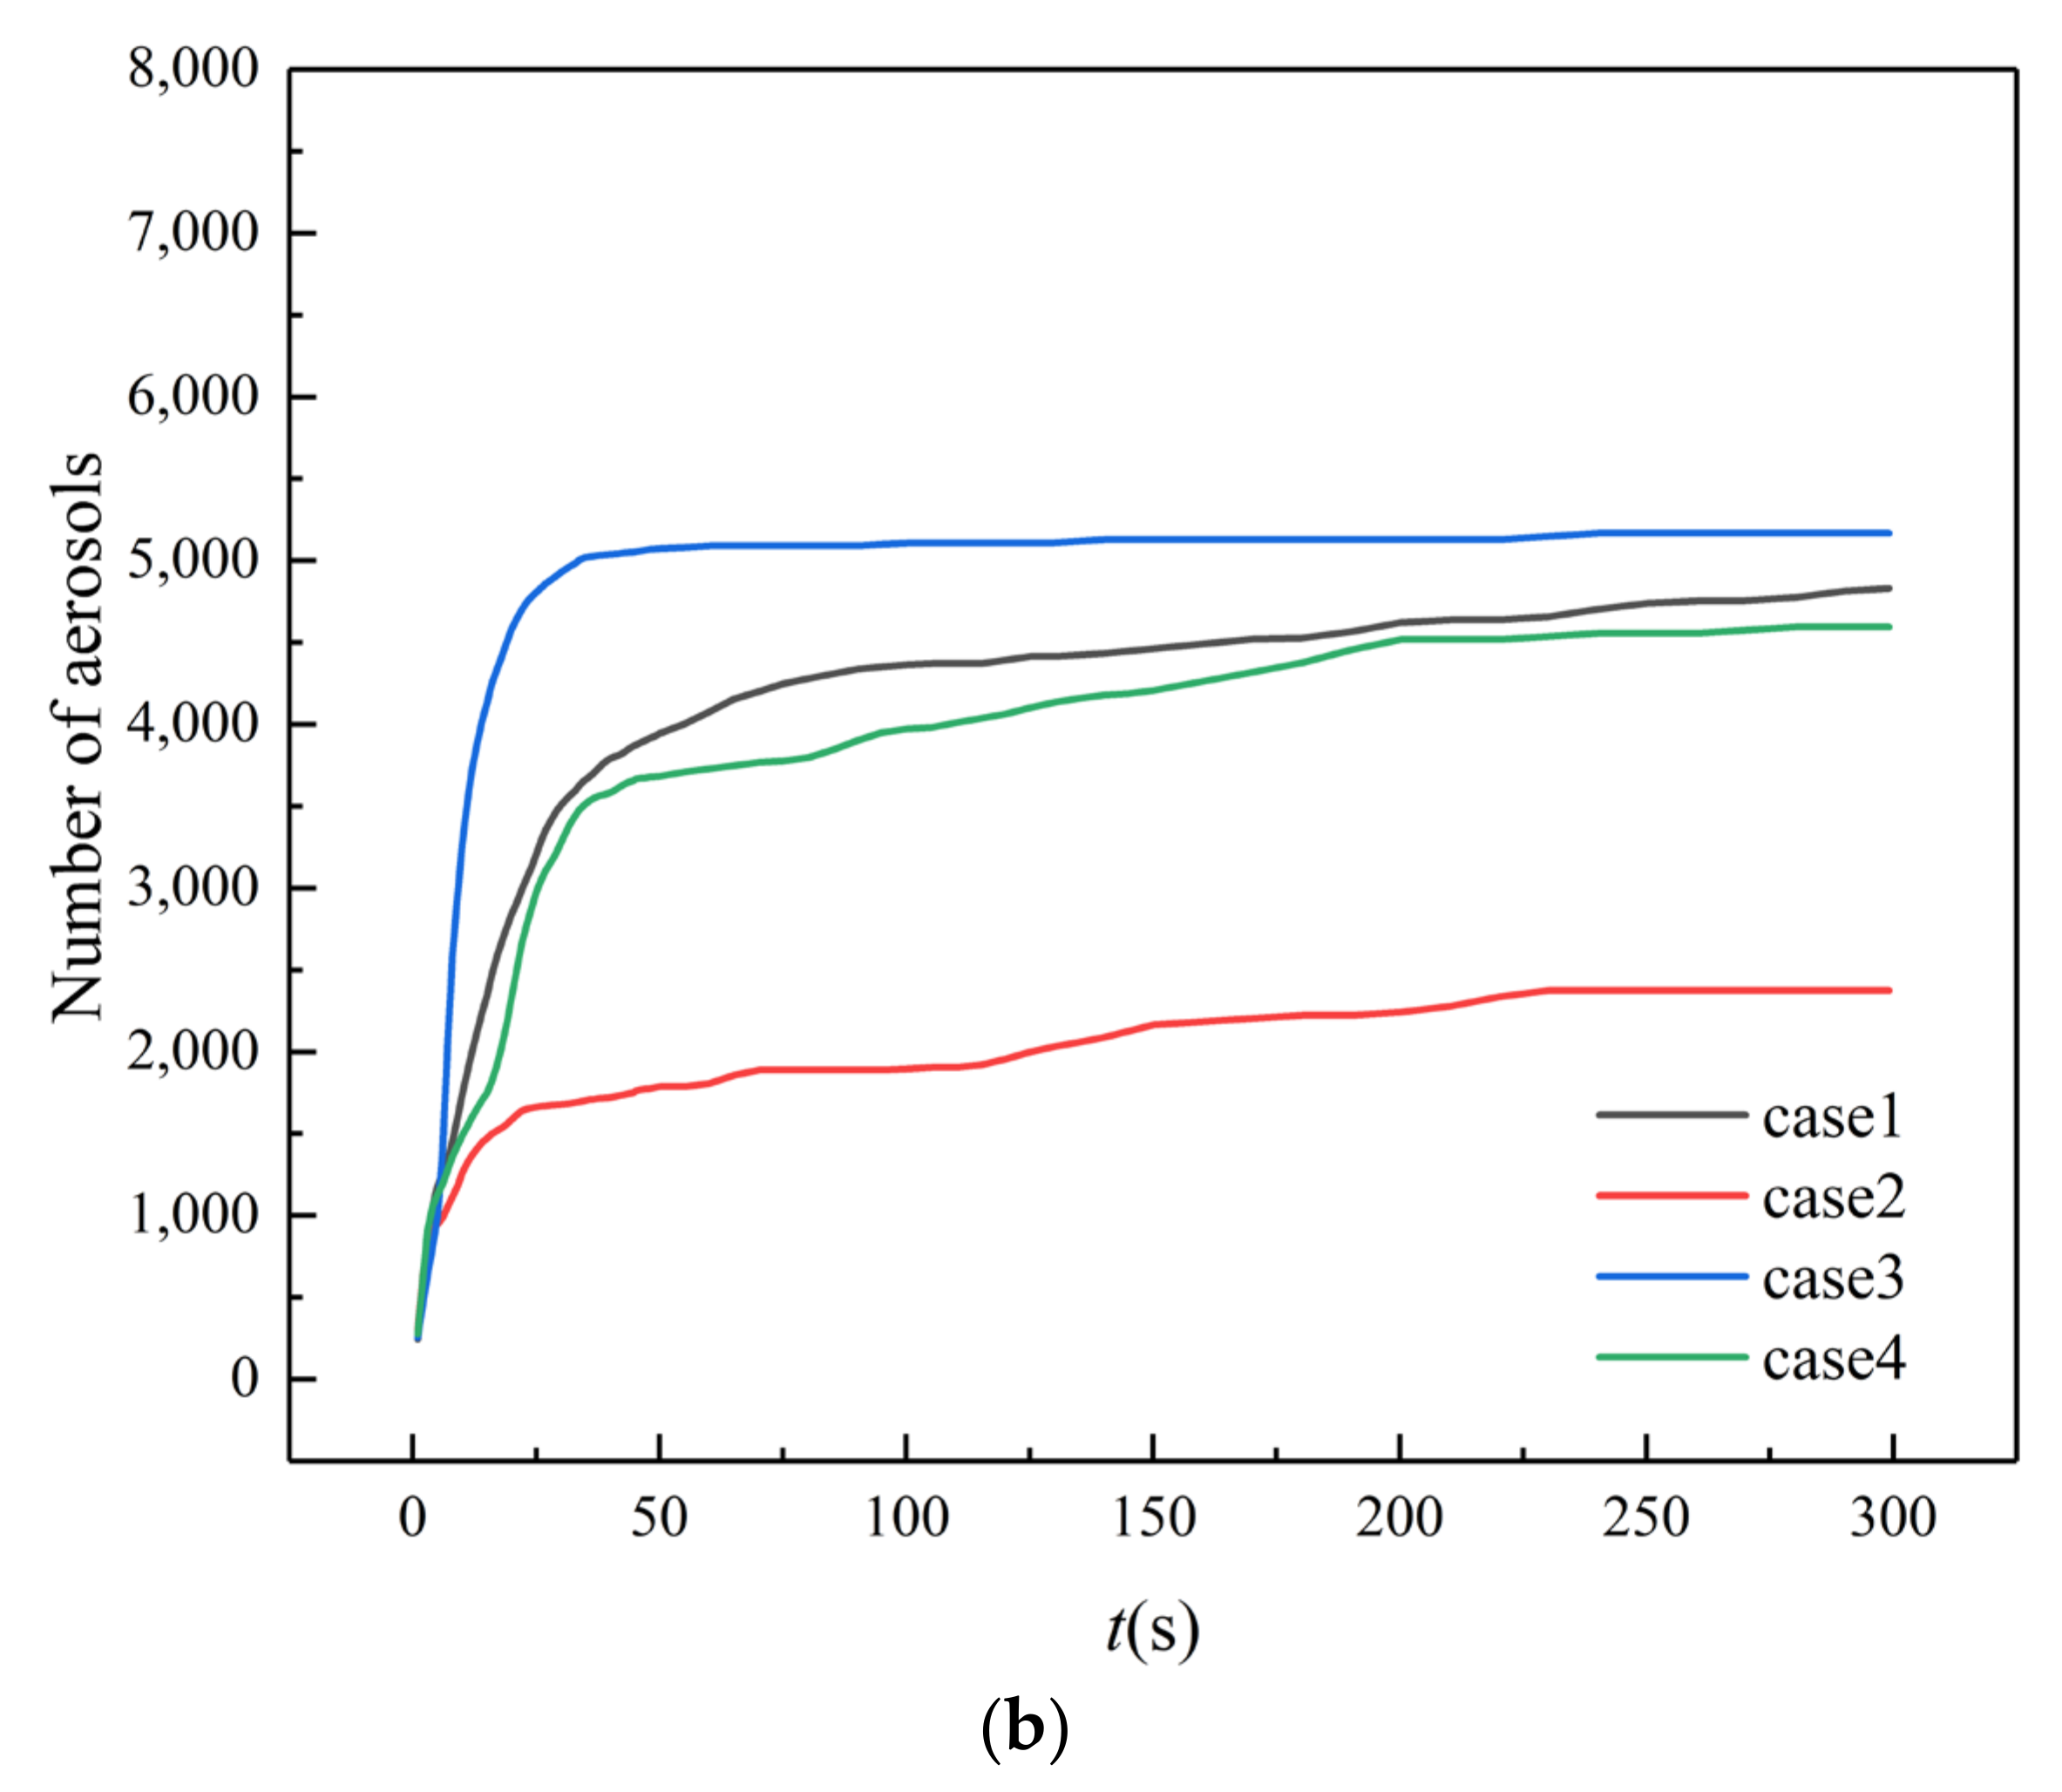
The aerosols deposited on the surfaces of human bodies are directly related to the risk of infection. Figure 10 compares the variation of the cumulative concentration of aerosols on all human body surfaces in the farmers’ market over time for four cases. Similar to the deposition of aerosols on the stalls, lowest concentration of aerosols on human bodies is observed in case 2, while the highest is observed in case 3, which is about 1.97 times that of case 2. However, the amount of aerosols deposited on human bodies in case 1 and 4 are close to that in case 3, indicating poor ventilation for cases 1 and 4. It can be concluded from Figure 9 and Figure 10 that the aerosols in case 3 are concentrated in the range below the height of the human body. For case 2, with reference to Figure 6, it can be seen that a large amount of aerosol escaped from the back door, and the remaining small amount of aerosol was trapped by the surface of the stall, human body, wall, and ceiling.
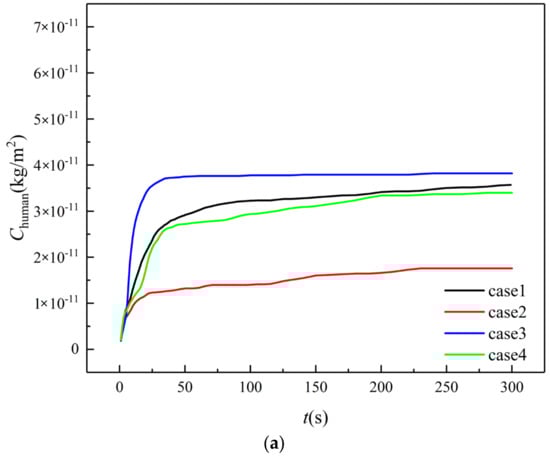
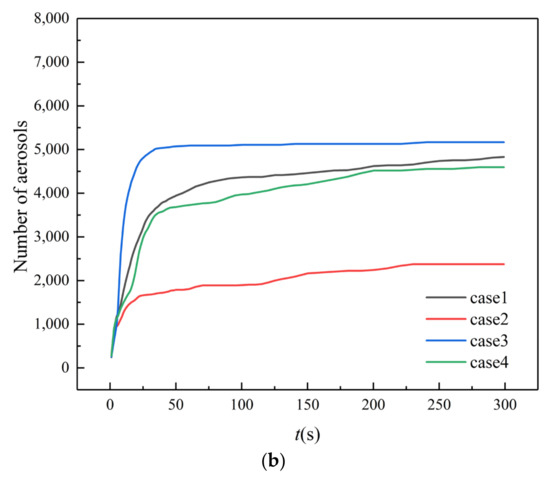
Figure 10.
Aerosols on all human body surfaces. (a) Cumulative concentration; (b) Numbers.
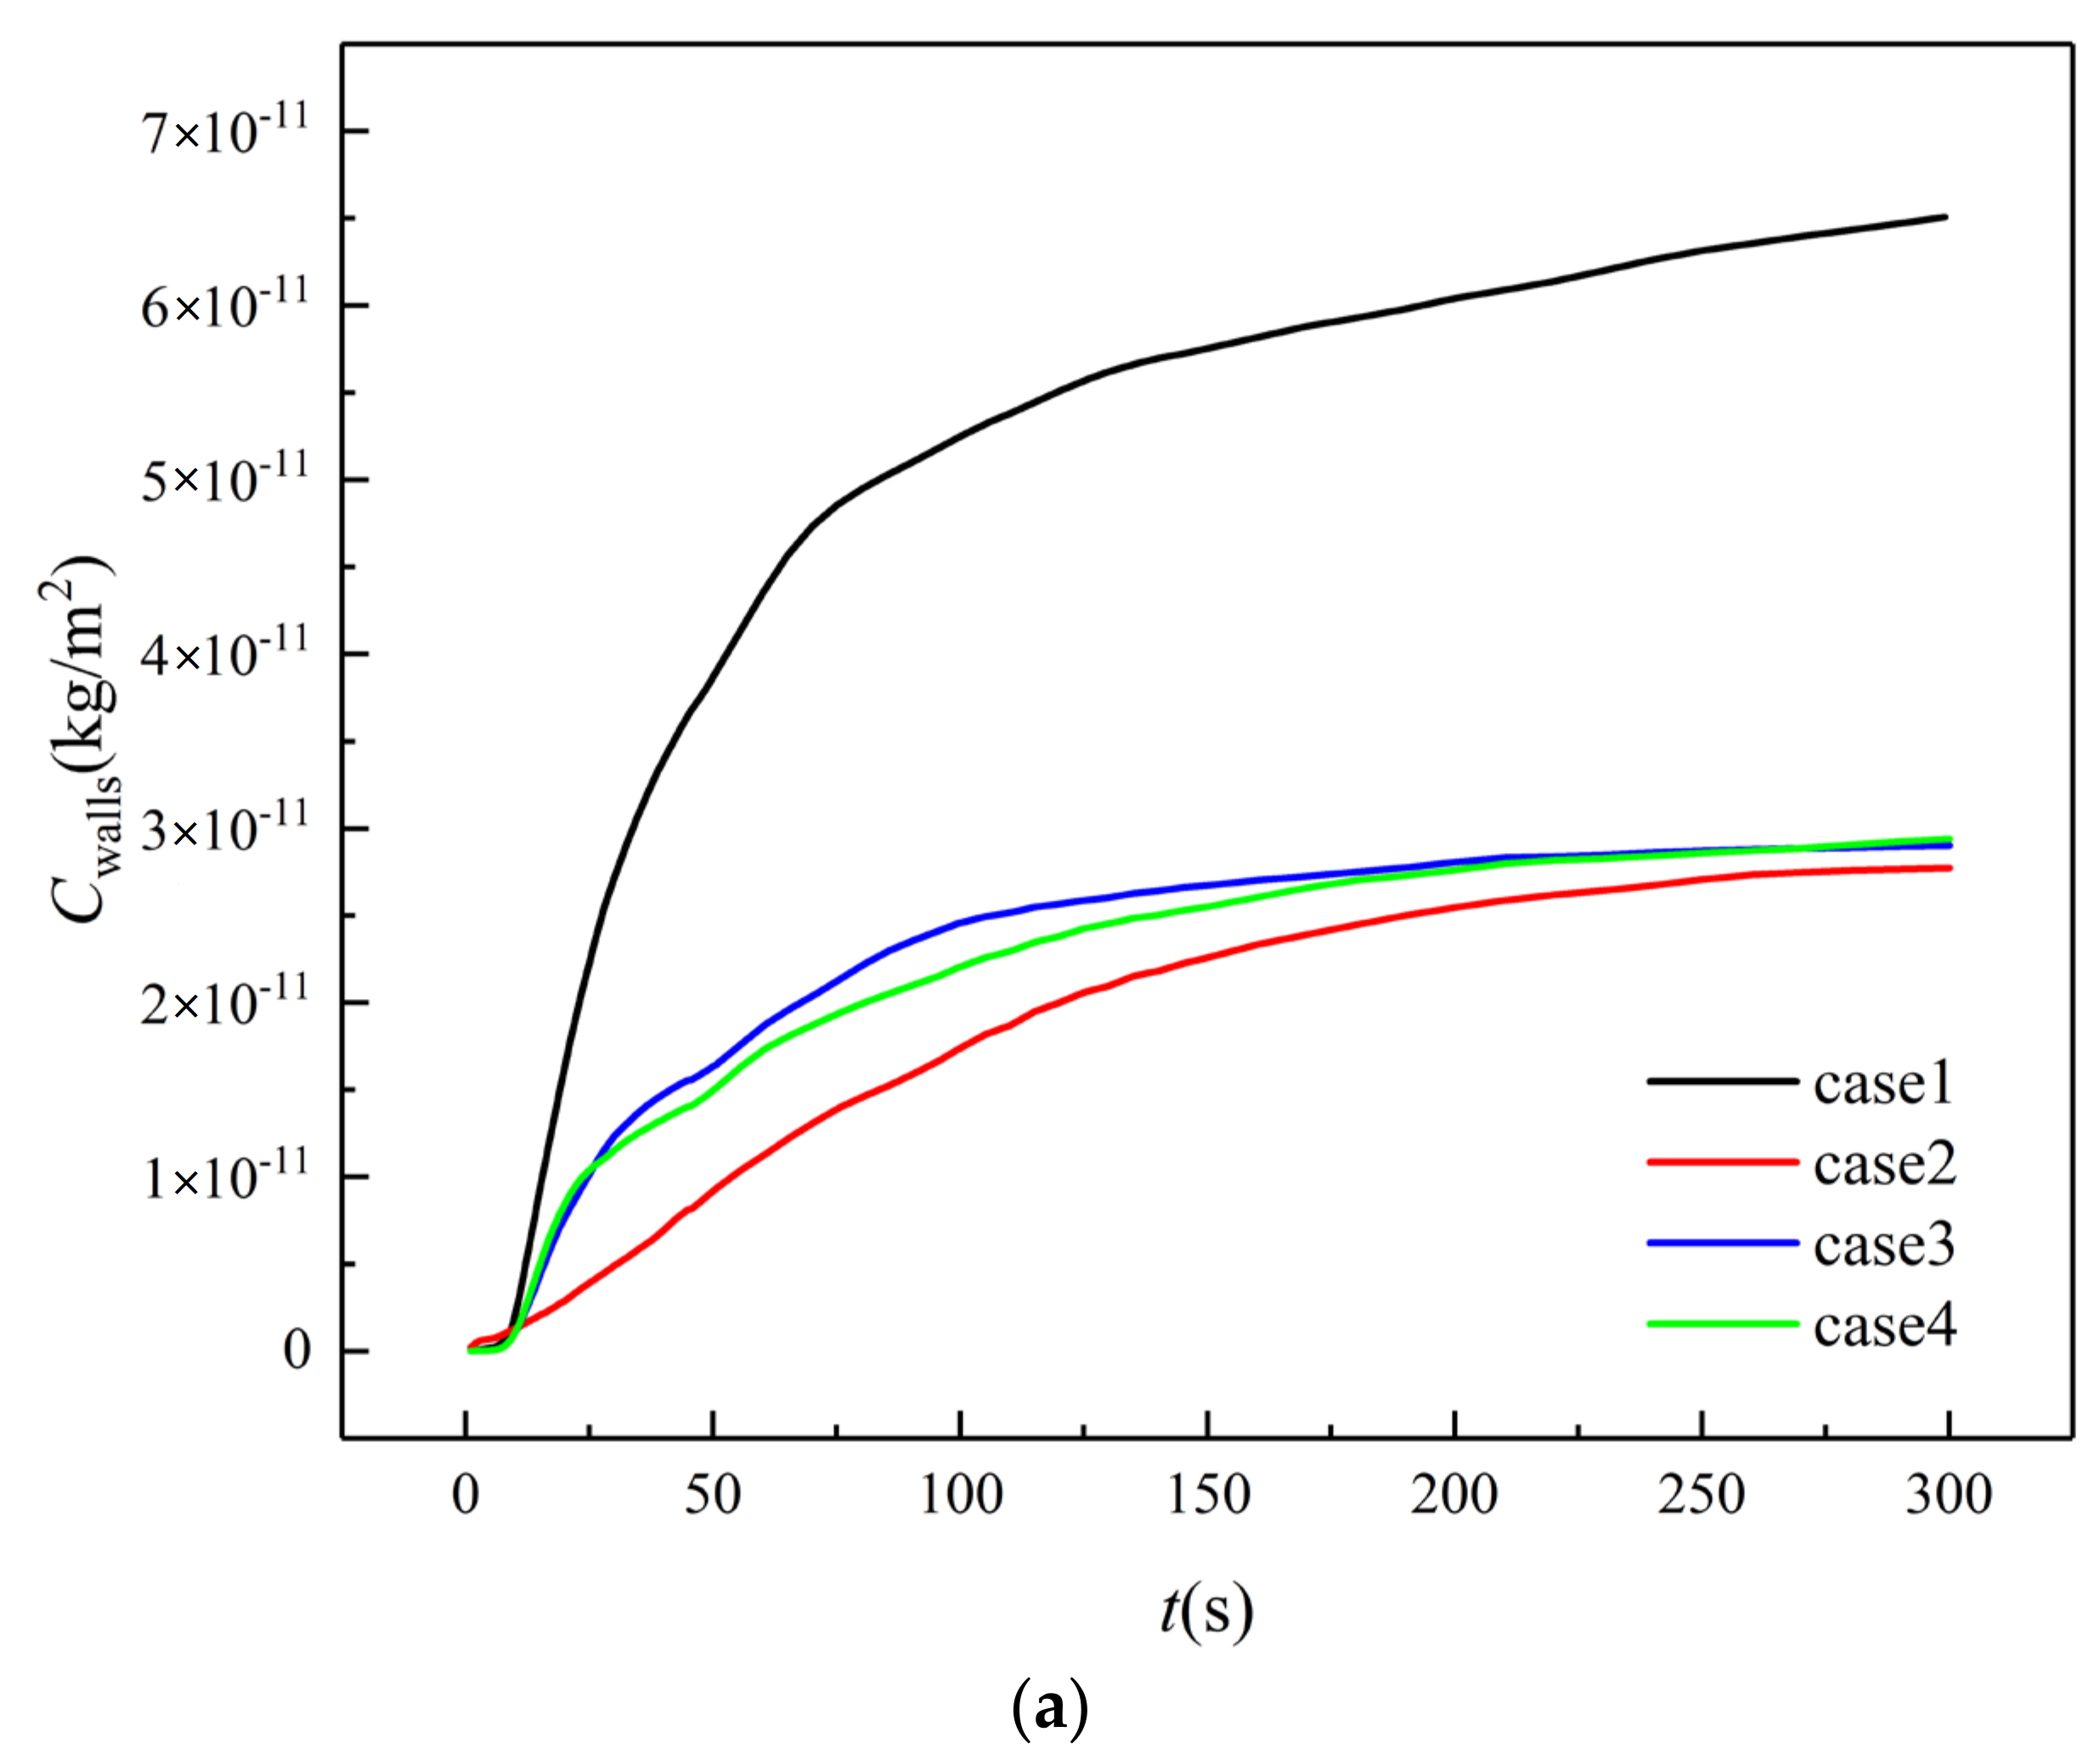
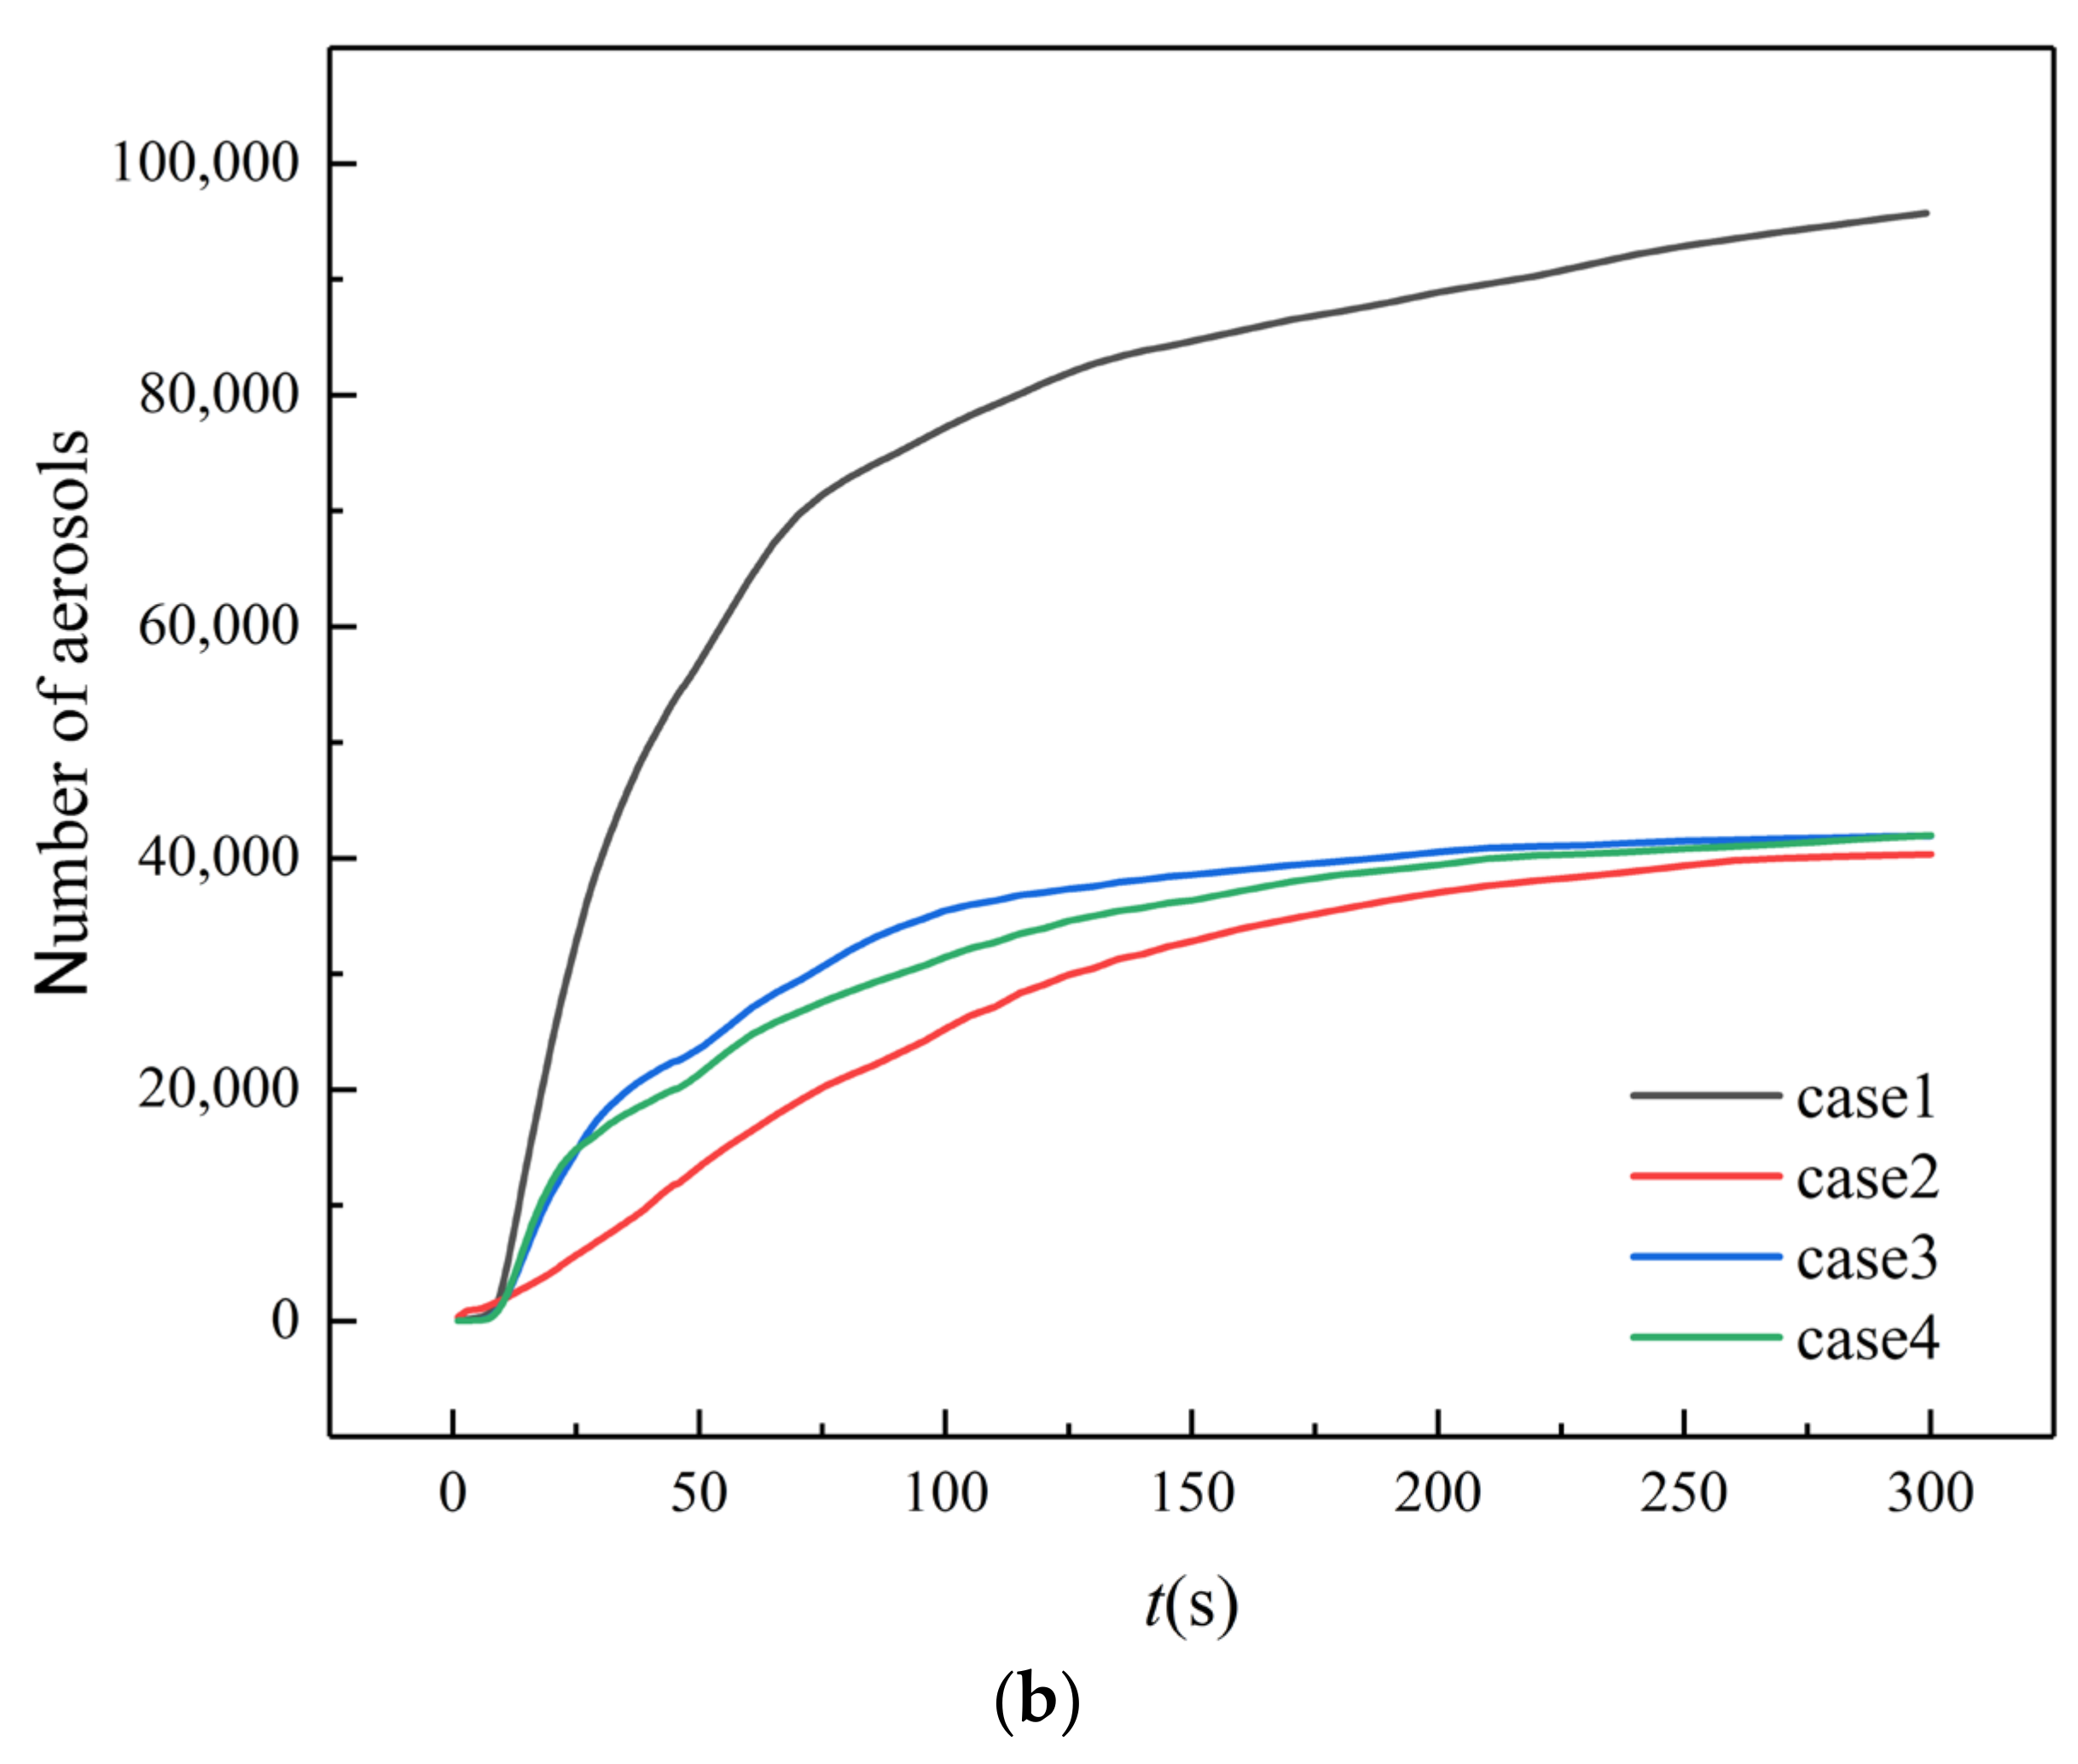
The cumulative concentration of aerosols on the walls, floor, and ceiling (Cwalls) in the farmers’ market is summarized in Figure 11. Different from the stalls and human body surfaces, the highest cumulative concentration of aerosols on the wall, floor, and ceiling is detected in case 1, which is about 2.21 times that of case 2. This is due to the slow update of indoor air in case 1. According to Figure 5, a large amount of aerosols from customer B gather near the ceiling at t = 20 s in case 1 and, hence, the increment of Cwalls is much faster than for the other cases after t = 20 s. On the other hand, the through flow in case 2 leads to a fast exhaust of aerosols from customer B and the risk of human infection in case 2 is relatively the lowest. Although there are four doors open in case 4, the flow rate at the back, left, and right doors in case 4 is lower than the flow rate at the back door in case 2. Moreover, the air distribution in case 4 is less uniform than case 2. Hence, the aerosols deposited on the walls, floor, and ceiling in case 4 are approximately the same as case 3.
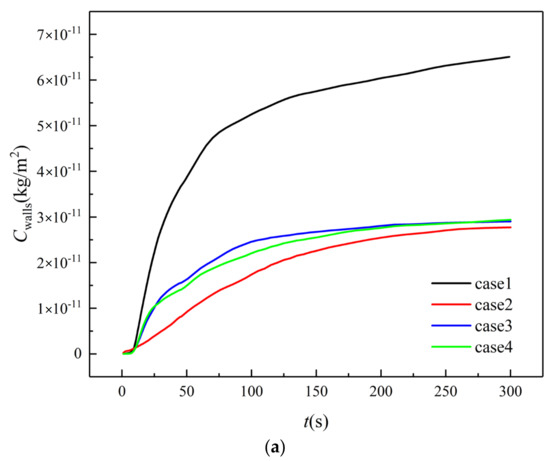
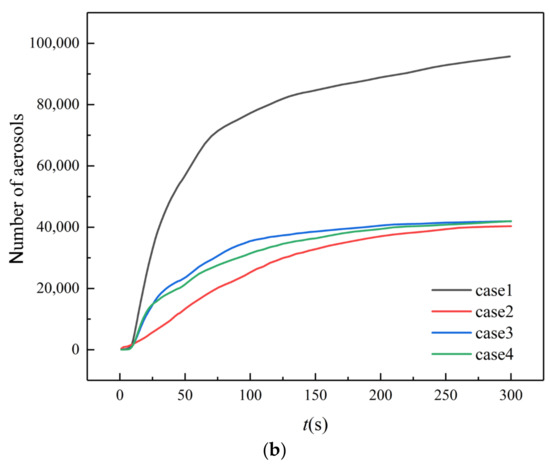
Figure 11.
Aerosols on the walls, floor, and ceiling. (a) Cumulative concentration; (b) Numbers.
4. Conclusions
In this work, the realizable k-ε model is coupled with a discrete phase model to study the spatial concentration and temporal evolution of aerosols from human sneeze in an indoor farmers’ market utilizing natural ventilation. The simplified model of the farmers’ market includes 18 vendors, 8 customers, and 6 stalls. Four cases with different designs of entrances and exits for the farmers’ market are studied. In case 1, only the front door is opened; in case 2, the front door and back door are opened; in case 3, the front door, left door, and right door are opened; and in case 4, the front door, back door, left door, and right door are opened. The outdoor wind enters the market from the front door.
Although sneeze aerosols are fast, their velocity decays rapidly. Within a second, most aerosols are moving at less than 1 m/s, and then they move with the wind as it enters through the front door. Therefore, the ventilation in the market has an important influence on aerosol transmission. By comparing the cumulative concentration of sneezed aerosols on stall surfaces, human body surfaces, the walls, floor, and ceiling in the farmers’ market, the risk of both direct infection and second infection is low in case 2. Hence, for a small farmers’ market, it is recommended to design two doors face to face on the walls perpendicular to the natural wind direction. A high concentration of aerosols is deposited on the walls, floor, and ceiling of farmers’ market with only one door open (case 1), which requires sanitizing for these surfaces in particular. Opening more doors at the walls parallel to the natural wind direction (case 3 and 4) is not beneficial for the fast exhaust of aerosols. In addition, over 60% of the aerosols deposited on the stalls and human body surfaces in the first minute after the sneeze, despite the ventilation strategy, indicating the risk of infection cannot be totally eliminated by natural ventilation in all cases.
Author Contributions
Supervision, F.Y.; investigation, J.D.; writing—original draft preparation, F.Y. and J.D. All authors have read and agreed to the published version of the manuscript.
Funding
This research was funded by the National Natural Science Foundation of China (No. 51906170).
Data Availability Statement
The data that support the findings of this study are not openly available and are available from the corresponding author upon reasonable request.
Conflicts of Interest
The authors declare no conflict of interest.
References
- Huang, C.; Wang, Y.; Li, X.; Ren, L.; Zhao, J.; Hu, Y.; Zhang, L.; Fan, G.; Xu, J.; Gu, X.; et al. Clinical features of patients infected with 2019 novel coronavirus in Wuhan, China. Lancet 2020, 395, 497–506. [Google Scholar] [CrossRef] [Green Version]
- World Health Organization. Novel Coronavirus (2019-nCoV): Situation Report, 3. 2020. Available online: https://apps.who.int/iris/bitstream/handle/10665/330762/nCoVsitrep23Jan2020-eng.pdf (accessed on 23 December 2020).
- Guo, Z.-D.; Wang, Z.-Y.; Zhang, S.-F.; Li, X.; Li, L.; Li, C.; Cui, Y.; Fu, R.-B.; Dong, Y.-Z.; Chi, X.-Y. Aerosol and surface distribution of severe acute respiratory syndrome coronavirus 2 in hospital wards, Wuhan, China, 2020. Emerg. Infect. Dis. 2020, 26, 1586. [Google Scholar] [CrossRef] [PubMed]
- Dbouk, T.; Drikakis, D. On respiratory droplets and face masks. Phys. Fluids 2020, 32, 063303. [Google Scholar] [CrossRef] [PubMed]
- Liu, L.; Li, Y.; Nielsen, P.V.; Wei, J.; Jensen, R.L. Short-range airborne transmission of expiratory droplets between two people. Indoor Air 2017, 27, 452–462. [Google Scholar] [CrossRef] [PubMed]
- Kohanski, M.A.; Lo, L.J.; Waring, M.S. Review of Indoor Aerosol Generation, Transport, and Control in the Context of COVID-19. Int. Forum Allergy Rhinol. 2020, 10, 1173–1179. [Google Scholar] [CrossRef]
- Anfinrud, P.; Stadnytskyi, V.; Bax, C.E.; Bax, A. Visualizing speech-generated oral fluid droplets with laser light scattering. N. Engl. J. Med. 2020, 382, 2061–2063. [Google Scholar] [CrossRef]
- Dbouk, T.; Drikakis, D. On airborne virus transmission in elevators and confined spaces. Phys. Fluids 2021, 33, 011905. [Google Scholar] [CrossRef]
- Das, S.K.; Alam, J.-e.; Plumari, S.; Greco, V. Transmission of airborne virus through sneezed and coughed droplets. Phys. Fluids 2020, 32, 097102. [Google Scholar] [CrossRef]
- Morawska, L.; Tang, J.W.; Bahnfleth, W.; Bluyssen, P.M.; Boerstra, A.; Buonanno, G.; Cao, J.; Dancer, S.; Floto, A.; Franchimon, F. How can airborne transmission of COVID-19 indoors be minimised? Environ. Int. 2020, 142, 105832. [Google Scholar] [CrossRef]
- Morawska, L.; Cao, J. Airborne transmission of SARS-CoV-2: The world should face the reality. Environ. Int. 2020, 139, 105730. [Google Scholar] [CrossRef]
- Zhang, C.; Pomianowski, M.; Heiselberg, P.K.; Yu, T. A review of integrated radiant heating/cooling with ventilation systems-thermal comfort and indoor air quality. Energ. Build. 2020, 223, 110094. [Google Scholar] [CrossRef]
- Ahmed, T.; Kumar, P.; Mottet, L. Natural ventilation in warm climates: The challenges of thermal comfort, heatwave resilience and indoor air quality. Renew. Sustain. Energy Rev. 2021, 138, 110669. [Google Scholar] [CrossRef]
- Schibuola, L.; Tambani, C. High energy efficiency ventilation to limit COVID-19 contagion in school environments. Energy Build. 2021, 240, 110882. [Google Scholar] [CrossRef] [PubMed]
- Jayaweera, M.; Perera, H.; Gunawardana, B.; Manatunge, J. Transmission of COVID-19 virus by droplets and aerosols: A critical review on the unresolved dichotomy. Environ. Res. 2020, 188, 109819. [Google Scholar] [CrossRef]
- Wu, L.; Liu, X.; Yao, F.; Chen, Y. Numerical study of virus transmission through droplets from sneezing in a cafeteria. Phys. Fluids 2021, 33, 023311. [Google Scholar] [CrossRef]
- Lauriks, T.; Longo, R.; Baetens, D.; Derudi, M.; Parente, A.; Bellemans, A.; van Beeck, J.; Denys, S. Application of Improved CFD Modeling for Prediction and Mitigation of Traffic-Related Air Pollution Hotspots in a Realistic Urban Street. Atmos. Environ. 2021, 246, 118127. [Google Scholar] [CrossRef]
- Szczepanik-Scislo, N.; Scislo, L. Comparison of CFD and Multizone Modeling from Contaminant Migration from a Household Gas Furnace. Atmosphere 2021, 12, 79. [Google Scholar] [CrossRef]
- Defraeye, T.; Blocken, B.; Carmelie, J. Convective heat transfer coefficients for exterior building surfaces: Existing correlations and CFD modelling. Energy Convers. Manag. 2011, 52, 512–522. [Google Scholar] [CrossRef] [Green Version]
- Yang, X.; Ou, C.; Yang, H.; Liu, L.; Song, T.; Kang, M.; Lin, H.; Hang, J. Transmission of pathogen-laden expiratory droplets in a coach bus. J. Hazard. Mater. 2020, 397, 122609. [Google Scholar] [CrossRef]
- Verma, T.N.; Sahu, A.K.; Sinha, S.L. Study of particle dispersion on one bed hospital using computational fluid dynamics. Mater. Today Proc. 2017, 4, 10074–10079. [Google Scholar] [CrossRef]
- Wang, J.-X.; Cao, X.; Chen, Y.-P. An air distribution optimization of hospital wards for minimizing cross-infection. J. Clean. Prod. 2021, 279, 123431. [Google Scholar] [CrossRef] [PubMed]
- Zhang, L.; Li, Y. Dispersion of coughed droplets in a fully-occupied high-speed rail cabin. Build. Environ. 2012, 47, 58–66. [Google Scholar] [CrossRef]
- Olsen, S.J.; Chang, H.-L.; Cheung, T.Y.-Y.; Tang, A.F.-Y.; Fisk, T.L.; Ooi, S.P.-L.; Kuo, H.-W.; Jiang, D.D.-S.; Chen, K.-T.; Lando, J. Transmission of the severe acute respiratory syndrome on aircraft. N. Engl. J. Med. 2003, 349, 2416–2422. [Google Scholar] [CrossRef] [PubMed]
- Desai, P.S.; Sawant, N.; Keene, A. On COVID-19-safety ranking of seats in intercontinental commercial aircrafts: A preliminary multiphysics computational perspective. Build. Simul. 2020, 14, 1585–1596. [Google Scholar] [CrossRef] [PubMed]
- Abuhegazy, M.; Talaat, K.; Anderoglu, O.; Poroseva, S.V. Numerical investigation of aerosol transport in a classroom with relevance to COVID-19. Phys. Fluids 2020, 32, 103311. [Google Scholar] [CrossRef] [PubMed]
- Wang, J.-X.; Li, Y.-Y.; Liu, X.-D.; Cao, X. Virus transmission from urinals. Phys. Fluids 2020, 32, 081703. [Google Scholar] [CrossRef]
- Li, Y.-y.; Wang, J.-X.; Chen, X. Can a toilet promote virus transmission? From a fluid dynamics perspective. Phys. Fluids 2020, 32, 065107. [Google Scholar] [CrossRef]
- Chen, Y.P.; Wu, L.Y.; Zhang, L. Dynamic behaviors of double emulsion formation in a flow-focusing device. Int. J. Heat Mass Transf. 2015, 82, 42–50. [Google Scholar] [CrossRef]
- Chen, Y.; Liu, X.; Shi, M. Hydrodynamics of double emulsion droplet in shear flow. Appl. Phys. Lett. 2013, 102, 051609. [Google Scholar] [CrossRef]
- Pereira, T.W.C.; Marques, F.B.; Pereira, F.d.A.R.; da Cunha Ribeiro, D.; Rocha, S.M.S. The influence of the fabric filter layout of in a flow mass filtrate. J. Clean. Prod. 2016, 111, 117–124. [Google Scholar] [CrossRef]
- Feng, G.H.; Zhang, Y.; Lan, X.Y. Numerical study of the respiratory aerosols transportation in ventilated classroom. Appl. Mech. Mater. 2012, 204, 4298–4304. [Google Scholar] [CrossRef]
- Gao, W.; Liu, M.F.; Chen, S.F.; Zhang, C.B.; Zhao, Y.J. Droplet microfluidics with gravity-driven overflow system. Chem. Eng. J. 2019, 362, 169–175. [Google Scholar] [CrossRef]
- Dbouk, T.; Drikakis, D. On coughing and airborne droplet transmission to humans. Phys. Fluids 2020, 32, 053310. [Google Scholar] [CrossRef] [PubMed]
- Wang, J.; Gao, W.; Zhang, H.; Zou, M.H.; Chen, Y.P.; Zhao, Y.J. Programmable wettability on photocontrolled graphene film. Sci. Adv. 2018, 4, eaat7392. [Google Scholar] [CrossRef] [PubMed] [Green Version]
- Wang, J.; Sun, L.; Zou, M.; Gao, W.; Liu, C.; Shang, L.; Gu, Z.; Zhao, Y. Bioinspired shape-memory graphene film with tunable wettability. Sci. Adv. 2017, 3, e1700004. [Google Scholar] [CrossRef] [Green Version]


Publisher’s Note: MDPI stays neutral with regard to jurisdictional claims in published maps and institutional affiliations. |
© 2022 by the authors. Licensee MDPI, Basel, Switzerland. This article is an open access article distributed under the terms and conditions of the Creative Commons Attribution (CC BY) license (https://creativecommons.org/licenses/by/4.0/).