Abstract
Major earthquakes can cause extensive damage to buildings and alter both the natural and built environments. Accurately estimating the financial impact from these events is complex, and the damage is not always visible to the naked eye. PACT, SLAT, and HAZUS are some of the computer-based tools designed to predict probable damage before an earthquake. However, there are no identifiable models built for post-earthquake use. This paper focuses on verifying the significance and usage of variables that specifically need to be considered for the post-earthquake cost estimation of earthquake damage repair work (CEEDRW). The research was conducted using a questionnaire survey involving 92 participants who have experience in cost estimating earthquake damage repair work in New Zealand. The Weighted Average, Relative Importance Index (RII), and Exploratory Factor Analysis were used to analyse the data. The research verified that eleven major variables that are significant to the CEEDRW and should be incorporated to cost estimation models. Verified variables can be used to develop a post-earthquake repair cost estimation tool and can be used to improve the pre-earthquake loss prediction tools.
1. Introduction
Earthquakes are naturally occurring, unpredictable hazards that could cause a considerable amount of damage to communities and their economies. From 1980 to 2018, 115 catastrophic earthquake and tsunami events caused 806,134 fatalities, US $885 billion in overall losses, and US $119 billion in insured losses [1]. Japan, China, United States, and New Zealand have been some of the world’s latest most prominent victims at considerable cost [1]. For example, it is estimated that rehabilitation after the 2010–2011 Canterbury earthquake sequence (CEQS) in New Zealand required NZ $40 billion and NZ $21 billion in insured losses [2,3]. Some of the recovery work of CEQS continued even in 2019. Since a singular event can cause a considerable impact on a country and its insurance sector, an accurate estimation of the financial impact of repairing buildings after an earthquake is imperative.
The repair cost is one of the vital factors deciding if the property is repaired or rebuilt [4]. There were many previous studies conducted on earthquake disaster modelling. Performance-based earthquake engineering (PBEE) framework-based FEMA P-58 methodology and regional damage evaluation and estimation using GIS are some of the prominent methodologies used for earthquake damage predictions [4,5]. Based on this, PACT, SLAT, HAZUS and, SP3 tools were developed to estimate the; repair time, repair cost, casualties or injuries, and safety placarding [6,7,8]. These tools were developed to predict the probable damage from future earthquakes and reduce future damage to buildings by improving the performance of building elements [4,9,10]. Other research further improved these processes using methods like seismic community resilience modelling, 3D scan-based damage mapping, 3D element visualisation, and productivity sequencing [11,12,13]. However, these tools have limitations related to the cost estimation process like non-consideration of; the impact of time duration on cost estimations, price escalations due to demand surge, the current state of the building, and aftershocks [14]. The aforementioned limitations prevent these tools from producing more accurate repair cost estimates [5,15], which are required for post-earthquake cost estimation. Therefore, there is an opportunity to improve the cost estimation processes for these tools.
One main reason for discrepancies between construction cost estimates produced by computer modelling tools and the final building repair cost is that multiple variables impact the estimated construction cost. Non-consideration of such variables is one reason for cost overruns [16]. There has been much research into variables influencing cost variations in construction projects [16,17,18,19,20]. The impact of these variables differs based on the project type.
During the post-earthquake stage, there are exceptional variables that impact costs. Previous research has noted eleven such variables that specifically impact earthquake damage scenarios [21]. The existence and impact of some of these variables are further discussed in the next section.
Variables Considered in Current Cost Estimation Models
Previous research has suggested that most of the variables affecting earthquake damage repair work are considered in post-earthquake repair cost estimations. However, unforeseeable damage, occupancy during repair, and aftershocks’ impact are the only three variables considered by current cost estimation tools. However, the impact of occupancy during repair work was only used for time estimation and not for the cost estimation process [14]. The impact of aftershocks and earthquake-induced hazards is also partially included in the models. Nevertheless, compared with post-earthquake damage estimation, P-58 methodology-based models have the advantage as they include unforeseen probable damage based on past and experimental data. However, earthquake cost estimates produced from these models will never match the actual value and will likely never get to that point. However, a post-earthquake cost estimation model should consider the impact of these variables. Therefore, the following Table 1 synthesis the variables in detail with their impact on the project cost.

Table 1.
Variables impacting CEEDRW.
Even though a significant amount of evidence on variables impacting general construction cost, only one previous research was able to cumulate and identify the variables impacting CEEDRW through exploratory study [52]. However, the impacts of those variables post-earthquake CEEDRW were not verified. This research focuses on verifying the usage of variables in CEEDRW and identifying the significance of each on CEEDRW.
2. Materials and Methods
This research focuses on verifying the usage of aforementioned eleven variables (F01–F11) on CEEDRW and identifying the significance of each on CEEDRW, based on professional opinion (refer Table 2). A questionnaire survey was the data collection method used. The questionnaire survey was chosen as the most suitable method of data collection as it allowed acquiring a high number of respondents in a short period.
Table 2.
Variables considered in the research.
2.1. Questionnaire Design
The questionnaire survey contained three sections. The first section of the questionnaire was designed to acquire details of participants, specifically experience in CEEDRW. However, no names of the participants were collected to allow them to be anonymous. Only participants with experience in CEEDRW were considered for the study. The second section was used to verify if these variables were considered cost estimation during repair work related to the Canterbury earthquake and which should be used in future CEEDRW. The third section aims to identify the significance of the variables affecting CEEDRW using the five-point Likert scale (Five being very important and one being not important at all). Refer to Figure A1, Figure A2, Figure A3 and Figure A4 in Appendix A for a sample of the questionnaire design.
2.2. Sampling Method and Data Collection
The questionnaire survey targeted professionals with experience in CEEDRW in New Zealand who were hard to identify. Purposive sampling method can be used for highly relevant and specialised populations that are difficult to reach [53,54]. Therefore, the purposive sampling method was used for the questionnaire survey distribution. As the most likely professionals involved, the questionnaire was first distributed through the monthly newsletter to all NZIQS members (The New Zealand Institute of Quantity Surveyors), who were the main contributors to CEEDRW. The NZIQS newsletter only yielded four responses making the response rate less than 0.2%. Because of the low response rate, online directories and databases on cost estimators and builders were used to sending 310 emails engaged via email and telephone reminders. Later, the survey yielded 94 replies with a 30.3% response rate. Both methods yielded 98 responses. Based on the information provided in section one of the questionnaire, six respondents were excluded from the data set as they did not have experience in CEEDRW. From the remaining 92 participants (refer to Figure 1), almost half of the participants had more than five years of experience in CEEDRW.
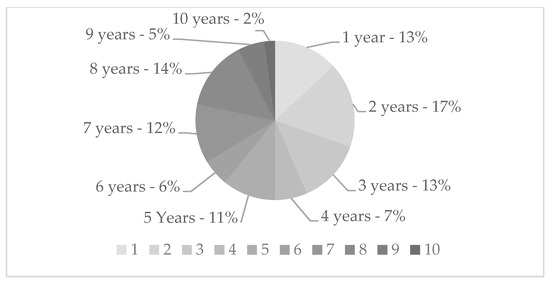
Figure 1.
Years of experience in estimating the cost of earthquake damage repair work.
2.3. Validity and Reliability
The validity and reliability of the research method ensure the credibility and dependability of the research output. The validity of the research methods focuses on the proper design of the questionnaire that will accurately fulfill the objectives [55]. The validity of a questionnaire was evaluated in different areas such as construct validity, content validity, predictive validity, and face validity. However, the required validity methods depend on the aims of the research. Description of each validity and method of achieving is mentioned in Table 3. The data collection process was also approved by the Massey University Human Ethics Committee: Northern (Application 4000017232), which would also improve the validity of the research.
Table 3.
Method of achieving the required validity of the research.
2.4. Research Bias
Even though many measures were used to improve validity and reliability, this research contains some research bias. These are selection bias, convivence bias, volunteer bias, non-response bias, response bias and wording bias. Details related to each type of bias are summarised in Table 4.
Table 4.
Types of Bias related to the research.
2.5. Data Analysis Method
Variables affecting CEEDRW were ranked according to the weighted average and relative important index (RII). Weights in the Likert scale were assigned to quantify the inputs. Based on that, the variables were ranked. Finally, a principal component analysis was conducted to identify the relationship between the variables. RII was used to identify the significance of the variables. RII was calculated using the following Equation (1):
In which: w is the specific weight suggested by the respondents, A is the highest allocable weight, and N is the total number of respondents [56].
Once the factors are ranked, the data set should be tested for factor analysis. Kaiser–Meyer–Olkin (KMO) and Bartlett’s test of sphericity is one of the tests that can be conducted to test whether a factor analysis is appropriate for a data set or not. A dataset should acquire a value above 0.5 and near 1.0 in the KMO test [57]. Data in Section 2 of the research acquired 0.768, which was considered adequate for the research.
The selected factors are further scrutinised to remove insignificant factors using a scree plot or parallel analysis method. The scree plot uses a graph of the Eigenvalues to find change natural bend in data. Further, random order Eigenvalues were generated and compared with actual Eigenvalues. The factors are accepted if the actual Eigenvalues are higher than the random order Eigenvalues [58,59]. However, Williams et al. [58] and Henson and Roberts [60] justified that the parallel analysis method is a more reliable and consistent method for selecting the factors than a scree plot method. Therefore, a parallel analysis was used to remove insignificant factors.
3. Results
3.1. Variables Considered in Past CEEDRW and to Be Considered in Future CEEDRW
According to the study, F 09.1 (Changes required in reconstruction to meet statutory compliance) and F 01 (Consequential damage repair) were identified as the most commonly considered variables in damage estimates endorsed by more than 90% of respondents (refer to Figure 2). However, F 05.1 (damage from aftershocks), F 02.4a (Cost of lawyers’/advocates’ legal services), and F 02.4b (Cost of dispute resolution facilitators’/dispute resolvers’ services) were considered by less than 50% in their CEEDRW. However, more than 60 percent of the participants agreed that these three variables should be considered in future CEEDRW.
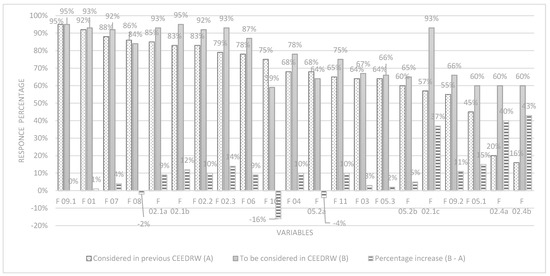
Figure 2.
Comparison between variables that were considered in previous CEEDRW and variables that should be included CEEDRW.
In addition, three variables show decreased approval to be included in future CEEDRW. These were F 08 (Initially unforeseen damage), F 10 (Pre-earthquake state of the building), and F 05.2a (Damage from earthquake-induced hazards—flood).
3.2. Significance of These Variables on Cost
According to the questionnaire survey, more than 50% of the participants considered these variables in their CEEDRW, except for F 05.1, F 02.4a and F 02.4b. However, these variables must be included in cost estimations based on the significance of their financial impact on CEEDRW.
Weighted averages and RII showed that F 09.1, F 02.1b, F 08 and F 01 had the highest significance with a weighted average above four and RII above 0.8, respectively (refer to Table 5). Alternatively, F 03, F 09.2, F 05.1, F 05.3, F 05.2a, F 05.2b, F 02.4a, and F 02.4b had the lowest weighted averages with a weighted average below three, respectively. It also can be seen that F 02.4b (Cost of dispute resolution facilitators’/dispute resolvers’ services) gained the highest standard deviation and the lowest weighted average. However, three of the aforementioned lowest-rated variables, F 03, F 09.2, and F 05.1, had a slight negative skewness and weight average near three.
Table 5.
Significance of the variables affecting CEEDRW according to the weighted average.
3.3. Exploratory Factor Analysis on the 21 Variables
Based on the verification of the KMO test, exploratory factor analysis was conducted to identify similarities between the above variables and simplify them into groups. Principal component analysis (PCA) is one of the most common methods used for exploratory factor analysis [58]. PCA with Varimax rotation was used to analyse the data [61]. In the PCA method, underlying factors that account for most of the variance were identified. These factors can group the variables [60].
Kaiser [62] defined that factors with an Eigenvalue above one are the most impactful variables. Statistical analysis identified six main underlying factors impacting the 21 variables with Eigenvalue above one (Table 6). These six factors accounted for 66.875% of the total variance.
Table 6.
Total variance.
Table 7 summarises the parallel analysis done based on Eigenvalues to identify and remove the insignificant variables. According to Parallel Analysis, three of the six factors were acceptable. Based on the selected factors, a rotation component matrix was developed for the three factors identified. The rotation component matrix expresses the impact of three factors on the variables (refer to Table 8).
Table 7.
Parallel analysis.
Table 8.
Rotated component matrix.
4. Discussion
Current probability-based cost estimation models like PACT, SLAT, HAZUS and, SP3 only consider three of the eleven variables considered in this research. These are damage from aftershocks, floods and fires; restrictions during repair; and initially unforeseen damage [21]. Based on the results from Section 1, almost all of the variables were included in post-earthquake CEEDRW by more than 50% of the participants. In addition, all variables were suggested to include in future usage by more than 60% of the participants.
However, aftershocks (F 05.1), cost of lawyers’/advocates’ legal services (F 02.4a), and cost of dispute resolution facilitators’/dispute resolvers’ services (F 02.4b) had less than 50% approval rating in past usage. The main reason for not including the damage from aftershocks in the CEEDRW could be because of a court ruling. Wellington high court [34] ruled that subsequent natural disaster events like aftershocks should be considered as new events. A separate evaluation should be conducted for each. In additional cost of legal and dispute resolution services would apply in specific situations when legal counsel or dispute services are required. Therefore, the CEEDRW process would only include them when required. However, these costs can have a substantial impact on CEEDRW [21]. Therefore, it can be justified that all variables were considered by a past CEEDRW when required. In addition, all three variables gained an approval rating above 60 percent for future usage.
In addition, three variables had a reduction in future usage. A significant reduction of 16 percent was for pre-earthquake damage (F 10). Most of the pre-earthquake damage is not typically considered by earthquake damage-related repair work, which was funded by insurance claims. This major portion of repair work is related to CEQS, as 52% of total loss can be attributed to insurance claims [3]. Therefore, most CEEDRW processed would exclude pre-earthquake damage.
Furthermore, initially unforeseen damage (F 08) and damage from earthquake-induced floods (F 05.1a) also had a decrease in future usage. These types of damage were considered variations in the New Zealand context, and traditional CEEDRW processes would exclude these costs until identified. Therefore, the reduction in future usage of the three variables mentioned above is logical. However, a tool built for post-earthquake CEEDRW should include the impact of these variables.
The significance of these variables on CEEDRW was identified in Section 2. Variable F 09.1 (Changes required in reconstruction to meet statutory compliance) was the most significant variable with a weighted average of 4.45. All repair work should comply with changes to the building code. After the CEQS, many changes to the building code were introduced, resulting in changes to the scope of repair. Changes in building code resulted in additional work beyond the scope and disagreements with regard to changes. Since these changes are unpredictable and can have an impact on all damaged buildings, results are justifiable.
Additionally, F 03, F 09.2, F 05.1, F 05.3, F 05.2a, F 05.2b, F 02.4a, and F 02.4b gained a weighted average below 3. Reasons for the low significance of these variables can be justified as follows. Most of the cost estimations have a defined scope. Any changes to the scope will update the cost estimate [63]. Therefore, changes required in reconstruction to meet stakeholder requirements (F 09.2) will be considered as variations when it occurs [25]. This is similar to the cost of legal and dispute resolution services. Therefore, the low significance by the respondents for the variable changes required in reconstruction to meet stakeholder requirements (F 09.2) is justifiable.
Damage from aftershocks (F 05.1), flood (F 05.2a), fire (F 05.2b), weather conditions (F 05.3) gained a low importance level. In New Zealand, the court ruling decided that these events were considered separate events caused by the earthquake and were considered variations [34]. Therefore, separate cost estimations were developed once these damages occur and were not included in initial cost estimations.
According to a New Zealand court case in Christchurch, the maximum profit margin (F 03) used in CEEDRW was identified as 10 percent [27]. Open-ended questions revealed that the earthquake commission (EQC) selected the builders using a schedule of rates. This method prevented extreme fluctuation, creating a low overall impact from changes in profit margin. Hence the significance of varying profit margins was low after CEQS. Based on the above justifications, the low importance of the F 03, F 09.2, F 05.1, F 05.3, F 05.2a, F 05.2b, F 02.4a, and F 02.4b is acceptable. However, these justifications were specific to New Zealand and can be different in earthquake events occurring in other regions.
Principal component analysis with Varimax rotation conducted on the variables yielded six underlying factors, which was reduced to three parallel analysis factors. These three underlying factors that impact most of the identified variables impacting CEEDRW can be defined as earthquake damage amplifiers, architectural and engineering service costs, and complexities and indirect earthquake influences.
4.1. Earthquake Damage Amplifiers
Earthquake damage amplifiers achieved 30.1% of the variances and contained four variables (F 05.1, F 05.2a, F 05.2b, and F 05.3). Fire, flood, and aftershocks are earthquake-induced hazards [29]. Earthquake-induced land level changes can cause inundations. Furthermore, sudden damage to building elements can also trigger fires. Weather damage to a building can also occur due to an earthquake’s external building fabric and foundations being compromised.
A high court case in New Zealand noted that these forms of damage could be considered separate earthquake events if they occur after the main earthquake but are caused by the earthquake [34]. Damage for these amplifiers is unique to other variables. However, a standard cost estimation method could be developed to estimate their cost impact.
4.2. Architectural and Engineering Service Costs
Architectural and engineering service costs achieved 10.5% of the variance and contained five variables (F 02.1a, F 02.1b, F 02.1c, F 02.2, F 02.3, F 02.4a, F 02.4b). The structural engineer, geotechnical engineer, architect, quantity surveyor, and land surveyor are all professional service costs categorised into one group based on the architectural and engineering service costs factor. These costs are all typically required for construction projects.
Professional fees for lawyers and dispute resolution facilitators have less significance in CEEDRW. These two professional services are required when a dispute or negotiation situation occurs. Since they are not needed for all projects, their cost was not included in this group.
Since most projects require architectural and engineering service, a standard cost inclusion method could be developed for architectural and engineering service cost calculations.
4.3. Complexities and Indirect Earthquake Influences
Complex and indirect earthquake influences specific to CEEDRW consist of 8.6% of the variance and contain six variables (F 01, F 06, F 08, F 09.1, F 10, and F11).
Consequential damages (F 01) are caused by interconnected elements and are typically identified during repair work. To determine the cost of these damages at an early stage, each repair work process must be simulated. The simulations require extensive details of; interconnected building elements, damage to elements, repair methods, and step-by-step repair processes. Within the limited time frame available for CEEDRW, it is difficult to identify the compounded impact of consequential damages using the aforementioned details.
Initially unforeseen damage (F 08) is also a complex variable to predict as the information required to identify damage is hidden. Therefore, more intrusive damage identification methods or complex damage prediction methods should be used to identify damage at the initial stages.
An imbalance between supply and demand creates price fluctuation induced by an earthquake (F 06). Stephenson [64] states that cost escalation can be attributed to the deviations in demand compared to the labour supply, buyers’ preparedness to pay higher costs and wages to obtain skilled labour from other regions. There is research on estimating price fluctuations caused by disasters [38,39,65]. However, due to its complex nature, there was no evidence of practical applications.
It is also difficult to predict changes required to the final repair state to meet statutory compliances (F 09.1) as there can be building code changes influenced by an earthquake. For example, the 2011 Canterbury earthquake and the 2016 Kaikoura earthquake triggered many building code changes in New Zealand [66].
Pre-earthquake damage (F 10) and substandard initial repair work (F 11) are related to earthquake damage repair work and are difficult to identify. Pre-earthquake damage is especially identified during CEEDRW as they are not considered as part of the earthquake damage repair funded by insurers [49]. Alternatively, substandard repair work was identified after the CEQS [50,51], which made the repair process difficult by covering earthquake damage and led to secondary repair work. These variables can hide earthquake damage, and specific damage identification processes might be required to identify earthquake damage increasing the complexity. Hence, these six variables can be categorised as complexities and indirect earthquake influences. The six variables related to this factor will be most difficult to predict during CEEDRW as they are both complex and specific to earthquake damage repair work.
Since the importance and significance of these eleven variables have been identified, the aforementioned variables can be used to develop an accurate post-earthquake cost estimation model. Alternatively, probability-based tools like HAZUS, PACT, SLAT and SP3 currently do not consider the impact of all aforementioned eleven variables in the cost estimation process. Therefore, further research can be conducted to identify methods that can be used to include the impact of these variables in these probability-based tools.
5. Conclusions
In conclusion, eleven significant variables (which consists of 21 subvariables) that impacted post-earthquake cost estimations for earthquake damage repair work were considered by this research. The research identified that all variables were considered past post-earthquake cost estimations and a higher number of participants are willing to consider these variables in future cost estimations. Based on the significance, the most critical variables are; changes required to the final repair state to meet statutory compliance, initially unforeseen damage and consequential damage repair.
Three main components contributed to the majority of the variances of these variables. These variables have been identified as earthquake damage amplifiers, architectural and engineering services costs, and complexities and indirect earthquake influences. A typical cost impact assessment method could be developed for the variables in each category. However, the practicality of such methods should be further researched. Furthermore, these variables can be used to develop an accurate post-earthquake cost estimation model and improve current probability-based earthquake damage prediction tools.
The findings of this research are subject to some limitations. The participants in this research mainly had experience in New Zealand and specifically in one earthquake. Therefore, the variables discussed in this paper could vary in other parts of the world and different scenarios. Further research is also required to quantify the impact of these variables. Quantified implications of the variables can be used to develop post-earthquake cost estimation tools and improve the forecasting ability of pre-earthquake estimation tools.
Furthermore, there are potential sources of bias impacting this research. Participants of the study were voluntary, specialised and contacted based on their ability to find their contact details. Therefore, the research suffers from voluntary bias, selection bias and convivence bias. Wording bias caused by inaccurate wording or leading questions were reduced through the pilot survey. The research also suffers from response bias because the participants give inaccurate data. The response bias related to this research is acquiescent because participants tend to provide positive feedback and due to participants’ tendency to answer the question.
Author Contributions
Individual contributions of the authors are as follows: Conceptualisation, R.K.A.V.D.K. and N.D.D.; methodology, R.K.A.V.D.K. and N.D.D.; validation, R.K.A.V.D.K. and N.D.D.; formal analysis, R.K.A.V.D.K.; investigation, R.K.A.V.D.K. and N.D.D.; resources, R.K.A.V.D.K., N.D.D., G.C. and S.R.U.; data curation, R.K.A.V.D.K.; writing—original draft preparation, R.K.A.V.D.K.; writing—review and editing, R.K.A.V.D.K., N.D.D., G.C. and S.R.U.; visualisation, R.K.A.V.D.K., N.D.D. and G.C.; supervision, N.D.D., G.C. and S.R.U.; project administration, R.K.A.V.D.K., N.D.D., G.C. and S.R.U. All authors have read and agreed to the published version of the manuscript.
Funding
This research received no external funding.
Institutional Review Board Statement
This research and data collection process was also approved by the Massey University Human Ethics Committee: Northern (Application 4000017232).
Informed Consent Statement
Informed consent was obtained from all subjects involved in the study.
Data Availability Statement
Restrictions apply to the availability of research data as researchers agreed with the study participants not to share their data. However, summarised data presented in this study are available on request from the corresponding author.
Acknowledgments
The authors would like to thank all organisations and expert interviewees who supported and were involved in this research. Special acknowledgments go to James Dawson, Nishadi Sooriyamudalige, Ester Aigwi, Janitha Jayadeva, Chinthaka Atapattu, and Greg Preston for providing comments and helping with data collection.
Conflicts of Interest
The authors declare no conflict of interest.
Appendix A
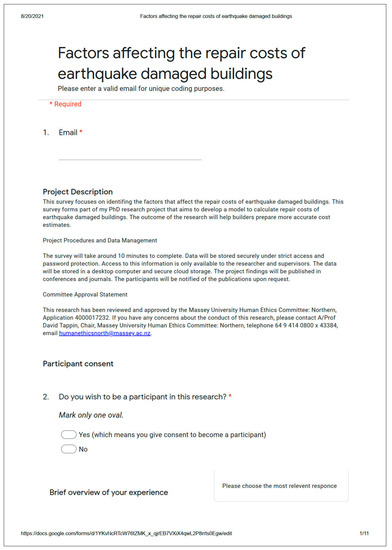
Figure A1.
Questionnaire design (sample 1).
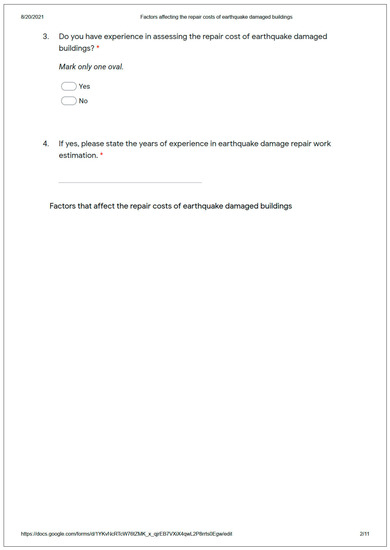
Figure A2.
Questionnaire design (sample 2).
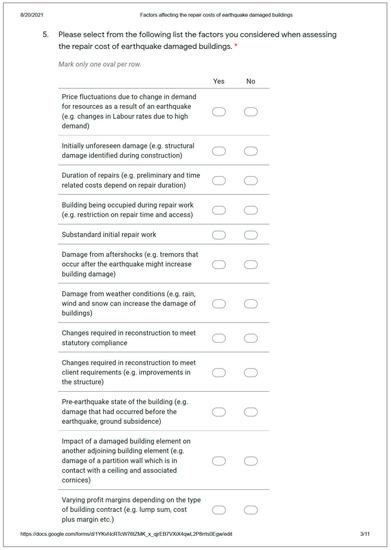
Figure A3.
Questionnaire design (sample 3).
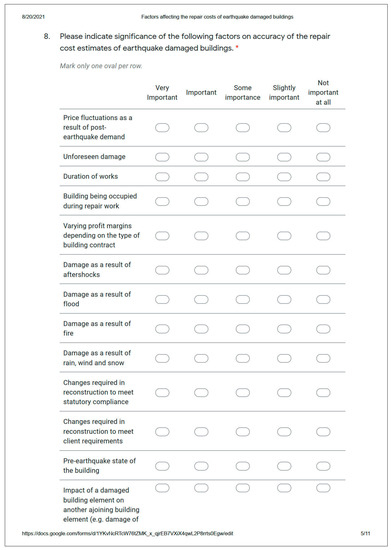
Figure A4.
Questionnaire design (sample 4).
References
- Munich Re Group. Earthquake/Tsunami Events Worldwide 1980–2018; Munich Re Group: München, Germany, 2020. [Google Scholar]
- Horspool, N.A.; King, A.B.; Lin, S.L.; Uma, S.R. Damage and losses to residential buildings during the Canterbury earthquake sequence. Proc. N. Z Soc. Earthq. Eng. 2016. Available online: https://www.nzsee.org.nz/db/2016/Papers/O-04%20Horspool.pdf (accessed on 20 May 2021).
- ICNZ Canterbury Earthquakes. Available online: https://www.icnz.org.nz/natural-disasters/canterbury-earthquakes/ (accessed on 27 October 2019).
- Applied Technology Council. Seismic Performance Assessment of Buildings, Volume 1—Methodology, 2nd ed.; Applied Technology Council: Redwood City, CA, USA, 2018; Volume 1. [Google Scholar]
- FEMA. HAZUS-MH MR4 Technical Manual; FEMA: Washington, DC, USA, 2003. [Google Scholar]
- HaseltonBaker Risk Group. Seismic Risk Assessment Report–Full Detailed Report. 2020. Available online: https://sp3risk.com/sp3-riskmodel/ (accessed on 20 May 2021).
- Molina, S.; Lang, D.H.; Lindholm, C.D. SELENA—An open-source tool for seismic risk and loss assessment using a logic tree computation procedure. Comput. Geosci. 2010, 36, 257–269. [Google Scholar] [CrossRef]
- Applied Technology Council. PACT 3.1.2—Software; Applied Technology Council: Redwood City, CA, USA, 2018. [Google Scholar]
- Applied Technology Council. Seismic Performance Assessment of Buildings, Volume 2—Implementation Guide, 2nd ed.; Applied Technology Council: Redwood City, CA, USA, 2018; Volume 2. [Google Scholar]
- Bradley, B.A. User Manual for SLAT: Seismic Loss Assessment Tool Version 1.14; Department of Civil Engineering, University of Canterbury: Christchurch, New Zealand, 2009. [Google Scholar]
- Charalambos, G.; Dimitrios, V.; Symeon, C. Damage Assessment, Cost Estimating, and Scheduling for Post-Earthquake Building Rehabilitation Using BIM. In Computing in Civil and Building Engineering; American Society of Civil Engineers: Orlando, FL, USA, 2014; pp. 398–405. [Google Scholar]
- Vona, M.; Mastroberti, M.; Mitidieri, L.; Tataranna, S. New resilience model of communities based on numerical evaluation and observed post seismic reconstruction process. Int. J. Disaster Risk Reduct. 2018, 28, 602–609. [Google Scholar] [CrossRef]
- Jiao, Q.; Jiang, H.; Li, Q. Building Earthquake Damage Analysis Using Terrestrial Laser Scanning Data. Adv. Civ. Eng. 2019, 2019, 1–12. [Google Scholar] [CrossRef]
- Kahandawa, R.; Domingo, N.D.; Park, K.S.; Uma, S.R. Earthquake damage estimation systems: Literature review. Procedia Eng. 2018, 212, 622–628. [Google Scholar] [CrossRef]
- Applied Technology Council. Seismic Performance Assessment of Buildings Volume 1—Methodology (FEMA P-58-1); Applied Technology Council: Washington, DC, USA, 2012; Volume FEMA, p. 58. [Google Scholar]
- Memon, A.H.; Rahman, I.A.; Abdullah, M.R.; Azis, A.A.A. Factors affecting construction cost in Mara Large Construction Project: Perspective of project management consultant. Int. J. Sustain. Constr. Eng. Technol. 2010, 1, 41–54. [Google Scholar]
- Olawale, Y.A.; Sun, M. Cost and time control of construction projects: Inhibiting factors and mitigating measures in practice. Constr. Manag. Econ. 2010, 28, 509–526. [Google Scholar] [CrossRef]
- Frimpong, Y.; Oluwoye, J.; Crawford, L. Causes of delay and cost overruns in construction of groundwater projects in a developing countries; Ghana as a case study. Int. J. Proj. Manag. 2003, 21, 321–326. [Google Scholar] [CrossRef]
- Rahman, I.A.; Mem, A.H.; Karim, A.T.A. Significant factors causing cost overruns in large construction projects in Malaysia. J. Appl. Sci. 2013, 13, 286–293. [Google Scholar] [CrossRef] [Green Version]
- Kim, S.Y.; Tuan, K.N.; Do Lee, J.; Pham, H.; Luu, V.T. Cost overrun factor analysis for hospital projects in Vietnam. KSCE J. Civ. Eng. 2018, 22, 1–11. [Google Scholar] [CrossRef]
- Kahandawa, R.; Domingo, N.; Chawynski, G.; Uma, S.R. Factors impacting post-earthquake damage repair cost estimations. Int. J. Disaster Resil. Built Environ. 2020. [Google Scholar] [CrossRef]
- Dhakal, R.P. Damage to non-structural components and contents in 2010 Darfield earthquake. Bull. N. Z. Soc. Earthq. Eng. 2010, 43, 404–411. [Google Scholar] [CrossRef]
- BRANZ. Learnings from the Canterbury Earthquakes; BRANZ: Porirua, New Zealand, 2012. [Google Scholar]
- Di Ludovico, M.; Prota, A.; Moroni, C.; Manfredi, G.; Dolce, M. Reconstruction process of damaged residential buildings outside historical centres after the L’Aquila earthquake: Part II—“heavy damage” reconstruction. Bull. Earthq. Eng. 2017, 15, 693–729. [Google Scholar] [CrossRef]
- Brook, M. Estimating and Tendering for Construction Work. [Electronic Resource], 5th ed.; Routledge, Taylor and Francis Group: Abingdon, UK, 2017; ISBN 9781317561736. [Google Scholar]
- Paul Geoffrey Myall vs Tower Insurance Ltd.; 2017; CIV-2015-409–000230 [2017] NZHC 251. Available online: https://forms.justice.govt.nz/search/Documents/pdf/jdo/51/alfresco/service/api/node/content/workspace/SpacesStore/27f756f8-1c8a-429a-9917-73aa3c6324b6/27f756f8-1c8a-429a-9917-73aa3c6324b6.pdf (accessed on 20 May 2021).
- Duncan Cotterill. Judgment Summary—Paul Geoffrey Myall V Tower Insurance Ltd. [2017] NZHC 251; 2017. Available online: https://duncancotterill.com/publications/judgment-summary-paul-geoffrey-myall-v-tower-insurance-ltd-2017-nzhc-251 (accessed on 20 May 2021).
- Ward, A.E.; Azhar, S.; Khalfan, M. Construction in Occupied Spaces. Slovak J. Civ. Eng. 2017, 25, 15–23. [Google Scholar] [CrossRef] [Green Version]
- Jia, J. Earthquake damages. In Modern Earthquake Engineering; Springer: Berlin/Heidelberg, Germany, 2017; pp. 413–431. ISBN 978-3-642-31853-5. [Google Scholar]
- Inland Marine Underwriters Association. Builders Risk Guide to Loss Prevention Part Two: Water Related Exposures; Inland Marine Underwriters Association: New York, NY, USA, 2001. [Google Scholar]
- Potter, S.H.; Becker, J.S.; Johnston, D.M.; Rossiter, K.P. An overview of the impacts of the 2010–2011 Canterbury earthquakes. Int. J. Disaster Risk Reduct. 2015, 14, 6–14. [Google Scholar] [CrossRef] [Green Version]
- Baker, G.B.; Collier, P.C.R.; Abu, A.K.; Houston, B.J. Post-Earthquake Structural Design for Fire—A New Zealand Perspective. Eng. Conf. Contrib. 2012. [Google Scholar] [CrossRef]
- Davis, C.A.; Giovinazzi, S.; Hart, D.E. Liquefaction Induced Flooding in Christchurch New Zealand. In Proceedings of the 6th International Conference on Earthquake Geotechnical Engineering, Christchurch, New Zealand, 1–4 November 2015. [Google Scholar]
- Tower Insurance Ltd V Earthquake Commission. 2011, p. CIV-2011-485–1116. Available online: https://www.interest.co.nz/sites/default/files/Earthquake%20Commission-1.pdf (accessed on 20 May 2021).
- Döhrmann, D.; Gürtler, M.; Hibbeln, M. Insured loss inflation: How natural catastrophes affect reconstruction costs. J. Risk Insur. 2017, 84, 851–879. [Google Scholar] [CrossRef] [Green Version]
- Statistics New Zealand Labour Cost Index—Median and Mean Increase by Industry & Location. Available online: https://www.stats.govt.nz/ (accessed on 1 January 2021).
- Perdia, S.; McNaughton, A. Post-Earthquake Price Dynamics in Christchurch/Canterbury; Canterbury Development Corporation: Christchurch, New Zealand, 2014. [Google Scholar]
- Khodahemmati, N. Diagnosis and Quantification of Post-Disaster Construction Material Cost Fluctuations. Univ. Tex. Arlington 2018. Available online: https://www.researchgate.net/publication/340805007_Diagnosis_and_Quantification_of_Postdisaster_Construction_Material_Cost_Fluctuations (accessed on 20 May 2021).
- Ahmadi, N.; Shahandashti, S.M. Role of predicate construction market conditions in influencing post disaster demand surge. Nat. Hazards Rev. 2018, 19, 1–13. [Google Scholar] [CrossRef]
- Chang, Y.; Wilkinson, S.; Seville, E.; Potangaroa, R. Changes in resource need for post-disaster reconstruction: A longitudinal study in China. Build. Res. Inf. 2012, 40, 327–336. [Google Scholar] [CrossRef]
- Almufti, I.; Willford, M.; Delucchi, M.; Davis, C.; Hanson, B.; Langdon, D.; Friedman, D.; Johnson, L.; Nielsen, G.; Riordan, N.O.; et al. REDi Rating System. Available online: Publications.arup.com/publications/r/redi_rating_systemtions (accessed on 27 March 2017).
- Khosrowshahi, F.; Kaka, A.P. Estimation of project total cost and duration for housing projects in the U.K. Build. Environ. 1996, 31, 373–383. [Google Scholar] [CrossRef]
- Clifton, C.; Bruneau, M.; MacRae, G.; Leon, R.; Fussell, A. Steel structures damage from the Christchurch earthquake series of 2010 and 2011. Bull. N. Z. Soc. Earthq. Eng. 2011, 44, 297–318. [Google Scholar] [CrossRef] [Green Version]
- Galloway, B.D.; Hare, H.J. A review of post-earthquake building control policies with respect to the recovery of the Christchurch CBD. Bull. N. Z. Soc. Earthq. Eng. 2012, 45, 105–116. [Google Scholar] [CrossRef]
- Robertson, G.; Woods, M. Resolution for Canterbury Owners of On-Sold Homes. Available online: https://www.beehive.govt.nz/release/resolution-canterbury-owners-sold-homes (accessed on 4 November 2019).
- Doloi, H.; Sawhney, A.; Iyer, K.C.; Rentala, S. Analysing factors affecting delays in Indian construction projects. Int. J. Proj. Manag. 2012, 30, 479–489. [Google Scholar] [CrossRef]
- Gebrehiwet, T.; Luo, H. Analysis of delay impact on construction project based on RII and Correlation Coefficient: Empirical study. Procedia Eng. 2017, 196, 366–374. [Google Scholar] [CrossRef]
- Sohu, S.; Abd Halid, A.; Nagapan, S.; Fattah, A.; Latif, I.; Ullah, K. Causative factors of cost overrun in highway projects of Sindh province of Pakistan. IOP Conf. Ser. Mater. Sci. Eng. 2017, 271. [Google Scholar] [CrossRef]
- Chawynski, G. Preparing expert witness documents to support earthquake affected insurance policy holders in Christchurch, New Zealand. J. Build. Surv. Apprais. Valuat. 2019, 5, 362–368. [Google Scholar]
- Cretney, R. “An opportunity to hope and dream”: Disaster politics and the emergence of possibility through community-led recovery. Antipode 2019, 51, 497–516. [Google Scholar] [CrossRef]
- Price, S.; Peters, T. New Zealand: Substandard Repairs to Earthquake-Damaged Homes in Christchurch. Available online: http://www.wsws.org (accessed on 4 November 2019).
- Kahandawa, R.; Domingo, N.; Chawynski, G.; Uma, S.R. Factors Affecting Post-Earthquake Damage Repair Cost Estimations. Available online: https://ir.canterbury.ac.nz/bitstream/handle/10092/17186/POSTER-Kahandawa_Investigation_into_the_Factors_Affecting_Costs_of_Earthquake_Damage_Repair_Work.pdf?sequence=1&isAllowed=y (accessed on 16 October 2019).
- Bryman, A.; Bell, E. Business Research Methods, 3rd ed.; Oxford University Press: Oxford, UK, 2011; ISBN 9788578110796. [Google Scholar]
- Neuman, W.L. Social Research Methods: Qualitative and Quantitative Approaches, 7th ed.; Pearson Education Limited: Essex, UK, 2014; ISBN 9781292020235. [Google Scholar]
- Saunders, M.; Lewis, P.; Thornhill, A. Research Methods for Business Students, 8th ed.; Pearson Education: Harlow, UK, 2019; ISBN 9781292016627. [Google Scholar]
- Iyer, K.C.; Jha, K.N. Factors affecting cost performance: Evidence from Indian construction projects. Int. J. Proj. Manag. 2005, 23, 283–295. [Google Scholar] [CrossRef]
- Kaiser, H.F. An index of factorial simplicity. Psychometrika 1974, 39, 31–36. [Google Scholar] [CrossRef]
- Williams, B.; Onsman, A.; Brown, T. Exploratory factor analysis: A five-step guide for novices. Australas. J. Paramed. 2010, 8, 1–13. [Google Scholar] [CrossRef] [Green Version]
- Hayton, J.C.; Allen, D.G.; Scarpello, V. Factor retention decisions in Exploratory Factor Analysis: A tutorial on Parallel Analysis. ORM Artic. Interest 2004, 7, 191–205. [Google Scholar] [CrossRef]
- Henson, R.K.; Roberts, J.K. Use of Exploratory Factor Analysis in published research. Educ. Psychol. Meas. 2006, 66, 393–416. [Google Scholar] [CrossRef] [Green Version]
- Costello, A.B.; Osborne, J.W. Best practices in exploratory factor analysis: Four recommendations for getting the most from your analysis. Pract. Assess. Res. Eval. 2005, 10. [Google Scholar] [CrossRef]
- Kaiser, H.F. The application of electronic computers to Factor Analysis. Educ. Psychol. Meas. 1960, 20, 141–151. [Google Scholar] [CrossRef]
- Flanagan, R.; Jewell, C. New Code of Estimating Practice; John Wiley & Sons, Ltd.: Chichester, UK, 2018; ISBN 9781119329671. [Google Scholar]
- Stephenson, J. Labour Cost Escalation in Canterbury; New Zealand Institiue of Economic Research: Wellington, New Zealand, 2013. [Google Scholar]
- Olsen, A.H.; Porter, K.A. Storm surge to demand surge: Exploratory study of hurricanes, labor wages, and material prices. Nat. Hazards Rev. 2013, 14, 247–257. [Google Scholar] [CrossRef]
- Nwadike, A.N.; Wilkinson, S. Building Code Amendment Process: A case study of New Zealand. In Proceedings of the 9th International Conference on Building Resilience-ICBR, Bali, Indonesia, 13–15 January 2020. [Google Scholar]
Publisher’s Note: MDPI stays neutral with regard to jurisdictional claims in published maps and institutional affiliations. |
© 2021 by the authors. Licensee MDPI, Basel, Switzerland. This article is an open access article distributed under the terms and conditions of the Creative Commons Attribution (CC BY) license (https://creativecommons.org/licenses/by/4.0/).