Optimizing the Conditions of Metal Solidification with Vibration

 ,
,  ,
,
Abstract
1. Introduction
2. Mathematical Model of Metal Solidification in a Cylindrical Volume with Vibration as a Stefan Problem
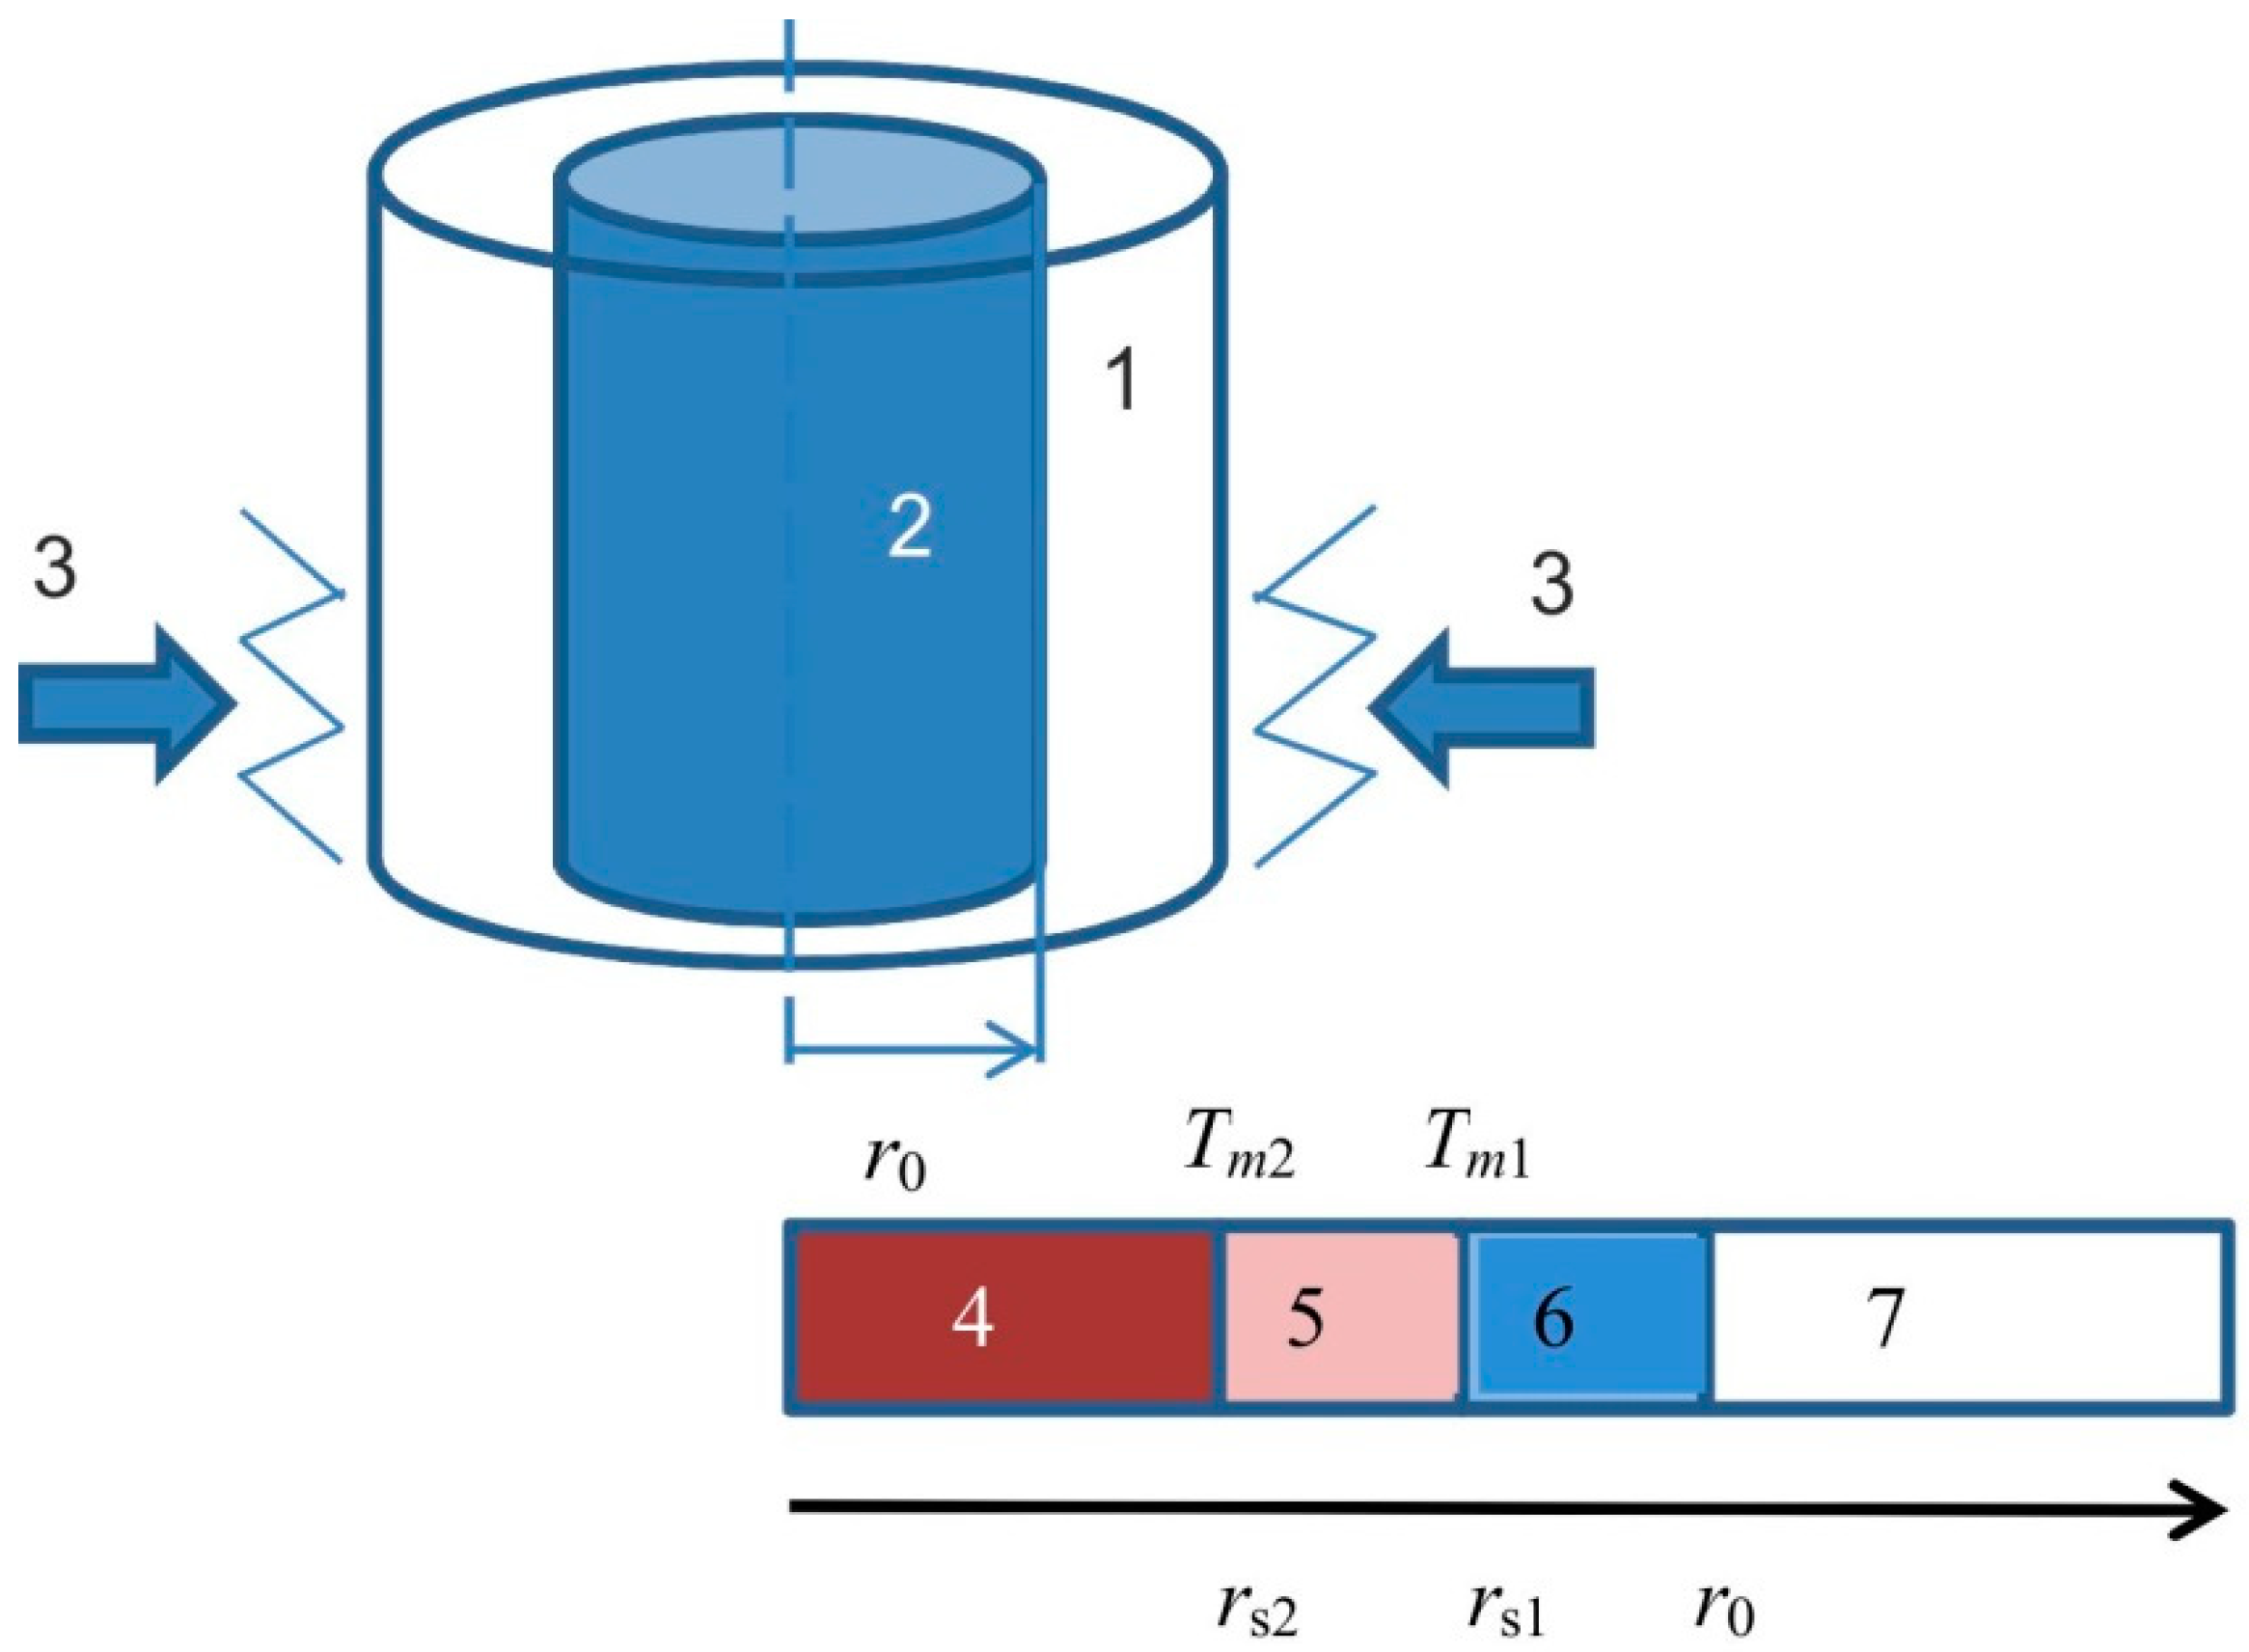
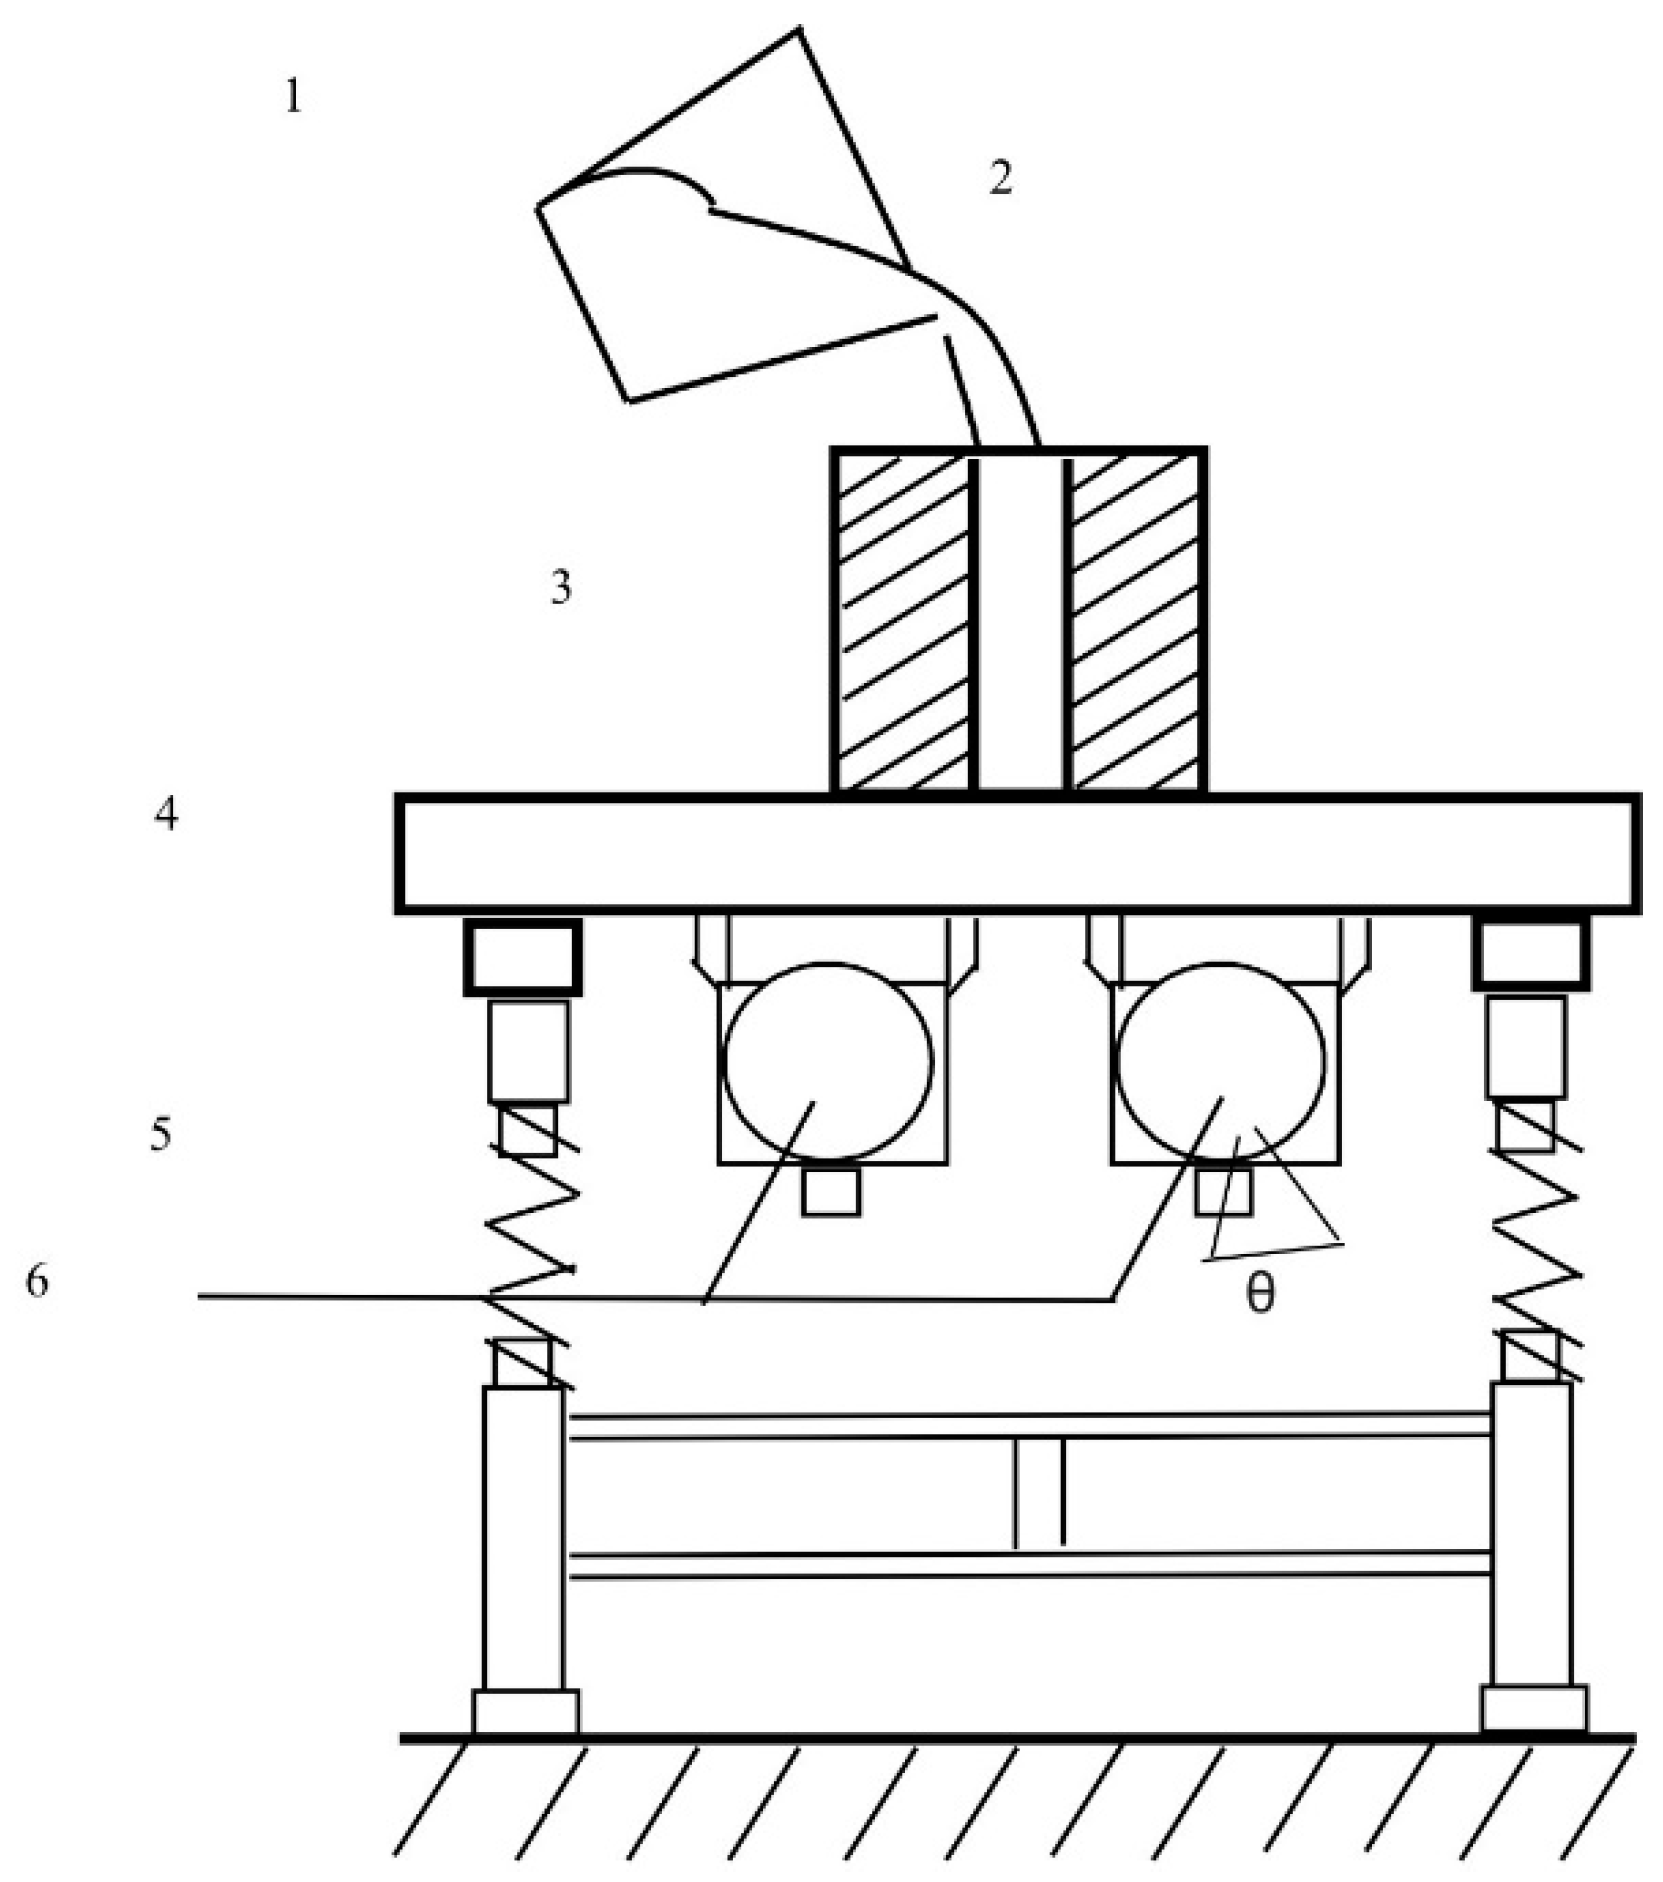
2.1. Model Setup
- The height of the chill mold is much larger than its inner diameter 2r0
- The heat transfer from the melt occurs only through the mold walls; the heat transfer at the top and bottom sides of the chill mold is ignored (an area of mold walls is much larger than the area of the mold bottom and open surface)
- The phase transition occurs within a temperature range from Tm1 (liquidus temperature) to Tm2 (solidus temperature)
- Microscopic volumes of the metal undergo longitudinal harmonic vibrations in an elastic wave with velocity v depending on the vibration frequency and amplitude.
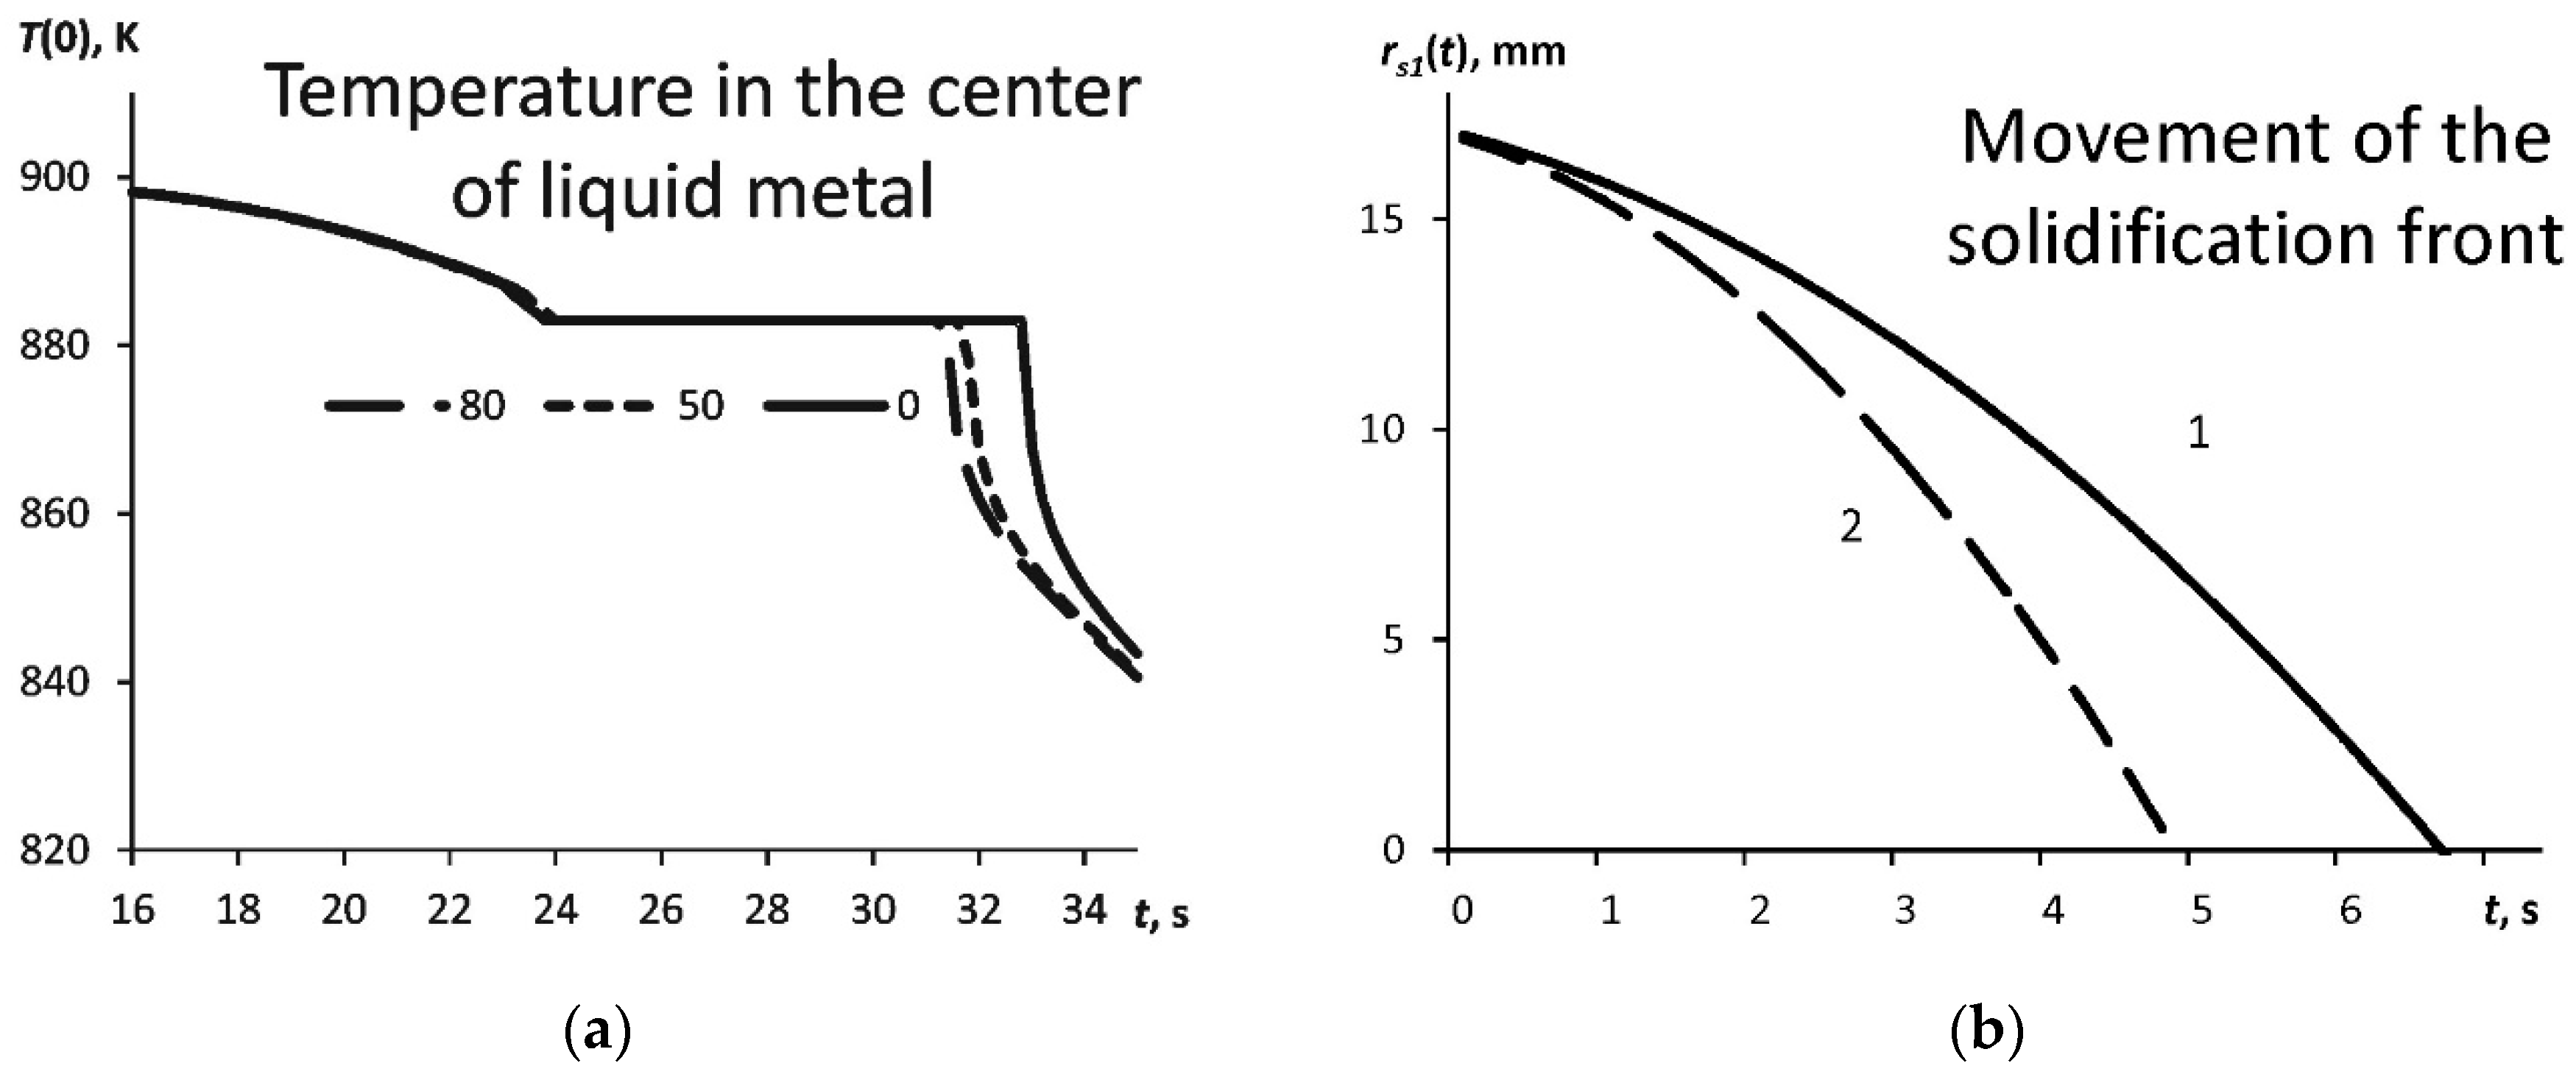
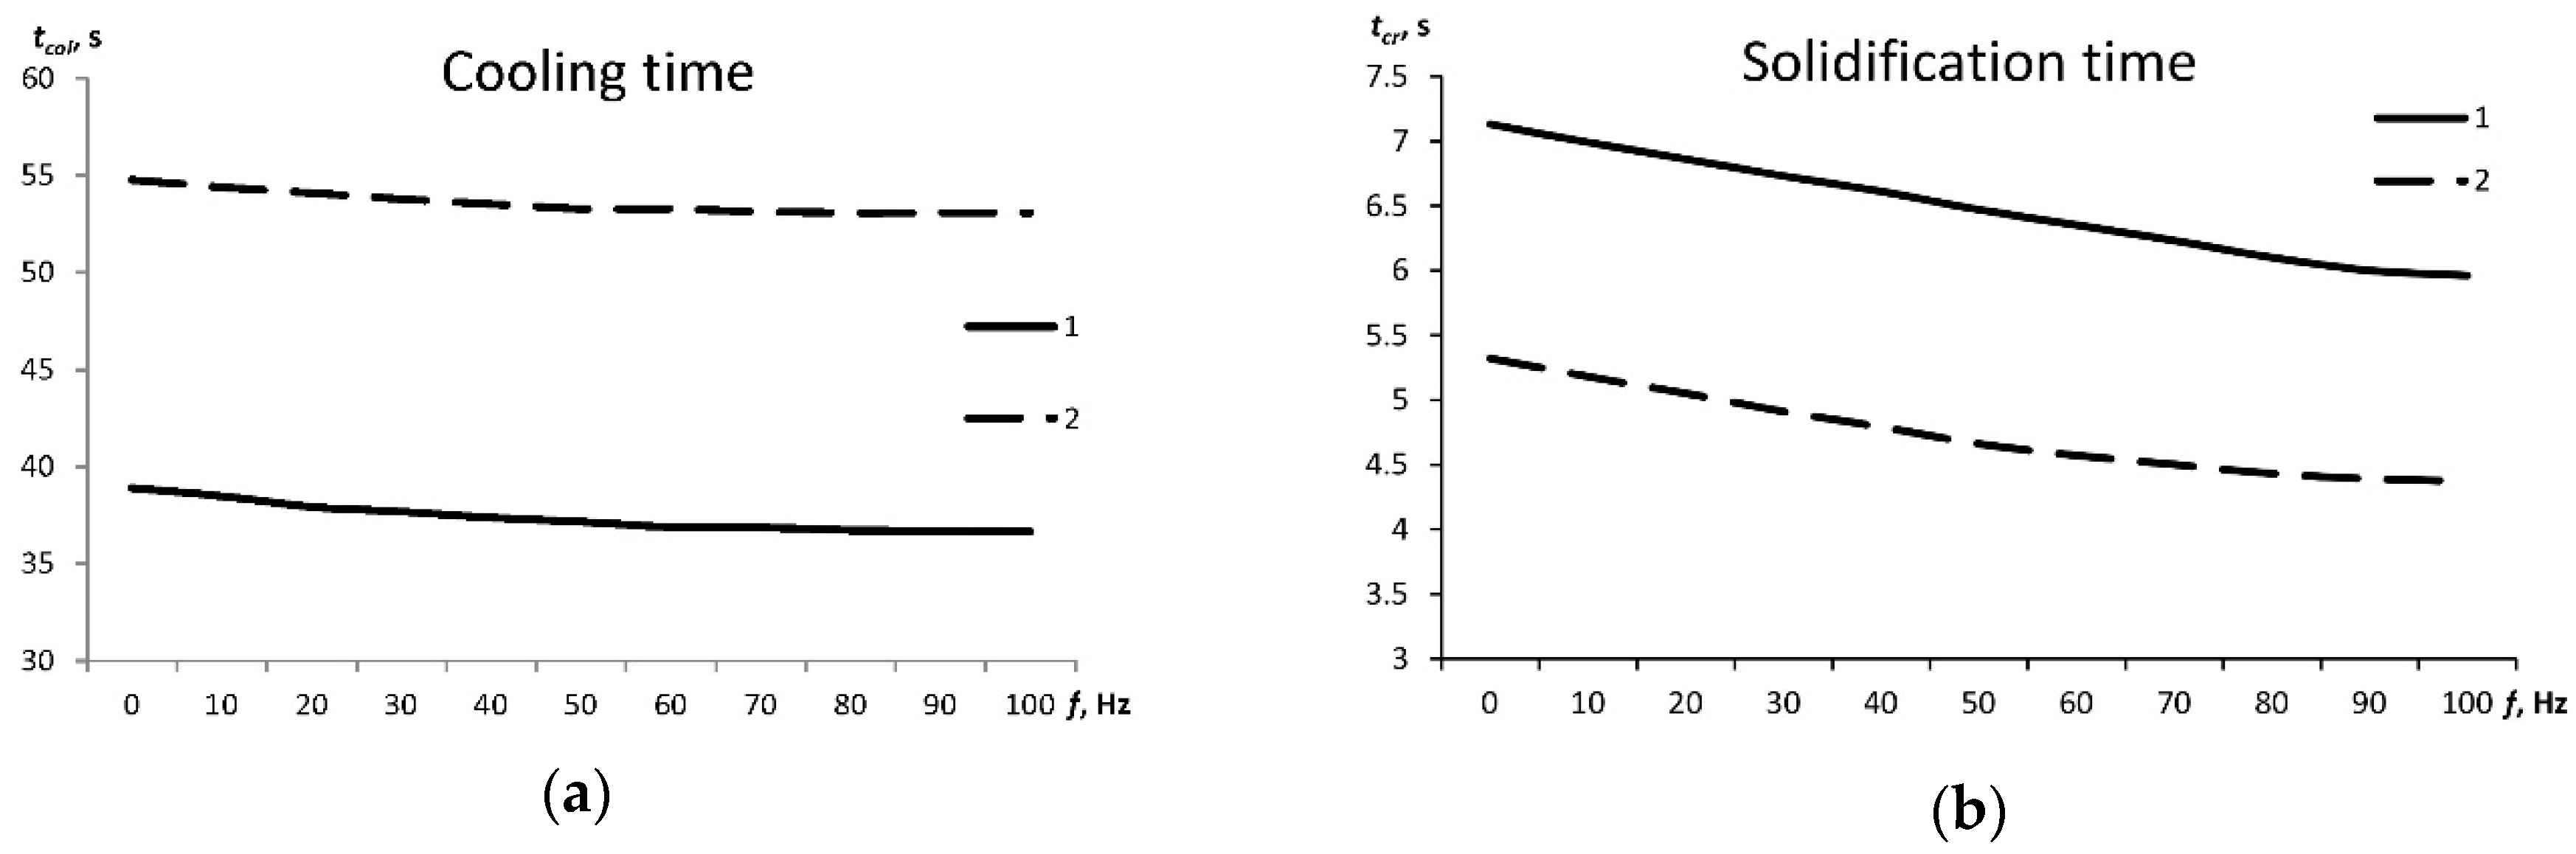
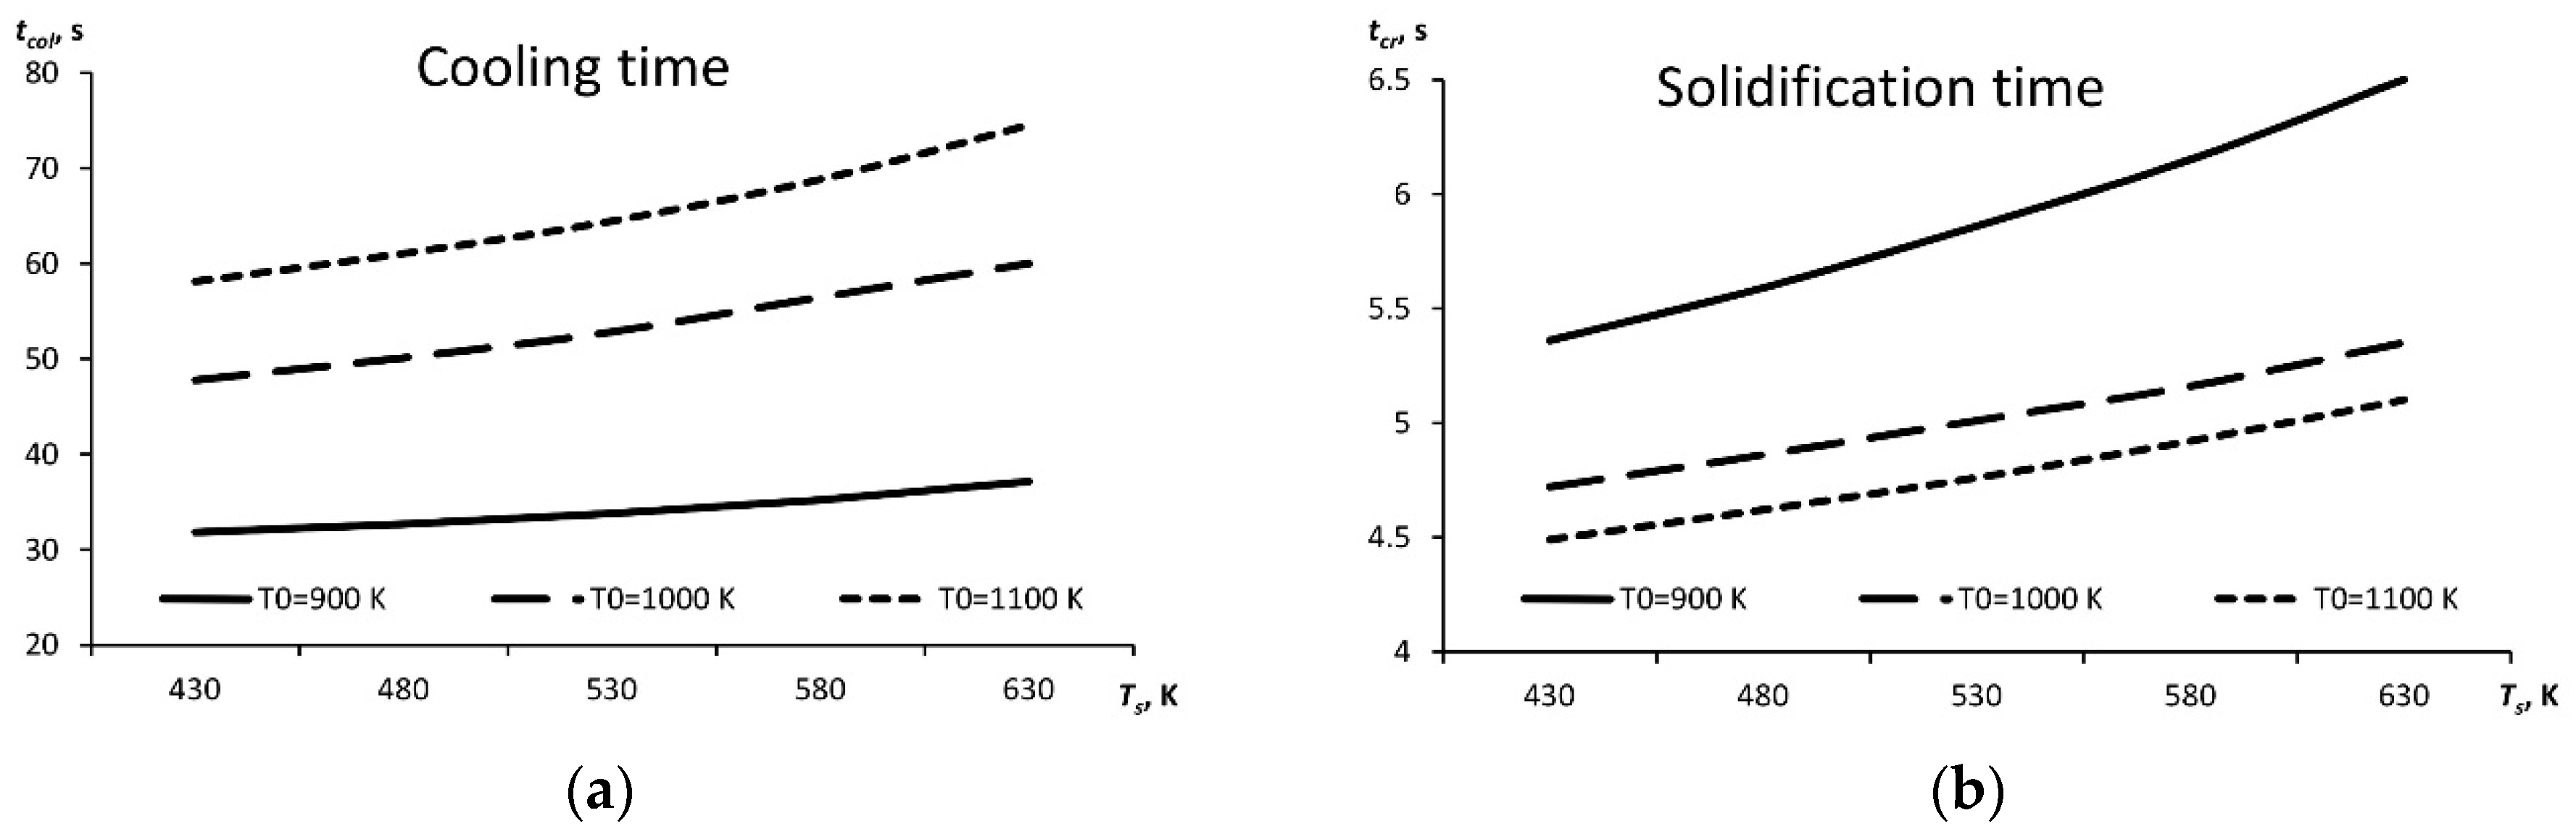
2.2. Modeling Results
- Frequency f = 0–100 Hz
- Amplitude A = 0.1–10 mm
- Initial temperature of the chill mold Ts = 430–630 K
- Initial temperature of the liquid metal T0 = 900–1050 K
- Radius of chill mold was 17.5 mm
- Specific heat of phase transition (latent heat of solidification) was L = 429 kJ/kg [24].
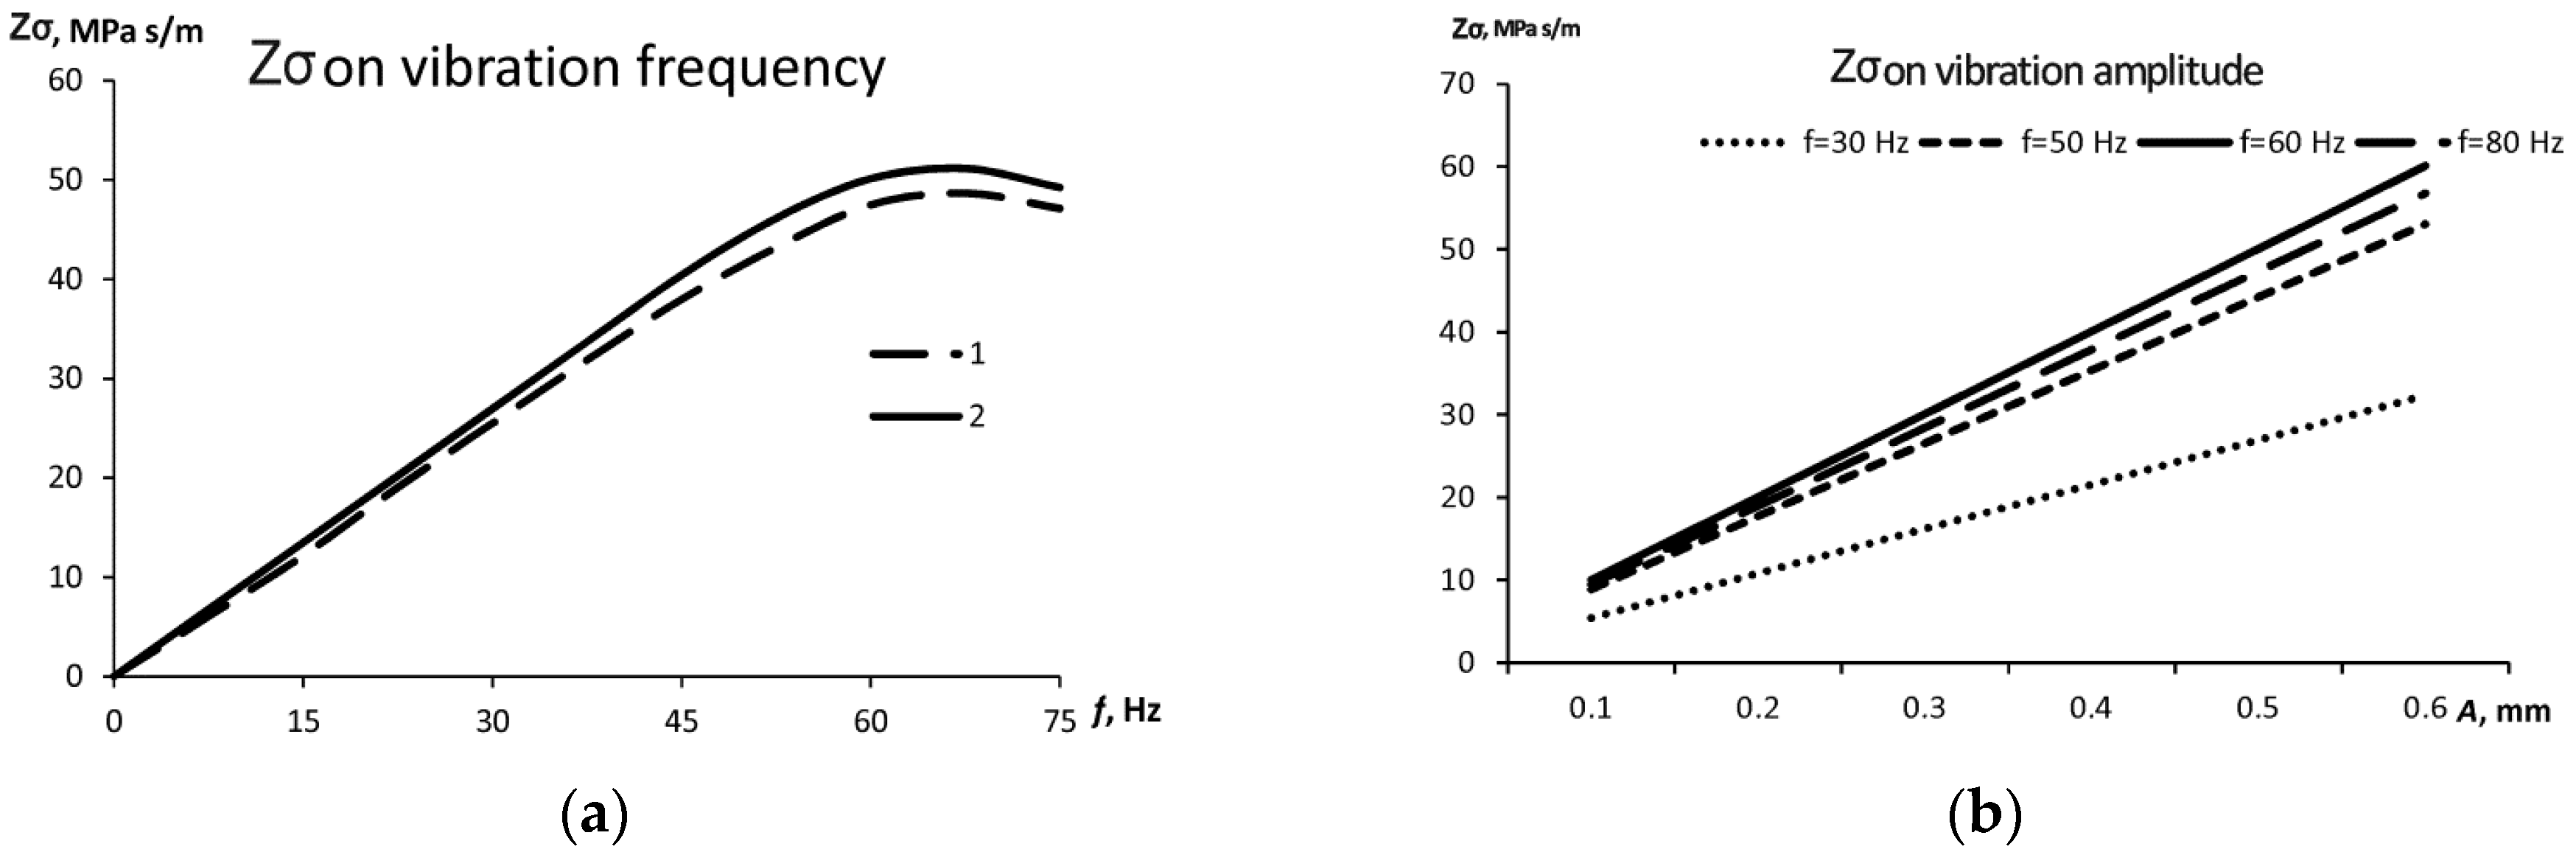
- Acceleration of cooling and solidification as a result of convective heat transfer regardless of little change in the temperature profile.
- The generation of mechanical stresses in the solid–liquid zone that can potentially fracture (fragment) the growing crystals.
- Vibration affects the structure from the beginning of solidification and until its end.
- The higher the vibration amplitude, the higher the vibration effect (it grows linearly).
- There is the optimal vibration frequency at which this effect is the highest. This frequency equals 60 Hz for parameters used in the calculation (Table 1).
3. Experimental Verification of the Mathematical Model by Casting of an Aluminum Alloy with Vibration
3.1. Experimental Procedures
3.2. Analytical Techniques
4. Results and Discussion
5. Conclusions
Author Contributions
Funding
Conflicts of Interest
References
- Eskin, G.I.; Eskin, D.G. Ultrasonic Treatment of Light Alloy Melts, 2nd ed.; CRC Press: London, UK; New York, NY, USA, 2014. [Google Scholar]
- Kim, S.B.; Cho, Y.H.; Jung, J.G.; Yoon, W.H.; Lee, Y.K.; Lee, J.M. Microstructure-Strengthening Interrelationship of an Ultrasonically Treated Hypereutectic Al–Si. Met. Mater. Int. 2018, 24, 1376–1385. [Google Scholar] [CrossRef]
- Balandin, G.F. Formation of the Crystalline Structure of Castings: Pure Metals and Single-Phase Alloys; Mashinostroyeniye: Moscow, Russia, 1973. (In Russian) [Google Scholar]
- Shukla, D.P.; Goel, D.B.; Pandey, P.C. Effect of vibration on the formation of porosity in aluminum alloy ingots. Metall. Trans. B 1980, 11, 166–168. [Google Scholar] [CrossRef]
- Campbell, J. Effects of vibration during solidification. Int. Met. Rev. 1981, 26, 71–108. [Google Scholar] [CrossRef]
- Fisher, T.P. Effects of vibrational energy on the solidification of aluminum alloys. Br. Foundrym. 1973, 66, 71–84. [Google Scholar]
- Burbure, R.R.; Hareesha, I.; Murthy, K.S.S. Influence of Low-Frequency Vibrations on Aluminum Eutectics. Br. Foundrym. 1979, 72, 34–38. [Google Scholar]
- Selivorstov, V.; Dotsenko, Y.; Borodianskiy, K. Influence of low-frequency vibration and modification on solidification and mechanical properties of Al-Si casting alloy. Materials 2017, 10, 560. [Google Scholar] [CrossRef]
- Jiang, W.; Chen, X.; Wang, B.; Fan, Z.; Wu, H. Effects of vibration frequency on microstructure, mechanical properties, and fracture behavior of A356 aluminum alloy obtained by expendable pattern shell casting. Int. J. Adv. Manuf. Technol. 2016, 83, 167–175. [Google Scholar] [CrossRef]
- Taghavi, F.; Saghafian, H.; Kharrazi, Y.H.K. Study on the effect of prolonged mechanical vibration on the grain refinement and density of A356 aluminum alloy. Mater. Des. 2009, 30, 1604–1611. [Google Scholar] [CrossRef]
- Chirita, G.; Stefanescu, I.; Soares, D.; Silva, F.S. Influence of vibration on the solidification behavior and tensile properties of an Al–18 wt% Si alloy. Mater. Des. 2009, 30, 1575–1580. [Google Scholar] [CrossRef]
- Zheng, Z.; Ji, Y.J.; Mao, W.M.; Rui, Y.U.E.; Liu, Z.Y. Influence of rheo-diecasting processing parameters on microstructure and mechanical properties of hypereutectic Al–30% Si alloy. Trans. Nonferrous Met. Soc. China 2017, 27, 1264–1272. [Google Scholar] [CrossRef]
- Olufemo, A.F.; Asemola, I.S. Effects of melt vibration during solidification on the mechanical property of Mg-Al-Zn alloy. Int. J. Metall. Eng. 2012, 1, 40–43. [Google Scholar]
- Wang, W.L.; Wang, K.S.; Lin, X. Real time observation of nucleation and detachment of crystal from chilling surface Part I–effects of vibration. Int. J. Cast Met. Res. 2010, 23, 344–348. [Google Scholar] [CrossRef]
- Vorozhtsov, S.; Kudryashova, O.; Promakhov, V.; Dammer, V.; Vorozhtsov, A. Theoretical and experimental investigations of the process of vibration treatment of liquid metals containing nanoparticles. JOM 2016, 68, 3094–3100. [Google Scholar] [CrossRef]
- Murakami, Y.; Miwa, K.; Kito, M.; Honda, T.; Kanetake, N.; Tada, S. Effects of Mechanical Vibration Factors on Size and Shape of Solid Particles in JIS AC4CH Aluminum Alloy Semi-Solid Slurry. Mater. Trans. 2016, 57, 163–167. [Google Scholar] [CrossRef]
- Ruvalcada, D.; Mathiensen, R.H.; Eskin, D.G.; Arnberg, L.; Katgerman, L. In situ observations of dendritic fragmentation due to local solute-enrichment during directional solidification of an aluminum alloy. Acta Mater. 2007, 55, 4287–4292. [Google Scholar] [CrossRef]
- Zhang, Y.; Meng, W.A.N.G.; Du, L.C.; Xin, L.I.N.; Huang, W.D. In-situ observation of crystal detachment behavior in NH4Cl-H2O system from chilling metal surface with vibration. Trans. Nonferrous Met. Soc. China 2010, 20, s821–s825. [Google Scholar] [CrossRef]
- Meirmanov, A.M. The Stefan Problem; Walter de Gruyter: Berlin, Germany, 1992; Volume 3. [Google Scholar]
- Kamenomostskaya, S.L. On Stefan’s problem. Mat. Sb. 1961, 53, 489–514. (In Russian) [Google Scholar]
- Alexiades, V.; Cannon, J.R. Free boundary problems in solidification of alloys. SIAM J. Math. Anal. 1980, 11, 254–264. [Google Scholar] [CrossRef]
- Hu, H.; Argyropoulos, S.A. Mathematical modelling of solidification and melting: A review. Model. Simul. Mater. Sci. Eng. 1996, 4, 371. [Google Scholar] [CrossRef]
- Zinoviev, V.E. Thermophysical Properties of Metals at High Temperatures. Reference Book; Metallurgiya: Moscow, Russia, 1989. (In Russian) [Google Scholar]
- Novikov, I.I. Hot Shortness of Non-Ferrous Metals and Alloys; Nauka: Moscow, Russia, 1966. (In Russian) [Google Scholar]
- Bakhtiyarov, S.I.; Overfelt, R.A.; Teodorescu, S.G. Electrical and thermal conductivity of A319 and A356 aluminum alloys. J. Mater. Sci. 2001, 36, 4643–4648. [Google Scholar] [CrossRef]
- Babichev, A.P.; Babushkina, N.A.; Bratkovskiy, A.M. Physical Quantities: Reference Book; Energoatomizdat: Moscow, Russia, 1991. (In Russian) [Google Scholar]
- Arnberg, L.; Backerud, L.; Chai, G. Solidification Characteristics of Aluminum Alloys: Dendrite Coherency; American Foundrymen’s Society: Des Plaines, IL, USA, 1996; Volume 3. [Google Scholar]
- Kocatepe, K. Effect of low frequency vibration on porosity of LM25 and LM6 alloys. Mater. Des. 2007, 28, 1767–1775. [Google Scholar] [CrossRef]


| Properties | Density ρ, kg/m3 [23,24] | Specific Heat c, J/(kg·°C) [24,25] | Thermal Conductivity λ, W/(m·°C) [24,25] | Elastic Modulus E 10−5, MPa [23] | Sound Speed cs, m/s [23] | Liquidus Temperature Tm1, K [26] | Solidus Temperature Tm2, K [26] |
|---|---|---|---|---|---|---|---|
| Melt (1) | 2362 | 1177 | 98.1 | 0.52 | 4700 | 883 | 841 |
| Solid metal (2) | 2660 | 880 | 155.0 | 0.70 | 6260 | - | - |
| Steel (3) | 7800 | 462 | 50.2 | - | - | - | - |
| No. of Sample | Frequency, Hz | Amplitude, mm (θ, °) | Density, g/cm3 |
|---|---|---|---|
| 1 | 50 Hz | 0.53 mm (20 °) | 2.70 ± 0.02 |
| 2 | |||
| 3 | |||
| 4 | |||
| 1 | 60 Hz | 2.72 ± 0.03 | |
| 2 | |||
| 3 | |||
| 4 | |||
| 1 | 80 Hz | 2.69 ± 0.03 | |
| 2 | |||
| 3 | |||
| 4 | |||
| 1 | 50 Hz | 0.38 mm (10 °) | 2.69 ± 0.04 |
| 2 | |||
| 3 | |||
| 4 | |||
| 1 | 60 Hz | 2.70 ± 0.02 | |
| 2 | |||
| 3 | |||
| 4 | |||
| 1 | 80 Hz | 2.69 ± 0.02 | |
| 2 | |||
| 3 | |||
| 4 |
| Frequency, Hz | σB, MPa | δ, % |
|---|---|---|
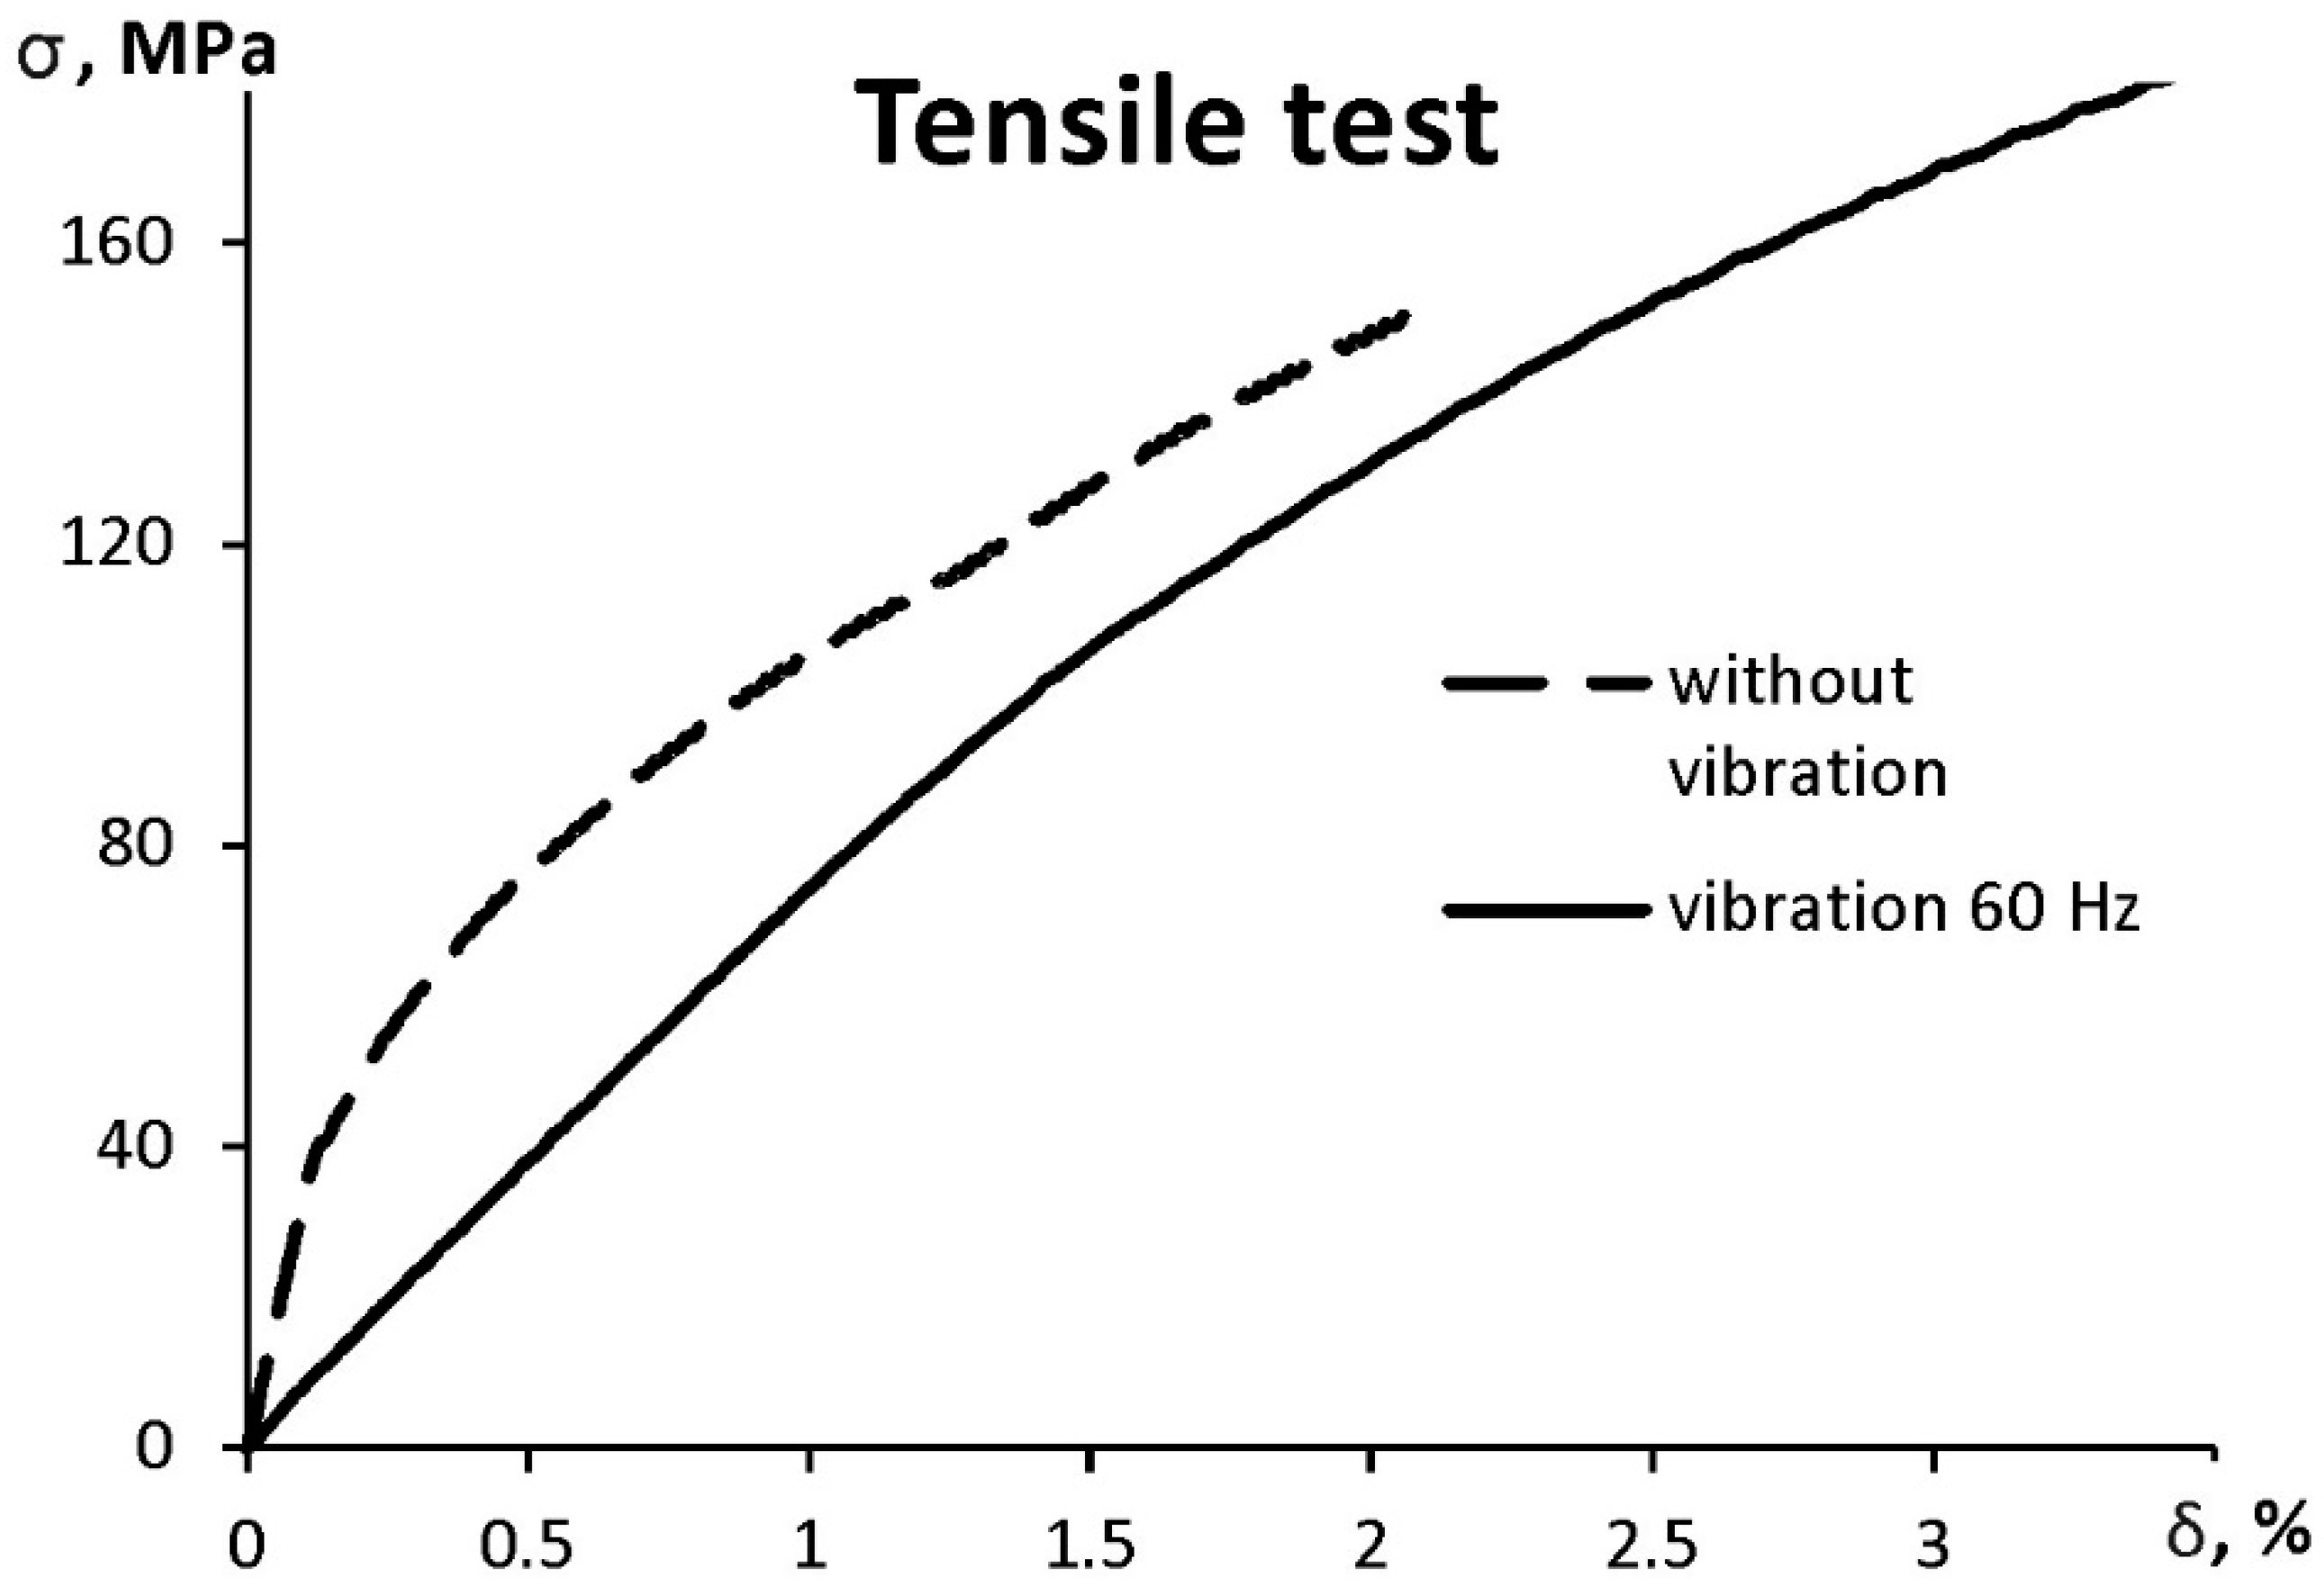
| Without vibration | 150 ± 7 | 2.1 ± 0.1 |
| 50 | 160 ± 6 | 2.3 ± 0.1 |
| 60 | 182 ± 7 | 3.4 ± 0.2 |
| 80 | 149 ± 6 | 2.1 ± 0.1 |
© 2019 by the authors. Licensee MDPI, Basel, Switzerland. This article is an open access article distributed under the terms and conditions of the Creative Commons Attribution (CC BY) license (http://creativecommons.org/licenses/by/4.0/).
Share and Cite
Kudryashova, O.; Khmeleva, M.; Danilov, P.; Dammer, V.; Vorozhtsov, A.; Eskin, D. Optimizing the Conditions of Metal Solidification with Vibration. Metals 2019, 9, 366. https://doi.org/10.3390/met9030366
Kudryashova O, Khmeleva M, Danilov P, Dammer V, Vorozhtsov A, Eskin D. Optimizing the Conditions of Metal Solidification with Vibration. Metals. 2019; 9(3):366. https://doi.org/10.3390/met9030366
Chicago/Turabian StyleKudryashova, Olga, Marina Khmeleva, Pavel Danilov, Vladislav Dammer, Alexander Vorozhtsov, and Dmitry Eskin. 2019. "Optimizing the Conditions of Metal Solidification with Vibration" Metals 9, no. 3: 366. https://doi.org/10.3390/met9030366
APA StyleKudryashova, O., Khmeleva, M., Danilov, P., Dammer, V., Vorozhtsov, A., & Eskin, D. (2019). Optimizing the Conditions of Metal Solidification with Vibration. Metals, 9(3), 366. https://doi.org/10.3390/met9030366