Article

Investigation of the Effect of Short Exposure in the Temperature Range of 750–950 °C on the Ductility of Haynes® 282® by Advanced Microstructural Characterization

by
Fabian Hanning
1,*,
Abdul Khaliq Khan
2,3,
Joachim Steffenburg-Nordenström
4,
Olanrewaju Ojo
3 and
Joel Andersson
5
1
Department of Industrial and Materials Science, Chalmers University of Technology, 412 96 Gothenburg, Sweden
2
Manitoba Institute for Materials, University of Manitoba, Winnipeg, MB R3T 5V6, Canada
3
Department of Mechanical Engineering, University of Manitoba, Winnipeg, MB R3T 5V6, Canada
4
GKN Aerospace Sweden AB, 461 38 Trollhättan, Sweden
5
Department of Engineering Science, University West, 461 32 Trollhättan, Sweden
*
Author to whom correspondence should be addressed.
Metals 2019, 9(12), 1357; https://doi.org/10.3390/met9121357
Submission received: 13 November 2019 / Revised: 11 December 2019 / Accepted: 13 December 2019 / Published: 17 December 2019
(This article belongs to the Special Issue Welding Metallurgy and Weldability of Superalloys)

Abstract

:
A Gleeble-based test method has been developed to study the change in the ductility signature of Haynes® 282® during isothermal exposure from 5 s to 1800 s. A temperature range of 750 to 950 °C has been used to investigate the effect of age-hardening reactions. Microstructural constituents have been analyzed and quantified using scanning and transmission electron microscopy. Carbides present in the material are identified as primary MC-type TiC carbides, Mo-rich M6C secondary carbides, and Cr-rich M23C6 secondary carbides. Gamma prime (γ′) precipitates are present in all the material conditions with particle sizes ranging from 2.5 nm to 58 nm. Isothermal exposure causes the growth of γ′ and development of a grain boundary carbide network. A ductility minimum is observed at 800–850 °C. The fracture mode is found to be dependent on the stroke rate, where a transition toward intergranular fracture is observed for stroke rates below 0.055 mm/s. Intergranular fracture is characterized by microvoids present on grain facets, while ductility did not change during ongoing age-hardening reactions for intergranularly fractured Haynes® 282®.

1. Introduction

Precipitation hardening nickel-based superalloys are commonly used for structural components in aircraft engines, where Alloy 718 has been a standard aeroengine material for several decades due to its combination of high-temperature strength and fabricability [1]. Alloy 718 achieves its strength from the gamma double prime phase (γ″), which enables a maximum service temperature of ~650 °C. The newly developed alloy Haynes® 282® allows for a maximum service temperature of ~800 °C [2]. This 150 °C increase makes Haynes® 282® an attractive complement material to Alloy 718.
Large structural components are typically produced via the assembly approach, where smaller parts are welded together [3]. This requires a good welding performance of the used material.
Precipitation-hardened superalloys can be susceptible to strain-age cracking (SAC), which occurs during the postweld heat treatment (PWHT) that has to be carried out to achieve uniform material properties and appropriate strength after welding. The phenomenon is characterized by low ductility intergranular fracture in the heat-affected zone [4]. Hardening reactions in the grain interior cause the localization of weld residual stresses on grain boundaries. If the local ductility is exhausted, the material fails by intergranular crack formation. Higher temperature resistance can be achieved by stabilizing the γ′ phase in the material, which is typically realized by increasing the Al + Ti alloying content. However, the γ′ phase has more rapid precipitation kinetics than the γ″ phase present in Alloy 718, potentially increasing SAC susceptibility. Hence, it is necessary to study the mechanism in recently developed alloys such as Haynes® 282®. Different testing approaches have been used to investigate the mechanism, with the constant heating rate test (CHRT) being one of the few methods that have been applied by several studies [2,5,6,7]. The CHRT simulates slow furnace heating to PWHT, with test samples being pulled to fracture in the temperature range of 700 to 1000 °C. A drop in ductility is usually expected in this temperature range, and the severity of the drop can be used to qualitatively rank materials with regard to their susceptibility toward SAC. However, the test lacks the ability to investigate the underlying mechanism for strain-age cracking. As the isothermal component of the constant heating rate test is dependent on the ductility of the material at the respective temperature, it can vary greatly for different test temperatures. However, typical exposure times in the precipitation temperature range of gamma prime (γ′)-hardening superalloys are in the range of 1200–1800 s. Previous studies found that age-hardened material shows higher susceptibility toward SAC than specimens welded in solution-annealed condition [8,9,10]. While this indicates the general influence of γ′, it is important to understand how a difference in γ′ precipitation can affect the susceptibility toward SAC. Hence, the aim of this study is to investigate the effect of microstructural evolution during short-term high-temperature exposure on strain-age cracking. This is achieved by controlling the exposure time in the temperature range of the CHRT ductility minimum and by correlating the ductility response of Haynes® 282® to changes in the microstructure.

2. Materials and Methods

2.1. Material and Heat Treatments

Wrought Haynes® 282® in the form of a 3.175 mm (1/8″) rolled sheet is investigated with the chemical composition as certified from the supplier given in Table 1. The material was used in the as-received condition, having a hardness of 265 ± 3 HV. The microstructure with an average grain size of 55 ± 5 µm is shown in Figure 1a. No continuous grain boundary carbide network is present, albeit carbides are found on some grain boundary segments under high magnification. Large primary MC-type carbides are visible in the microstructure.
Some samples were subjected to a full age-hardening heat treatment, which is further referred to as “age hardened”. The recommended heat treatment includes two aging steps, with carbide stabilization at 1010 °C for 2 h and γ′ precipitation at 788 °C for 8 h, both followed by air cooling [11]. The heat treatment was carried out on tensile test samples in a tube furnace under argon gas with 100 L/h flow rate. The obtained microstructure is shown in Figure 1b, where a distinct grain boundary carbide network is visible. Grain size was not affected by the heat treatment (52 ± 5 µm), while the hardness increased to 380 ± 5 HV0.5.

2.2. Gleeble Thermomechanical Simulation

A Gleeble 3800D (Dynamic Systems Inc, Poestenkill, NY, USA) system is used for high-temperature testing on test specimens with the geometry shown in Figure 2. The Gleeble system uses resistance heating to achieve heating rates up to 10,000 °C/s, which can be superimposed with tensile or compressive deformation. Sample cooling is achieved via heat conduction into the water-cooled jaws and can be increased by blowing quenching mediums such as Ar gas (used in this study) onto the sample surface. The geometry was selected after carrying out finite element (FE) simulations using MSC Marc 2013 (MSC Software Corporation, Newport Beach, CA, USA). Test specimens have been machined using abrasive waterjet cutting. Available data on Haynes® 282® shows that the ductility minimum lies close to 850 °C [2,7]; hence, the test temperatures selected are ±100 °C around 850 °C with a 50 °C spacing. Fast heating with 1000 °C/s is used to reduce the effect of heating on the test results. The effect of strain rate on ductility is investigated by varying the stroke rate from 55 mm/s to 0.011 mm/s. Note that a reduction in the stroke rate also affects the isothermal exposure time. The exposure times presented in the result section are adjusted for the increased time spent at elevated temperatures. All test parameters are summarized in Table 2.
Three replicates are tested for each point and the reduction in area (RA) is measured using an Olympus SZX9 stereo optical microscope (Olympus Corporation, Tokyo, Japan). The test order was randomized within repeats, and specimens could only be identified via their run number to reduce the possible impact of boundary conditions and operational bias on the test results. For the microstructural characterization of undeformed material, the test matrix was repeated without pulling the samples to fracture. These tests have been carried out using a reduced specimen size with the dimensions of 7.5 × 50 × 3.175 mm3 (1/8″). While requiring significantly less material, the free span in the Gleeble jaws was kept constant to retain comparable heating and cooling conditions.

2.3. Microstructural Characterization

Microstructural characterization is carried out on fractured samples and on cross-sections cut out at the thermocouple location on the reduced-size specimens. For general investigation, the samples were mounted in hot mounting resin followed by automated grinding and polishing. Samples were etched using 10 wt.% oxalic acid at 3 V DC for 2–3 s. For particle size measurements, samples have been immersion etched in 2 g of CuCl2 + 50 mL HCl + 25 mL HNO3 + 200 mL H2O for 40 s to remove γ′ particles from the matrix [12]. A Zeiss Evo 50 Scanning electron microscope (SEM) (Carl Zeiss AG, Oberkochen, Germany) and a Leo 1550 FEG SEM (Carl Zeiss AG, Oberkochen, Germany) have been used for fracture and microstructure analysis.
Selected samples are further investigated by transmission electron microscopy (TEM). Cut out cross-sections were thinned to 100 µm thickness, followed by dimple grinding and electropolishing in a 10:90 methanol:perchloric acid solution at −40 °C using a Struers Tenupol-3 twinjet polishing machine. A Jeol JEM-2100 Field emission TEM (JEOL Ltd., Akishima, Japan) with 200 kV acceleration voltage was used for image acquisition and phase identification via selected area (SA) diffraction and TEM energy-dispersive X-ray spectroscopy (EDS) analysis. Microhardness is measured using a Struers DuraScan-70 G5 (Struers, Ballerup, Denmark) with a force of 0.5 kgf (HV0.5), averaging five randomly located indents per sample. JmatPro (version. 11.2, Sente Software, Guildford, UK) is used to perform thermodynamic calculations.

3. Results and Discussion

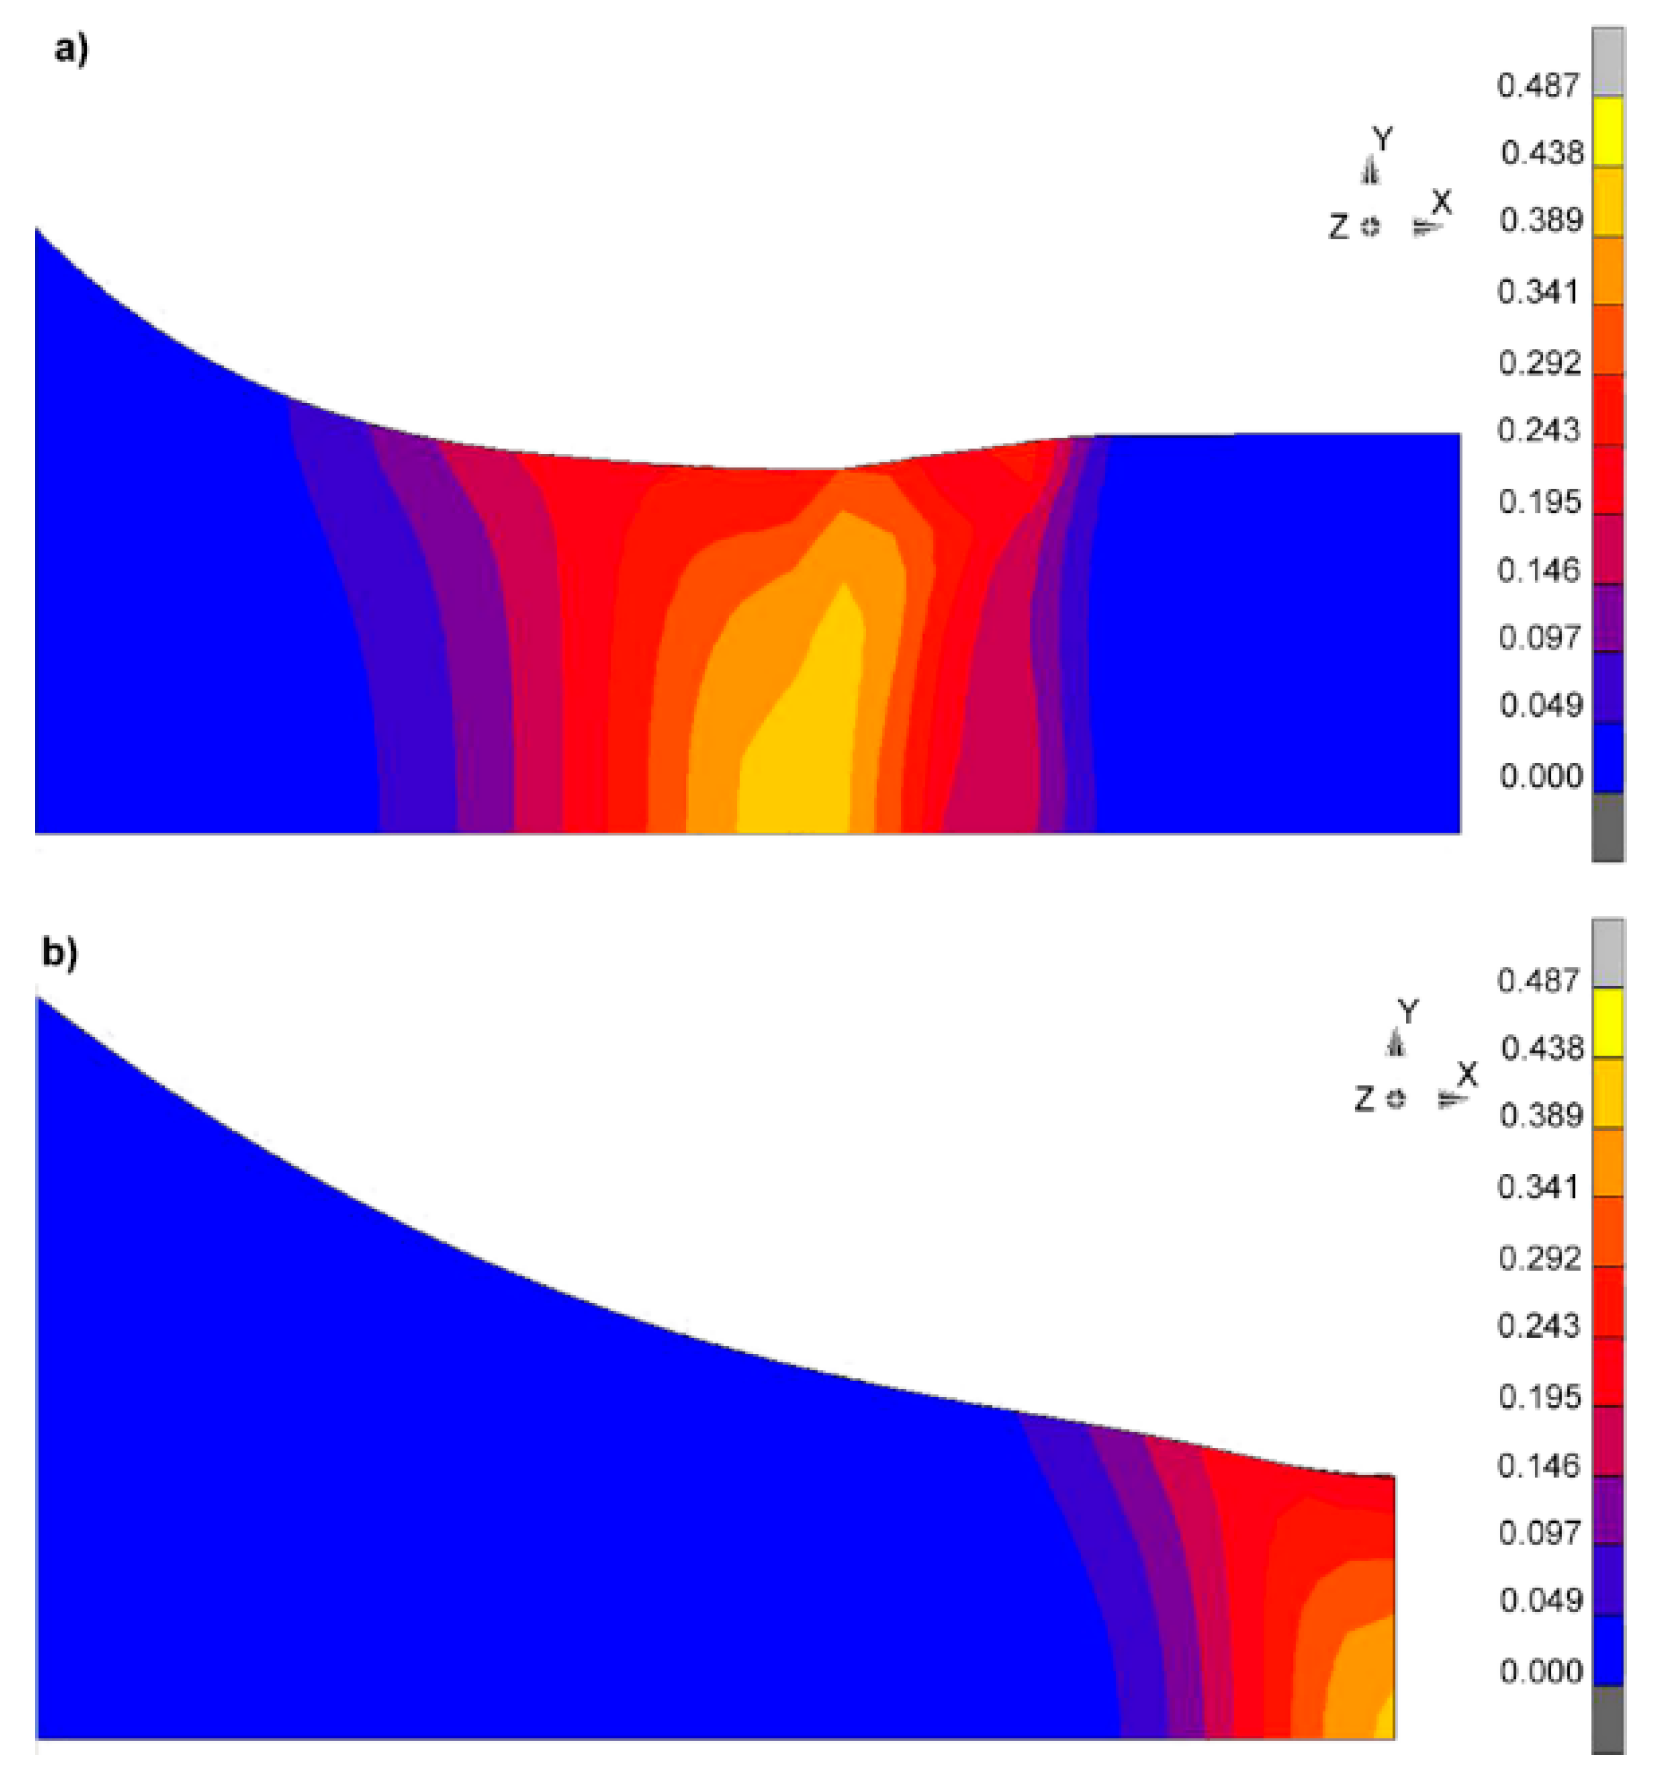
3.1. Sample Geometry

The resistance heating combined with water-cooled copper jaws used in this system causes a steep temperature gradient. This can lead to off-center fracture when using test specimens with constant gauge width, since hardening reactions occurring in the center may shift the fracture location to an area where less hardening reactions take place. This problem has previously been recognized, and two approaches are used to solve the problem. While Norton and Lippold used steel jaws with lower heat conduction than the standard copper ones [13], Metzler used modified specimen geometry with a constant radius to compensate for the lower material strength away from the specimen center [7]. This investigation follows the latter approach with the general concept of using a radius rather than a constant-width gauge section, since a narrower high-temperature zone in the specimen enables faster temperature control. As the desired specimen geometry differed from Metzlers in size and radius, additional finite element (FE) simulations were carried out using MSC Marc 2013. Plastic deformation is modeled with the specimen area 4 mm around the center being heated to a temperature of 850 °C while allowing free heat flow to the outer specimen side. Outside the heated section, material parameters corresponding to a solution heat-treated condition are used, while in the center section, values for fully age-hardened material are applied. This is assumed to represent the most severe conditions as being present after prolonged exposure time. Using different material parameters is necessary, since fracture otherwise would always occur in the area with the highest temperature applied. Mechanical deformation was induced, and the location of necking was evaluated, which is shown in Figure 3a for a specimen with constant gauge section and in Figure 3b for a geometry with 26 mm radius, which was selected for further testing.

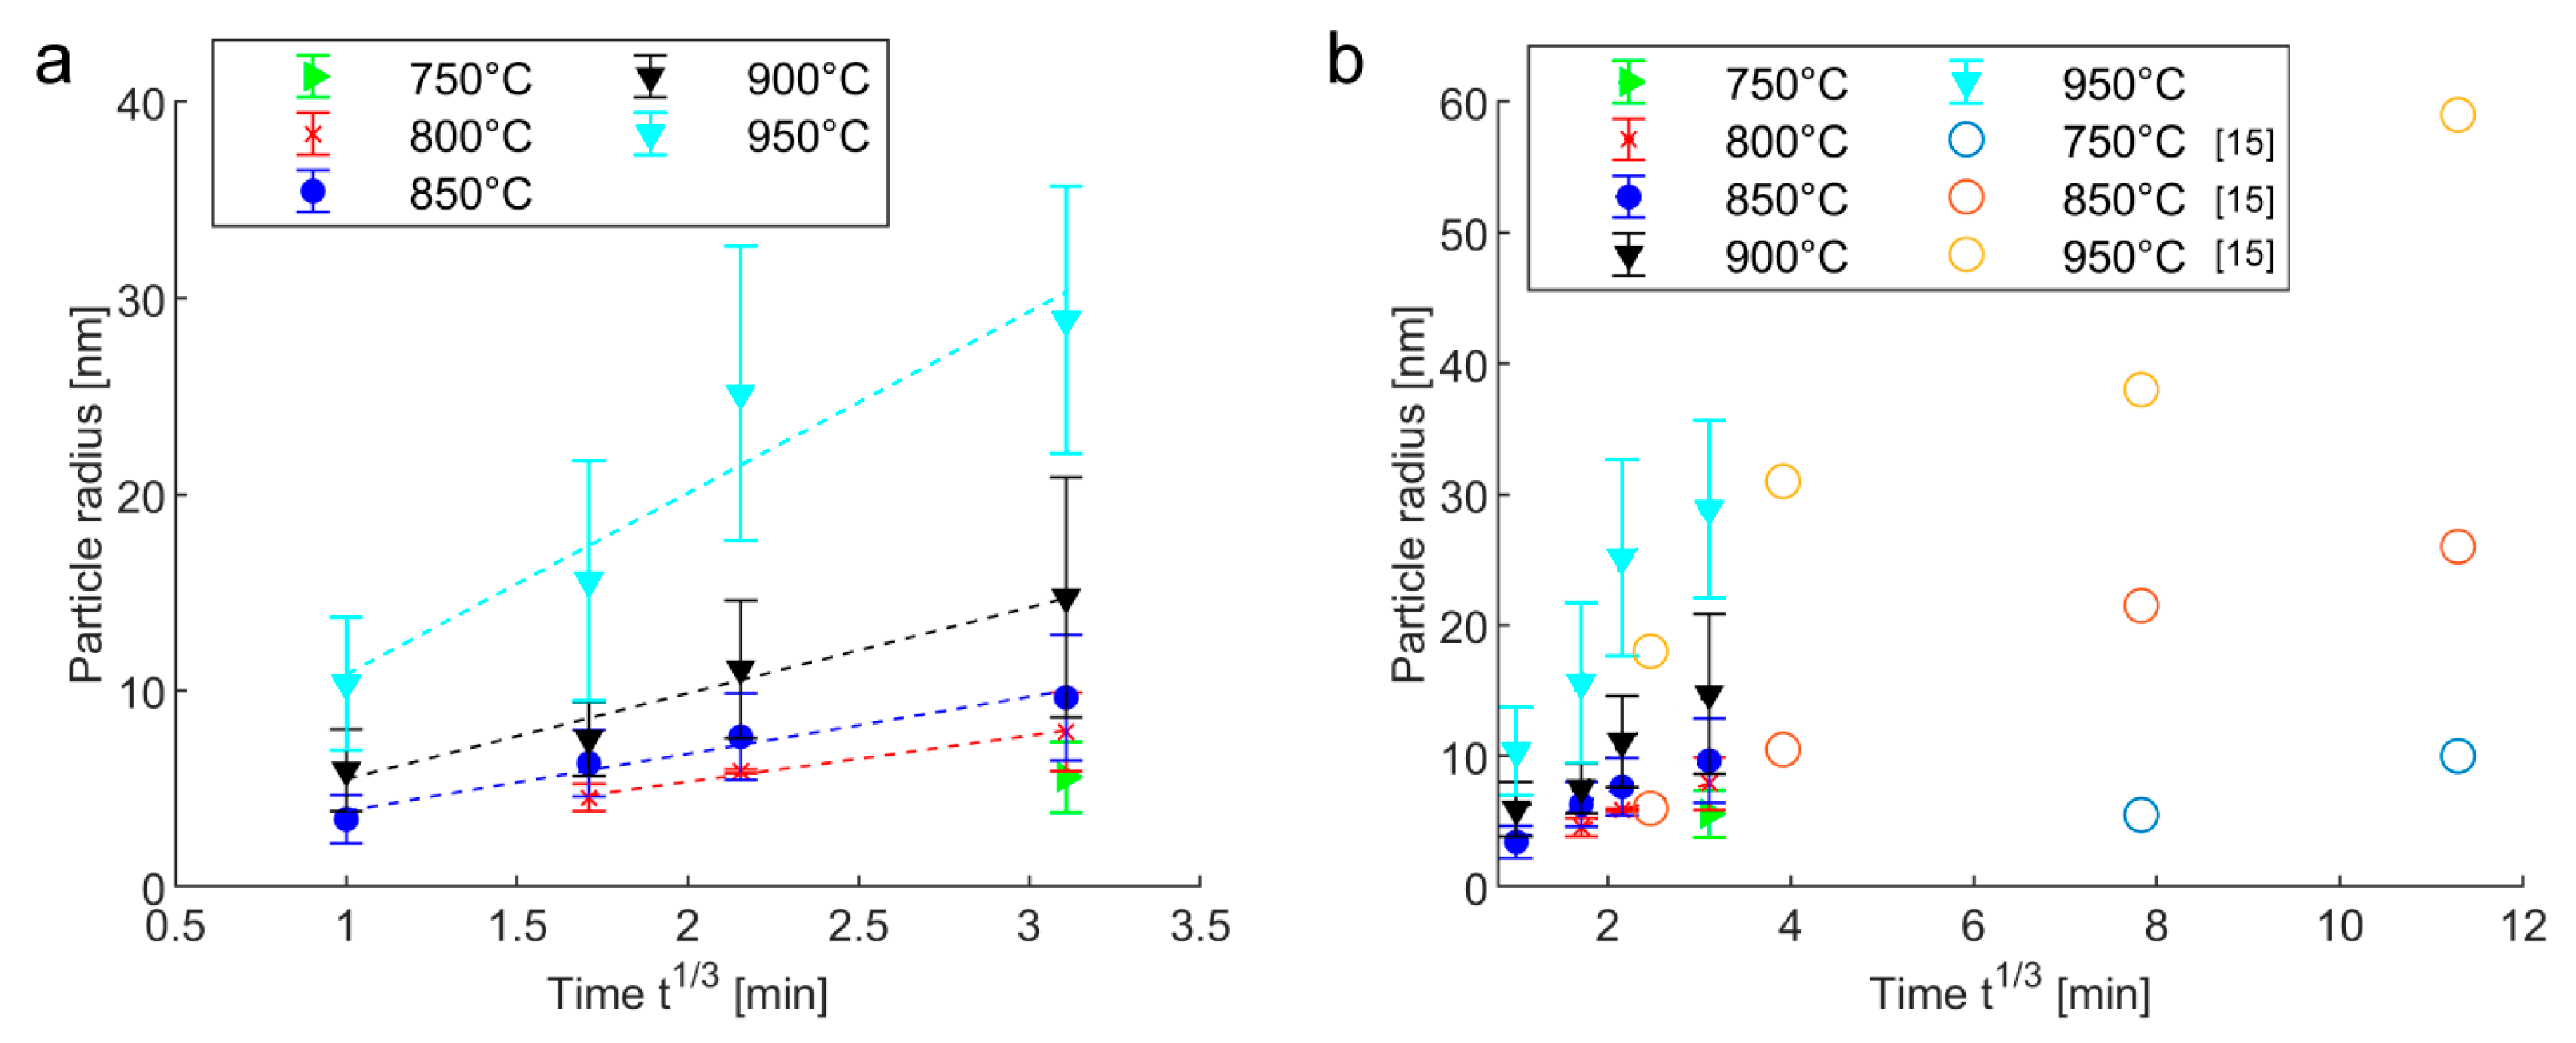
3.2. Microstructural Characterization

The as-received condition shows an average hardness of 265 ± 3 HV0.5, which is higher than would be expected for a completely solutionized material. While no connected grain boundary carbide network was found in this material condition and no γ′ precipitates could be resolved with SEM analysis, TEM SA diffraction confirmed the presence of fine γ′ precipitates in the as-received microstructure. Figure 4a shows a TEM dark field image, where γ′ precipitates appear as bright spots. The corresponding SA diffraction pattern in Figure 4b clearly shows the γ′ sublattice reflections. The average particle diameter has been measured to 2.2 ± 0.4 nm.
The presence of on-cooling γ′ in Haynes® 282® has been discussed previously in the literature [14], and comparable γ′ diameters have been measured with atom probe analysis [15]; however, visual evidence of the presence of γ′ in the as-received material is not commonly presented.
After age-hardening heat treatment, the hardness increased to 380 ± 5 HV0.5. This is in good agreement with other investigations, indicating that the age-hardening process was successful [2,14,15]. The heat treatment causes the development of a network of discrete secondary carbides on grain boundaries, as shown in Figure 5a. γ′ is uniformly precipitated in the microstructure with an average particle diameter of 18.4 ± 3 nm, which can be seen in the TEM dark field image in Figure 5b.
Secondary carbides in Haynes® 282® are reported as Mo-rich M6C and Cr-rich M23C6 [16]. Figure 6a shows a TEM EDS spectra for two carbide particles located on a grain boundary with an increased intensity for the Cr Kα peak for the M23C6 particle. The high Mo content of the other precipitate indicates an M6C carbide. However, the presence of M5B3 borides has also been reported for Haynes® 282®, which are also enriched in Mo [17]. To confirm the presence of M6C, the difference in the diffraction pattern from the [001] zone axis of M23C6 and M6C has been used. Abdel-Latif et al. reported that due to a difference in the space group, {200} reflections are systematically absent in M6C on the [001] orientation [18]. Figure 6c–f diffraction patterns acquired on different zone axes of the M6C carbide are shown where {200} reflections are not present on the [001] zone axis. For clarification, a simulated pattern of the M6C [001] zone axis is presented in Figure 6g, indicating the systematically absent diffraction spots. In the diffraction pattern on the high-Cr M23C6 carbide shown in Figure 6h, on the other hand, the {200} reflections are visible on the [001] zone axis. This confirms the Mo-rich precipitate as an M6C-type carbide. The presence of other Mo-enriched phases such as borides could not be confirmed in this investigation.
The microstructural evolution during isothermal exposure in the temperature range of 750 to 950 °C is shown in Figure 7. Starting from the as-received microstructural appearance, the formation of a grain boundary carbide network can be observed for longer exposure times. In addition, from 850 °C, the precipitation of grain boundary γ′ can be observed. The grain boundary carbide evolution during the different heat treatments is shown in more detail in Figure 8. Few grain boundary carbides were already present in the as-received condition. Those could be identified as either MC-type carbides or Mo-rich M6C carbides, which is in agreement with findings by Fahrmann and Pike [14]. During heat treatments, a continuous grain boundary carbide network was developed at all the test temperatures, despite the relatively short exposure times. The morphology is brick-like for the investigated temperature range. A discrete carbide morphology has only been achieved in the age-hardened condition, where a carbide stabilization heat treatment at 1010 °C was conducted before the final age-hardening heat treatment. Faster precipitation kinetics of M23C6 carbides are reported in the literature [14,15], suggesting that newly formed carbides are mostly of this variety. However, the initial presence of grain boundary carbides also allows coarsening of the already existing precipitates.
Particle sizes are measured on TEM darkfield images of 850 and 950 °C samples, while the remaining data are obtained by measuring particles on SEM images. Measurements on samples etched with oxalic acid led to a difference in particle size of up to 5 nm as compared to the TEM data. Using a γ′ removing etchant resulted in similar particle diameters from both TEM and SEM measurements. Etchants that remove γ′ from the matrix have been found to produce more accurate volume fraction estimates when comparing different methods on IN738LC [19]. They also found some variation in the average precipitate size when comparing different etchants. The small particle size of the γ′ in Haynes® 282® however made it impossible to obtain an accurate volume fraction with this method. Due to the good agreement between the particle diameters obtained by SEM with those from TEM measurements, all the SEM particle data are acquired using a γ′ removing etchant.
Figure 9a shows the particle radius resulting from different heat treatments, while Figure 9b compares the particle size with data from longer exposure times reported by Joseph et al. [15], where a good fit of the particle evolution to the Lifshitz-Slyozov-Wagner (LSW) theory was reported. The LSW theory predicts a linear relationship of particle radius and the cube root of exposure time, but assumes a constant γ′ phase fraction. The measured particle size shown in Figure 9a is fitted with R2 > 0.91, showing a good fit to the LSW theory. This is further supported by the relatively short times to reach an equilibrium phase fraction in the alloy, as shown in Table 3. With the JmatPro calculations assuming a precipitate-free microstructure as the starting condition, nucleation reactions would be completed within the tested exposure times except for 750 °C. The as-received condition already contains 2.5 nm γ′ precipitates. Hence, it can be assumed that not much nucleation happened during further thermal exposure, and that growth is the dominating mechanism, which provides better understanding of the age-hardening behavior of mill-annealed Haynes® 282®.
Hardness evolution is shown in Figure 10a, with the highest hardness of 367 ± 5 HV0.5 after 1800 s at 850 °C. This is close to the hardness obtained after a full age-hardening heat treatment of 28,800 s (8 h) at 788 °C (380 ± 5 HV0.5). Thermal exposure generally led to an increase in hardness as compared to the as-received condition. The rate of further hardness increase is lower for longer exposure times, which can be seen by the convergence of hardness values. At higher temperatures, the equilibrium γ′ phase fraction is lower (cf. Table 3), which together with increased precipitation kinetics and particle coarsening reduces the maximum achievable hardness. This is also apparent from Figure 7, where the particle density is lower for long exposure at 900 and 950 °C, and significant particle coarsening can be observed. Figure 10b shows the time-temperature-hardness (TTH) diagram created from the test data. The nose of the hardening reaction being located at 850 °C correlates well to the data available in the literature [14,15,20].

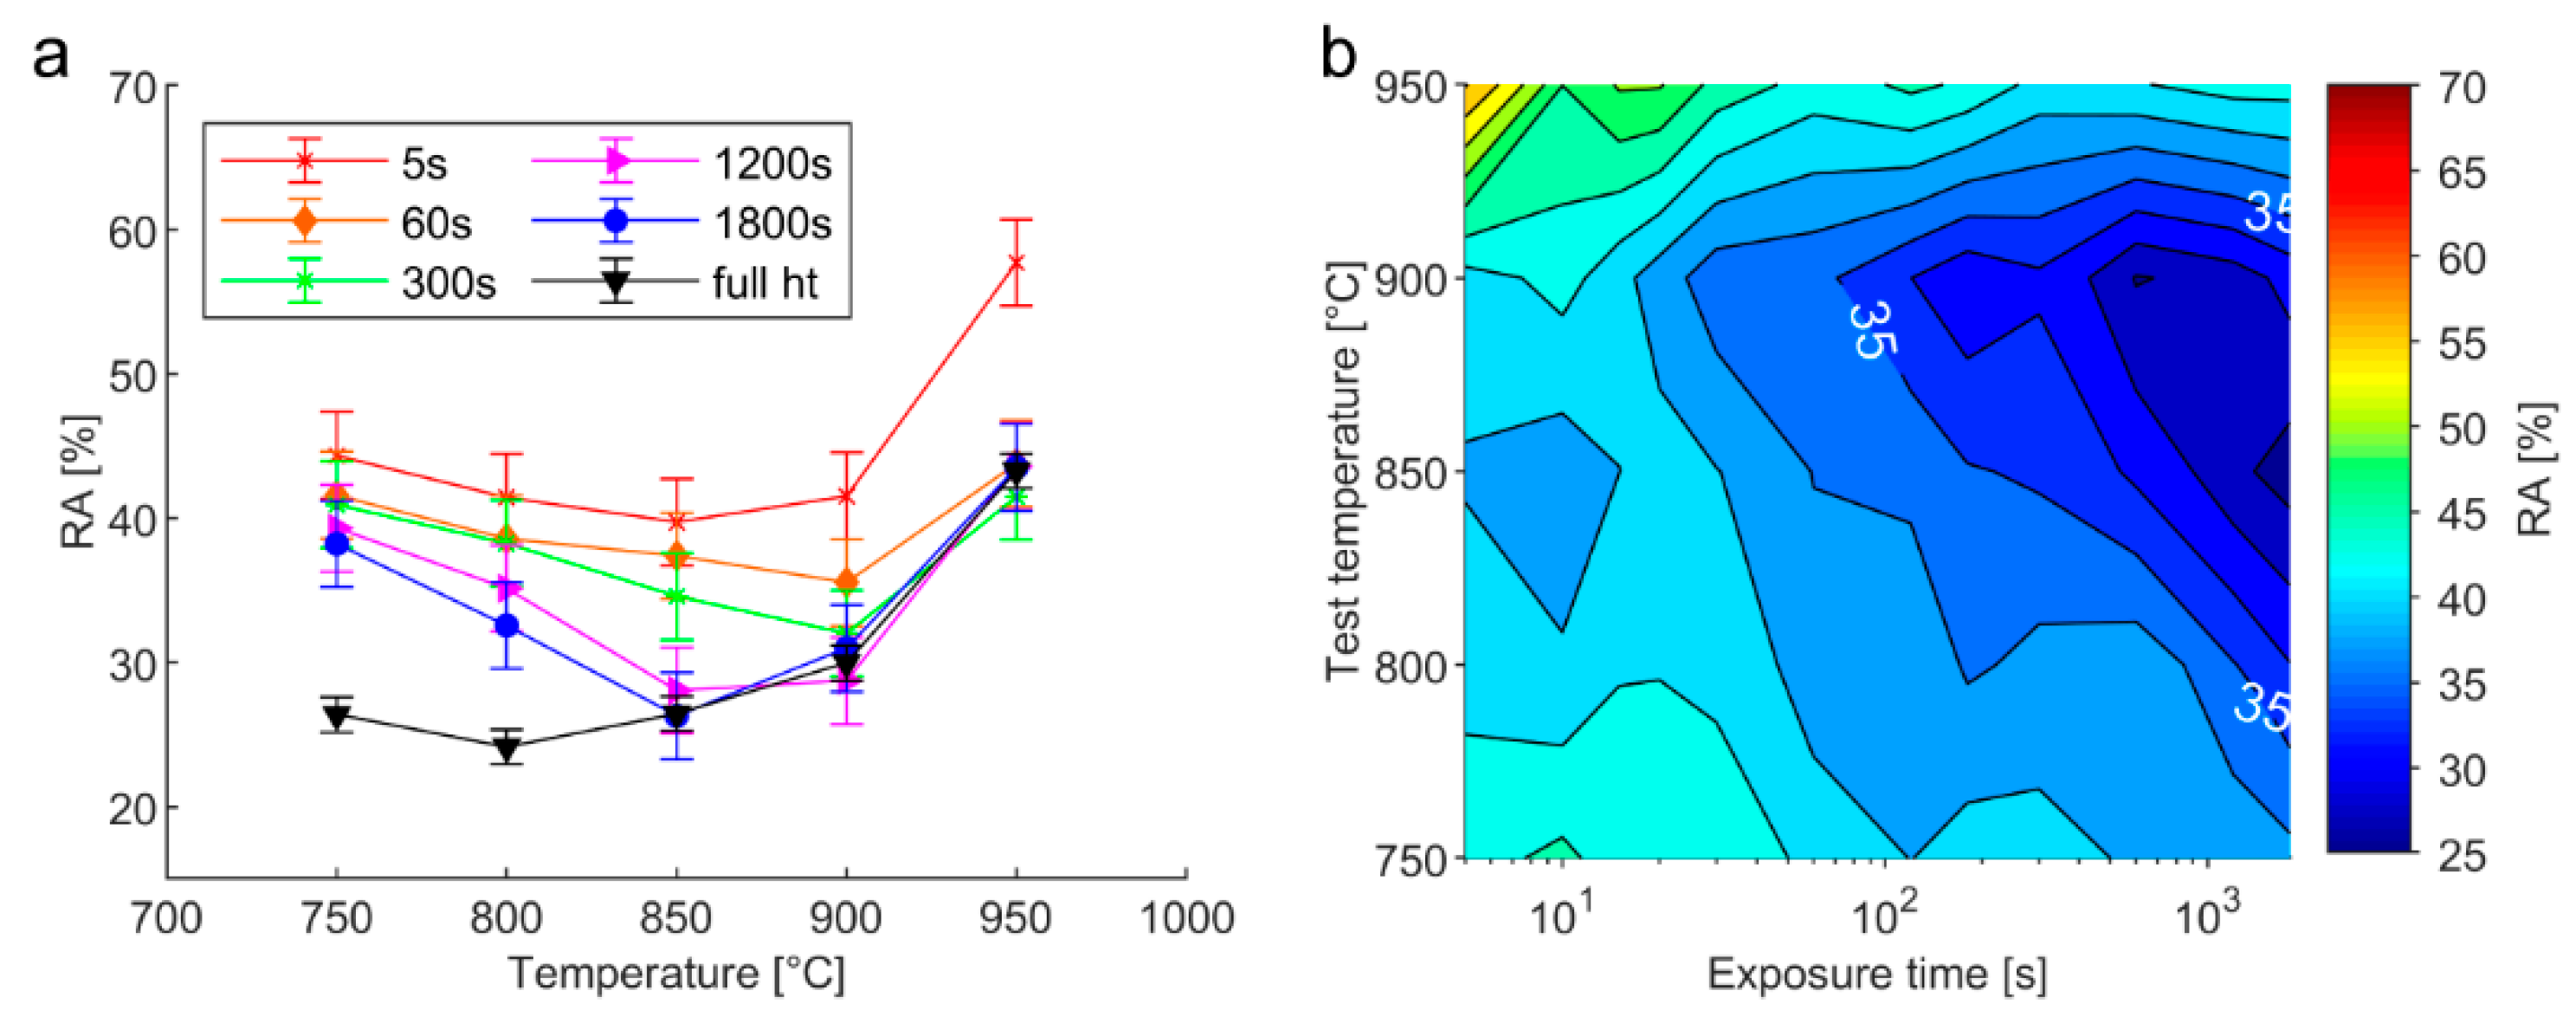
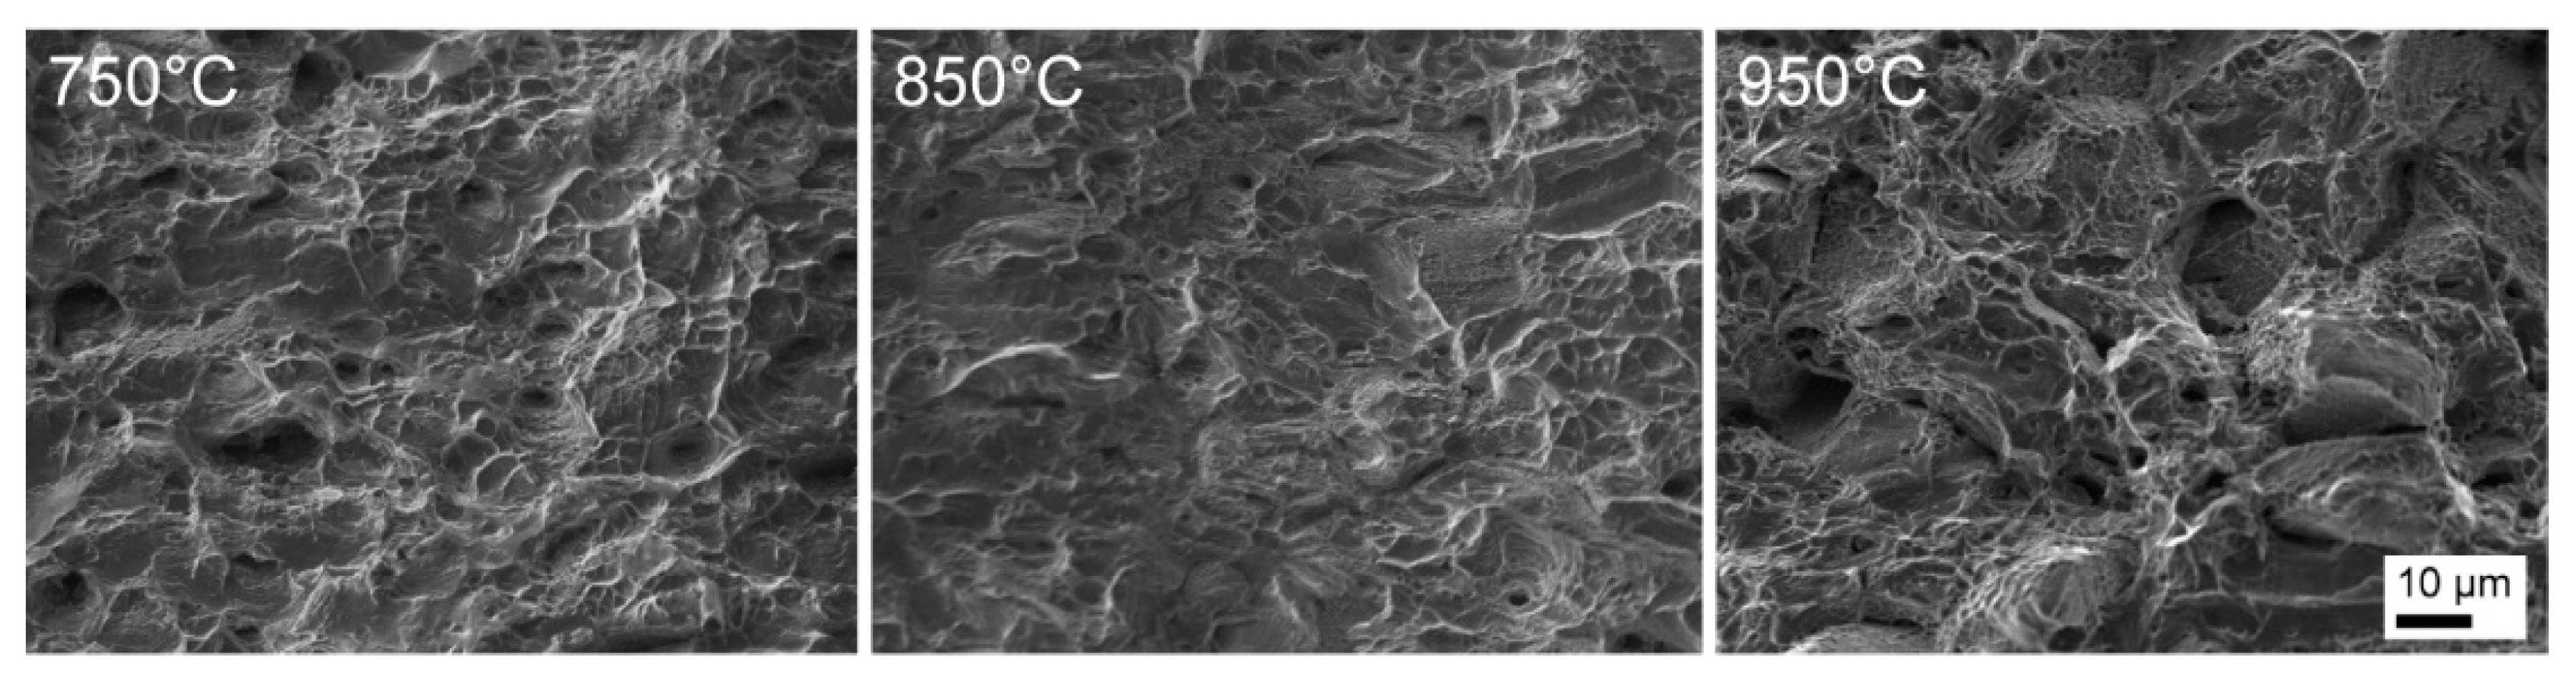
3.3. Effect of Thermal Exposure on Ductility

The ductility after isothermal exposure is shown in Figure 11a, where a subset of the investigated exposure times is compared with age-hardened material. Ductility drops as a function of the exposure time but approaches the level of the age-hardened material. The formation of such a ductility plateau is most clear at temperatures of 850 °C and above. When assuming γ′ precipitation as the main cause for ductility reduction, the fully aged material condition represents a worst-case scenario, and those samples also show the lowest ductility at the investigated temperatures. At the highest test temperature of 950 °C, the ductility reaches this state already after 60 s, while 300 and 1200 s exposure time are necessary for 900 and 850 °C, respectively.
Up to 850 °C, the ductility correlates with the hardness increase due to γ′ evolution, cf. Figure 9 and Figure 10. The slower aging kinetics and hence material hardness at 750 and 800 °C lead to increased ductility as compared to the age-hardened material. The similarity of gamma prime particle size and hardness values of 850 °C and the age-hardened material condition indicates that at this temperature, the main contribution toward ductility appears to be the material’s age-hardening response. The investigation of fracture surfaces did not clearly reveal an intergranular fracture mode for the lower test temperatures, as was expected given the typical crack appearance in strain-age cracking. Instead, grain rupture with ductile regions characterized by the presence of dimples is evident, as shown in Figure 12.
Tests have been repeated using slower stroke rates down to 0.011 mm/s. Since no specimen-mounted strain gauge was used during the experiments, the stroke rate is used in the graphs presented below. While the fracture surfaces appear to be the same for samples tested at 950 °C, a transition toward the intergranular fracture mode can clearly be seen in Figure 13 for the lower test temperatures when the stroke rates are sufficiently low. Exposed grain facets show the presence of microvoids. As 0.011 mm/s was only necessary at the two lowest test temperatures to cause a transition in fracture mode, no tests were performed at 900 and 950 °C with this stroke rate.
Two effects can be observed in Figure 14, where ductility as a function of temperature is plotted for the investigated stroke rates. From 850 °C, the ductility increases with lower stroke rates, which can be related to the thermal softening of the material. At 800 and 750 °C, the ductility decreases for lower stroke rates, which correlates with the transition toward intergranular fracture. When assuming a similar effect of age-hardening reactions on the ductility as observed for high stroke rates (cf. Figure 11), shorter exposure times at a stroke rate of 0.055 mm/s would be expected to show increased ductility. Albeit not being slow enough to cause a full transition at 750 °C, intergranular features could be detected in all the samples at this rate. This stroke rate resulted in a time to facture of 120 s. Since slower rates would further increase the isothermal exposure, this rate was chosen to test microstructures with low amounts of γ′.
Figure 15a–d compiles results obtained for 55 (grain rupture) and 0.055 mm/s (intergranular fracture) for isothermal exposure times of 120 s, 1800 s, and age-hardened material. It becomes evident that the effect of hardness-increase due to γ′ precipitation is not as pronounced when deformation is localized on grain boundaries. Although there is a difference in hardness, the ductility is on a similar level, cf. Figure 15b and Figure 10a. Both γ′ precipitation and the development of a grain boundary carbide network can be expected to contribute to the ductility response.
The slightly reduced ductility at 800 and 850 °C could be related to less grain boundary strengthening. The carbide stabilization step of the complete age-hardening heat treatment leads to the presence of a discrete grain boundary carbide network, as shown in Figure 5a, which can be assumed to strengthen the grain boundaries more efficiently. The combination of thermal exposure and tensile strain present when using slow stroke rates could accelerate the γ′ precipitation kinetics due to the increased dislocation density in the material. Hardness measurements close to the fracture surfaces are expected to be higher than those measured on undeformed samples due to the effect of work hardening. However, no significant difference could be found when comparing hardness close to the fracture surfaces of samples tested with stroke rates of 0.055 and 55 mm/s, as shown in Table 4.
The γ′ already present in the as-received condition together with further precipitation during isothermal exposure appears to harden the grain interior sufficiently to localize deformation to the grain boundaries. The ductility is not negatively affected by any further increase in the grain interior strength. The limited effect of age-hardening reactions in Haynes® 282® on the material ductility can provide further insight on why the material shows good resistance toward strain-age cracking. This is also reflected by the materials high ductility when compared to other nickel-based superalloys such as Waspaloy or R41 in the constant heating rate test [2,6] and the findings from stress relaxation tests where prior cold working was necessary to produce failure in Haynes® 282® [21]. It has to be noted that this test was designed to investigate the effect of microstructural evolution on the materials’ ductility. In a welding setup, an age-hardened base material can still be expected to show an overall higher cracking susceptibility, since weld residual stresses are more localized to the heat affected zone in the case of a high base material strength, which is a finding that has been reported in several studies that investigated welded specimens [8,9,10].

4. Summary and Conclusions

The ductility microstructural evolution of Haynes® 282® during short thermal exposure has been investigated and related to the ductility of the material. The fracture mode is found to be dependent on the deformation rate, with intergranular fracture only occurring when deformation is slow enough to be localized onto the grain boundaries. The age hardening due to γ′ precipitation in Haynes® 282® does affect the materials’ ductility when fracture occurs via grain rupture. However, when deformation is localized onto the grain boundaries, ongoing grain interior hardening does not lead to a further decrease in ductility. This can be related to the more moderate age-hardening kinetics of the alloy. Albeit being less effective than the discrete carbide network obtained during conventional age-hardening heat treatment, the observed rapid formation of a grain boundary-strengthening carbide network in Haynes® 282® can be assumed to contribute to offset the effect of grain interior hardening. The findings in which the ductility response of Haynes® 282® is largely independent of heat treatment indicate why the material has a relatively good resistance toward strain-age cracking. The results from the study can be summarized as:
(1).
γ′ with a 2.5 nm particle size is present in the as-received material.
(2).
Exposure in the temperature range of 750 to 950 °C led to the formation of grain boundary carbide networks with brick-like morphology. Thirty minutes of thermal exposure was sufficient to form a continuous carbide network at all the tested temperatures.
(3).
Haynes® 282® shows a rapid hardening response during short isothermal exposure.
(4).
The fracture mode was found to be stroke-rate dependent, with intergranular fracture only occurring at stroke rates below 0.055 mm/s at 750 and 800 °C.
(5).
The hardening effect of γ′ precipitation is correlated to the materials’ ductility at high strain rates, where grain rupture is the dominant fracture mode.
(6).
When intergranular fracture is the predominant failure mode, the ductility of Haynes® 282® reaches a minimum already after short isothermal exposure and is not affected by further grain interior hardening by γ′ precipitation.
(7).
Grain boundary strengthening due to the development of a carbide network can contribute to offset the effect of grain interior hardening.

Author Contributions

Conceptualization, investigation, validation, visualization, and writing—original draft preparation, F.H.; investigation, writing—review and editing A.K.K.; formal analysis J.S.-N.; supervision and editing O.O.; supervision, conceptualization, and editing, J.A.

Funding

The authors gratefully acknowledge financial support from the Consortium Material Technology for Thermal Energy Processes (KME).

Acknowledgments

We gratefully acknowledge the support from GKN Aerospace Sweden AB. Special thanks go to Asala Gbenga from the University of Manitoba for his help with TEM sample preparation and valuable discussions.

Conflicts of Interest

The authors declare no conflict of interest.

References

  1. Sims, C.T.; Stoloff, N.S.; Hagel, W.C. Superalloys II; Wiley: New York, NY, USA, 1987. [Google Scholar]
  2. Pike, L.M. HAYNES® 282TM Alloy—A New Wrought Superalloy Designed for Improved Creep Strength and Fabricability. In Proceedings of ASME Turbo Expo 2006: Power for Land, Sea and Air; The American Society of Mechanical Engineers: Barcelona, Spain, 2006; Volume 5, pp. 1031–1039. [Google Scholar]
  3. Sjöberg, G. Casting Superalloys for Structural Applications, in 7th International Symposium on Superalloy 718 and Derivatives; The Minerals, Metals & Materials Society: Pittsburg, PA, USA, 2010; pp. 117–130. [Google Scholar]
  4. Lippold, J.C. Welding Metallurgy and Weldability; John Wiley & Sons Inc.: Hoboken, NJ, USA, 2015. [Google Scholar]
  5. Fawley, R.W.; Prager, M. Evaluating the Resistance of René 41 to Strain-Age Cracking. WRC Bull. 1970, 150, 1–12. [Google Scholar]
  6. Rowe, M.D. Ranking the Resistance of Wrought Superalloys to Strain-Age Cracking. Weld. J. 2006, 85, 27s–34s. [Google Scholar]
  7. Metzler, D.A. A Gleeble®-Based Method for Ranking the Strain-Age Cracking Susceptibility of Ni-Based Superalloys. Weld. J. 2008, 87, 249s–256s. [Google Scholar]
  8. Berry, T.F.; Hughes, W.P. A Study of the Strain-Age Cracking Characteristics in Welded René 41—Phase II. Weld. J. 1969, 48, 505s–513s. [Google Scholar]
  9. Thompson, E.G.; Nunez, S.; Prager, M. Practical Solutions to Strain-Age Cracking of René 41. Weld. J. 1968, 47, 299s–313s. [Google Scholar]
  10. Duvall, D.S.; Owczarski, W.A. Heat Treatments for Improving the Weldability and Formability of Udimet 700. Weld. J. 1971, 50, 401s–409s. [Google Scholar]
  11. Haynes International Inc. Haynes 282 Product Brochure; Publication Number H-3173; Haynes International Inc.: Kokomo, IN, USA, 2008. [Google Scholar]
  12. Razavi, S.H.; Mirdamadi, S.; Szpunar, J.; Arabi, H. Improvement of age-hardening process of a nickel-base superalloy, IN738LC, by induction aging. J. Mater. Sci. 2002, 37, 1461–1471. [Google Scholar] [CrossRef]
  13. Norton, S.J.; Lippold, J.C. Development of a Gleeble-Based Test for Postweld Heat Treatment Cracking Susceptibility. In Proceedings of the 6th International Trends in Welding Research Conference, Phoenix, AZ, USA, 15–19 April 2002; pp. 609–614. [Google Scholar]
  14. Fahrmann, M.G.; Pike, L.M. Experimental TTT Diagram of HAYNES 282 Alloy. In Proceedings of the 9th International Symposium on Superalloy 718 & Derivatives: Energy, Aerospace, and Industrial Applications, Pittsburg, PA, USA, 3–6 June 2018; pp. 565–578. [Google Scholar]
  15. Joseph, C. Microstructure Evolution and Mechanical Properties of Haynes 282. Ph.D. Thesis, Chalmers University of Technology, Göteborg, Sweden, 2018. [Google Scholar]
  16. Matysiak, H.; Zagorska, M.; Andersson, J.; Balkowiec, A.; Cygan, R.; Rasinski, M.; Pisarek, M.; Andrzejczuk, M.; Kubiak, K.; Kurzydlowski, K. Microstructure of Haynes® 282® Superalloy after Vacuum Induction Melting and Investment Casting of Thin-Walled Components. Materials 2013, 6, 5016–5037. [Google Scholar] [CrossRef] [PubMed] [Green Version]
  17. Osoba, L.O.; Khan, A.K.; Ojo, O.A. Identification of Mo-based Precipitates in Haynes 282 Superalloy. Metall. Mater. Trans. A 2017, 48, 1540–1543. [Google Scholar] [CrossRef]
  18. Abdel-Latif, A.M.; Corbett, J.M.; Taplin, D.M.R. Analysis of carbides formed during accelerated aging of 2·25Cr–1Mo steel. Met. Sci. 1982, 16, 90–96. [Google Scholar] [CrossRef]
  19. Salehi, R.; Samadi, A.; Savadkoohi, M.K. Influence of Etchants on Quantitative/Qualitative Evaluations of the γ′ Precipitates in a Nickel-Base Superalloy. Metallogr. Microstruct. Anal. 2012, 1, 290–296. [Google Scholar] [CrossRef]
  20. Haas, S.; Andersson, J.; Fisk, M.; Park, J.-S.; Lienert, U. Correlation of precipitate evolution with Vickers hardness in Haynes® 282® superalloy: In-situ high-energy SAXS/WAXS investigation. Mater. Sci. Eng. A 2018, 711, 250–258. [Google Scholar] [CrossRef] [Green Version]
  21. Kant, R.; Dupont, J. Stress Relief Cracking Susceptibility in High-Temperature Alloys. Weld. J. 2019, 98, 29s–49s. [Google Scholar]
Figure 1. (a) Microstructure in the as-received, mill-annealed condition. Primary carbides are visible in the form of strings. (b) Age-hardened microstructure showing a distinct grain boundary carbide network.
Metals 09 01357 g001
Figure 2. Specimen geometry and dimensions in mm.
Metals 09 01357 g002
Figure 3. Simulated total equivalent plastic strain for (a) specimen with constant gauge width and (b) using a constant radius of 26 mm, indicating the localization of plastic deformation to the specimen center.
Metals 09 01357 g003
Figure 4. (a) TEM dark field image using the <0 1 ¯ 1> gamma prime diffraction spot on the gamma [100] zone axis, showing bright γ′ particles with 2.2 ± 4 nm diameter. (b) Diffraction pattern of the gamma [100] zone axis, with γ′ sublattice reflections clearly visible.
Metals 09 01357 g004
Figure 5. (a) Grain boundary carbides in fully heat-treated Haynes® 282®. (b) Gamma prime precipitates with 18.4 ± 3 nm diameter in TEM dark field contrast using the <0 1 ¯ 1> gamma prime diffraction spot.
Metals 09 01357 g005
Figure 6. (a) TEM energy-dispersive X-ray spectroscopy (EDS) indicating the chemical difference of grain boundary carbides found in the fully heat-treated condition. (b) Brightfield image of M6C and M23C6 grain boundary carbides. (c–f) Selected area (SA) diffraction patterns of M6C taken from different zone axes. Note the absence of the <200> reflection on the [001] zone axis in (f). (g) Simulated pattern for the [001] M6C zone axis showing systematically absent spots labeled in red. (h) SA diffraction pattern of an M23C6 carbide on the [001] zone axis, showing a <200> diffraction spot.
Metals 09 01357 g006
Figure 7. Microstructure after isothermal exposure during Gleeble testing, showing the evolution of γ′ precipitation for 60, 300, and 1800 s over the test temperature range of 750–950 °C.
Metals 09 01357 g007
Figure 8. Grain boundary carbide network evolution during isothermal exposure.
Metals 09 01357 g008
Figure 9. (a) Average γ′ particle radius after isothermal exposure. Dashed lines show LSW fit, R2 > 0.91. (b) Comparison with data from Joseph et al. [15] for longer exposure times.
Metals 09 01357 g009
Figure 10. (a) Room temperature hardness for selected isothermal exposure times. The values for fully heat-treated material are shown to indicate the progress of the age-hardening reaction. (b) Isothermal TTH diagram of Haynes® 282® for exposure times up to 1800 s, contour spacing 10 HV.
Metals 09 01357 g010
Figure 11. (a) Ductility comparison of different isothermal exposure times with fully aged material, tested with 55 mm/s stroke rate. (b) Time temperature ductility (TTD) diagram for Haynes® 282®, contour spacing 2.5% reduction in area (RA).
Metals 09 01357 g011
Figure 12. Fracture surfaces after 1800 s of thermal exposure, tested with a 55 mm/s stroke rate.
Metals 09 01357 g012
Figure 13. Fracture surfaces after 1800 s of thermal exposure showing the effect of stroke rate on the fracture mode. Dashed and full lines indicate the range of stroke rates where the fracture mode transitions toward intergranular fracture. White arrows point out the microvoids present on the grain facets.
Metals 09 01357 g013
Figure 14. Ductility as a function of stroke rate over the investigated temperature range. The results from samples tested after 1800 s of thermal exposure are shown.
Metals 09 01357 g014
Figure 15. Ductility as a function of temperature and stroke rate, (a) 55 mm/s stroke rate, (b) 0.055 mm/s stroke rate, (c) 5 s exposure time, (d) 1800 s exposure time.
Metals 09 01357 g015
Table 1. Chemical composition in wt.% of the Haynes® 282® sheet used for the experiments.
NiCrCoMoFeMnAlTiBCCuPSSi
Bal.19.4910.368.550.370.051.522.160.0050.072- *- *- *0.05
* below detection limit.
Table 2. Test matrix and parameters.
Temperature (°C)750800850900950
Exposure Time (s)5101520306012018030060012001800
Cooling Rate (T > 500 °C) (°C/s)100
Stroke Rate (mm/s)0.0110.0550.5555
Chamber Pressure (mbar)0.1
ThermocoupleType K
Table 3. Equilibrium γ′ phase fractions for different temperatures and the minimal exposure time necessary to reach equilibrium conditions, calculated using JmatPro. Phase fraction after 1800 s exposure time indicated in parentheses for 750 °C.
Temperature (°C)γ′ Phase Fraction (%)Exposure Time (s)
75019.7 (11.0)5010 (1800)
80017.91780
85015.7795
90012.4355
9507.8200
Table 4. Hardness measured close to the fracture surface of samples tested with different stroke rates and exposure times at 750 and 800 °C.
Temperature (°C)Exposure Time (s)Stroke Rate (mm/s)Hardness (HV0.5)
7501200.055437 ± 4
55425 ± 19
18000.055476 ± 12
55478 ± 24
8001200.055468 ± 8
55461 ± 14
18000.055494 ± 7
55497 ± 5

