Abstract
In Al-Mg alloys with Mg content 0 ≤ XMg ≤ 6 wt. %, the effects of XMg on dissolved hydrogen content ([H]) and melt quality were investigated. [H] was measured using the Closed-Loop Recirculation method, and the melt quality was quantified using the density index (DI), bifilm index (BI), and porosity measurement. [H] in the molten alloys increased with increasing XMg and melt temperature TMelt; these trends agree with theoretical calculations for hydrogen solubility. The tendency of melt quality vs XMg was similar in DI, BI, and porosity measurements, and the poorest melt quality was observed in the Al-4Mg alloy that had XMg = 4 wt. %, whereas the highest [H] was obtained in the Al-6Mg alloy melt that had XMg = 6 wt. % Mg. During thermogravimetric/differential thermal analysis, rapid oxidation occurred in the Al-4Mg alloy melt during the holding time between 45 and 60 min at 800 °C, i.e., just before the molten metal was cast. The inferior melt quality of Al-4Mg alloy may have been caused by high-temperature oxidation.
1. Introduction
High-strength aluminum (Al) alloys can be used to reduce the weight of vehicles [1,2]. Non-heat-treated Al-Mg sheet alloys have excellent strength and high formability, so they are used as a structural material for inner panels. The strength and formability of the alloys are consequences of solid-solution hardening by magnesium (Mg) addition [3]. Recently, Mg based alloys has been actively studied as a hydrogen storage due to their high hydrogen capacity [4]. When Mg is added to an aluminum alloy, the hydrogen solubility CH in the molten Al alloys increases. The Mg addition also decreases the formation of protective oxide films on the melts, and these changes lead to increase in the numbers of pores and inclusions in the melt, with consequent degradation in melt quality [5]. To reduce the number of internal defects and improve the mechanical properties of Al-Mg alloys that have high Mg content XMg, the effect of XMg on the melt quality of Al-Mg alloys must be clarified, and the quality of molten Al-Mg alloys should be precisely controlled.
Quantitative assessment of melt cleanliness is generally difficult because molten aluminum alloys contain various impurities and internal defects, and currently no unique quality-test method can be used for the comprehensive qualitative assessment of aluminum melt [6,7,8]. The main internal defects in molten aluminum alloys include hydrogen and inclusions. The main source of hydrogen is moisture on the flux, crucible, refractory, raw materials, and tools used during melting. The Al melt reacts with the water vapor to produce hydrogen. There is a large decrease in the hydrogen solubility in the solid state, and hydrogen gas precipitates when it solidifies, which forms pores. On the other hands, the inclusions are mostly oxides, so the oxidation of the Al melt, scraps, contaminants, fluxes and tools can be the source of the inclusions. Several qualitative, semiquantitative, and quantitative tests are available to estimate molten metal cleanliness; combinations of these measurements have been used for complete evaluation of melt quality. Representative methods of measuring melt quality include: (1) Closed-Loop Recirculation (CLR) [9], (2) Reduced pressure tests (RPT) [10], (3) K-mold [7], (4) Pressure-filter tests [11], and (5) Electric-resistivity tests [12].
A bifilm is a doubled-over oxide film that is caused by movement of the melt. The bifilm can trap gas; the combination of bifilm and gas may constitute the main defects in the melt [13,14,15,16,17]. The maximum length of pores has been proposed as an indication of bifilm length, and is represented as the bifilm index (BI). Both the BI and the density index (DI) can be obtained using an RPT. The BI and DI melt are both quality-measurement methods that consider the effects of inclusions and dissolved hydrogen content ([H]). The difference is that BI measures the maximum length of bilfilms on the sectioned RPT samples, whereas DI measures the density of the bulk RPT samples.
In this study, the melt quality of Al-Mg alloys was characterized by measuring [H], porosity, DI and BI, then the effect of XMg and melt temperature TMelt on the melt quality was evaluated. The observation of oxidation kinetics in the Al-Mg melt and the estimation of the free energy change for oxidation in the melt were assessed to understand the melt quality of Al-Mg alloys with different XMg.
2. Materials and Methods
A reference Al sample (XMg = 0 wt. %, Al-0Mg), and Al-Mg alloys that contained XMg = 2 wt. % (Al-2Mg), XMg = 4 wt. % (Al-4Mg), and XMg = 6 wt. % (Al-6Mg) were melted in a resistance furnace in air. Al-Mg alloy ingots (6 kg) were melted at TMelt = 700 °C, 750 °C or 800 °C. The molten samples were held at those TMelt for 10 min, then their [H] were measured using the CLR method by an hydrogen analyzer (ABB Inc., Quebec, QC, Canada)[9]. Each measurement of [H] was repeated three times. The results were compared with CH calculated for molten Al alloys, as calculated for different XMg and TMelt.
To determine the effect of XMg on the melt quality, Al-Mg alloys that had been melted at 800 °C were evaluated using an RPT. This test (also known as the Straube-Pfifer test), provides qualitative information of the overall uncleanness caused by the combined effects of inclusion content and hydrogen in the melt [8]. For the RPT, 100 g of alloy melt were cast and solidified under one of two pressures: under atmospheric pressure in open air, or under a mild vacuum of 80 mbar. The densities (g/cm3) of the two samples determined using Archimedes’ principle, then the density index for the alloys was obtained as:
where is the density of the sample cast under atmospheric pressure, and is the density of the sample cast at 80 mbar.
The measured compositions of Al-Mg Alloys that had been cast at 800 °C in the air were slightly different from the nominal compositions (Table 1).
Table 1.
Chemical composition (wt. %) of Al-Mg alloys.
Internal defects of the RPT samples cast under 80 mbar were evaluated by 3D X-ray computed tomography (240-kV X-ray, resolution = 29 μm; XTH320, Nikon, Tring, UK) and the porosity and the size of pores inside the sample were estimated. BI was measured from optical microscopy images of cross sections of the RPT samples as:
BI = ∑(pore length)
Scanning electron microscopy-Energy dispersive X-ray spectroscopy (SEM-EDS) (JEOL, Tokyo, Japan) was used to identify the oxides and inclusions in the cast Al-Mg alloys. The oxidation kinetics of Al-Mg alloys with different XMg were studied using a thermogravimetric/differential thermal analysis (TG/DTA) facility (Perkin Elmer, Waltham, MA, USA) to measure the weight gain curves of the alloys while they were held isothermally at different TMelt. Plate-shaped specimens (length 2 mm; mass ~20 mg) were used. Thermodynamic calculations for Al2O3, MgO, MgAl2O4 were performed and their growth behavior was evaluated. Their oxidation was considered to be related to the quality of the molten Al-Mg alloys.
3. Results and Discussion
3.1. Hydrogen Content in Molten Al-Mg Alloy
3.1.1. Hydrogen Solubility Calculation
Hydrogen solubility CH [(mL/100 g) in molten alloys under normal pressure follows Sieverts’ law [18]:
where (Pa) is the pressure of hydrogen on the molten alloy, = 0.1 Pa is the standard pressure, (J/mol) is the change of molar free energy of hydrogen during solution, and R = 8.314 J/(mol∙K) is the gas constant.
Early research [19] yielded a theoretical model to calculate CH in multi-component alloys from measured values of thermodynamic properties. The authors suggested that in alloy melts that are nearly ideal liquids, can be expressed as:
Solving Equations (3) and (4) yields:
where is the mole fraction of component i, (J/mol) is the change of molar free energy of hydrogen in pure molten element i, (J/mol) is the excess molar free energy, and is the CH in liquid component i at TMelt.
In the present study, only Al and Mg were considered in calculation of theoretical CH in molten Al-Mg alloys. For a binary alloy, of liquid alloys can be calculated from experimental values, then expressed using Redlich-Kister polynomials [19,20], as:
where (J/mol) is a binary parameter that describes the interaction between components i and j. The interaction parameter and CH in liquid pure Al and Mg, and (Table 2) were used to calculate the theoretical CH in Al-Mg alloys.
Table 2.
Interaction parameter of molten Al-Mg alloys and hydrogen solubilities in liquid pure Al and in liquid pure Mg.
The calculated CH in Al-Mg alloy melts increased with increase in TMelt and in XMg (Figure 1a,b). At 700 ≤ TMelt ≤ 800 °C, Al-Mg alloys with 0 ≤ XMg ≤ 6 wt. % had 0.9 ≤ CH ≤ 2.1 mL/100 g. CH with TMelt increased as XMg increased, and this rate of increase accelerated as TMelt increased. The difference in CH between Al-0wt. %Mg and Al-6wt. %Mg was 0.25 mL/100 g at 700 °C and 0.44 mL/100 g at 800 °C. Previous studies [23,24] have observed the same trends.
Figure 1.
Calculated hydrogen solubility of the Al-Mg alloys according to (a) melt temperature TMelt and (b) Mg content XMg; and measured dissolved hydrogen content in the melt vs (c) TMelt and (d) Mg content.
3.1.2. Dissolved Hydrogen Content
Molten Al-Mg alloy melts had 0.18 ≤ [H] ≤ 0.43 mL/100 g, which were ~20% of their calculated solubility (0.9 ≤ CH ≤ 2.1 mL/100 g) in Al-Mg alloys (Figure 1c,d). [H] increased generally with XMg in the alloys (Figure 1d). As TMelt was increased from 700 °C to 800 °C, [H] increased in Al-Mg alloys with 0 ≤ XMg ≤ 4 wt. % increased, but remained the same or decreased slightly in Al-6Mg. Nevertheless, [H] of Al-6Mg, which has the highest XMg in this study, was higher than in the other alloys at 700 ≤ TMelt ≤ 800 °C.
3.1.3. Hydrogen in Al-Mg alloys at 800 °C
At TMelt = 800 °C, XMg affected [H] in the alloy melts, and the density of the cast alloys after solidification (Figure 2). [H] in the melt increased linearly at (0.036 mL/100 g)/(1 wt. %) with both nominal XMg (Figure 2a) and measured XMg (Figure 2b). The density of the Al-Mg alloys decreased with increase in XMg, because Al has higher density (2.70 g/cm3) than does Mg (1.74 g/cm3). At TMelt = 800 °C, the [H] in the melt was only ~13–19% of calculated CH, and the increase in [H] with increasing Mg was smaller than the increase in CH (Figure 2d). Al-6Mg had the highest [H], so Al-6Mg was expected to have the poorest melt quality in the molten alloy and the highest number of internal defects in the cast sample.
Figure 2.
Dissolved hydrogen content [H] in the Al-Mg alloy melt at 800 °C and the density of the alloys after casting the melt as a function of (a) nominal XMg, and (b) measured XMg. (c) Relationship between the density and the [H] of the alloys. (d) Calculated hydrogen solubility and measured [H] in the Al-Mg alloy melt at 800 °C according to XMg.
3.2. Melt Quality of Al-Mg Alloys Cast at 800 °C
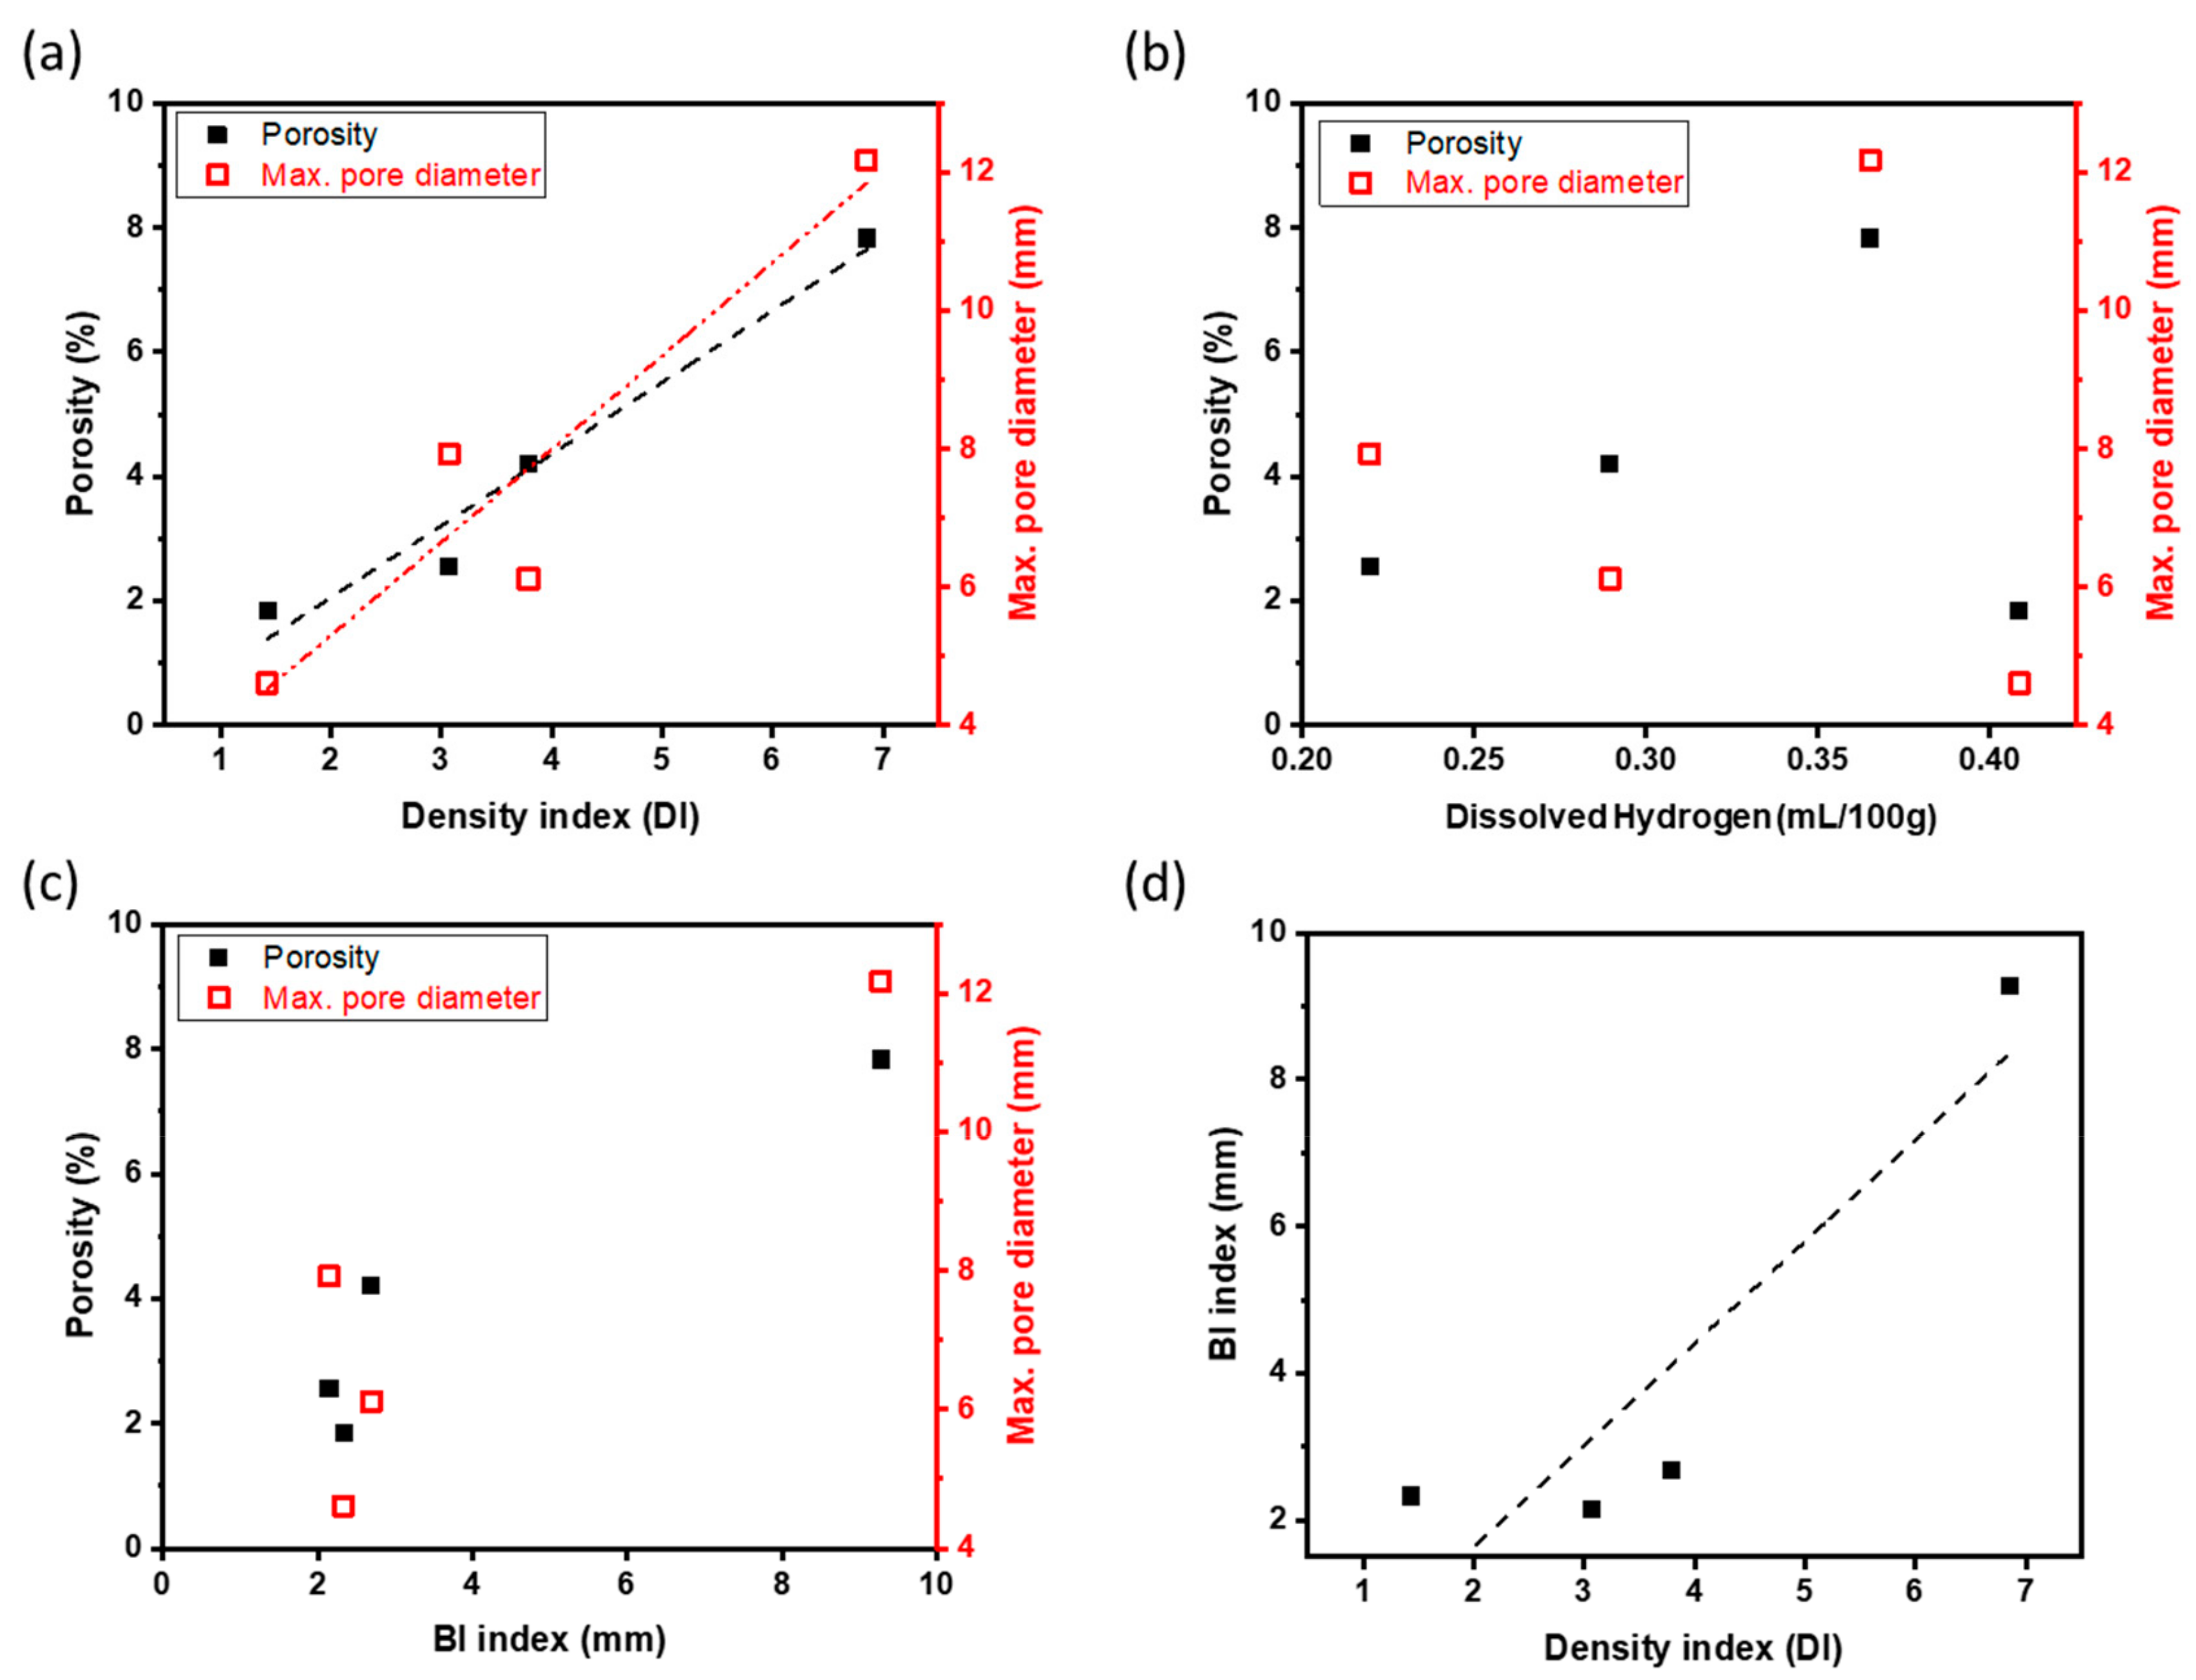
3.2.1. Density Index and Pore Analysis
Melt quality (Figure 3) of Al-Mg alloys at 800 °C was estimated from XMg by using DI and pore analysis. DI increased with increase in XMg to 4 wt. % (DI = 6.85 in Al-4Mg), but in Al-6Mg decreased greatly to DI = 1.43, which is close to the requirement (DI < 1.0) for high-quality melt in the foundry industry. Contrary to expectations, we obtained a high-quality melt the Al-Mg alloy with high measured XMg = 5.3 wt. %, without a degassing process.
Figure 3.
Density index (DI) and porosity (a), and maximum pore diameter (b) of Al-Mg alloys cast at 800 °C as a function of Mg content.
In the reduced-pressure sample that had been cast at 80 mbar, porosity and DI followed the same trend vs XMg (Figure 3a). Photographs of sections (Figure 4) showed defects in the samples. Among the reduced-pressure samples, the Al-4Mg sample had highest values of DI, porosity, and maximum pore size (12.2 mm). This result indicates that Al-4Mg has the poorest melt quality of Al-Mg alloys with Mg content between 0 to 6 wt. % at 800 °C. This also means that, contrary to general observations, Al-4Mg has inferior melt quality to that of Al-6Mg at 800 °C. This unexpected may be a consequence of high-temperature oxidation kinetics and the change in Gibbs free energy for oxidation (Section 3.3).
Figure 4.
(a–d) Photographs of sagittal sections of samples of Al-Mg alloys produced under reduced pressure (insets: whole samples) and (e–h) X-ray Computed Tomography results inside red squares.
In the Al-Mg alloys that had been prepared a reduced pressure, the maximum pore diameter decreased as Mg content increased, except in Al-4Mg (Figure 3b). The decrease may be a result of an increase in the number of nucleation sites for pores in response to increased content of alloying elements and to [H] in the melt. Al-4Mg alloy, which deviate from the tendency between other alloys and the maximum pore diameter, was the one with the highest measured DI and porosity, and the pore formation and growth are expected to be different from other alloys. Experimentation on nucleation and growth kinetics of pores to understand the mechanism is beyond the scope of this work.
3.2.2. Bifilm Index
BI was calculated from the cross sections (Figure 4a–d) of RPT samples. It followed the trends of DI and porosity according to XMg. Al-4Mg had highest BI = 9.3 mm, and other alloys had 2.1 ≤ BI ≤ 2.7 mm. BI can be affected by the number, size and shape of pores. The large BI of Al-4Mg was caused by a large number of pores, rather by their sizes (Figure 5b).
Figure 5.
Bifilm index (a) and number and average length of bifilms (b) measured in reduced-pressure samples of Al-Mg alloys with different Mg contents.
The distribution of pore size in the RPT samples can be also seen in the x-ray computed tomography (CT) results (Figure 4e–h). Most of the pores were roundish in all Al-Mg samples. The pore morphology may be determined by the opening mechanism of a bifilm, likely by a ratcheting action [13]. The bifilm is usually crumpled into a compact form when first introduced into a melt. In the RPT, the volume of gas trapped inside the bifilm increases; this and the diffusion of hydrogen into the gap drive growth and straightening of pores. The expansion of pores causes the creation of additional oxide film area inside of them, and this process is irreversible. In the present work, the EDS results showed that oxide layers had formed inside the pores (Figure 6) and that pores had developed between oxide films (Figure 7); these observations are consistent with previous work [13,15]. Round pores were surrounded by dendrite, and oxide layers were observed on the surface of the dendrite (Figure 6).
Figure 6.
SEM microscope images (a,b) and (c) EDS results of pore in the reduced-pressure sample of Al-4Mg alloy cast at 800 °C.
Figure 7.
SEM microscope image (a) and EDS results (b–f) of pores and oxide films in the reduced pressure sample of Al-6Mg alloy cast at 800 °C.
The Al-Mg-O2 system consists of three important oxides: MgO, MgAl2O4, and Al2O3. EDX analysis has been used to identify MgO and MgAl2O4, and previous work suggested that if the Mg/O ratio is <0.4, the oxide is highly likely to be MgAl2O4-rich oxide [25]. The Al-4Mg RPT sample had M/O < 0.1, and the oxides might be Al2O3 and MgAl2O4-rich oxide. Oxide films including MgO were observed in the Al-6Mg RPT sample (Figure 7) and some pores were observed between these oxide films. These oxide films might be bifilms that were generated as the Al-Mg alloys melted, and that may have provided a place for pores to straighten. This observation corroborates previous studies [13,14,15,26,27], which suggested that, at reduced pressure, pores form between the bifilms, and that BI can be used to assess melt quality.
3.2.3. Melt Quality Parameter Comparison
Porosity, and maximum pore size in RPT samples were compared to DI, [H], and BI (Figure 8) to determine which relationship was strongest. Porosity and maximum pore size showed a strong linear relationship with DI (Figure 8a) but were only weakly related to [H] in the melt (Figure 8b).
Figure 8.
Relation between the porosity and each melt quality parameter of Al-Mg alloys; The porosity and maximum pore diameter according to (a) density index (DI), (b) dissolved hydrogen, and (c) bifilm index (BI). Relationship between the two main melt quality parameter BI and DI (d).
The highest porosity and pore size occurred at the highest BI, were otherwise unrelated to BI (Figure 8c). Possibly, the poor relationship at low BI may be a result of the limited resolution of the optical microscope, so that small or crack-like pores were overlooked during image analysis of the sectioned surface. Similarly, the relationship between BI and DI was not consistent (Figure 8d). In this study, most of the pores were round, so DI should be used to represent the cleanliness of the molten Al-Mg alloys.
3.3. Oxidation of Molten Al-Mg Alloy
3.3.1. Kinetics of Oxidation
TGA results (Figure 9) indicate the oxidation kinetics of Al-Mg alloys at TMelt = 800 °C. After 60 min at this temperature, the weights of Al-0Mg and Al-2Mg alloys were almost unchanged, but Al-4Mg increased by 4.2%, and Al-6Mg increased by 6.4% (Figure 9a). The weight gain rates over time differed between Al-4Mg and Al-6Mg, and could be divided into four sections (I, II, III, IV, Figure 9) according to the rate change. The tendency of oxidation rate change in each section was the same in Al-4Mg and Al-6Mg, but the starting time for section II was earlier in Al-6Mg than in Al-4Mg (Figure 9a). The difference might indicate that the initial oxidation rate is high in aluminum alloys with that have high Mg content. The rate of weight gain (Figure 9b) increased with holding time at 800 °C in sections I and III in both Al-4Mg and Al-6Mg, and this change suggests that oxide scale has some non-protective characteristics in these in this section. However, in sections II and IV, the weight-loss rate decreased over time in both alloys; this reversal of trend suggests that the oxide structures that formed during these sections partially protected the surfaces from further oxidation. The current study was not specifically designed to analyze each type of oxide scale; further study should be conducted to clarify the chemical formulas of the oxide scales, their formation kinetics, and the effects of the elements other than magnesium in the alloys.
Figure 9.
(a) weight percent profiles and (b) their derivatives in Al-Mg alloy samples vs hold time at 800 °C, as measured using thermogravimetric/differential thermal analysis.
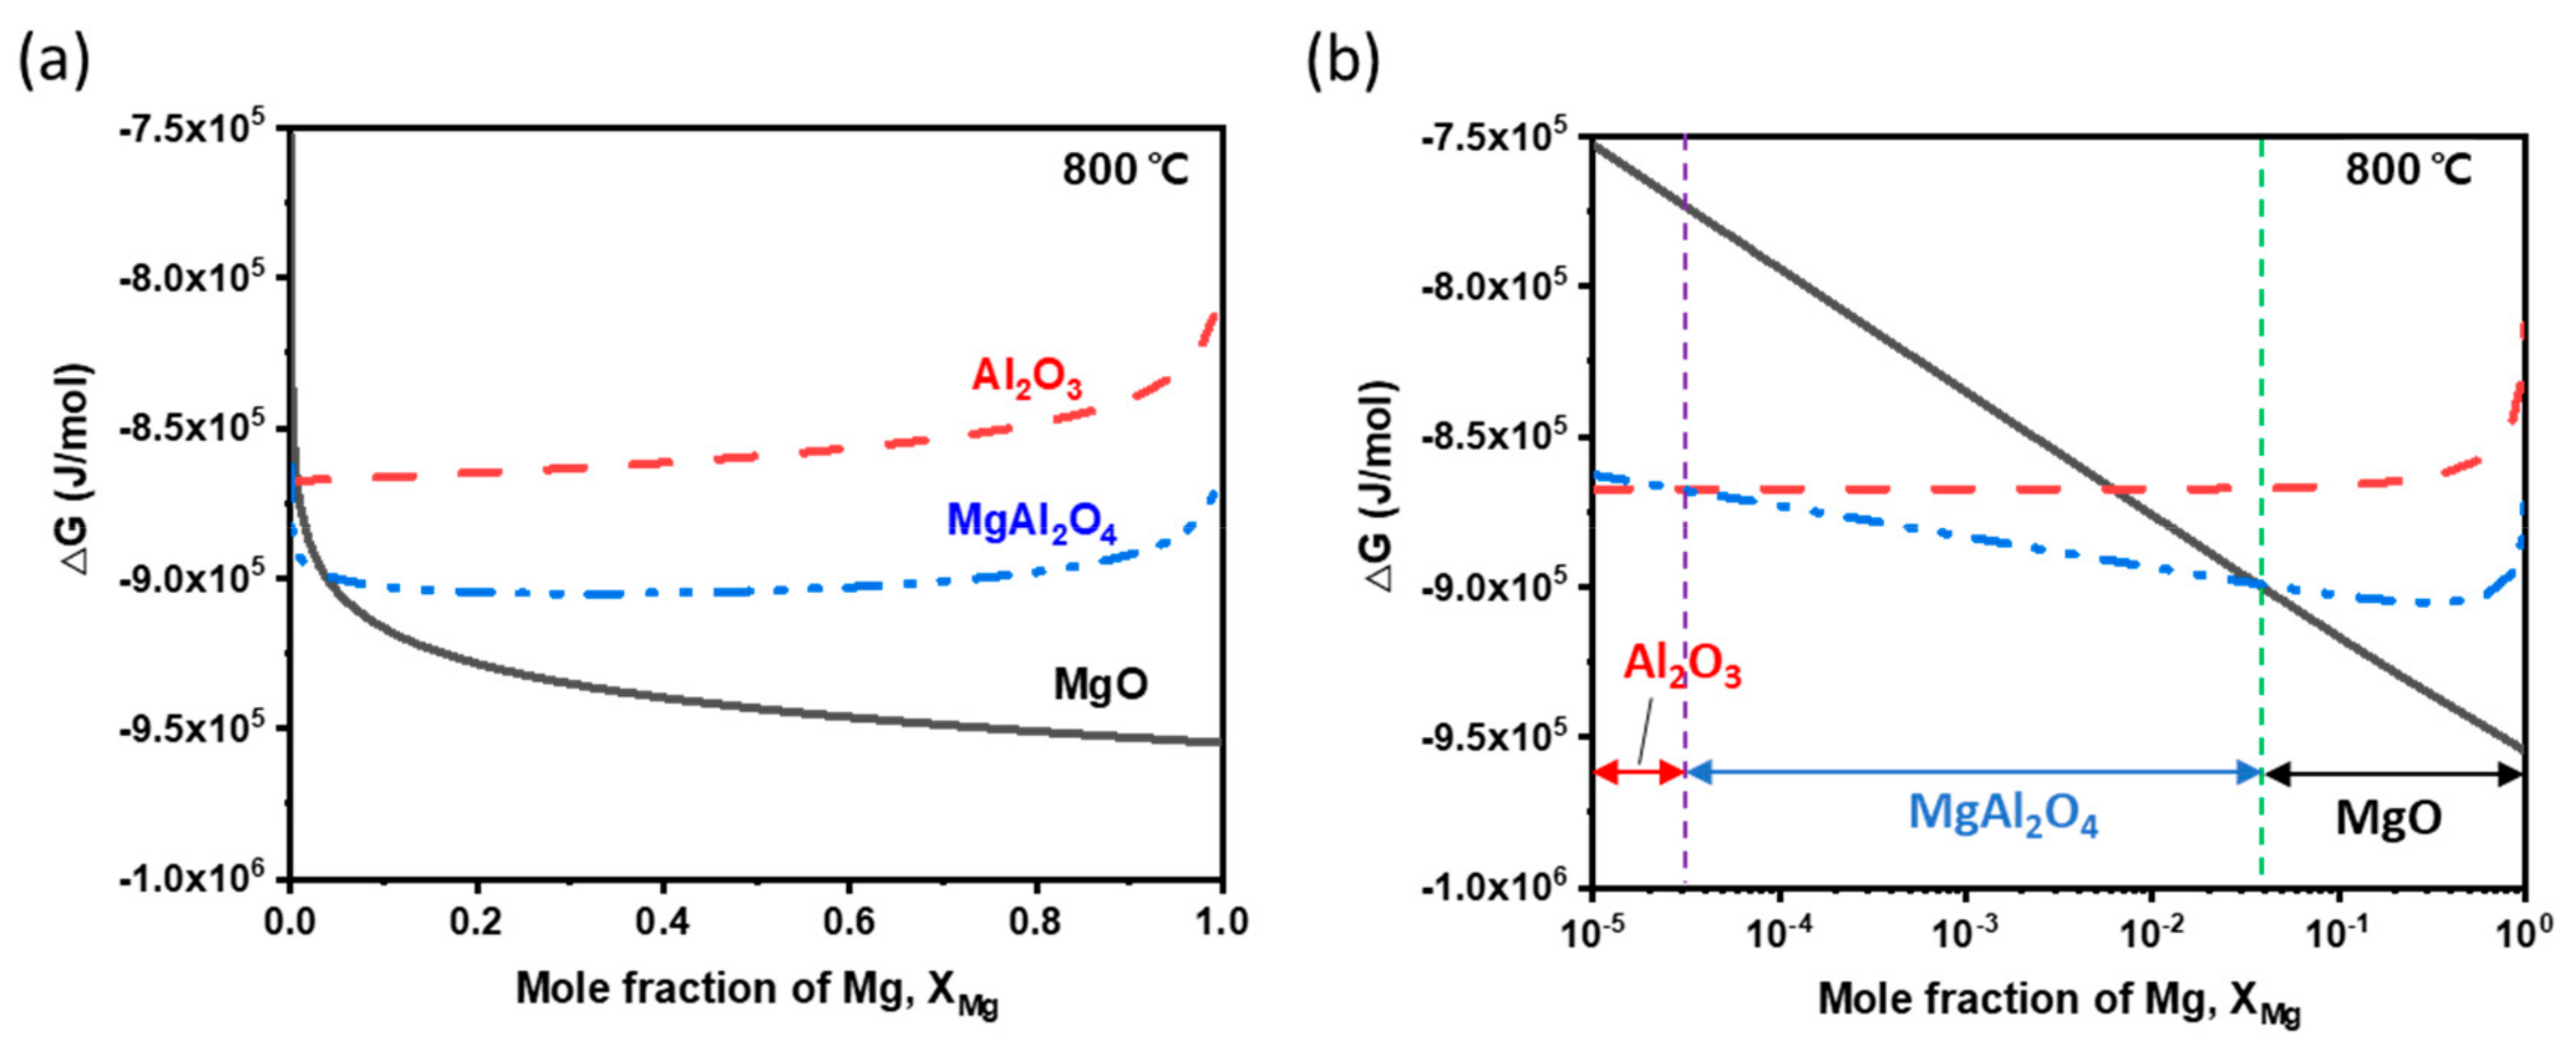
3.3.2. Thermodynamic Calculations for Oxides in Al-Mg Alloy
Profiles of change in Gibbs free energy the oxides Al2O3, MgAl2O4 and MgO were estimated to understand which oxide is the most thermodynamically stable at different XMg compositions and TMelt. The estimates considered three main chemical reactions in the Al-Mg-O2 system [28,29,30]:
The free energy change associated with each of the above chemical reactions () as a function of temperature were calculated using known equations [28] (Table 3). According to classical principles of thermodynamics and literature [31,32,33,34], the chemical activity of Mg, the chemical activity of Al, and the activity coefficient can be estimated as:
Table 3.
Gibbs free energy change functions associated with the reactions (7), (8) and (9), taking into account the standard free energy change and the chemical activities of phases j, data from [28].
From these equations, for each chemical reaction can be expressed as a function of XMg composition and temperature. The profiles were used to understand which oxide is most favored thermodynamically under different XMg compositions and temperatures. The focus of the study was on the effects of XMg; other elements were not considered in the calculation of .
of the oxides Al2O3, MgAl2O4 and MgO varied with at 800 °C (Figure 10). At > 0.037, MgO is the most preferred oxide; if 0.037 > , MgAl2O4 is the most preferred, and at > , Al2O3 becomes the most preferred.
Figure 10.
Gibbs free energy profiles of oxides Al2O3, MgAl2O4 and MgO at 800 °C as a function of mole fraction of Mg on (a) a linear scale and (b) a logarithmic scale.
of all three oxides increased with TMelt in all of the Al-Mg alloys used here (Figure 11). In the Al-0.01Mg alloy, which had the smallest in this study, Al2O3 was the most preferred oxide at temperatures >950 °C, and MgAl2O4 and MgO were preferred at TMelt < 950 °C. This result suggests that addition of Mg to Al interferes with formation of Al2O3 at 25 ≤ TMelt ≤ 950 °C, even if is as small as 0.01 wt. %. In Al-2Mg, Al-4Mg and Al-6Mg alloys, MgAl2O4 was the most favorable oxide at high temperature above a critical temperature TCrit, and MgO was the preferred at TMelt < TCrit. As increased, Tcrit increased, from 690 °C for Al-2Mg, to 850 °C for Al-4Mg, to 980 °C for Al-6Mg.
Figure 11.
Gibbs free energy profiles of oxides Al2O3, MgAl2O4 and MgO as a function of temperature in Al-Mg alloys; (a) Al-0.01Mg, (b) Al-2Mg, (c) Al-4Mg, and (d) Al-6Mg.
3.3.3. Melt Quality of Al-Mg Alloy Related with Their Oxidation
Initially we expected that the Al-Mg alloy with the XMg, i.e., Al-6Mg alloy in the present work, would show the poorest melt quality, because [H] in the molten metal increases as XMg increases. However, the measurements of internal porosity, DI, and BI indicated that Al-4Mg had the poorest melt quality. This unexpected result may be caused to oxidation of the Al-Mg alloy melts. Usually, oxidation of Al-Mg alloy initially forms an amorphous aluminum oxide layer, and MgO forms second [28]. MgAl2O4 then forms over MgO as a result of Mg depletion caused by additional oxidation [35,36]. If the oxide scale of the molten alloy has non-protective characteristics and the surface of the molten alloy is not protected from external gases, then a further oxidation reaction can occur in the molten metal, and cause melt-quality degradation. Al-4Mg alloys have similar for MgO and MgAl2O4 oxide formation at temperatures ~800 °C (Section 3.3.2); this similarity limits the formation of protective stable oxides that would protect the melt surface from external gases. In addition, the oxidation kinetics of Al-4Mg alloy melt proceeded vigorously starting 45 min after the pool reached 800 °C, whereas Al-6Mg alloy melt began to slow after 30 min. Considering that the melt quality measurements were performed after 1 h holding at 800 °C, the poor melt quality of Al-4Mg alloy may have been caused by high-temperature oxidation of the alloy.
4. Conclusions
The effects of Mg content XMg and melt temperature TMelt on the melt quality of Al-Mg alloys was quantified by measuring [H], internal porosity, density index (DI) and bifilm index (BI). Al-Mg alloys had increased [H] in the liquid state due to the addition of Mg, and the [H] increased as XMg or TMelt increased. Generally, an increase in XMg is expected to accelerate formation of pores and inclusions due to the high [H] in the molten metal, and thereby to degrade the quality of melt and of the cast sample. However, DI and BI, which represent the quality of aluminum melt, were the poorest in Al-4Mg, not in in Al-6Mg. This unexpected result may occur because Al-4Mg has similar values of Gibbs free energy change for the oxidation of MgO and MgAl2O4 near 800 °C, so a dominant stable oxide does not form. Increase in XMg can increase the mechanical strength of Al-Mg alloys, but optimization of the response requires careful control of the effects of XMg on hydrogen dissolution in molten alloy, on high temperature oxidation, and on melt cleanliness.
Author Contributions
H.S.J. and S.S. conceived and designed the experiments; H.S.J., H.J.K., G.L. and P.Y. performed the experiments; J.B.J. and S.S. performed thermodynamic calculation; J.B.J., J.Y.P., E.S.K., and S.S. analyzed and discussed the data; H.S.J. and S.S. wrote the paper.
Funding
This work was funded by Ministry of Trade, Industry and Energy (10081329), Republic of Korea.
Conflicts of Interest
The authors have no conflict of interest.
References
- Miller, W.S.; Zhuang, L.; Bottema, J.; Wittebrood, A.J.; De Smet, P.; Haszler, A.; Vieregge, A. Recent development in aluminium alloys for the automotive industry. Mater. Sci. Eng. A 2000, 280, 37–49. [Google Scholar] [CrossRef]
- Hirsch, J.; Al-Samman, T. Superior light metals by texture engineering: Optimized aluminum and magnesium alloys for automotive applications. Acta Mater. 2013, 61, 818–843. [Google Scholar] [CrossRef]
- Mondolfo, L.F. Aluminum Alloys Structure and Properties; Butterworth-Heinemann: Oxford, UK, 1976; ISBN 978-0-408-70932-3. [Google Scholar]
- Hardian, R.; Pistidda, C.; Chaudhary, A.L.; Capurso, G.; Gizer, G.; Cao, H.; Milanese, C.; Girella, A.; Santoru, A.; Yigit, D.; et al. Waste Mg-Al based alloys for hydrogen storage. Int. J. Hydrogen Energy 2018, 43, 16738–16748. [Google Scholar] [CrossRef]
- Lide, D.R. CRC Handbook of Chemistry and Physics; CRC Press: Florida, FL, USA, 2004. [Google Scholar]
- Neff, D.V. Metal Melting and Handling; NADCA: New Jersey, NJ, USA, 2018. [Google Scholar]
- Djurdjevic, M.B.; Odanovic, Z.; Pavlovic-Krstic, J. Melt quality control at aluminium casting plants. Assoc. Metall. Eng. Serb. 2010, 16, 63–76. [Google Scholar]
- ASM Handbook Volume 15: Casting; ASM International: Russell Township, OH, USA, 2008; ISBN 978-0-87170-711-6.
- AlSCAN Engineering Bulletin No. 5; ABB Bomen Inc.: Quebec, QC, Canada, 1991.
- DasGrupta, S.; Parmenter, L.; Apelian, D. Relationship between the reduced pressure test and hydrogen content of the melt. In Proceedings of the Fifth International Conference on Molten Metal Aluminum Processing, American Foundry Society, Orlando, FL, USA, 8 November 1998; pp. 285–300. [Google Scholar]
- Enright, P.; Hughes, I.; Pickering, J.; Simard, A.; Proulx, J. Characterisation of Molten Metal Quality Using the Pressure Filtration Technique. Trans. Am. Foundry Soc. 2003, 86, 1–11. [Google Scholar]
- Makarov, S.; Apelian, D.; Ludwig, R. Inclusion Removal and Detection in Molten Aluminum: Mechanical, Electromagnetic and Acoustic Techniques. Trans. Am. Foundry Soc. 1999, 107, 727–736. [Google Scholar]
- Dispinar, D.; Campbell, J. Porosity, hydrogen and bifilm content in Al alloy castings. Mater. Sci. Eng. A 2011, 528, 3860–3865. [Google Scholar] [CrossRef]
- Uludağ, M.; Çetin, R.; Dişpinar, D.; Tiryakioğlu, M. On the Interpretation of Melt Quality Assessment of A356 Aluminum Alloy by the Reduced Pressure Test: The Bifilm Index and Its Physical Meaning. Int. J. Met. 2018, 12, 853–860. [Google Scholar] [CrossRef]
- Dispinar, D.; Campbell, J. Use of bifilm index as an assessment of liquid metal quality. Int. J. Cast Met. Res. 2006, 19, 5–17. [Google Scholar] [CrossRef]
- Dispinar, D.; Campbell, J. A comparison of methods used to assess aluminium melt quality. In Proceedings of the 136th TMS Annual Meeting, Shape Casting: 2nd International Symposium, Orlando, FL, USA, 25 Febrary–1 March 2007; pp. 11–18. [Google Scholar]
- Uludağ, M.; Çetin, R.; Dispinar, D.; Tiryakioğlu, M. Characterization of the Effect of Melt Treatments on Melt Quality in Al-7wt. %Si-Mg Alloys. Metals 2017, 7, 157. [Google Scholar] [CrossRef]
- Wagner, C. Thermodynamics of Alloys; Addison-Wesley Press: Cambridge, MA, USA, 1952. [Google Scholar]
- Jiang, G.R.; Li, Y.X.; Liu, Y. Calculation of hydrogen solubility in molten alloys. Trans. Nonferrous Met. Soc. China 2011, 21, 1130–1135. [Google Scholar] [CrossRef]
- Redlich, O.; Kister, A.T. Algebraic Representation of Thermodynamic Properties and the Classification of Solutions. Ind. Eng. Chem. 1948, 40, 345–348. [Google Scholar] [CrossRef]
- Liang, P.; Tarfa, T.; Robinson, J.; Wagner, S.; Ochin, P.; Harmelin, M.; Seifert, H.; Lukas, H.; Aldinger, F. Experimental investigation and thermodynamic calculation of the Al–Mg–Zn system. Thermochim. Acta 1998, 314, 87–110. [Google Scholar] [CrossRef]
- Zhang, H.; Li, Y.; Liu, Y. Hydrogen solubility in pure metals for Gasar process. ACTA Metall. Sin. Ed. 2007, 43, 113. [Google Scholar]
- Opie, W.R.; Grant, N.J. Hydrogen Solubility in Aluminum and Some Aluminum Alloys. Trans. Metall. Soc. AIME 1950, 188, 1237–1241. [Google Scholar] [CrossRef]
- Anyalebechi, P.N. Analysis of the effects of alloying elements on hydrogen solubility in liquid aluminum alloys. Scr. Metall. Mater. 1995, 33, 1209–1216. [Google Scholar] [CrossRef]
- Lea, C.; Ball, J. The oxidation of rolled and heat treated Al-Mg alloys. Appl. Surf. Sci. 1983, 17, 344–362. [Google Scholar] [CrossRef]
- El-Sayed, M.A.; Hassanin, H.; Essa, K. Bifilm defects and porosity in Al cast alloys. Int. J. Adv. Manuf. Technol. 2016, 86, 1173–1179. [Google Scholar] [CrossRef]
- Dispinar, D.; Akhtar, S.; Nordmark, A.; Di Sabatino, M.; Arnberg, L. Degassing, hydrogen and porosity phenomena in A356. Mater. Sci. Eng. A 2010, 527, 3719–3725. [Google Scholar] [CrossRef]
- Wu, G.; Dash, K.; Galano, M.L.; O’Reilly, K.A.Q. Oxidation studies of Al alloys: Part II Al-Mg alloy. Corros. Sci. 2019, 155, 97–108. [Google Scholar] [CrossRef]
- Alper, A.M.; Mcnally, R.N.; Ribbe, P.H.; Doman, R.C. The System MgO–MgAl2O4. J. Am. Ceram. Soc. 1962, 45, 263–268. [Google Scholar] [CrossRef]
- Raiszadeh, R.; Griffiths, W.D. A method to study the history of a double oxide film defect in liquid aluminum alloys. Metall. Mater. Trans. B Process Metall. Mater. Process. Sci. 2006, 37, 865–871. [Google Scholar] [CrossRef]
- Buchdahl, H.A. The Concepts of Classical Thermodynamics. Am. J. Phys. 1960, 28, 196–201. [Google Scholar] [CrossRef]
- Tiwari, B.L. Thermodynamic properties of liquid Al-Mg alloys measured by the EMF method. Metall. Trans. A Phys. Metall. Mater. Sci. 1987, 1 A, 1645–1651. [Google Scholar] [CrossRef]
- Saunders, N. A review and thermodynamic assessment of the Al-Mg and Mg-Li systems. Calphad 1990, 14, 61–70. [Google Scholar] [CrossRef]
- Bhatt, Y.J.; Garg, S.P. Thermodynamic study of liquid aluminum-magnesium alloys by vapor pressure measurements. Metall. Trans. B 1976, 7, 271–275. [Google Scholar] [CrossRef]
- Haginoya, I.; Fukusako, T. Oxidation of Molten Al-Mg Alloys. Trans. Jpn. Inst. Met. 1983, 24, 613–619. [Google Scholar] [CrossRef]
- Venugopalan, H.; DebRoy, T. Growth Stage Kinetics in the Synthesis of Al2O3/Al Composites by Directed Oxidation of Al-Mg and Al-Mg-Si Alloys. J. Eur. Ceram. Soc. 1996, 16, 1351–1363. [Google Scholar] [CrossRef]
© 2019 by the authors. Licensee MDPI, Basel, Switzerland. This article is an open access article distributed under the terms and conditions of the Creative Commons Attribution (CC BY) license (http://creativecommons.org/licenses/by/4.0/).