Abstract
Due to its excellent resistance to corrosive environments and its superior mechanical properties, the Ni-based Hastelloy C-276 alloy was chosen as the material of the stator and rotor cans of a nuclear main pump. In the present work, the Hastelloy C-276 thin sheet 0.5 mm in thickness was welded with filler wire by a pulsed laser. The results indicated that the weld pool geometry and microstructure were significantly affected by the duty ratio, which was determined by the pulse duration and repetition rate under a certain heat input. The fusion zone area was mainly affected by the duty ratio, and the relationship was given by a quadratic polynomial equation. The increase in the duty ratio coarsened the grain size, but did not obviously affect microhardness. The weld geometry and base metal dilution rate was manipulated by controlling pulsed parameters without causing significant change to the performance of the weld. However, it should be noted that, with a larger duty ratio, the partial molten zone is a potential weakness of the weld.
1. Introduction
The Ni-based Hastelloy C-276 alloy is widely used in chemical processing and the nuclear industry, and as marine engineering components such as pumps, valve parts, and spray nozzles, due to its excellent resistance to corrosive environments and its superior mechanical properties [1,2]. The stator and rotor cans of a nuclear main pump in a third-generation nuclear power plant are made of Hastelloy C-276 thin sheets via welding. The unique service conditions of the stator and rotor cans demand high quality of the weld of Hastelloy C-276 thin sheets.
Arc welding, the most common welding method, has been used to weld Hastelloy C-276 by many researchers. Cleslak et al. [3] indicated that intermetallic secondary solidification constituents, a combination of p and μ phases, were found to be associated with weld metal hot cracks in Hastelloy C-276. Li et al. [4] investigated the effects of plate thickness and the annealing process on the microstructure and properties of the Hastelloy C-276 welding line by GTAW, and the grain coarsened with the increase in plate thickness. When filler metal was used, many secondary phase particles were observed after the welding process. The grain size increased in both fusion and the heat affected zone (HAZ), and the tensile strength of the weld decreased. The corrosive resistance was better than that of the autogenous weld bead. The 0.4-mm-thick Hastelloy C-276 thin sheet was welded by GTAW without filler metal, and both the heat affected zone (HAZ) and a secondary phase were detected. Manikandan et al. [5,6,7] reported that, by current pulsing, the microstructure and mechanical behavior of GTAW of Hastelloy C-276 could be improved. Pulsed Current Gas Tungsten Arc (PCGTA) weldments were found to be the best in terms of (i) freedom from microsegregation, (ii) strength, and (iii) freedom from unwanted secondary phases.
Ahmad et al. [8] studied the microstructure and hardness of the electron beam welded zone of 3-mm-thick Hastelloy C-276. The molten zone (MZ) was found to be of a fine lamellar type, and the hardness was 35% higher compared to as-received alloy, while a hardness reduction of about 5%–8% was observed in the HAZ. Van der Eijk et al. [9] welded NiTi to Hastelloy C-276 with and without filler wire. It was found that the mixed zone of the weld contained a number of brittle phases, and there was a tendency of the NiTi to absorb elements from the Hastelloy C-276.
Compared with conventional fusion welding methods, laser welding has advantages such as a low heat input, a narrow HAZ, low distortion, and ease of automation [10]. Wu and Ma et al. [11,12,13] performed a series of studies about the laser welding of 0.5-mm-thick Hastelloy C-276 thin sheets without filler wire, and the MZ was found to be of much finer grains, and the element segregation was found. However, the trend of the brittle phase's formation was weakened, no HAZ was found, and the mechanical properties were comparable to the as-received alloy. Ventrella et al. [14] welded Hastelloy C-276 thin foil with a 100-micron thickness. The results indicated that, by using a precise control of the pulse energy and the dilution rate, sound welds could be obtained.
Reports about arc welding Hastelloy C-276 thin sheets with thicknesses of 0.5 mm or less are rare. Studies have proved that pulsed laser welding is an appropriate technique for welding such thin sheets. Laser welding without filler wire has high demands for preparation and clamping. The defect of weld sag is a serious problem when the gap width is larger than 10% of the workpiece thickness [15]. In the present work, a 0.5-mm-thick Hastelloy C-276 thin sheet was welded by a pulsed Nd:YAG laser with 0.5-mm filler wire. In order to highlight the characteristics of the effects of the pulsed parameters, a fixed total heat input was used. The influence of pulsed parameters on weld bead geometry and microstructure was investigated.
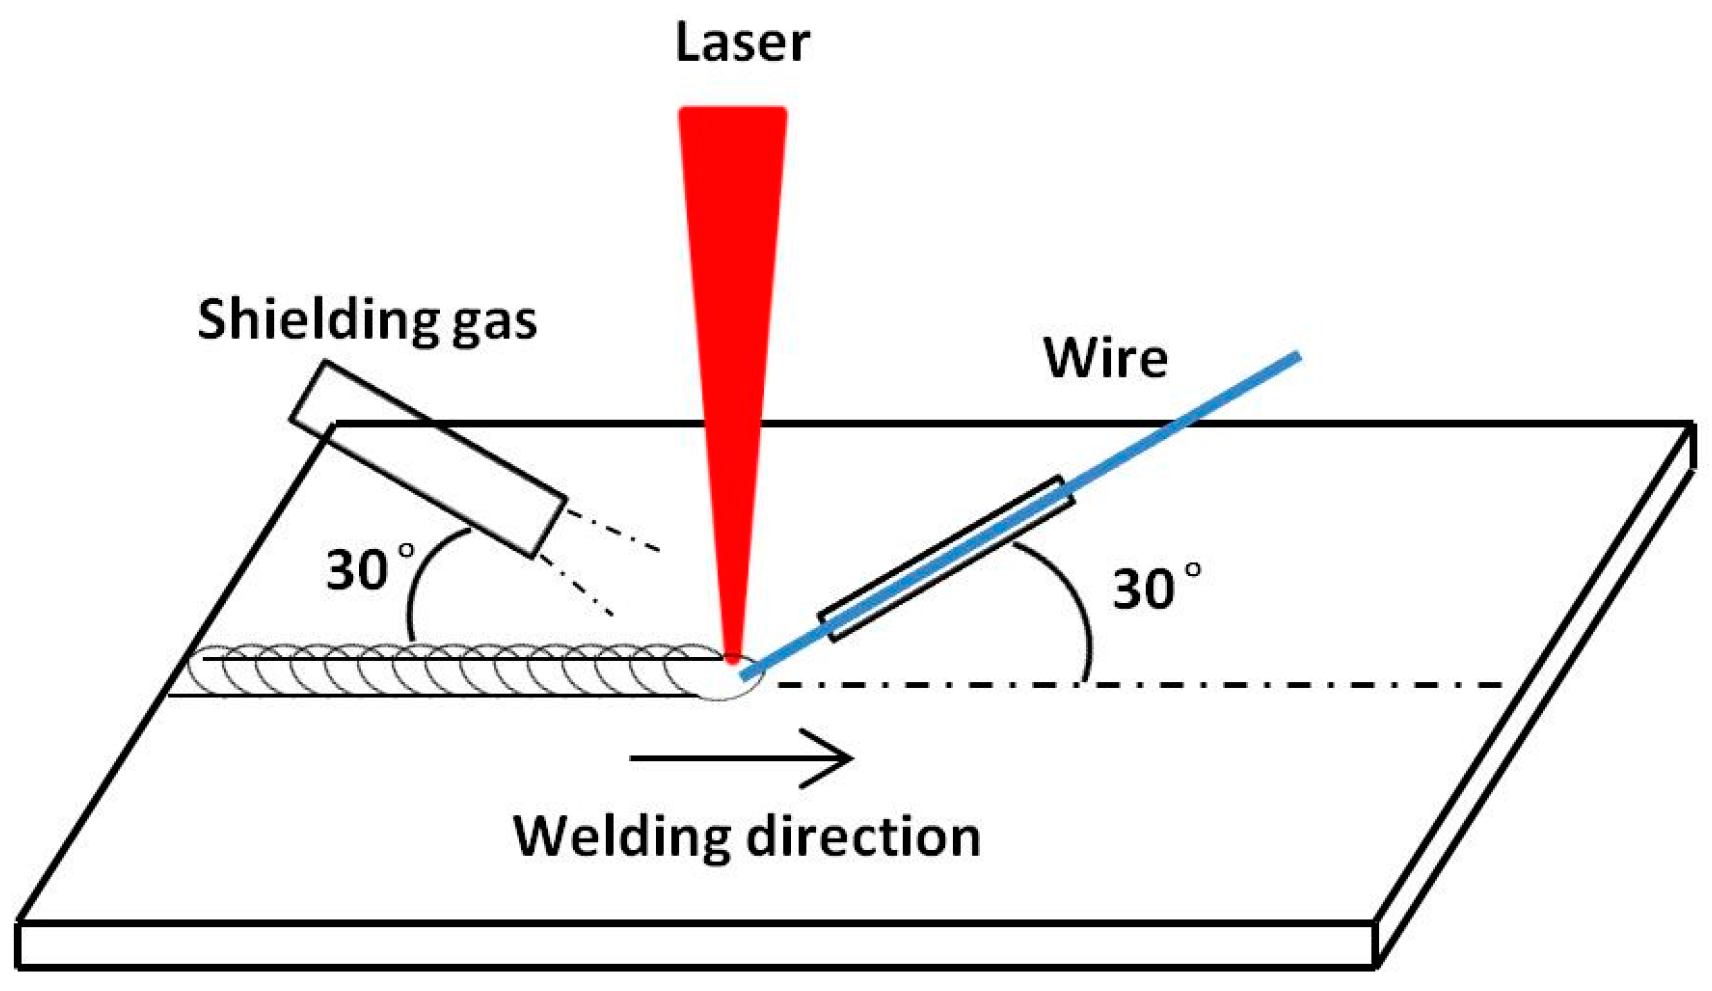
2. Experimental Setup
The experimental setup is shown in Figure 1. A millisecond pulsed Nd:YAG laser system (GSI LUMONICS, JK701H, Rugby, UK) with a 1064-nm wavelength and multimode beam was used. The collimated beam diameter was 23.5 mm. The focal length was 80 mm, and focal beam diameter was approximately 0.6 mm. The incident direction of pulsed laser was perpendicular to the substrate surface. The argon shroud gas was delivered through a nozzle with a flowrate of 12 L/min, and the nozzle had a diameter of 6 mm and was set 30 mm away from the weld pool. The experiment was conducted on a commercially available with dimensions of 100 mm × 40 mm × 0.5 mm. The yield strength and the ultimate tensile strength of the as received Hastelloy C-276 thin sheet (Haynes International, Kokomo, IN, USA) are 391 MPa and 857 MPa at room temperature, respectively [16]. The filler metal was 0.5-mm-diameter ERNiCrMo-4 filler wire. The chemical compositions are shown in Table 1.
Figure 1.
Experiment setup.
Table 1.
Chemical composition of Hastelloy C-276 and ERNiCrMo-4 (wt. %).
The bead-on-plate tests were used to analyze the weld shapes. The welding direction was vertical to the rolling direction. The substrate surfaces were grinded with 600 grit silicon carbide paper and then cleaned by ethanol to remove the oxide and oil. The weld parameters are shown in Table 2.
Table 2.
Weld parameters.
The average laser power (P) and the peak power (Pp) are defined as follows:
where Ep (J) is the pulse energy, f (Hz) is the pulse frequency, and τ (ms) is the pulse duration. The pulse duration and pulse frequency, as two independent variables, are chosen to analyze the effects of the pulsed laser on the welding process. The average laser power is fixed in the experiments. The pulse energy decreases with the increase in the pulse frequency, causing a decrease in the peak power when the pulse duration is kept constant. The pulse energy and frequency are kept constant when the pulse duration is increased, so the peak power drops with the increase in the pulse duration.
P = Ep·f;
Pp = Ep/τ,
The pulse duty ratio (α) is defined as the ratio of pulse duration to pulse period and can be expressed as
α = f·τ/1000
The pulse duty ratio represents the ratio of the heating time in one pulse cycle. A larger pulse duty ratio means a longer heating time and a shorter cooling time in the welding process.
Figure 2 shows the typical cross-section of the weld. The weld width (Lu, Ll), the fusion zone area (A (A = Au + As + Al), As), the reinforcement height (Hu, Hl), and the reinforcement height-to-width ratio (ru, rl) were used to evaluate the weld shape. A smaller reinforcement height-to-width ratio means a better spreadability of the filler metal [17].
Figure 2.
Cross-section of weld bead of pulsed laser welding with filler wire.
3. Results and Discussion
When the pulse duration was shorter than 4 ms or the frequency was lower than 50 Hz, the welds showed lack of penetration defects, as shown in Figure 3a,c. When the pulse duration was longer than 8 ms or the frequency was higher than 90 Hz, a very irregular outline and even undercut sometimes occurred on the upper surface of the weld, as shown in Figure 3b,d. The irregular upper surfaces indicate that the weld pool was unstable during the welding process. These welds are not included in further discussion.
Figure 3.
Defects of the welds: (a) τ = 3 ms; (b) τ = 9 ms; (c) f = 40 Hz; (d) f = 100 Hz.
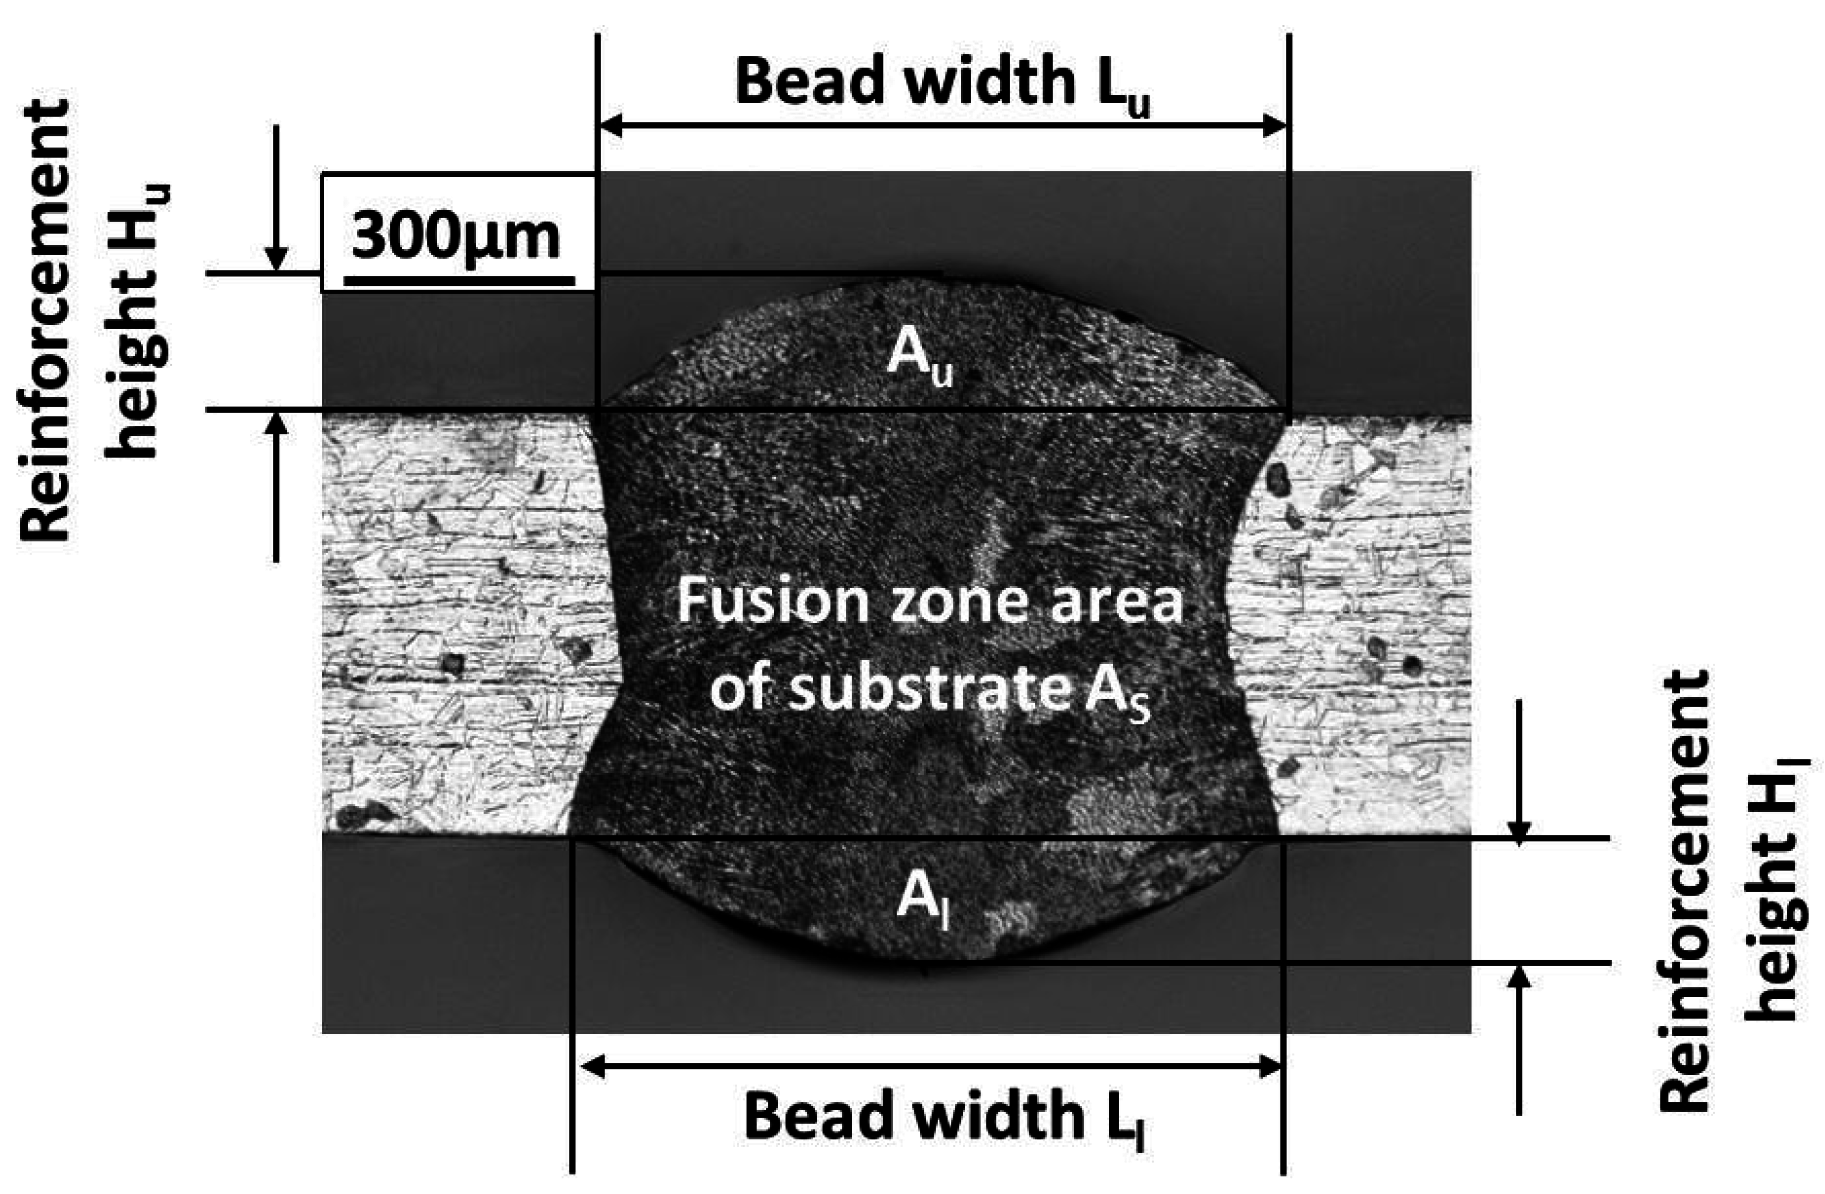
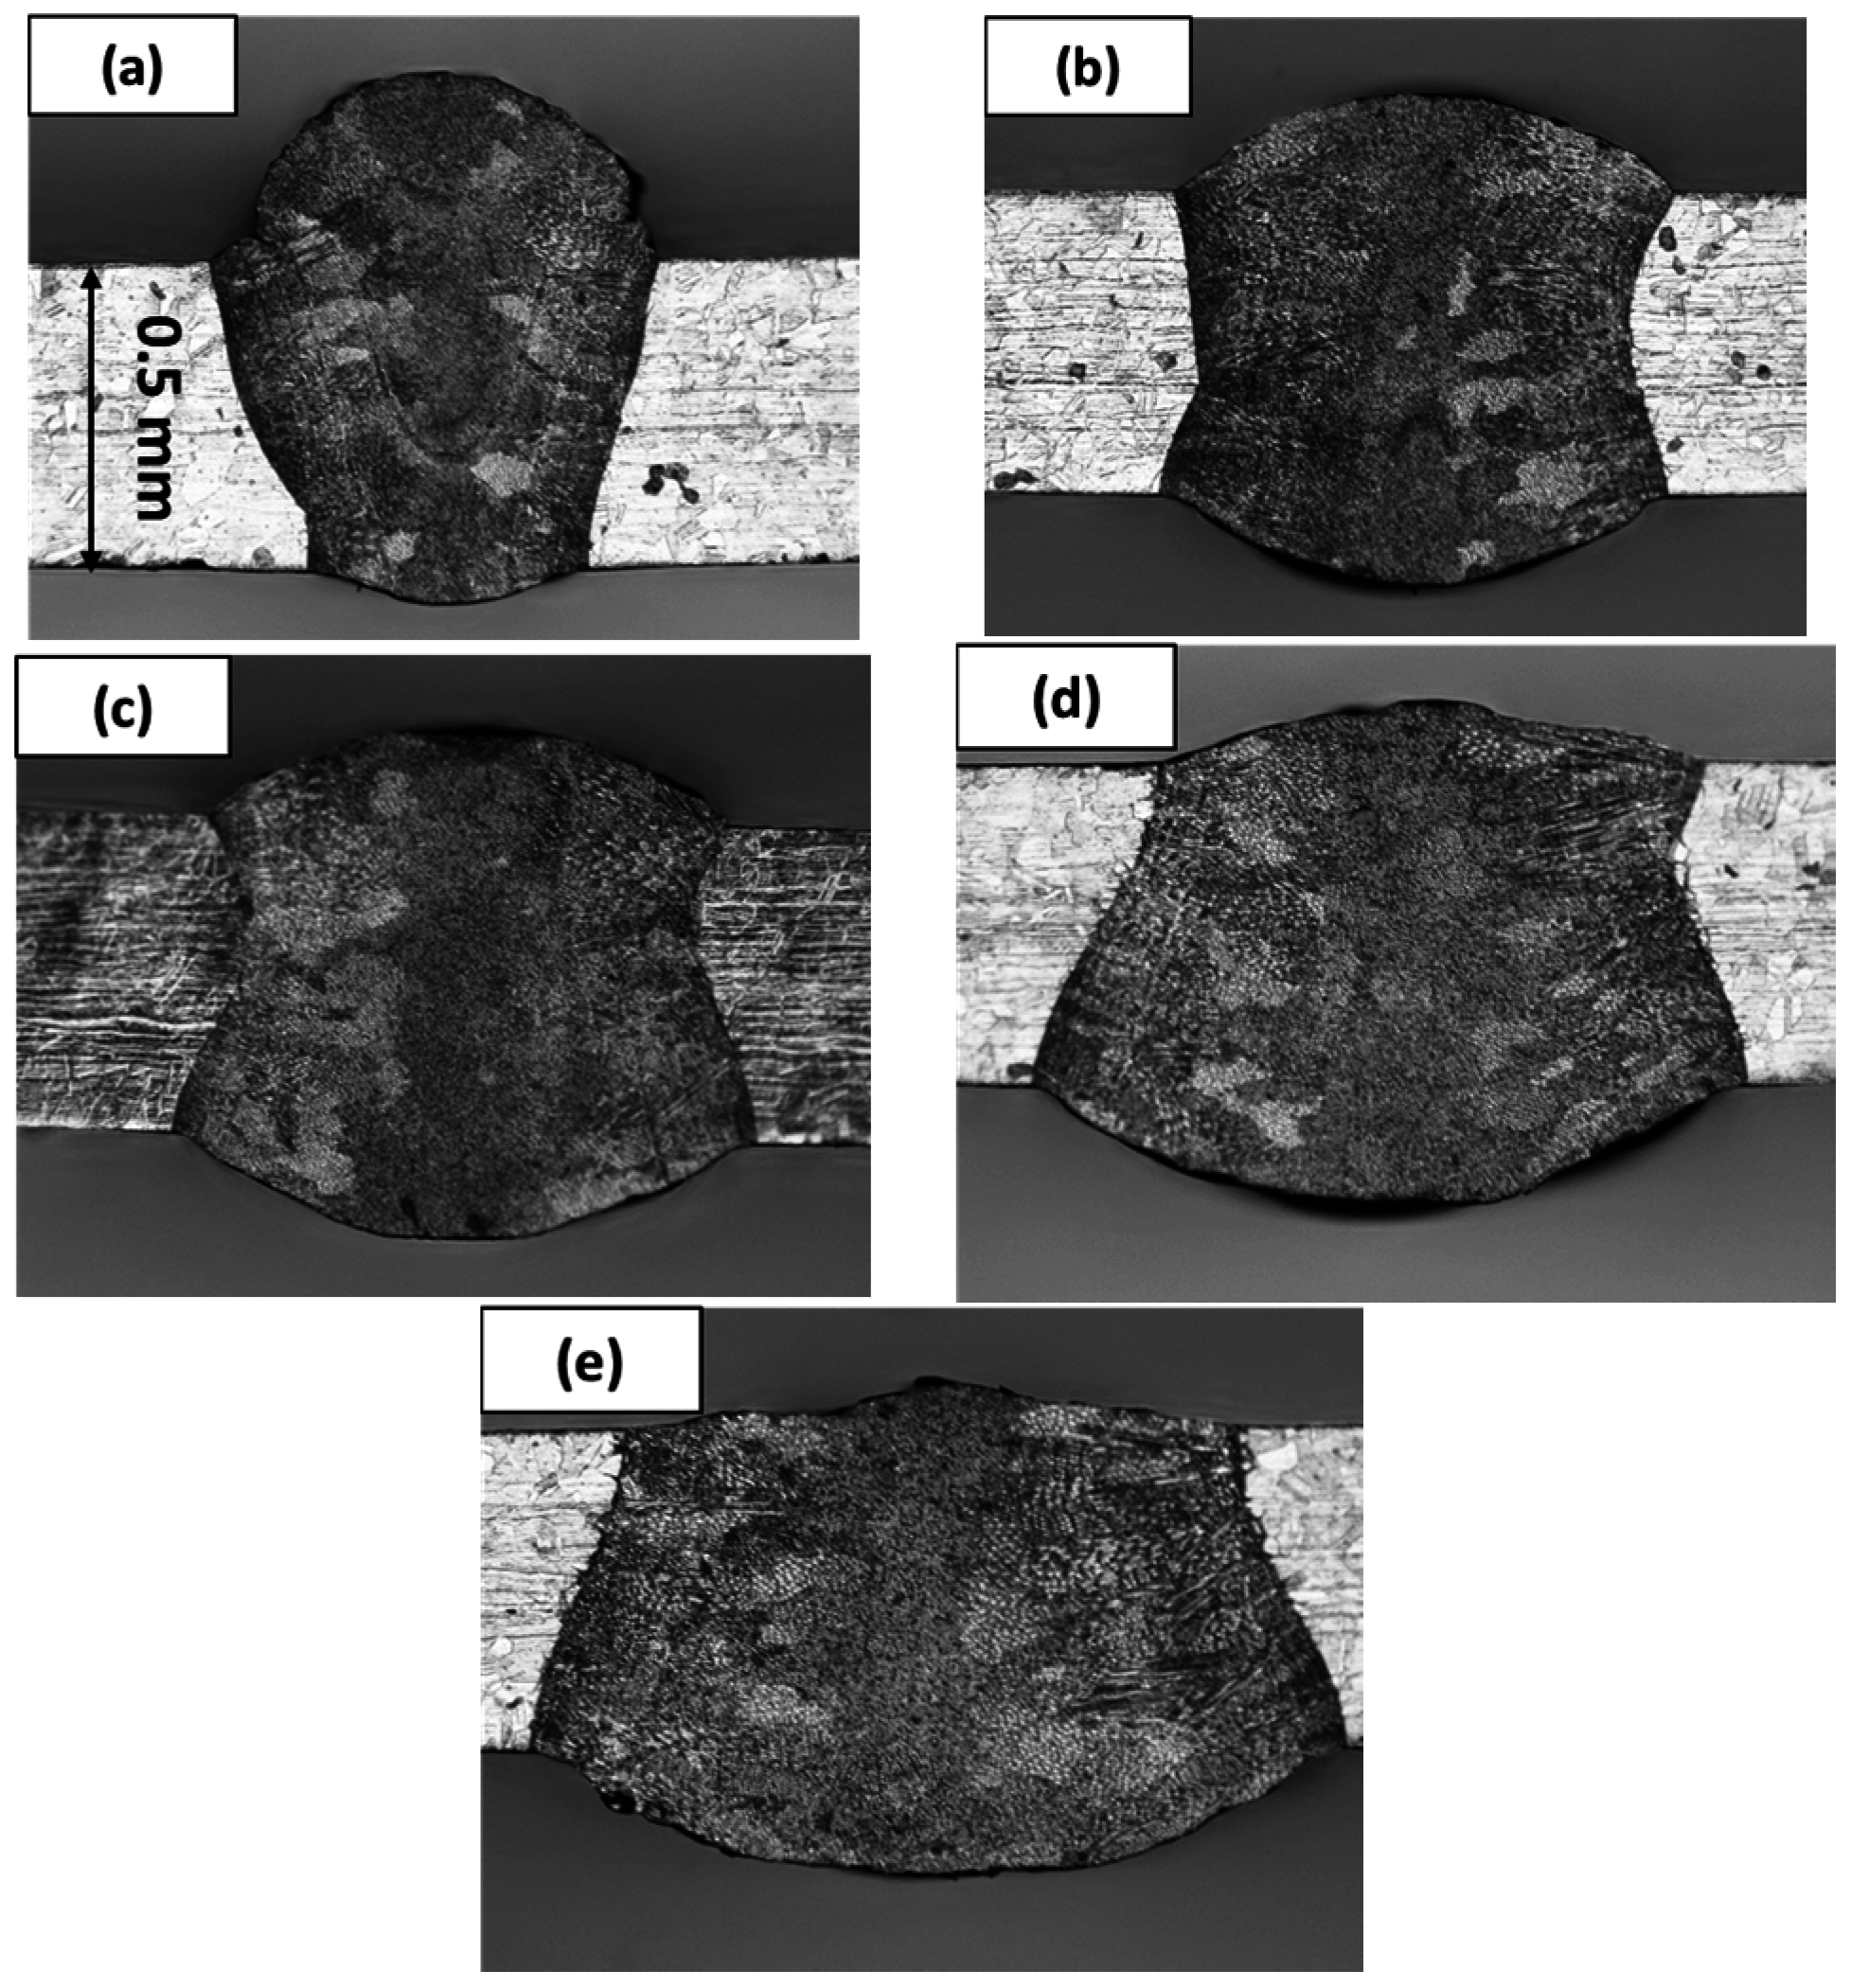
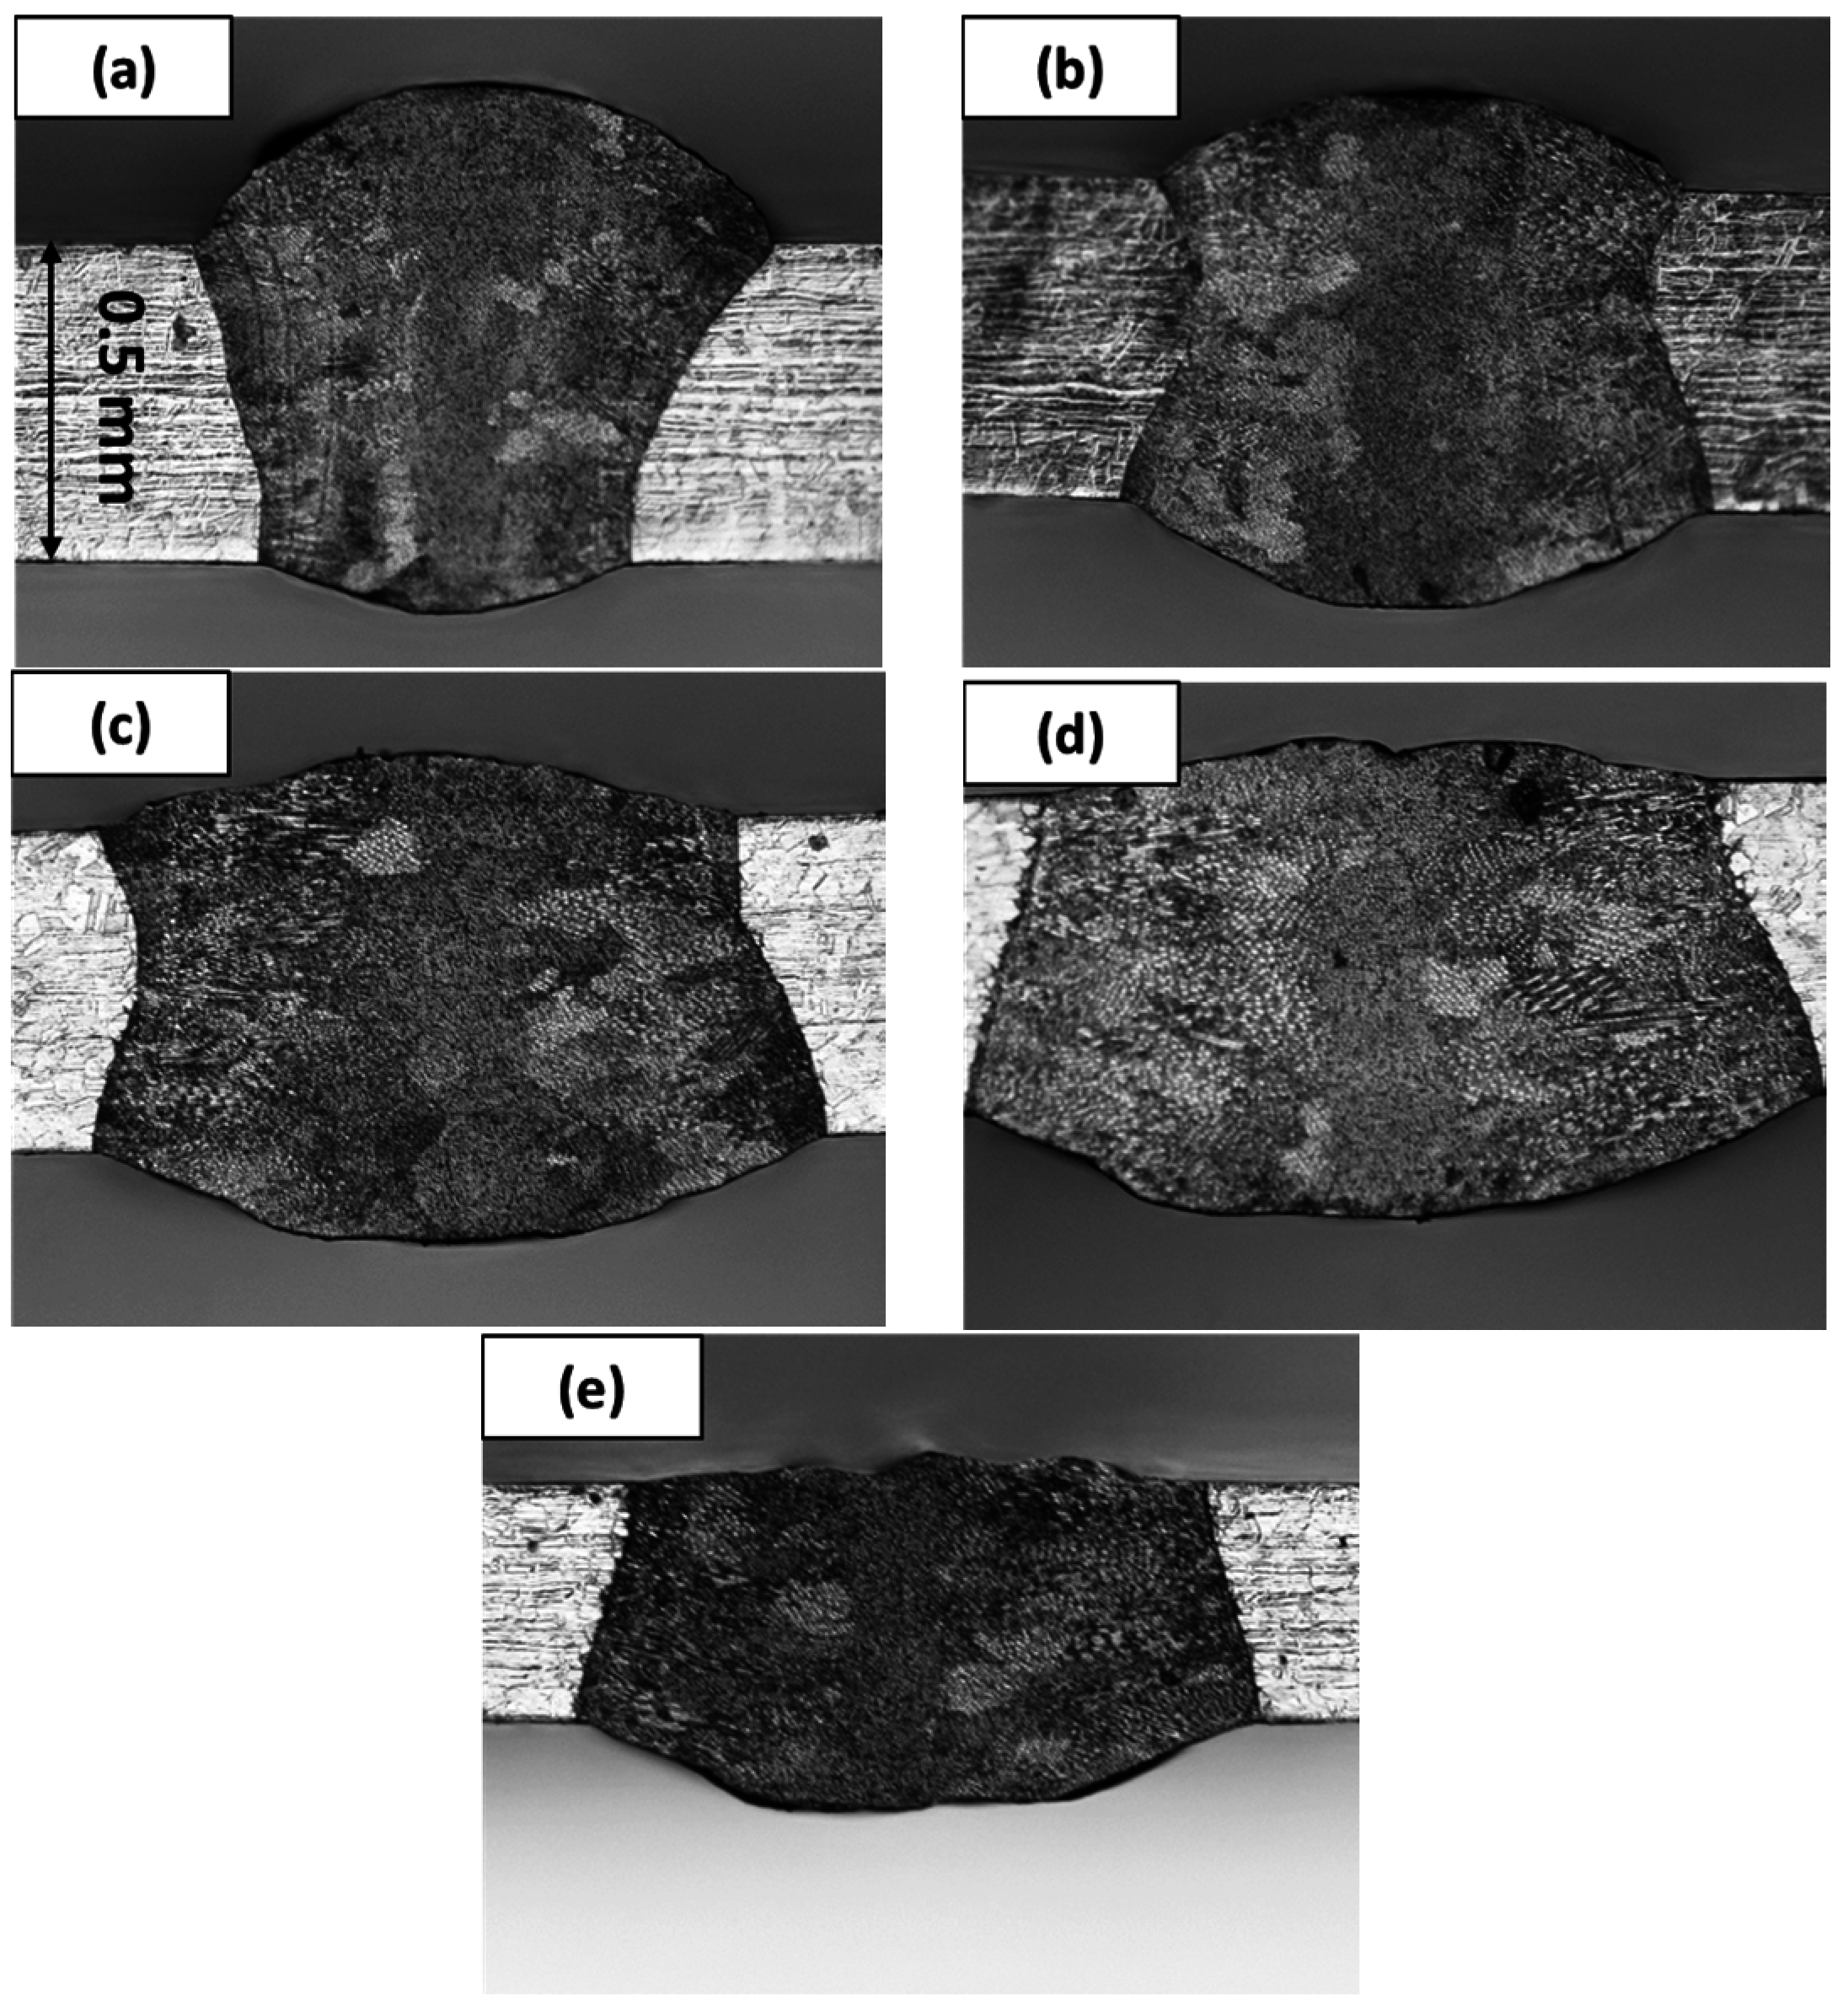
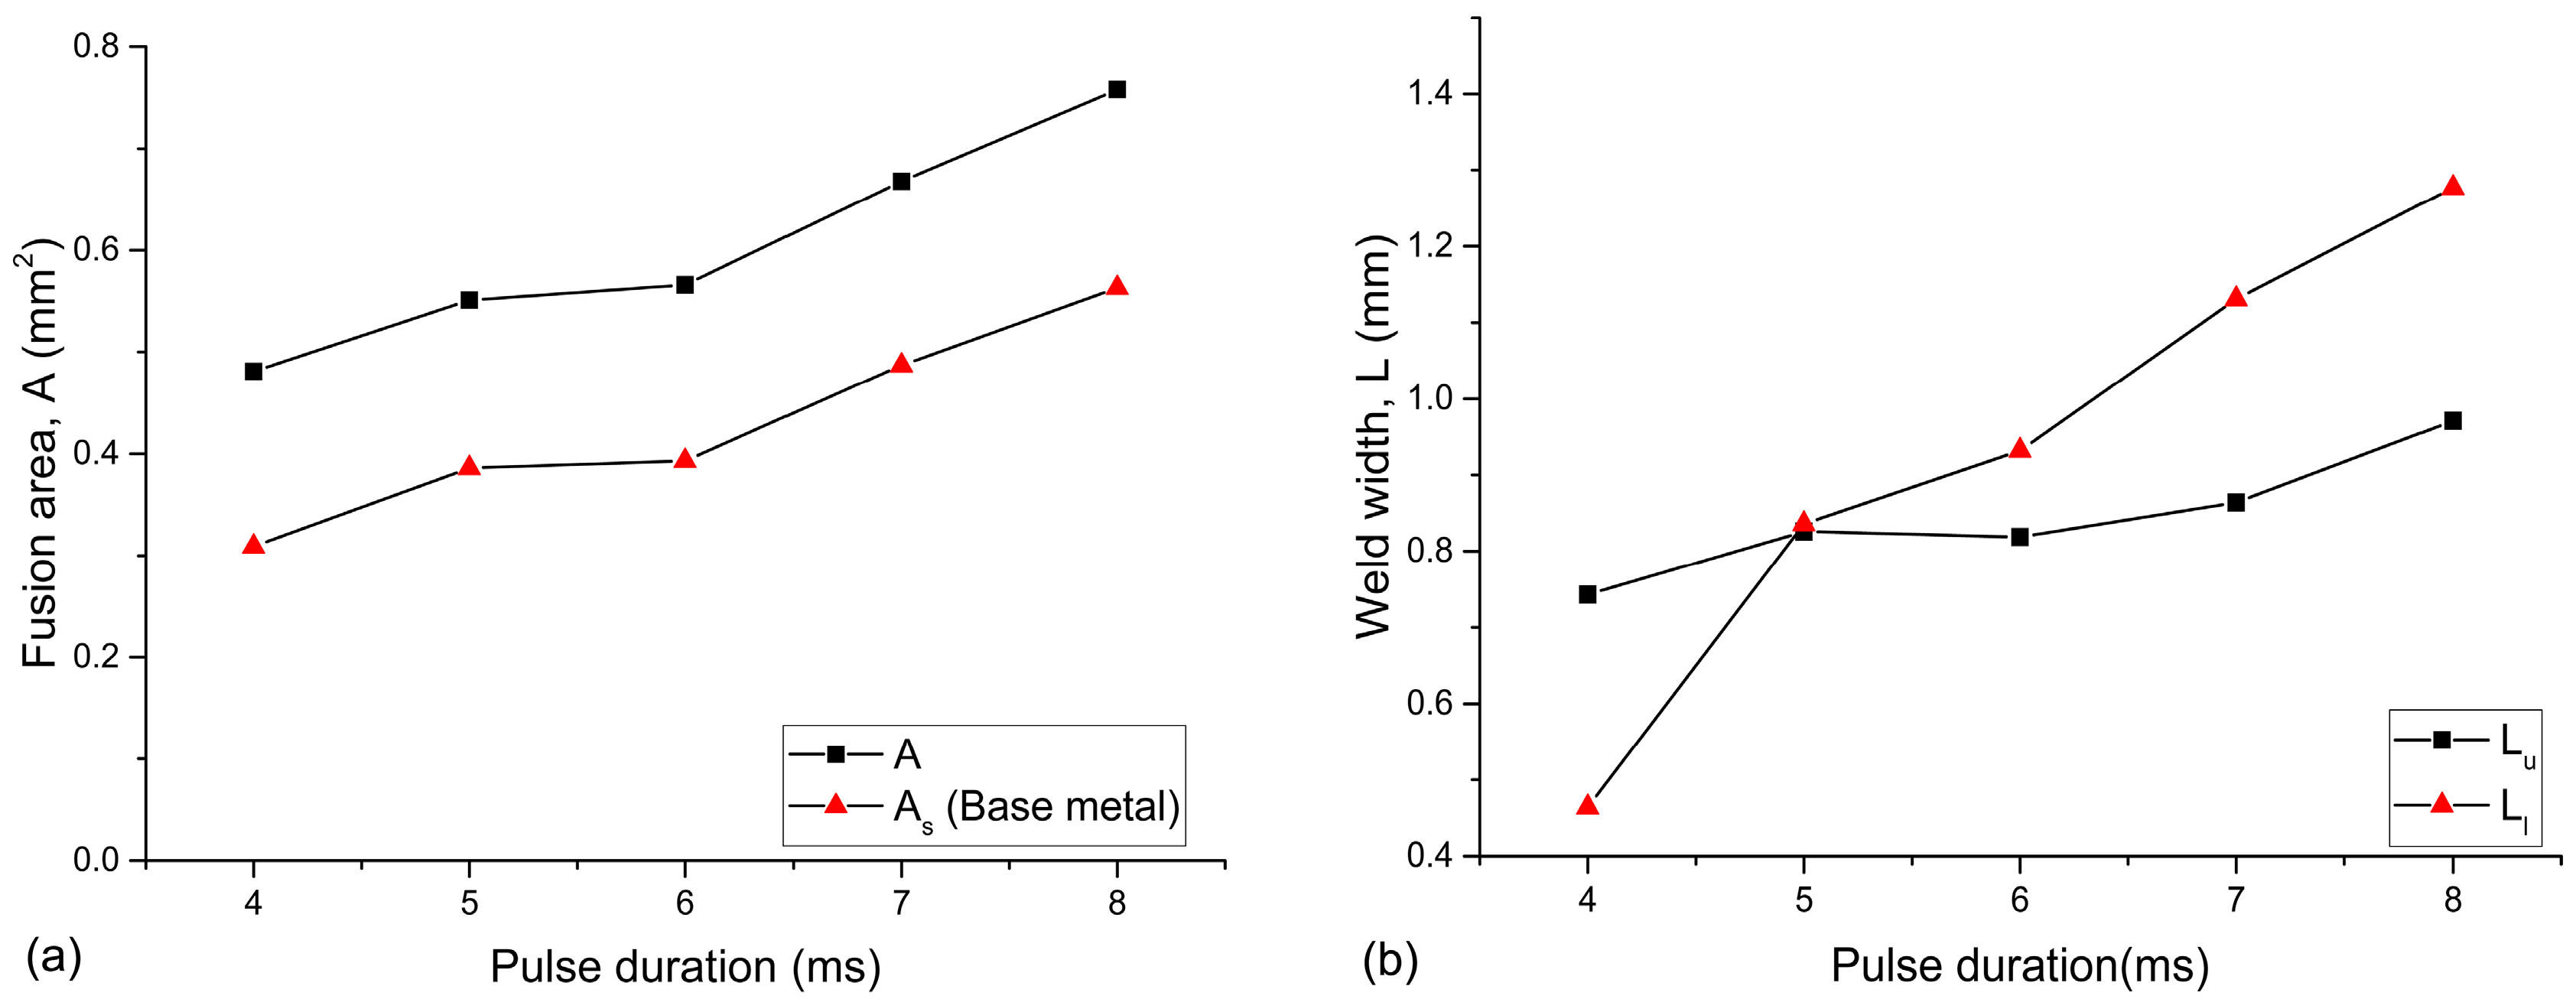
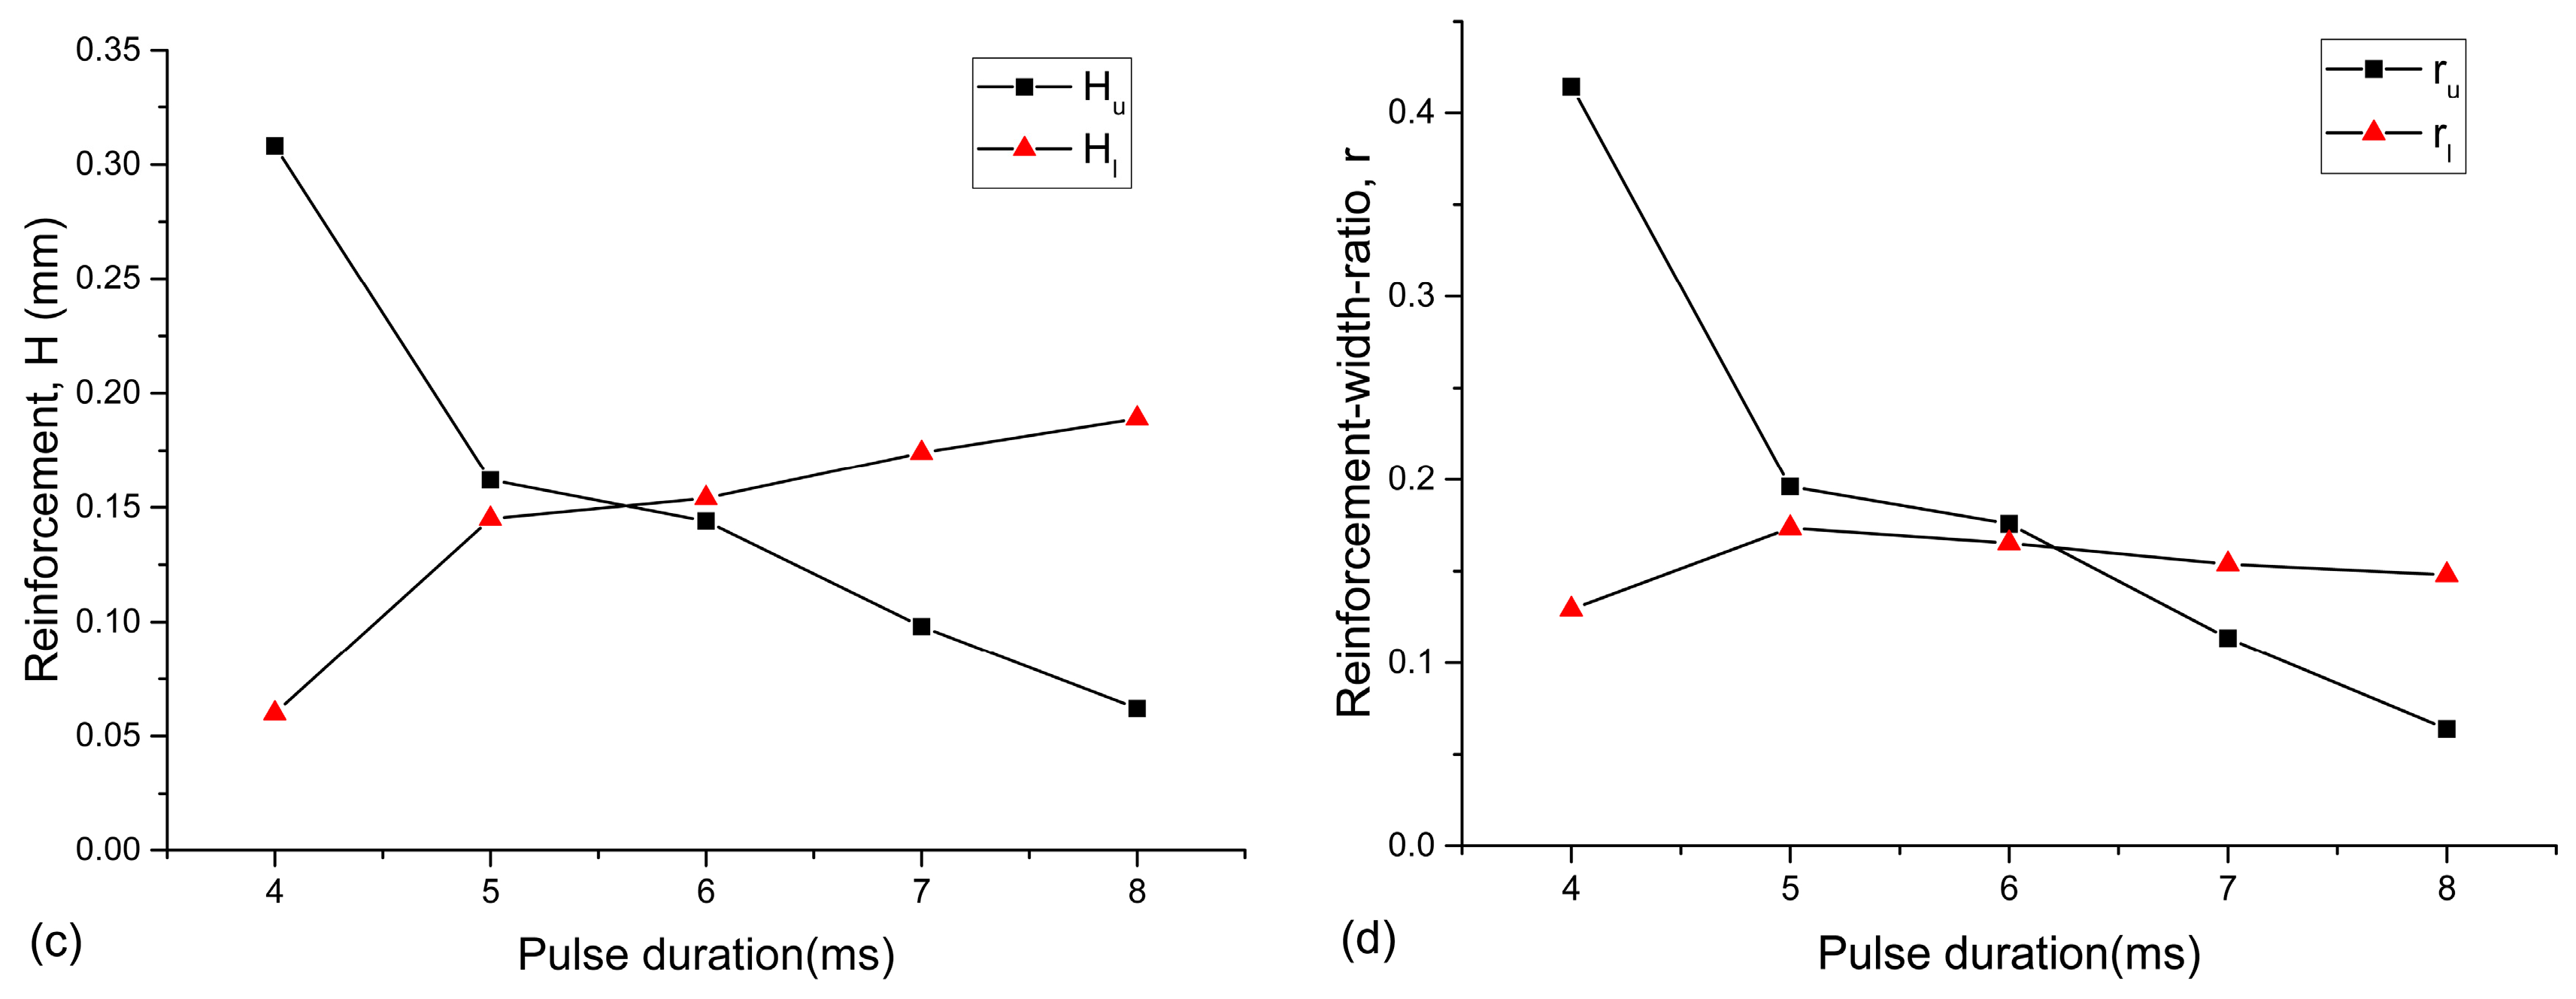
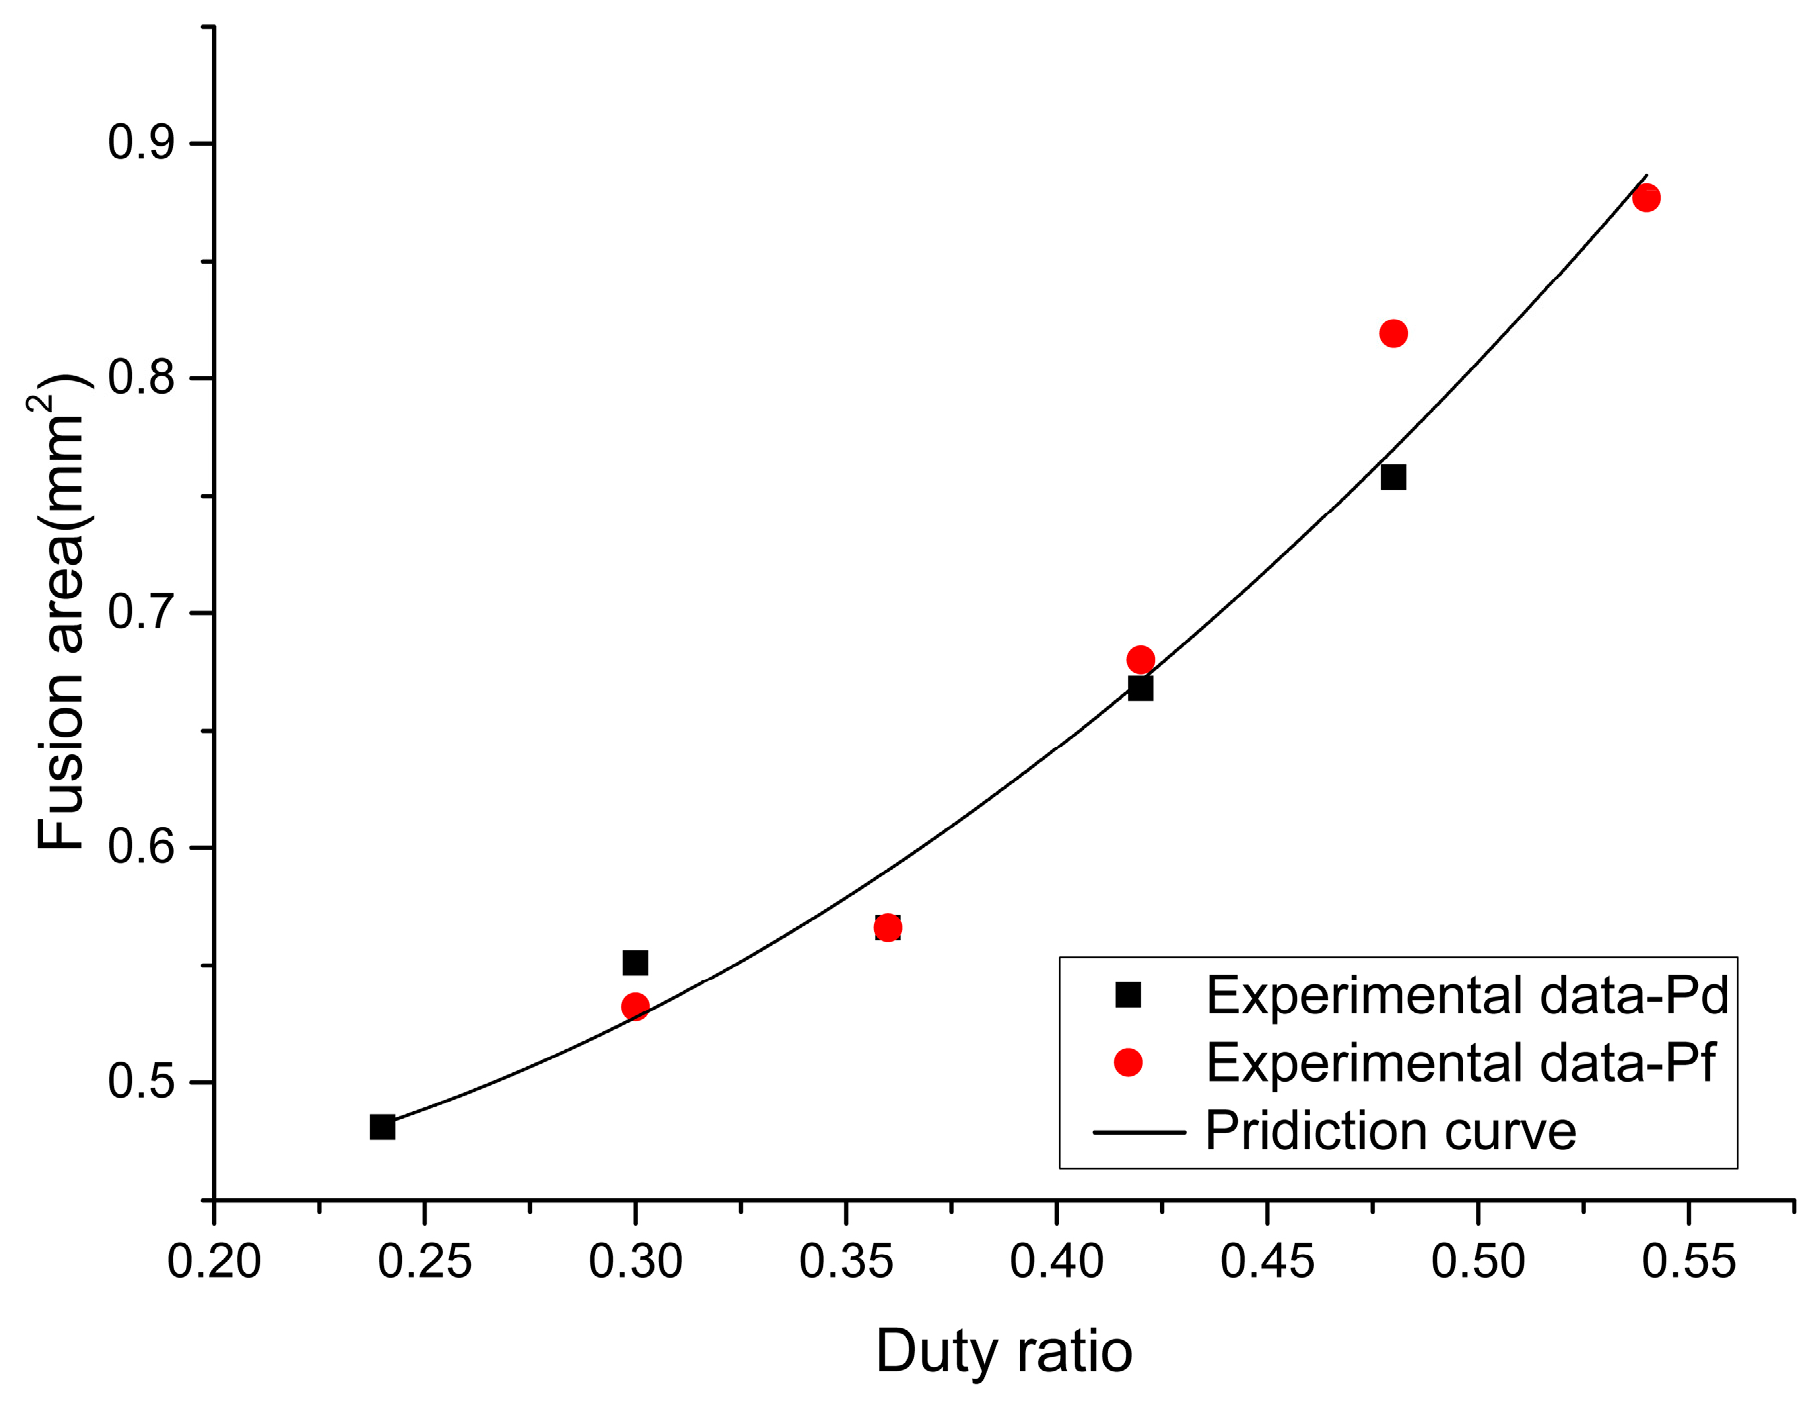
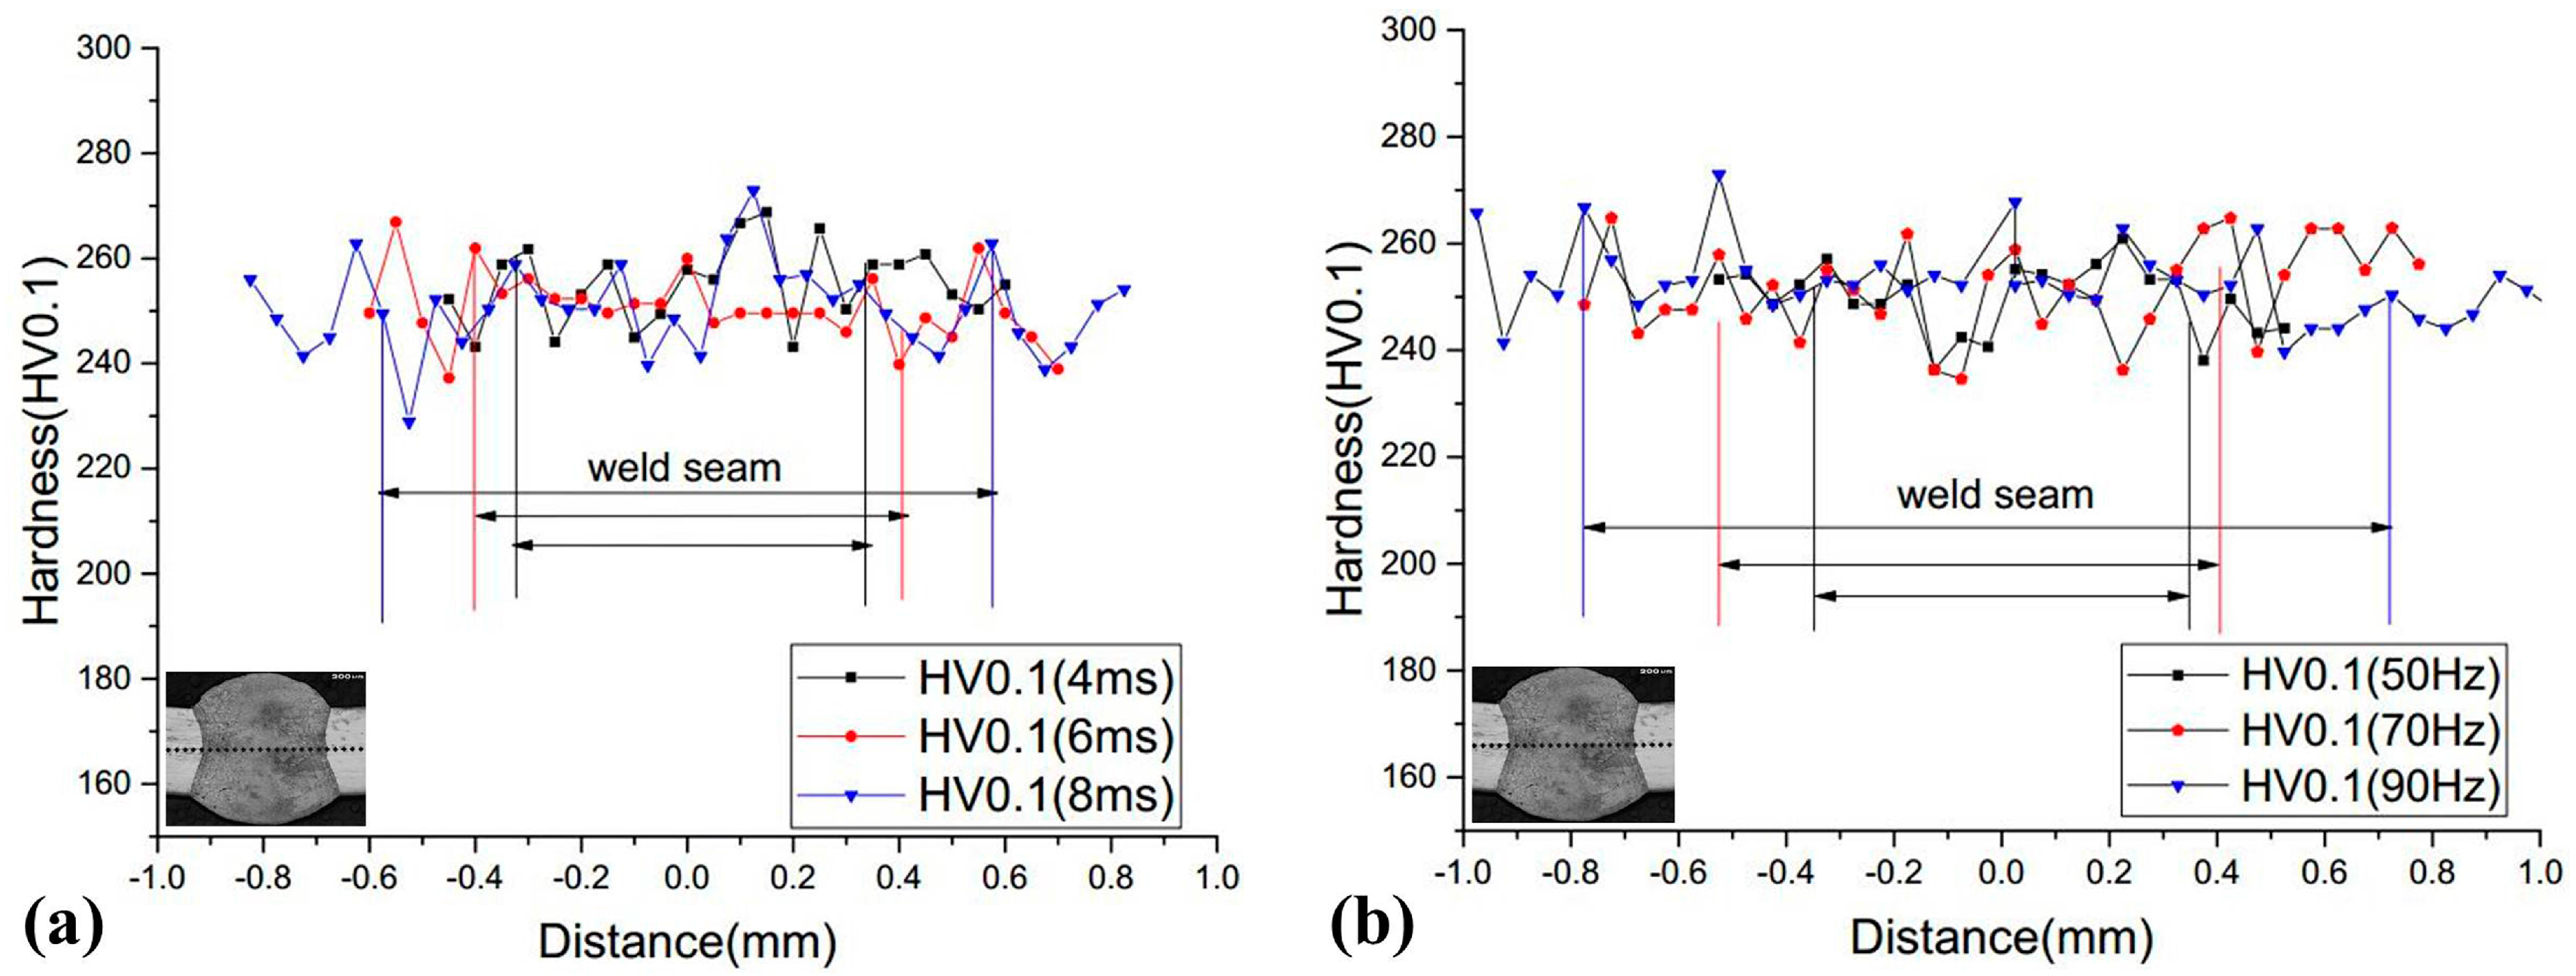
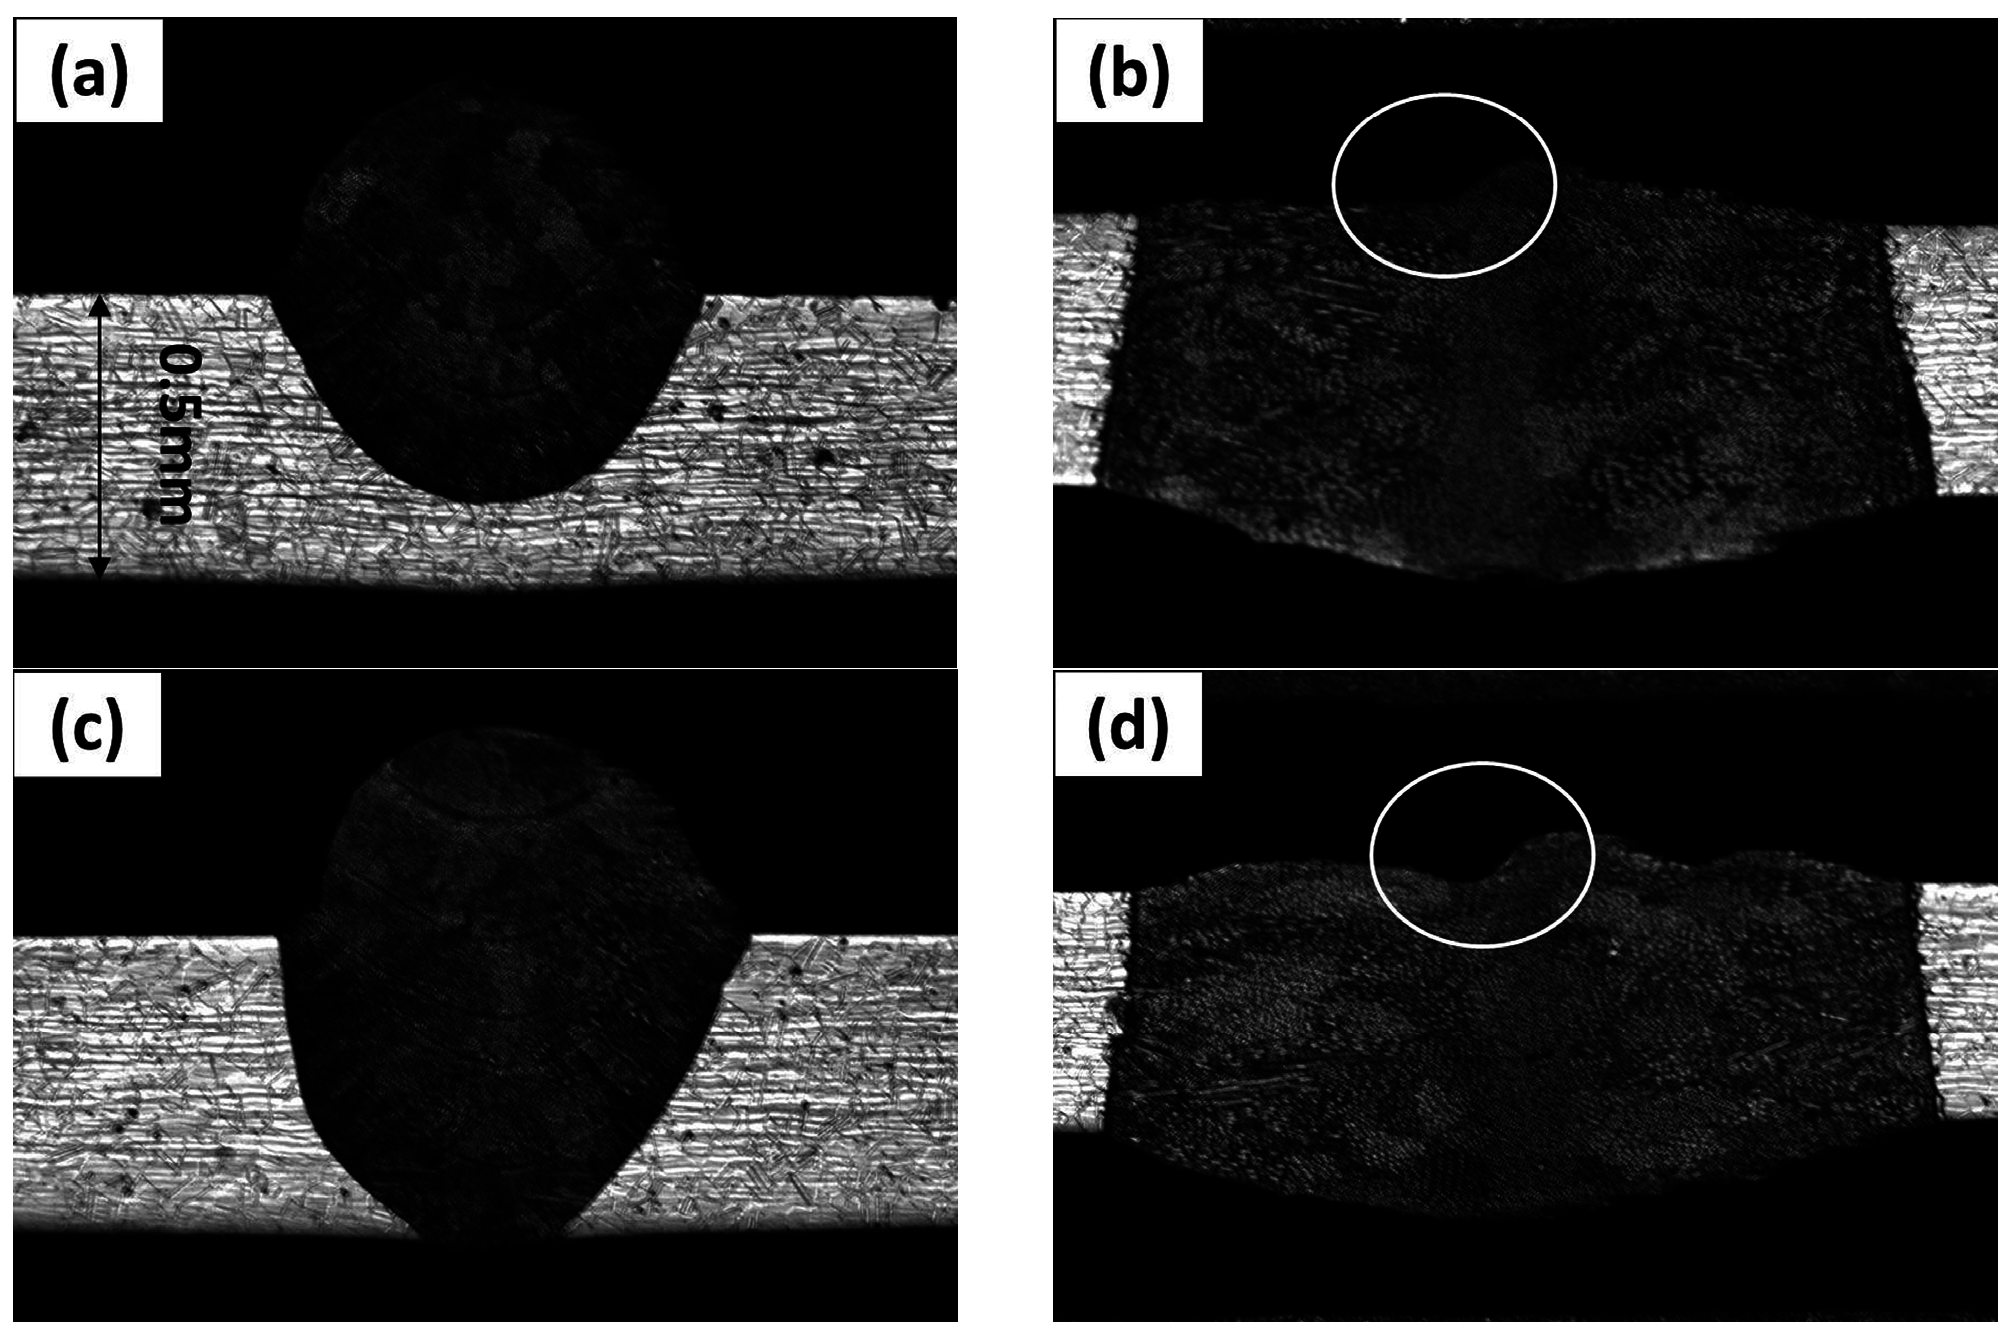
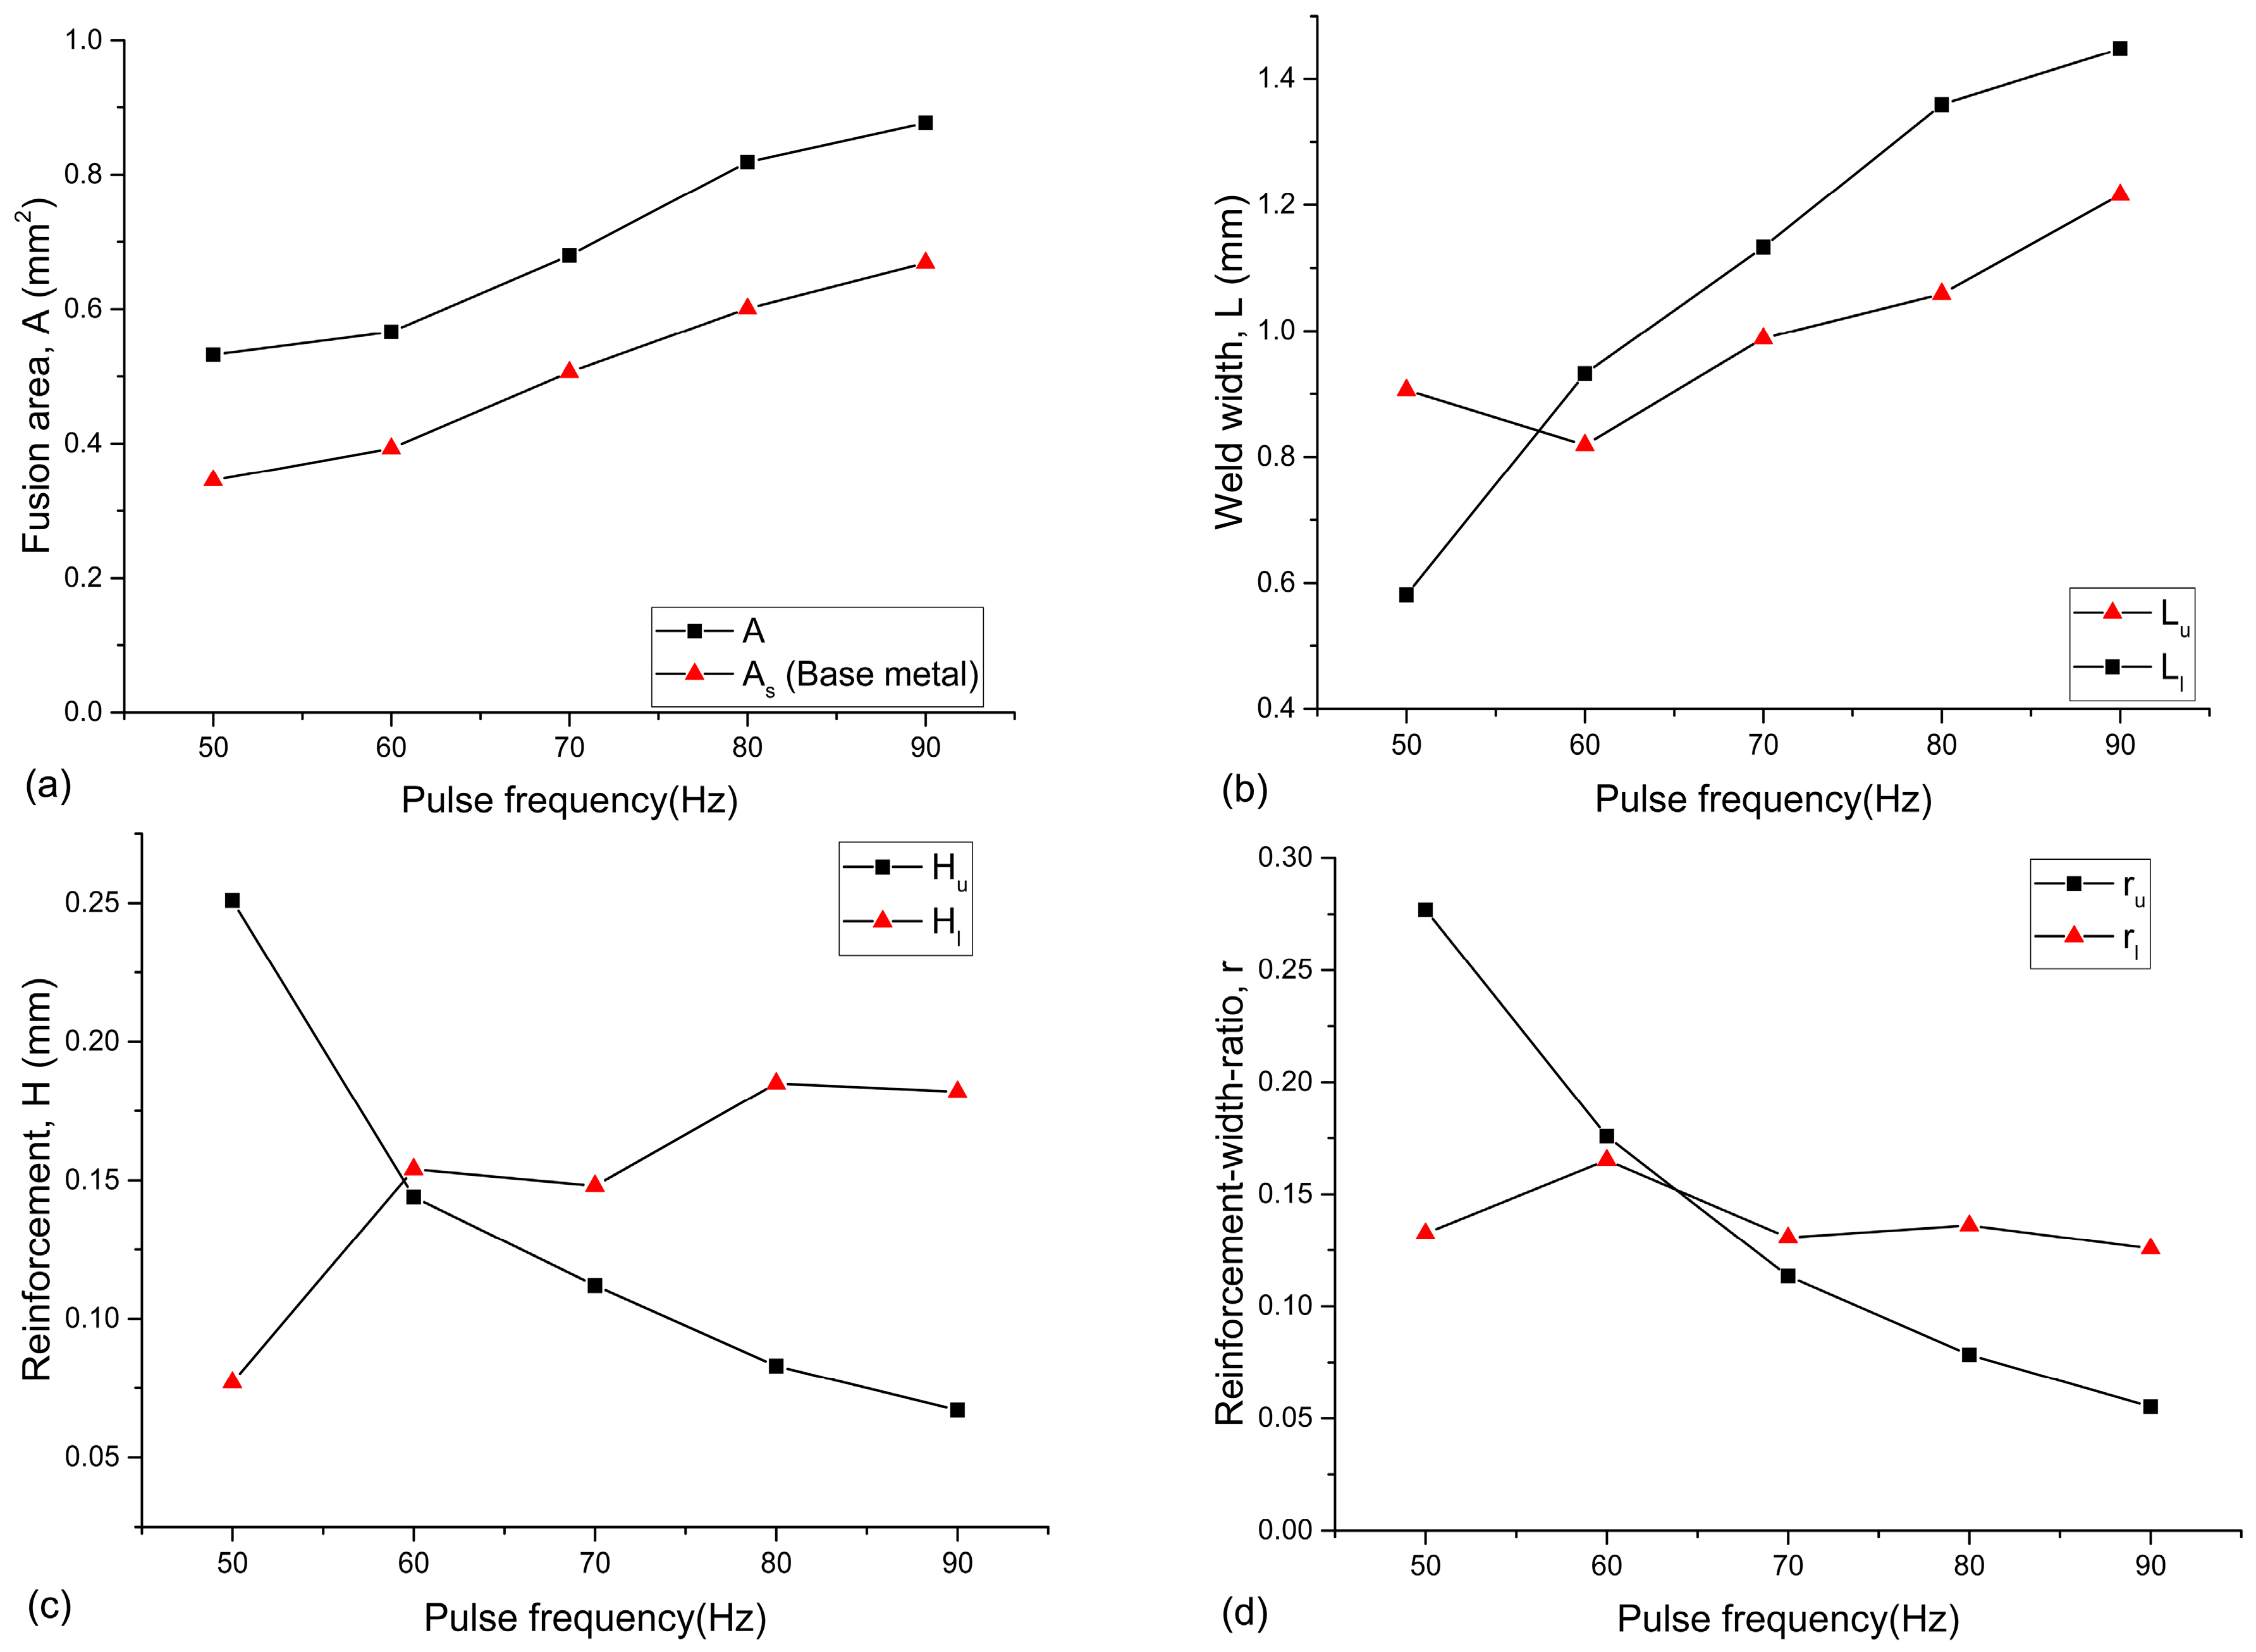
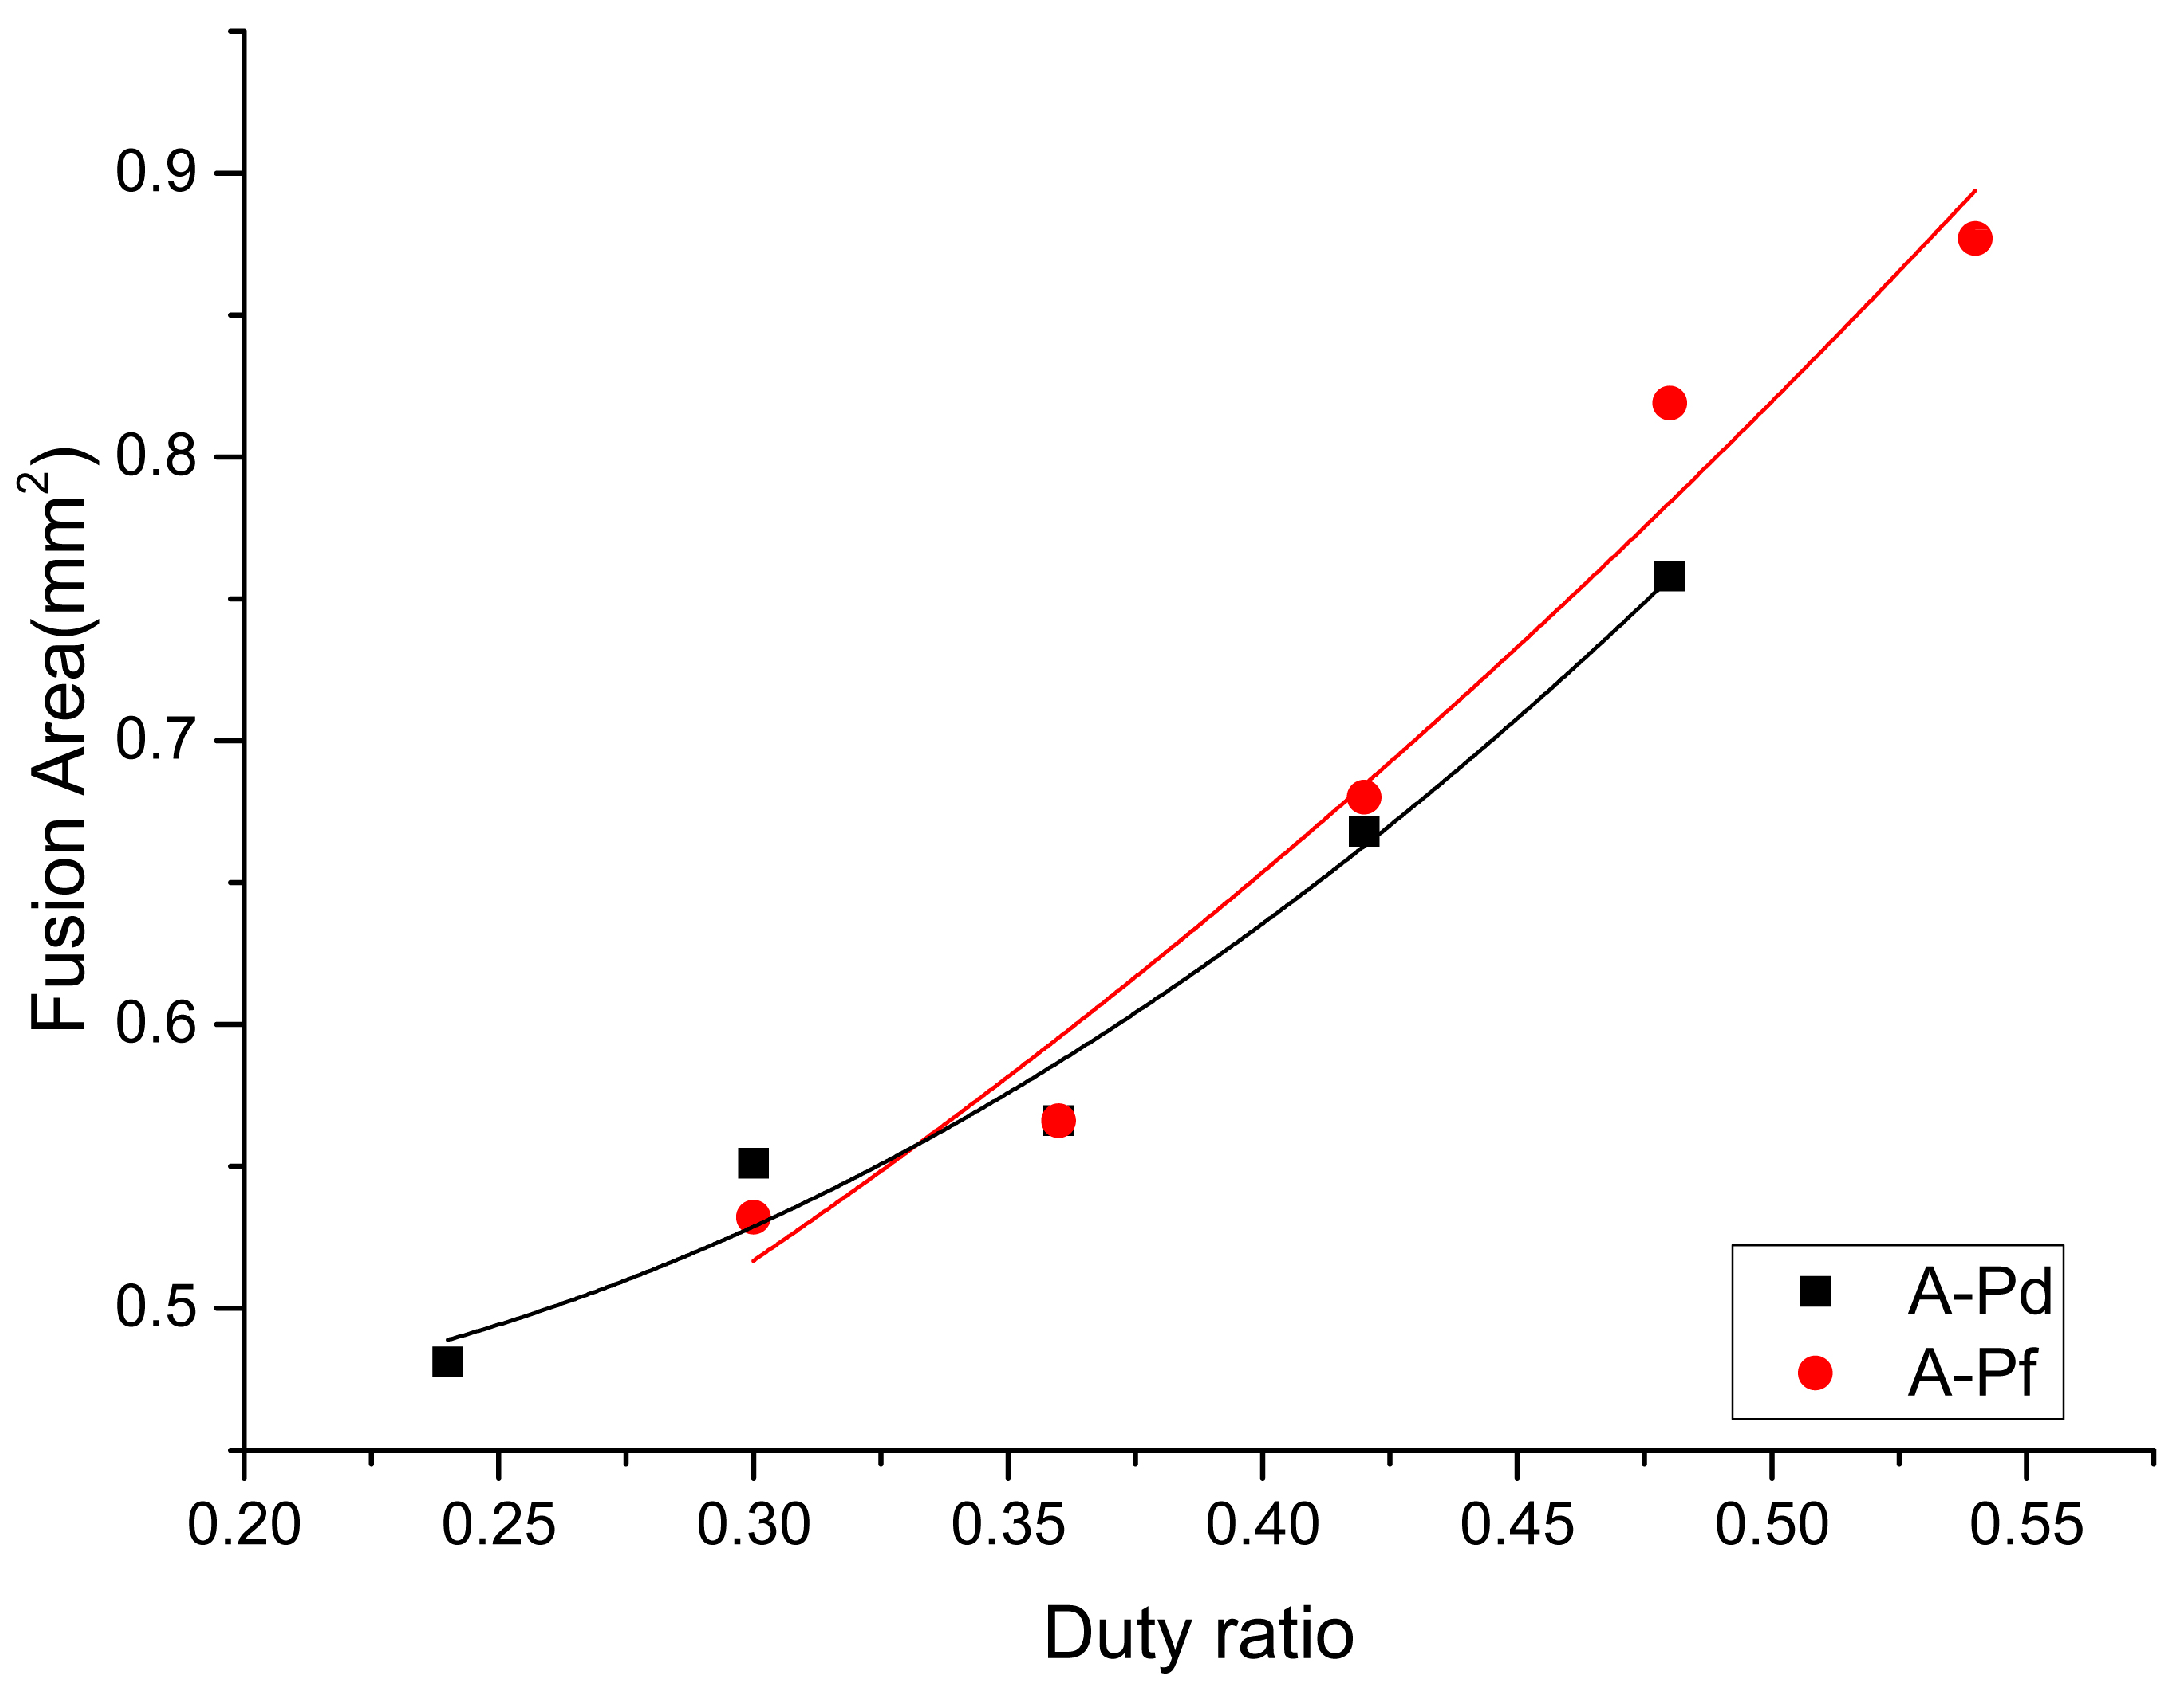
3.1. Weld Bead Geometry
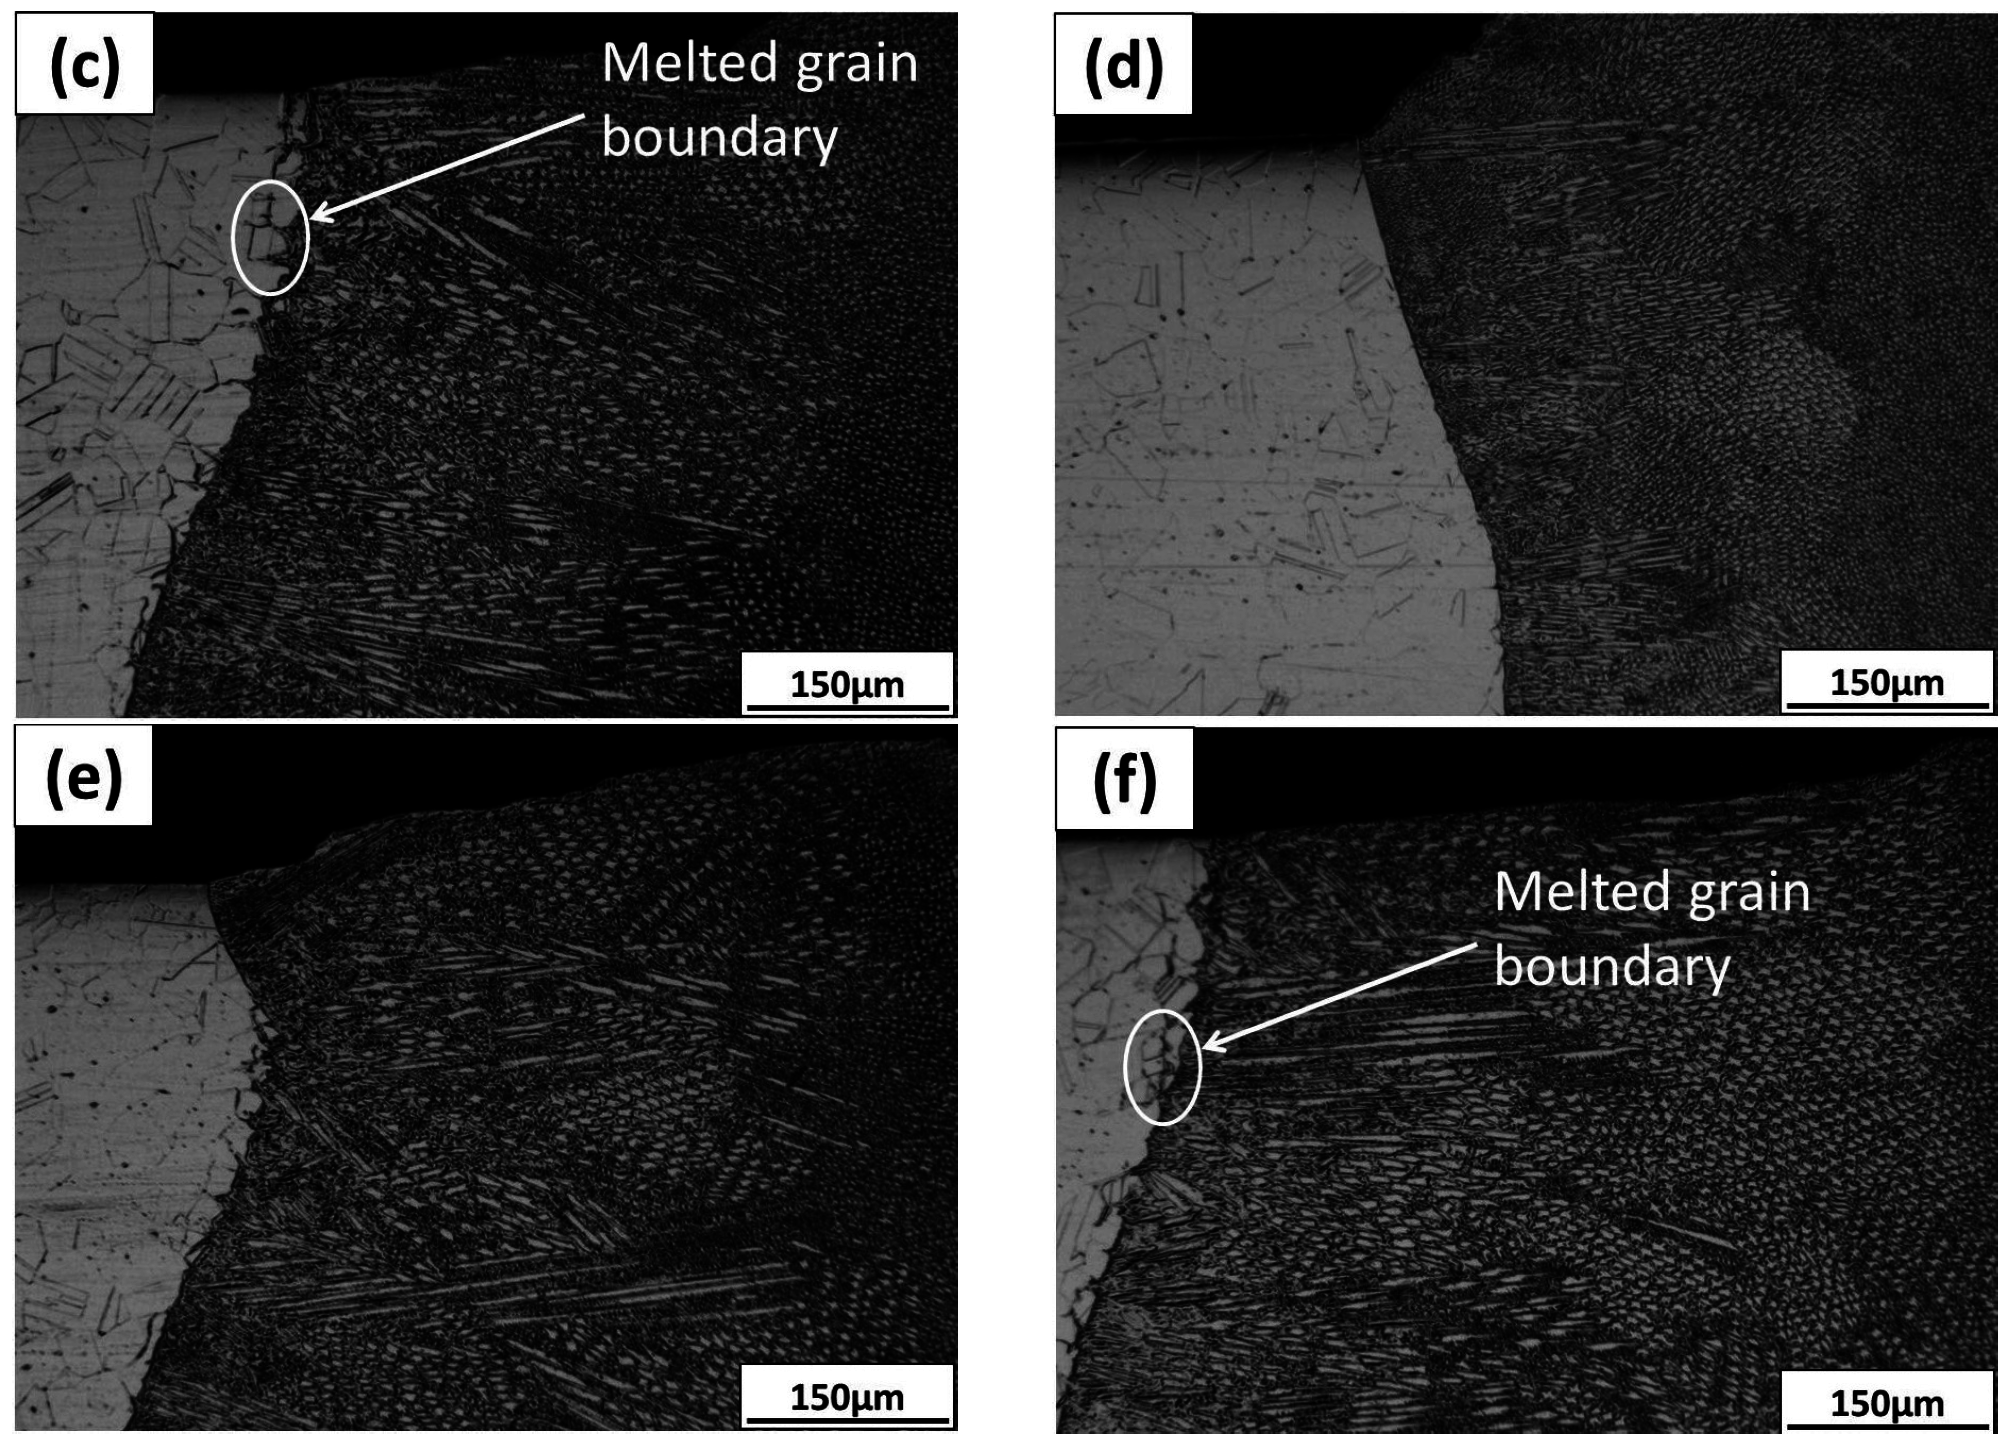
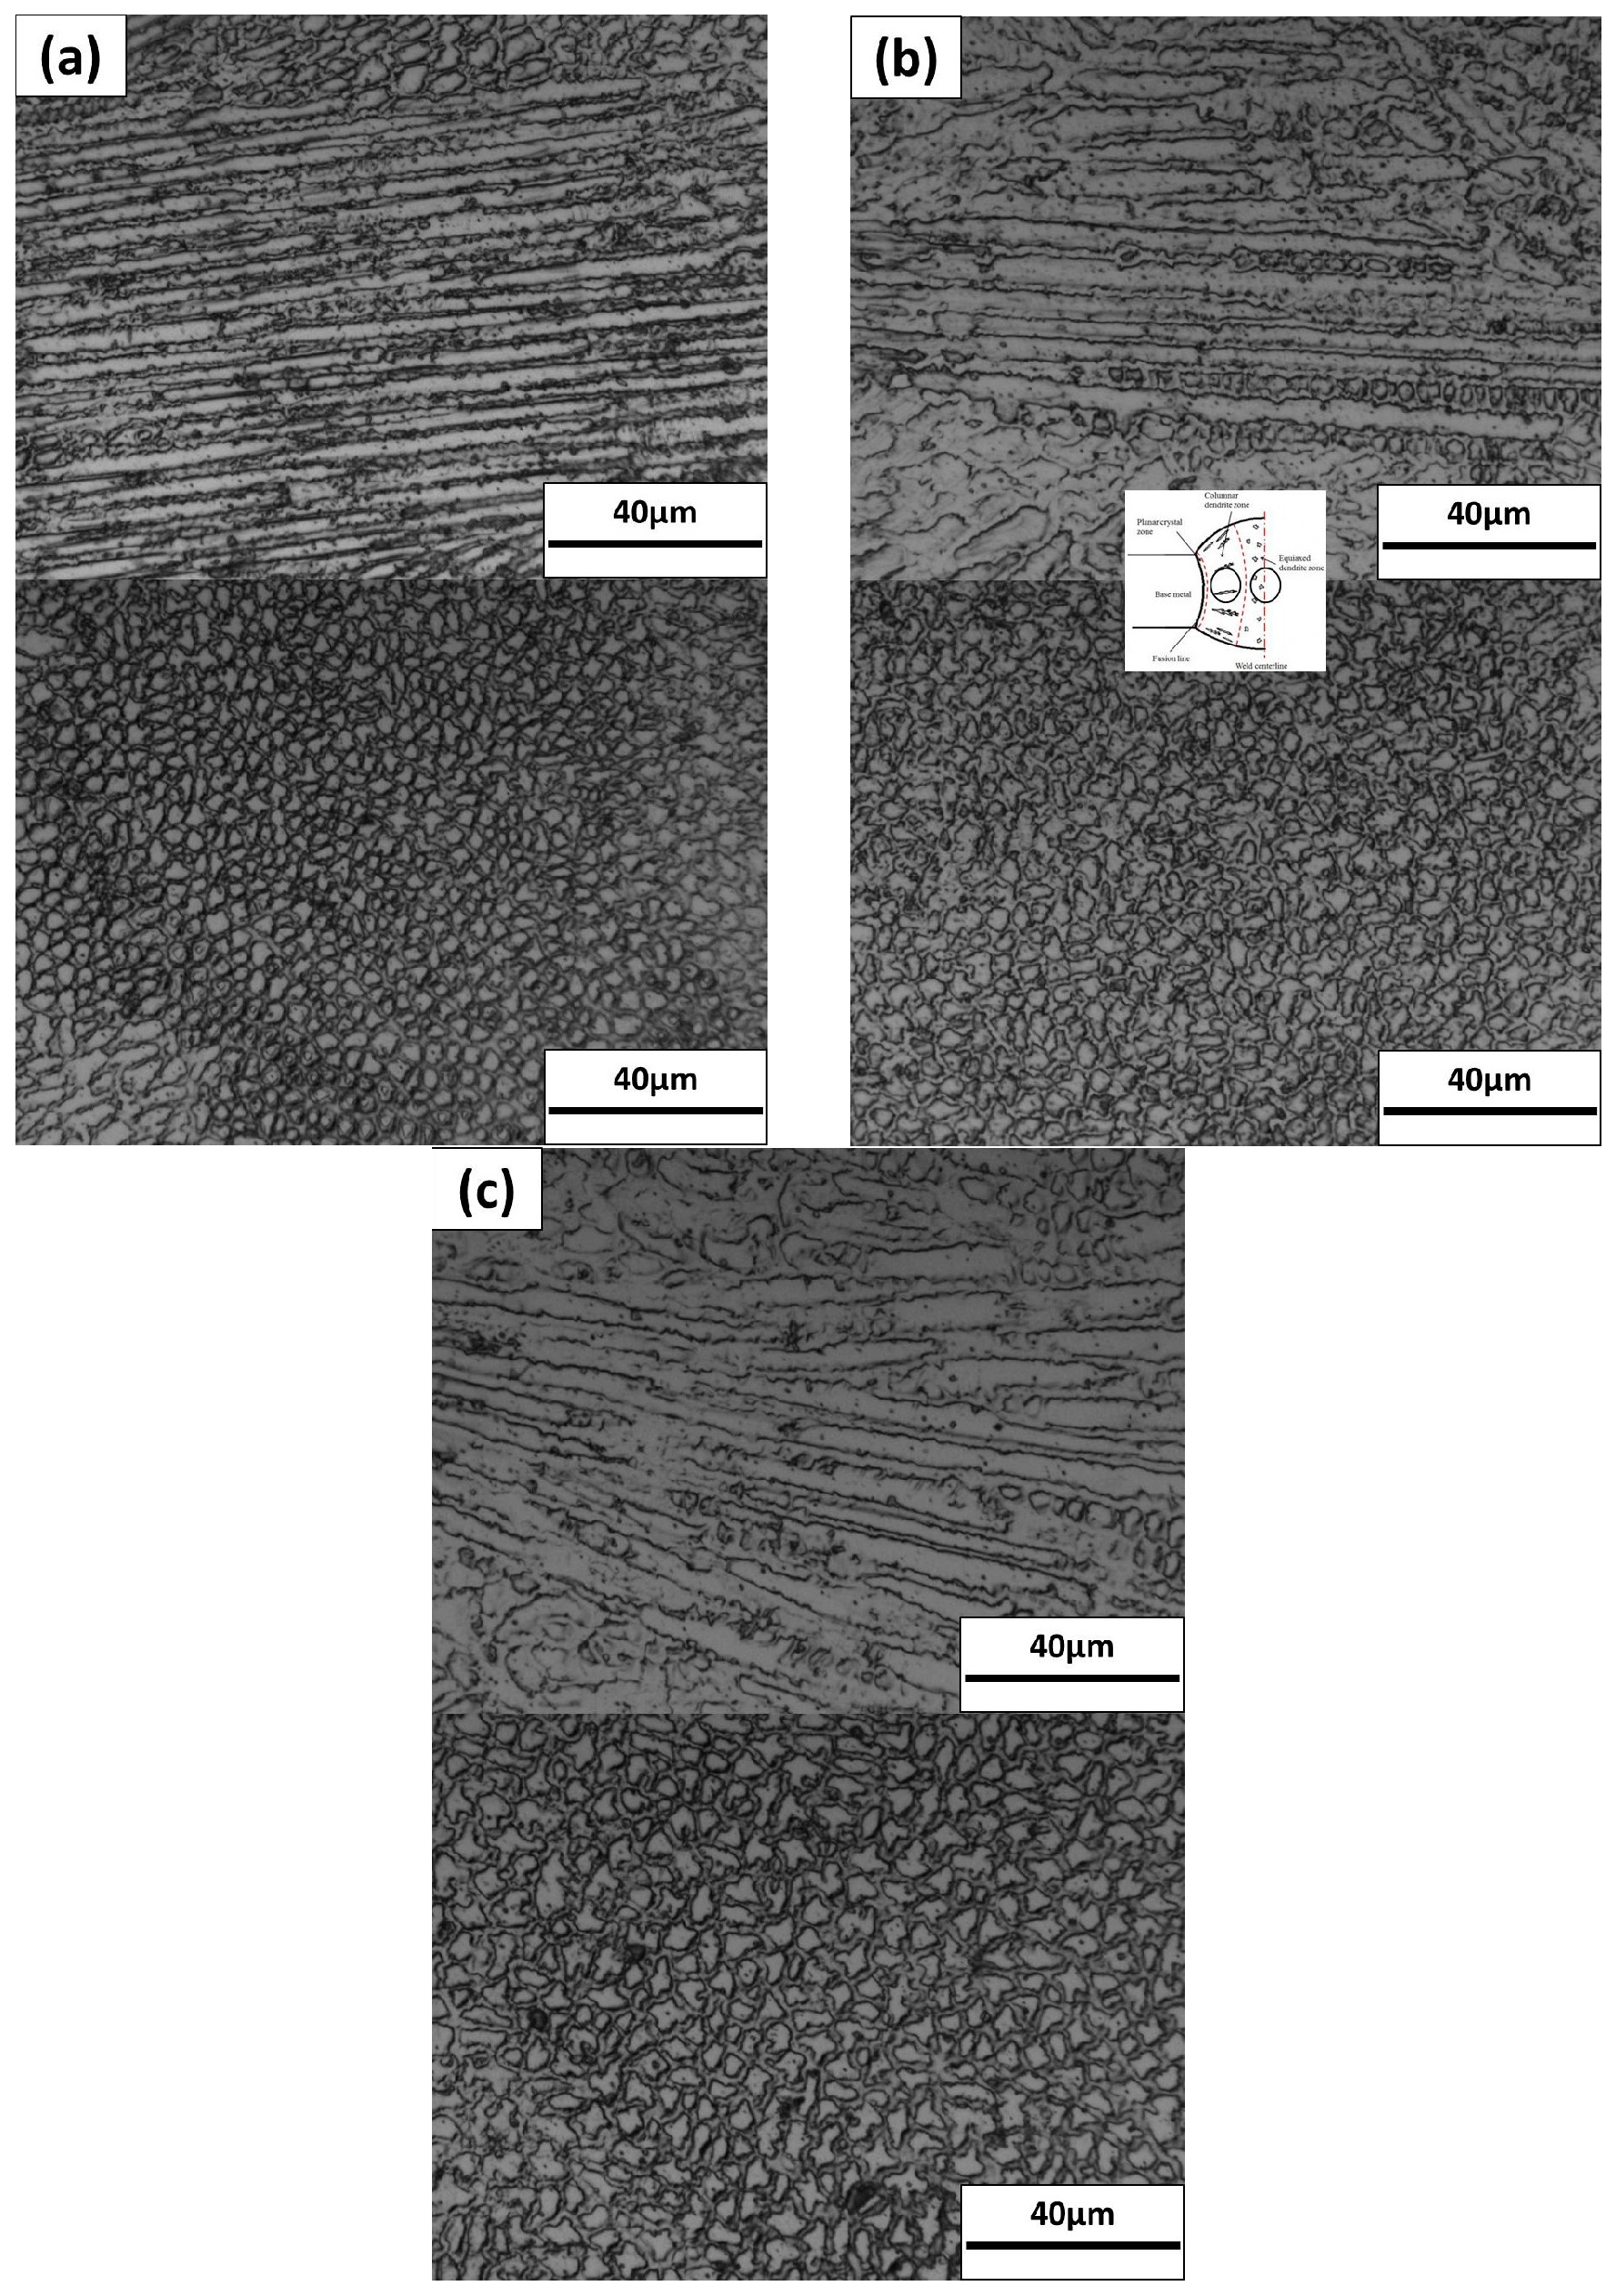
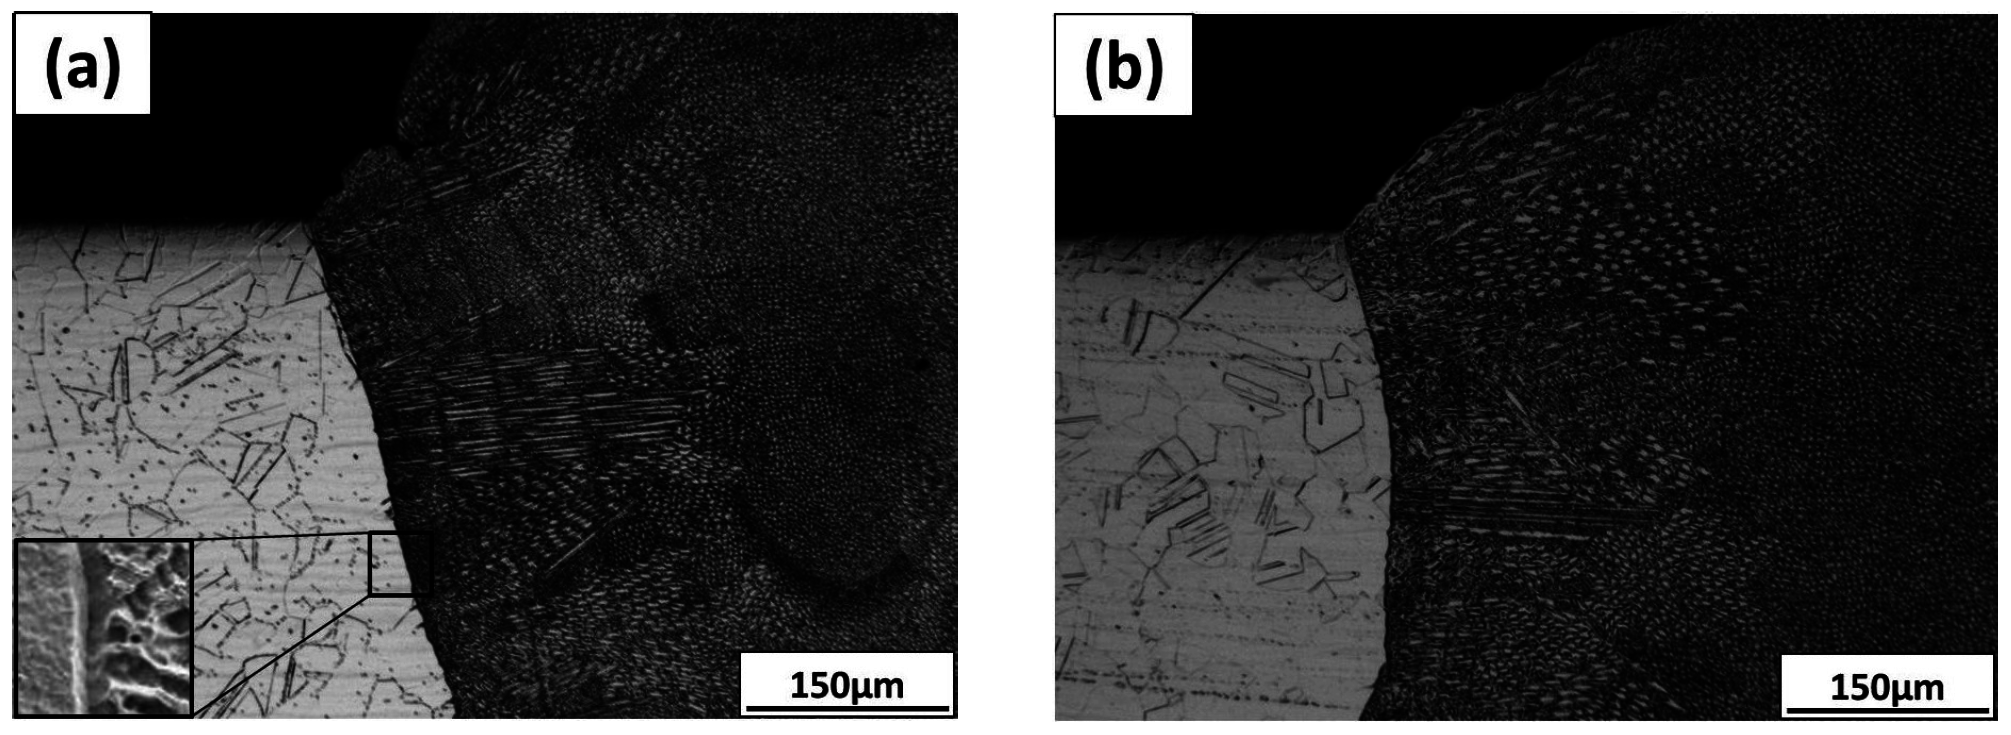
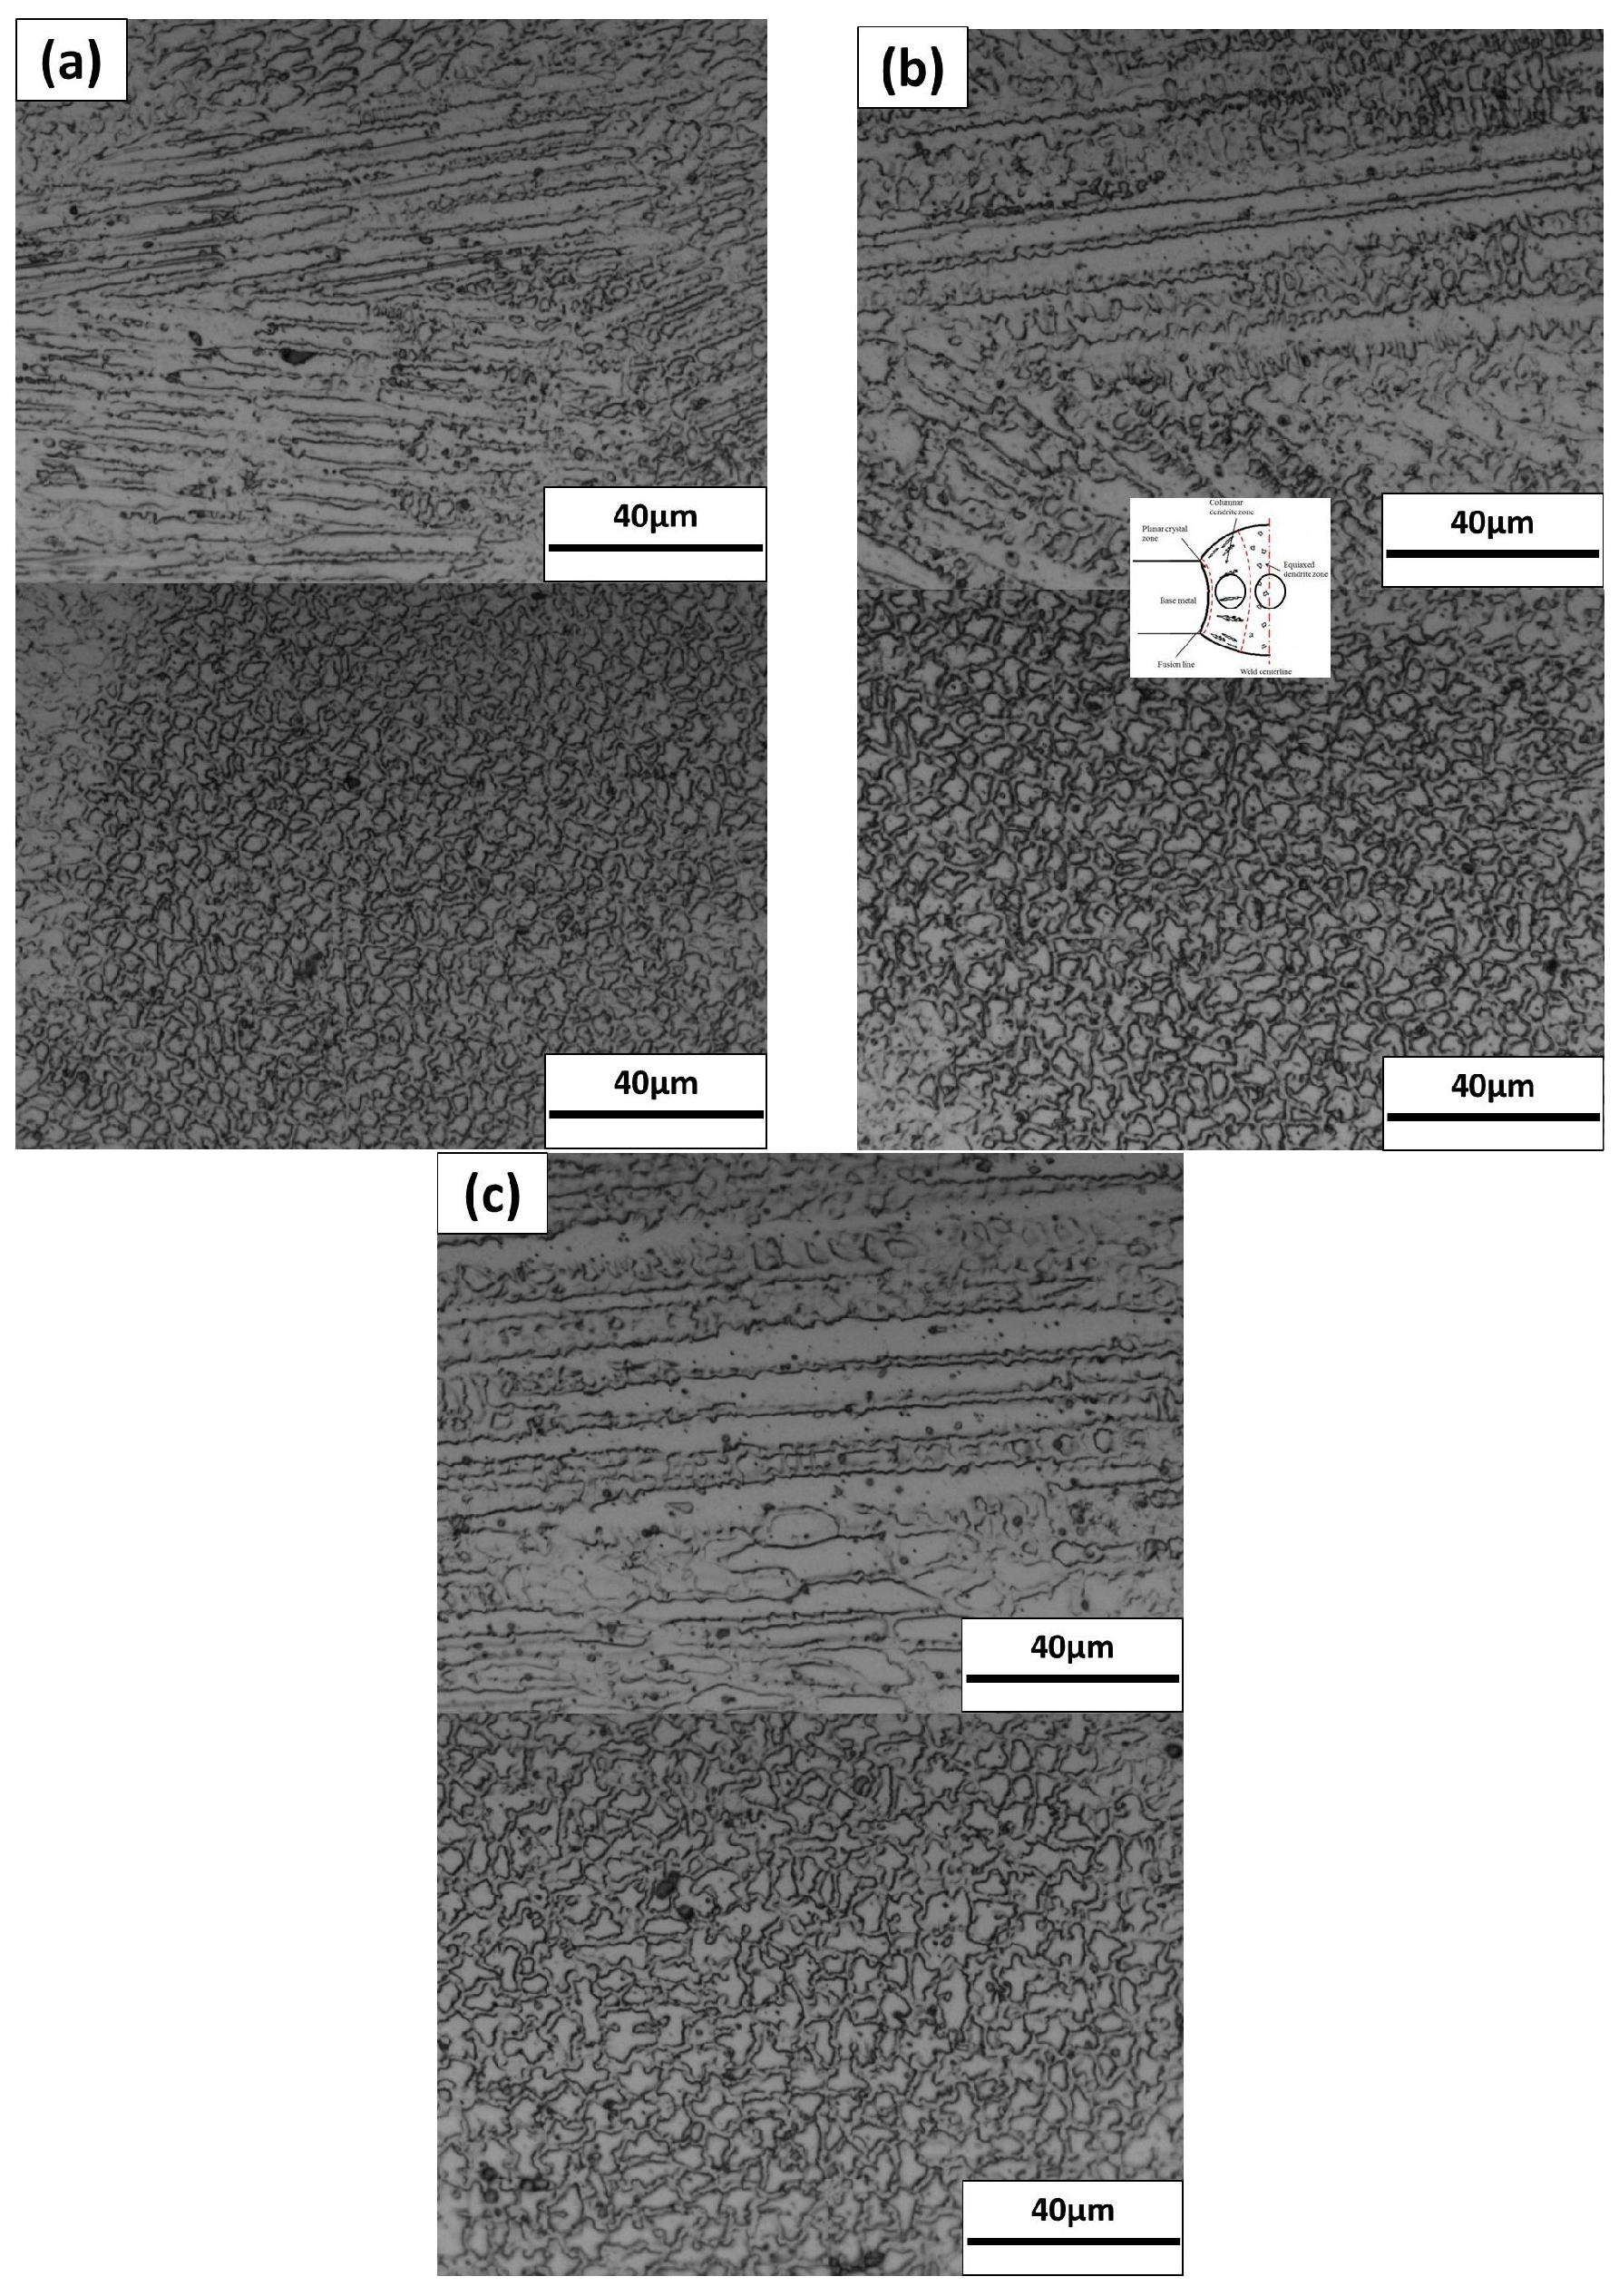
Figure 4 shows the cross-sections of the weld with different pulse duration. The laser power was 75 W, the welding speed and the wire feeding speed were both 350 mm/min, and the pulse frequency was 60 Hz. The weld beads showed a smooth outline, except when pulse duration = 4 ms. Most of the filler metal was distributed on the upper side. The weld width was too small for the spread of the filler metal, and an unsmooth surface was generated, as shown in Figure 4a.
Figure 4.
Cross-sections of weld bead under different pulse duration: (a) τ = 4 ms; (b) τ = 5 ms; (c) τ = 6 ms; (d) τ = 7 ms; (e) τ = 8 ms.
Figure 5 shows the cross-sections of the welds with different pulse frequencies. The laser power was 75 W, the welding speed and wire feeding speed were both 350 mm/min, and the pulse duration was 6 ms. The welds showed smooth outline and were free from defects. Different from the case when τ = 4 ms, the unsmooth upper surface appeared when the weld was quite wide, as shown in Figure 5e. This phenomenon may be related to surface tension effects in a relatively wide weld pool to the thickness of the substrate [18].
Figure 5.
Cross-section of weld bead under different pulse frequency: (a) f = 50 Hz; (b) f = 60 Hz; (c) f = 70 Hz; (d) f = 80 Hz; (e) f = 90 Hz.
Figure 6a and Figure 7a show the variations of the weld fusion zone area with pulse duration and pulse frequency, respectively. The fusion area of the weld increased linearly with the increase in the pulse duration or the pulse frequency. The welding speed and the wire feeding speed were constants, so the increase in the fusion area led to an increase in the fusion quantity of the base metal.

Figure 6.
Variations of weld bead parameters with pulse duration: (a) fusion zone area; (b) weld width; (c) reinforcement height; (d) reinforcement height-to-width ratio.
Figure 7.
Variations of weld bead parameters with pulse frequency: (a) fusion zone area; (b) weld width; (c) reinforcement height; (d) reinforcement height-to-width ratio.
Figure 6b and Figure 7b show the variations of the weld width with pulse duration and frequency. The width of the lower surface was more sensitive to the pulse parameters. The weld width to the pulse duration or frequency curve of the lower surface had a higher slope than that of the upper surface. The lower surface was wider than the upper surface when the pulse duration was longer than 5 ms or the frequency was higher than 60 Hz. When the frequency was 50 Hz, most of the filler metal solidified on the upper surface of the substrate, and the spreadability of the filler metal was good when the pulse duration was 6 ms, so the width of the upper surface was larger than that of 60 Hz, as shown in Figure 7b.
The variations in the reinforcement height with pulse duration and frequency are shown in Figure 6c and Figure 7c. With a longer duration or higher frequency, the molten pool was wider and had a longer existence time, which was beneficial to the downward flow and the spreading of the filler metal. The reinforcement height of the upper surface reduced significantly at first then changed to linearly with a lower speed. The welding speed and the wire feeding rate were kept constant, meaning that the fusion area of the reinforcements (Au + Al) was a constant. Therefore, the variation of the reinforcement height of the lower surface had an opposite trend.
Figure 6d and Figure 7d show that the reinforcement-to-width ratio of the upper surface decreases with the increase in pulse duration or pulse frequency. The upper reinforcement height decreased, and the upper surface widened with the increased pulse duration or pulse frequency. The reinforcement-to-width ratio of root reinforcement increased at first and then reduced slowly with the increase in the pulse duration or pulse frequency, and the inflection point of the r curve was near the point where the width of the upper surface was equal to that of the lower surface. Both the height and width of the root reinforcement increased with the increase in pulse duration and frequency, but the width increased with higher speed. Therefore, the reinforcement-to-width ratio decreased. The reinforcement-to-width ratio can be used to describe the spreadability of the filler metal. Define θ = arctan(2H/L) as the contact angle of the reinforcement. Generally, a lower reinforcement-to-width ratio means a better spreadability of the filler metal and a lower contact angle between the reinforcement and the base plate, and it is beneficial for the service time of the welded joint when being used with alternate load or in an erosion-corrosion environment.
The pulse duty ratio is defined as the ratio of pulse duration-to-pulse period. The higher the duty ratio, the longer the heating time is in the welding process, compared with the cooling time. The pulse intensity decreases and the duty ratio increases with the increase in the pulse duration when the average power and pulse frequency are fixed. The decreased pulse intensity reduces the highest temperature of the molten pool. However, the increased heating time enhances heat accumulation and increases the volume of the molten pool. The extended existence time and enlarged volume of the molten pool enhance the downward flow and the spreading of the filler metal. Thus, the weld widens and the root reinforcement gets larger with the increase in the pulse duration.
The pulse frequency has similar effects on weld geometry to those of pulse duration. The increase in the pulse frequency does not change the heating time, and the pulse energy and intensity reduce with the increase in frequency. However, the cooling time reduces with the increase in the frequency; thus, the duty ratio is increased.
The duty ratios of the welding parameters in Table 2 were calculated with Equation (3). The variations in fusion zone area (A) with laser pulse duty ratio (α) are shown in Figure 8. It shows that, by increasing the pulse duration or the frequency, the variations in the fusion zone area to duty ratio change in the same way.
Figure 8.
Variations of fusion zone area with laser pulse duty ratio.
According to the analyses above, the least-square polynomial fit was used to build the relation between the fusion zone area and duty ratio. The relationship between A and α is shown in Equation (4), and the prediction curve is given in Figure 9.
A = 0.48 − 0.59α + 2.48α2 (0.25 < α < 0.55).
Figure 9.
Relationship between fusion zone area and duty ratio.
This indicates that, for the pulsed laser welding of a 0.5 mm Hastelloy C-276 thin sheet with filler wire at a fixed total heat input, the volume of the molten pool during the welding process is dominated by the duty ratio. As mentioned above, the variation in the fusion area shows the variation in the fusion quantity of the base metal. Thus, the dilution of the base metal can be obtained by this relationship. This will be useful when control of the element composition in the fusion zone is needed. The geometry of the weld bead, especially the distribution of the filler metal, is closely related to the duty ratio. Therefore, the weld geometry can be approximately predicted and manipulated by adjusting the duty ratio.
3.2. Microstructure
When the total heat input is fixed, the pulse parameters determine the weld geometry by influencing the thermal process in the welding process. The pulse parameters have significant effects on the microstructure of the weld.
The microstructure of the weld with pulse durations (4, 6, and 8 ms) are shown in Figure 10a–c, and the microstructure of the weld with the pulse frequency is shown in Figure 10d–f. The microstructure of the base metal consists of equiaxed grains, and annealing twins are observed. From the fusion line to the weld joint center, the microstructure of the fusion zone changed from a small quantity of planar crystal, columnar dendrites to equiaxed dendrites. For the rapid cooling rate in pulsed laser welding, the growth of the planar crystal was restrained, as shown in Figure 10a. With the increase in the pulse duration and the pulse frequency, the components of columnar dendrites were increased, and the microstructure showed a coarsening trend.

Figure 10.
Variations of microstructure of the weld with pulse duration and frequency: (a) τ = 4 ms; (b) τ = 6 ms; (c) τ = 8 ms; (d) f = 50 Hz; (e) f = 70 Hz; (f) f = 90 Hz.
With a high duty ratio, although no typical characteristic of the heat affect zone, such as an increase in the grain size of the base metal near the fusion line, was found, the base metal near the fusion line showed a tendency of grain boundary liquation. According to the study by Lippold et al. [19], due to the epitaxial growth of the fusion zone grains, grain boundaries in the base metal near the fusion line are contiguous with the solidification grain boundaries in the fusion zone. In the fusion zone metal solidification process, some of the low-melting-point solute may segregate toward the grain boundary. The solute or impurity elements can be transported down the boundary pipeline into the base metal grain boundaries near the fusion line. The solute or impurity elements will decrease the melting point of the grain boundaries, resulting in grain boundary liquation. The grain boundary liquation area, which has also been called the partially melted zone, can lead to liquation cracking, loss of ductility, and hydrogen cracking [20]. It may be a weakness of the weld.
Figure 11 and Figure 12 show the morphology of the columnar dendrites and equiaxed dendrites in the fusion zone with different pulse durations and pulse frequencies. The magnified locations are shown in Figure 11b and Figure 12b. The primary dendrite arm spacing and second dendrite arm spacing increase with the pulse duty ratio. The average equiaxed dendrites grain size in the fusion zone center increases from about 4 µm to 7 µm when the pulse duration increases from 4 ms to 8 ms, and increases from about 5 µm to 9 µm when the pulse frequency increases from 50 Hz to 90 Hz. The microstructure of the fusion zone is dominated by temperature gradient G and growth rate R. Generally, the growth rate R is related to the welding speed V, R·cos(α − β) = V·cosα [19], α is the angle between the welding direction and the normal of the molten pool boundary, and β is the angle between the welding direction and the growth direction of the dendrite at that point. The welding speed is kept constant, so there is no large variation of R when the duty ratio is changed. The peak power reduces with the increase in the duty ratio, so the temperature of the molten pool center reduces. At the same time, the volume of the molten pool increases. Thus, the temperature gradient G of the molten pool reduces with the increase in the duty ratio. The decreasing value of G·R results in the coarsening of the microstructure of the weld.
Figure 11.
Variations of grain size with pulse duration: (a) τ = 4 ms; (b) τ = 6 ms; (c) τ = 8 ms.
Figure 12.
Variations of grain size with pulse frequency: (a) f = 50 Hz; (b) f = 70 Hz; (c) f = 90 Hz.
In order to reveal the effects of the pulse parameters on the microhardness distributions of the weld joint, hardness tests were done on the cross-section of the joints, as shown in Figure 13. The microhardness profiles for the welds with 4, 6, and 8 ms are shown in Figure 13a. The microhardness profiles for the welds with 50, 70, and 90 Hz are shown in Figure 13b. No decrease in hardness was found in the weld; the hardness of the fusion zone had the same value as the base metal. The grain refinement increases the hardness of the weld. At the same time, the welding process may weaken the solution strengthening of the base metal and result in a tendency to decrease in hardness. These two effects indicated that no decrease in hardness was found in the weld. Moreover, no difference was found in the hardness profiles of the welds. The average hardness of fusion zone and base metal both were approximately 250 HV0.1. These results show that, although the increase in duty ratio will cause the coarsening of the fusion zone microstructure, there will be no significant hardness loss in the fusion zone. The grain boundary liquation area is quite narrow, and it is impossible to distinguish it on a polished surface during hardness tests, so its microhardness data is not available.
Figure 13.
Variations of microhardness of the weld with pulse duration and frequency: (a) Microhardness profiles for the welds with different pulse durations; (b) Microhardness profiles for the welds with different pulse frequencies.
4. Conclusions
A 0.5-mm-thick Hastelloy C-276 thin sheet was welded via pulsed laser with filler wire. The effects of the pulse parameters on the weld bead geometry and microstructure were investigated when the total heat input was fixed.
The pulse duration and pulse frequency have similar effects on the weld bead geometry. The duty ratio dominated by pulse duration and frequency can be used to predict and control the weld bead geometry.
The distribution of the filler metal between the upper and lower surface influences the weld width. The lower surface is wider than the upper surface when the lower reinforcement is larger than the upper reinforcement. With the increase in duty ratio, the upper surface reinforcement height-to-width ratio decreases, while the lower surface reinforcement height-to-width ratio increases at first and then decreases slowly. The increase in the duty ratio is beneficial for the spreadability of the filler metal and reduces the contact angle of the reinforcement.
The relationship between the fusion zone area and the duty ratio is given by A = 0.48 − 0.59α + 2.48α2 (0.25 < α < 0.55). The dilution rate of the base metal can be obtained by this equation, and this will be useful when control of the element composition in the fusion zone is needed.
The results show that, although the increase in duty ratio will cause the coarsening of the fusion zone microstructure, there is no significant hardness loss in the fusion zone. With a larger duty ratio, the base metal near the fusion line shows a tendency towards grain boundary liquation, and the grain boundary liquation area may reduce the performance of the weld bead, so an overly large duty ratio needs to be avoided.
The melting state of the molten pool and filler wire between each pulse is unknown. Further study will focus on direct observation of the molten pool development and the melting mechanism of the filler wire with different pulse parameters.
Acknowledgments
The authors would like to acknowledge the financial support from the National Key Basic Research Program of China (No. 2015CB057305), the Science Fund for Creative Research Groups (No. 51321004), and the National Nature Science Foundation of China (No. 51402037).
Author Contributions
Dongsheng Chai and Dongdong Wu conceived the experiments; Guangyi Ma and Siyu Zhou contributed by analyzing data and revising the writing; Zhuji Jin and Dongjiang Wu supervised the work and further analyzed the data. Dongsheng Chai wrote the article.
Conflicts of Interest
The authors declare no conflict of interest.
References
- Zhang, Q.; Tang, R.; Yin, K.; Luo, X.; Zhang, L. Corrosion behavior of Hastelloy C-276 in supercritical water. Corros. Sci. 2009, 51, 2092–2097. [Google Scholar] [CrossRef]
- Hashim, M.; Babu, K.E.S.R.; Duraiselvam, M.; Natu, H. Improvement of wear resistance of Hastelloy C-276 Through laser surface melting. Mater. Des. 2013, 46, 546–551. [Google Scholar] [CrossRef]
- Cieslak, M.J.; Headley, T.J.; Romig, A.D. The welding metallurgy of Hastelloy alloys C-4, C-22, and C-276. Metall. Trans. A 1986, 17, 2035–2047. [Google Scholar] [CrossRef]
- Yue-sheng, L.X.; Xia-hui, L.Y. Study on microstructure and properties of welded joint of extra thin Ni-based alloy plate. J. Plast. Eng. 2011, 18, 91–97. [Google Scholar]
- Manikandan, M.; Arivazhagan, N.; Rao, M.N.; Reddy, G.M. Microstructure and mechanical properties of alloy C-276 weldments fabricated by continuous and pulsed current gas tungsten arc welding techniques. J. Manuf. Process. 2014, 16, 563–572. [Google Scholar] [CrossRef]
- Manikandan, M.; Arivazhagan, N.; Rao, M.N.; Reddy, G.M. Improvement of microstructure and mechanical behavior of gas tungsten arc weldments of alloy C-276 by current pulsing. Acta Metall. Sin. 2015, 28, 208–215. [Google Scholar] [CrossRef]
- Manikandan, M.; Sasikumar, P.; Arul Murugan, B.; Sathishkumar, M.; Arivazhagan, N. Microsegregation studies on pulsed current gas tungsten arc welding of alloy C-276. Int. J. Sci. Eng. Res. 2015, 6, 33–38. [Google Scholar]
- Ahmad, M.; Akhter, J.I.; Akhtar, M.; Iqbal, M.; Ahmed, E.; Choudhry, M.A. Microstructure and hardness studies of the electron beam welded zone of Hastelloy C276. J. Alloy. Compd. 2005, 390, 88–93. [Google Scholar] [CrossRef]
- Van der Eijk, C.; Fostervoll, H.; Sallom, Z.K.; Akselsen, O.M. Plasma welding of NiTi to NiTi, stainless steel and Hastelloy C-276. In Proceedings of ASM Materials Solutions 2003 Conference, Pittsburgh, PA, USA, 13–15 October 2003.
- Moradi, M.; Ghoreishi, M. Influences of laser welding parameters on the geometric profile of Ni-base superalloy Rene 80 weld-bead. Int. J. Adv. Manuf. Technol. 2011, 55, 205–215. [Google Scholar] [CrossRef]
- Ma, G.; Wu, D.; Chai, D.; Guo, Y.; Guo, D. Near-free-defect laser welding of AP1000 nuclear reactor coolant pump can. J. Mech. Eng. 2015, 51, 1–8. [Google Scholar] [CrossRef]
- Wu, D.J.; Ma, G.Y.; Niu, F.Y.; Guo, D.M. Pulsed laser welding of Hastelloy C-276: High-temperature mechanical properties and microstructure. Mater. Manuf. Process. 2013, 28, 524–528. [Google Scholar] [CrossRef]
- Ma, G.; Wu, D.; Niu, F.; Zou, H. Microstructure evolution and mechanical property of pulsed laser welded Ni-based superalloy. Opt. Laser. Eng. 2015, 72, 39–46. [Google Scholar] [CrossRef]
- Ventrella, V.A.; Berretta, J.R.; de Rossi, W. Pulsed Nd: YAG laser welding of Ni-alloy Hastelloy C-276 foils. Phys. Proced. 2012, 39, 569–576. [Google Scholar] [CrossRef]
- Hao, K.; Li, G.; Gao, M.; Zeng, X. Weld formation mechanism of fiber laser oscillating welding of austenitic stainless steel. J. Mater. Process. Technol. 2015, 225, 77–83. [Google Scholar] [CrossRef]
- Ma, G.Y.; Wu, D.J.; Guo, Y.Q.; Gao, Z.M.; Guo, D.M. Tensile Properties of Weld Joint on Thin Hastelloy C-276 Sheet of Pulsed Laser Welding. Rare Metal Mater. Eng. 2013, 42, 1241–1245. [Google Scholar]
- Qin, G.L.; Lei, Z.; Lin, S.Y. Effects of Nd: YAG laser + pulsed MAG arc hybrid welding parameters on its weld shape. Sci. Technol. Weld. Join. 2007, 12, 78–86. [Google Scholar] [CrossRef]
- Kim, J.; Kim, S.; Kim, K.; Jung, W.; Youn, D.; Lee, J.; Ki, H. Effect of beam size in laser welding of ultra-thin stainless steel foils. J. Mater. Process. Technol. 2016, 233, 125–134. [Google Scholar] [CrossRef]
- Lippold, J.C.; Baeslack, W.A.; Varol, I. Heat-affected zone liquation cracking in austenitic and duplex stainless steels. Weld. J. 1992, 71, 1–14. [Google Scholar]
- Kou, S. Welding Metallurgy, 2nd ed.; John Wiley & sons: Hoboken, NJ, USA, 2002. [Google Scholar]
© 2016 by the authors; licensee MDPI, Basel, Switzerland. This article is an open access article distributed under the terms and conditions of the Creative Commons Attribution (CC-BY) license (http://creativecommons.org/licenses/by/4.0/).