Article

Detecting Structural Features in Metallic Glass via Synchrotron Radiation Experiments Combined with Simulations

College of Materials Science and Technology, Nanjing University of Aeronautics and Astronautics, Nanjing 210016, China
*
Author to whom correspondence should be addressed.
Metals 2015, 5(4), 2093-2108; https://doi.org/10.3390/met5042093
Submission received: 23 September 2015 / Revised: 29 October 2015 / Accepted: 3 November 2015 / Published: 9 November 2015
(This article belongs to the Special Issue Metals Challenged by Neutron and Synchrotron Radiation)

Abstract

:
Revealing the essential structural features of metallic glasses (MGs) will enhance the understanding of glass-forming mechanisms. In this work, a feasible scheme is provided where we performed the state-of-the-art synchrotron-radiation based experiments combined with simulations to investigate the microstructures of ZrCu amorphous compositions. It is revealed that in order to stabilize the amorphous state and optimize the topological and chemical distribution, besides the icosahedral or icosahedral-like clusters, other types of clusters also participate in the formation of the microstructure in MGs. This cluster-level co-existing feature may be popular in this class of glassy materials.

Graphical Abstract

1. Introduction

Metallic glasses (MGs) have drawn intense interest due to their unique properties since the discovery of the first glassy alloy with the composition of Au75Si25 in 1960 [1]. Thus far, vast efforts have been devoted to developing alloys with high glass-forming abilities (GFAs), which may be applied as potential engineering materials. Understanding the glass-formation mechanisms to guide the preparation of alloy materials with high GFAs is desired, thus a number of rules, principles, and criteria have been presented to address this long-standing issue [2,3,4,5,6].
It has been realized that the formation of glassy alloys is strongly influenced by their microstructures, and various clusters should be the basic units forming the atomic structures of MGs. Thus far, many structural models have been proposed by studying clusters theoretically [7,8,9,10], enhancing the understanding of the glass-forming mechanisms in binary MGs by building and stacking clusters in space to form their short-range and medium-range orderings. In addition, besides some conventional experimental techniques, synchrotron radiation methods such as X-ray diffraction (XRD) and extended X-ray absorption fine structure (EXAFS) and neutron diffraction also have been applied for studying the microstructures of MGs [11,12,13]. Therefore, investigating the microstructures of MGs and glass-forming mechanisms by combining some advanced experimental and theoretical methods is expected.
In this work, a feasible scheme is provided where we performed a series of state-of-the-art synchrotron radiation-based experiments (XRD and EXAFS) combined with calculations (simulations) to investigate the microstructures of amorphous alloys. Zr70Cu30 and Zr54Cu46 binary compositions are selected as the study objects for the following reasons: (1) ZrCu is a typical simple (binary) alloy system for investigating glass formation, which has attracted intensive interest recently [14,15,16]; (2) the ZrCu binary system has a broad composition range-enable formation of amorphous alloys (30–80 at. % for the Zr component) [17]. Solute-centered clusters are regarded as the building blocks and are helpful for forming the amorphous structure in alloys [9,10]. However, when the concentration of Zr is comparable to that of Cu, a glassy structure also can be formed, while in this case, it is hard to say whether Zr or Cu atoms are the solutes. Considering the concentrations of Zr and Cu in Zr70Cu30 and Zr54Cu46, Cu could be regarded as the solute in the former while neither Zr nor Cu could be the solutes in the latter. Revealing the underlying structural forming mechanisms in MGs by studying these two ZrCu amorphous compositions is appropriate.

2. Experimental Section

The alloy ingots were prepared by arc melting the mixture of Zr (99.9 wt. %) and Cu (99.9 wt. %) elements in Ti-gettered high-purity argon atmosphere. The ingots were melted at least five times in order to ensure their compositional homogeneity. The corresponding amorphous ribbons were fabricated by melt-spinning, producing a cross-section of 0.04 × 2 mm2.
To obtain high-resolution radial distribution functions for amorphous alloys, getting XRD data with a relatively large Q (wave vector transfer) value is required, which is expressed as:
Q = 4 π sin θ λ
Therefore, the synchrotron radiation-based high-energy (about 100 keV) X-ray diffraction measurements were performed for two samples at the beam line, BW5, of Hasylab in Germany [18,19,20]. The samples measured at room temperature in transmission mode were illuminated for about 200 s by a well-collimated incident beam with a 0.8 mm2 cross-section. The sample-to-image plate distance was set to be about 500 mm, so that raw diffraction patterns with Q values up to about 20 Å−1 were measured. The setup layout for this measurement is plotted in Figure 1. Because the proper penetrating depth here is about 1 mm while the ribbon depth is only about 40 microns, the ribbons were cut into very small pieces and filled in the capillaries. The two-dimensional diffraction data for both empty capillaries and capillaries filled with MG pieces were recorded using a Mar345 image plate [19,20]. After subtracting the background of empty capillaries, the diffraction data of samples could be obtained. The two-dimensional diffraction data were integrated into one-dimensional data by using the program Fit2D [21]. The integrated data were corrected for polarization, sample absorption, fluorescence contribution, inelastic scattering, and so on. Then the total structural factor S(Q) was obtained by using the Faber-Ziman equation, employing the software PDFgetX [22].
Figure 1. The setup layout of synchrotron radiation-based high-energy (about 100 keV) X-ray diffraction measuring amorphous alloys. By combining XRD and EXAFS data with simulations we can obtain an amorphous structural model, as shown in this figure.
Metals 05 02093 g001
Subsequently, because the Zr and Cu K-edge absorption energies are so different (8.979 keV and 17.998 keV) that their absorption signals could not interfere with each other, and both Zr and Cu have relatively high concentrations here, the transmission mode was adopted for both Zr and Cu K-edges that allowed their EXAFS spectra to be measured at the beam lines BL14W1, in the Shanghai Synchrotron Radiation Facility of China, and U7C, in the National Synchrotron Radiation Laboratory (NSRL) of China. The calculated proper depths of our samples required for Zr and Cu K-edge EXAFS measurements are about 20 and 45 microns, respectively. Therefore, the ribbon samples were polished until their depths were about 20 microns when measuring the Cu K-edge signals. The EXAFS spectra were normalized via a standard data-reduced procedure [23], employing the software Visual Processing in EXAFS Researches (VIPER) [24].
In order to obtain the atomic structural information as reliably as possible, both the normalized diffraction and EXAFS data were simulated simultaneously under the framework of reverse Monte-Carlo (RMC) [25]. The RMC simulation technique is an iterative method for building a structural model in disordered systems with detailed structural information that agrees quantitatively with experimental data (such as the synchrotron radiation-based XRD, EXAFS, and neutron-diffraction data) [26]. In this work, synchrotron radiation-based XRD and EXAFS data were simulated via the RMC method, using the software RMCA [27]. The initial cubic boxes built contain 40,000 randomly distributed Zr and Cu, according to the ZrxCu100−x (x = 70 and 54) compositions. During RMC simulation, atoms move randomly within a determined time interval. The experimental data are compared to the simulation with the iterative calculation [28],
δ 2 = 1 ε 2 n ( S m ( Q n ) S exp ( Q n ) ) 2 + 1 ε Cu 2 n ( χ m , E l ( k n ) χ exp , E l ( k n ) ) 2
where δ2 represents the deviation between the experimental and simulation data, ε parameters regulate the weight of the data set given in the fitting procedure, Ei denotes Cu or Zr elements, and S(Q) and χ(k) parameters are the XRD structural factor and the EXAFS signal, respectively. The subscripts “m” and “exp” represent the simulations and the experiments, respectively. Once simulation and experimental data converge, the simulation is stopped, and all the atoms are “frozen” in the cubic box. The result is an atomic structural model available for further analyses. Because all the XRD and EXAFS should be fitted well with all the corresponding theoretical counterparts calculated from the same structural model, such constraint confirms the reliability RMC of the simulation.
Additionally, the simulated structural models were further analyzed by the Voronoi tessellation method [23,25]. According to the Voronoi original algorithm, each convex Voronoi polyhedron (VP) can be built by connecting the perpendicular bisectors between a center atom and all of its neighboring atoms. Each VP may be indexed as <n3,n4,n5,n6,…>, where ni denotes the number of i-edged faces on the surface of this polyhedron. Each VP should be embedded in a corresponding convex Voronoi cluster (VC), which is made up of one center atom and its neighboring shell atoms [25,29]. Thus, Σni also stands for the number of the shell atoms in one VC, i.e., the coordination number (CN) of the center atom. The Voronoi algorithm also requires that all the VCs should be closed structural units, which can be accomplished by piling up a set of Delaunay tetrahedrons with the shared vertex at an atom (the center atom of the VC) [30]. This is done so their surfaces are only made up of triangular faces, i.e., they could be regarded as deltahedra [10]. Euler’s formula is defined by
VE + F = 2
where V, E, and F stand for the number of vertexes, edges, and faces of VCs, respectively. Because each vertex of VCs should be occupied by one atom, V also denotes the CN of VCs. V, F, and E should satisfy the following equations
3E = 2F = ∑i × ni
V = 0.5F + 2
obviously, ∑i × ni must be divisible by 6.

3. Results and Discussion
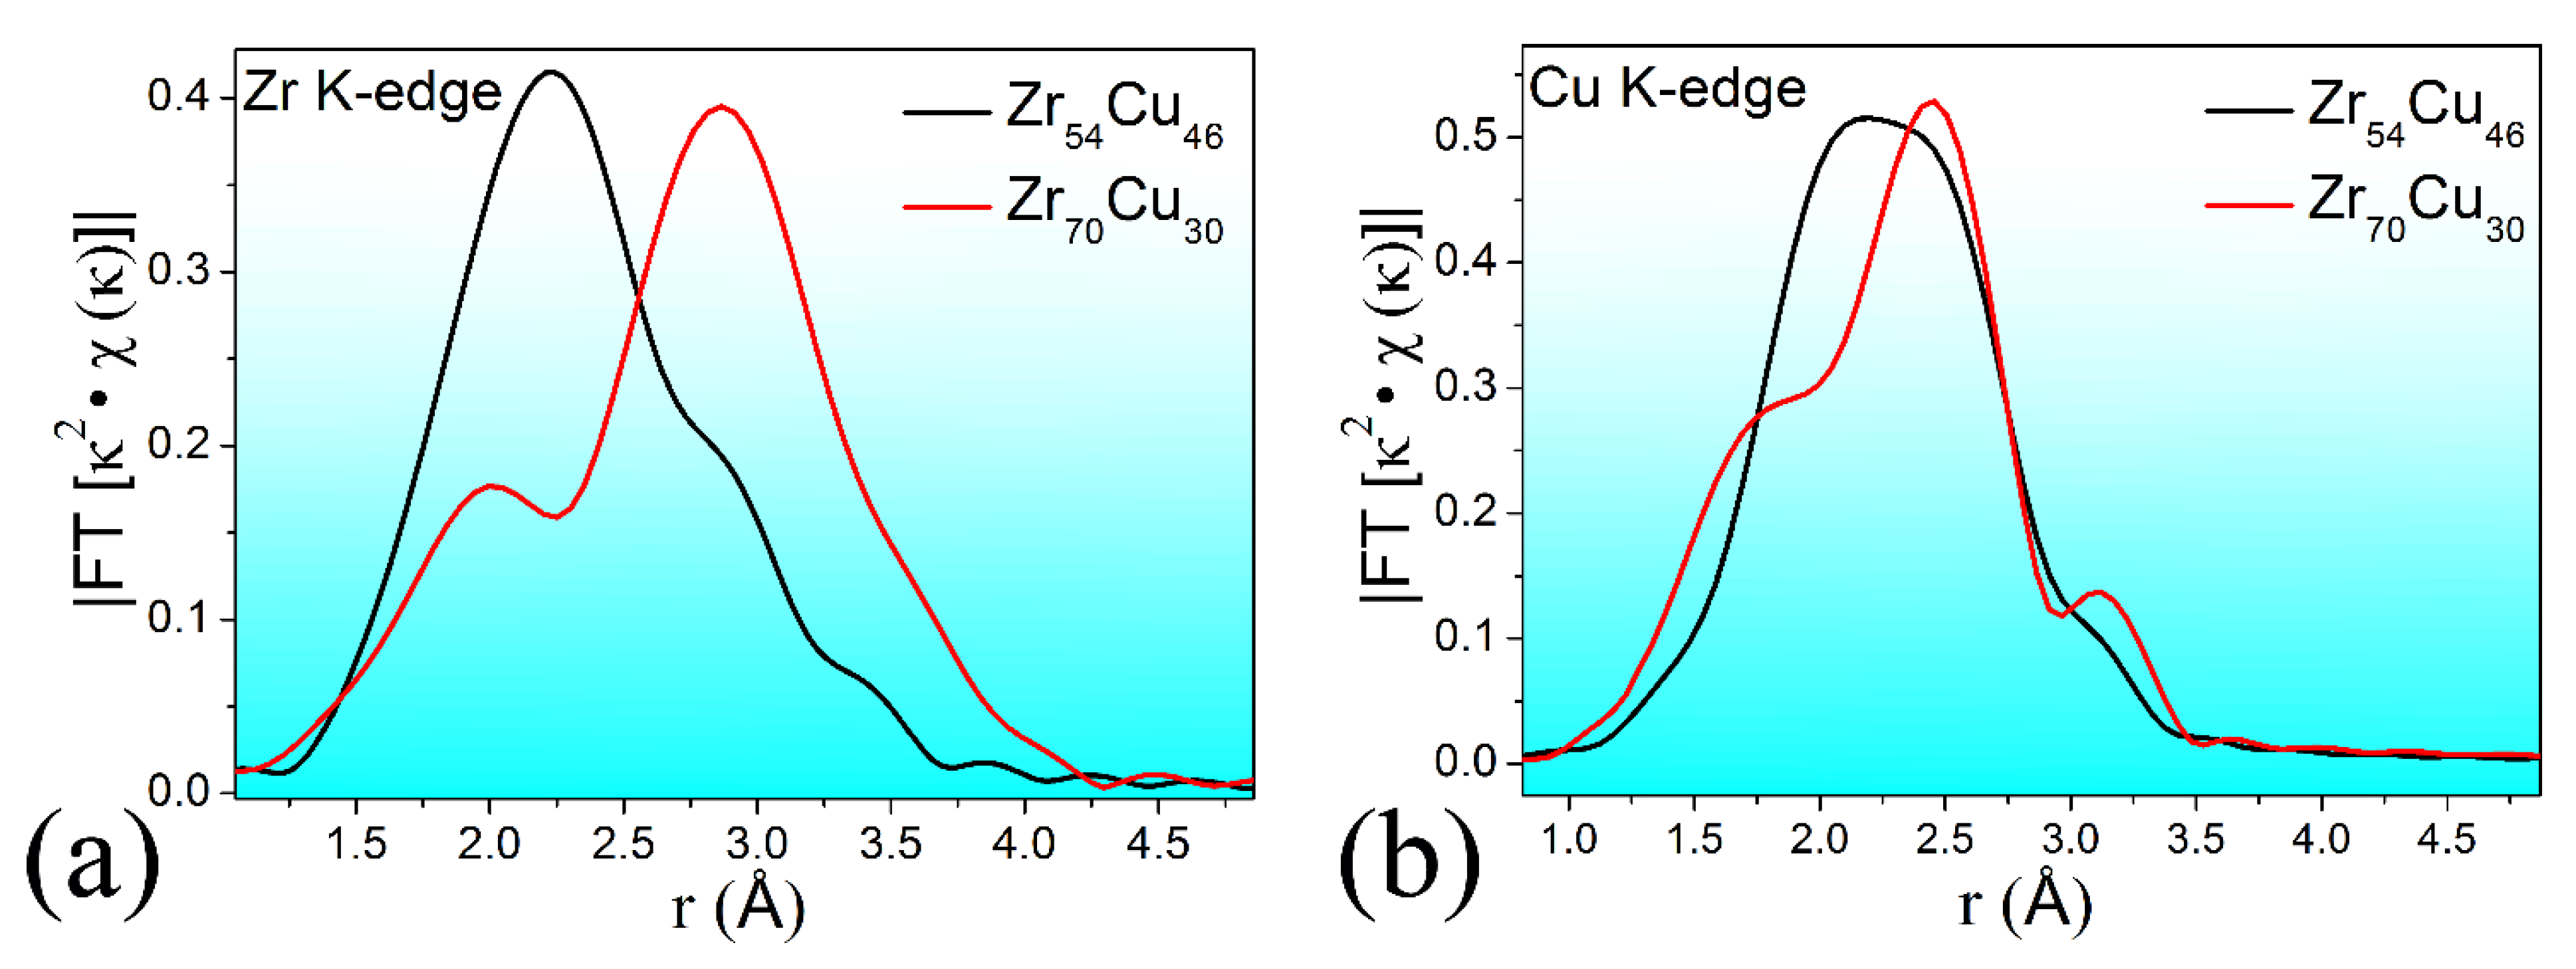
Figure 2a,c show the two-dimensional X-ray diffraction patterns, the structural factor, S(Q), and the total pair distribution function, G(r). S(Q) and G(r) curves can be deduced from the two-dimensional diffraction pattern. The amorphous nature of these two ZrCu samples can be confirmed because there are no circle lines or dots in the two-dimensional diffraction patterns and no sharp Bragg peaks behind the first strong peak in the S(Q) curves, and these features are usually found in the diffraction data of polycrystals or single crystals [31]. For both S(Q) and G(r) curves, there are differences in their first-, second- and third-shell distributions (SDs) in terms of the peak intensity, position, and width. In particular, obvious differences between their second SDs in S(Q) and their first SDs in G(r) indicate that clear structural changes between these two samples do exist because the split of the second SD in S(Q) reflects the chemical short-range information in MGs [32] and the first SD in G(r) relates to local structural information.
Figure 2. (a) The two-dimensional X-ray diffraction patterns of both ZrCu amorphous samples; and the deduced data: (b) the structural factor (S(Q)); and (c) the total pair distribution function (G(r)). To highlight the S(Q) difference between Zr70Cu30 and Zr54Cu46, the Q region here was shortened to about 12 Å−1.
Metals 05 02093 g002
By reverse Fourier transforming the EXAFS signal into real space, the radial distribution function (RDF) could be obtained whose peak area and peak position relate to CN and atomic-pair distance information, respectively. Zr and Cu K-edge RDFs are shown in Figure 3a,b, respectively. As expected, the peak shapes are obviously different between these two selected samples. This also indicates that a difference in the microstructure between them exists. In particular, it is interesting that a peak split appears in both the Zr and Cu K-edge RDFs of Zr70Cu30 while no peak split is shown in those of Zr54Cu46. In crystal alloys, their local structures are usually formed by distributing the nearest atoms at several relatively localized positions around center atoms, resulting in a split of their first-shell main peak in their EXAFS RDFs. However, in amorphous alloys, the nearest atoms are relatively randomly distributed around the center atoms, resulting in a continuous distribution (Gaussian distribution) in the RDF. In other words, a sole first-shell main peak without an obvious split in the RDF usually appears, denoting the local structural information [33]. This indicates that the neighbor atoms around the center atoms have relatively localized positions in Zr70Cu30 [34].
Figure 3. The radial distribution functions (RDFs) obtained by reverse Fourier transforming the EXAFS signal into real space, including: (a) Zr K-edge and (b) Cu K-edge.
Metals 05 02093 g003
Figure 4a–c show the XRD and EXAFS experimental data, as well as their corresponding RMC simulated curves. To ensure the proper interpretation of all the structural information during EXAFS normalization, the EXAFS data for Zr and Cu K-edge signals were both weighted by κ3 values. This does not reduce the reliability of RMC simulation because the simulated Zr and Cu K-edge EXAFS spectra also were strictly weighted by κ3 values so that no systematic errors could be generated from these κ-weight normalizations [35].
Figure 4. XRD and EXAFS experimental data as well as their corresponding simulated curves, including (a) S(Q); (b) Zr K-edge; and (c) Cu K-edge EXAFS data. The experimental and simulated data are plotted with solid and dashed lines, respectively. Both experimental and simulated Zr and Cu K-edge signals were weighted by κ3. To highlight the S(Q) difference between the experimental and the simulated data for both samples, the Q region here was shortened to about 16 Å−1.
Metals 05 02093 g004aMetals 05 02093 g004b
The good matching between all the experiment/simulation pairs confirms the success of the RMC simulations. Based on the simulated structural models, atomic-level structural information can be deduced. The CN values around Zr and Cu center atoms, as well as all kinds of atomic-pair distances, are listed in Table 1. We could find no obvious difference in the atomic-pair distances between Zr70Cu30 and Zr54Cu46, and all the CN values are reasonable, considering the concentrations of Zr and Cu in these two compositions. It seems that such atomic-level structural parameters can barely provide any unique information for amorphous alloys.
Table 1. Atomic structural information obtained from the RMC simulation, including: coordination numbers (CNs) around Zr or Cu centers and atomic-pair distances (R).
CentersAtomic PairsCN ± 0.1R (Å) ± 0.02
Zr54Cu46Zr70Cu30Zr54Cu46Zr70Cu30
Zr atomZr–Zr7.59.73.153.19
Zr–Cu5.43.52.962.96
Cu atomCu–Cu4.12.52.662.65
Cu–Zr6.48.62.962.96
Via the Voronoi tessellation, all the VCs whose distributions are plotted in Figure 5 can be extracted. Because it has been revealed that various clusters may co-exist in the microstructure of MGs [10,16], it is no surprise that we can deduce hundreds of types of VCs. Here, only those whose fractions are larger than 1.5% are selected and shown in Figure 5. For the Zr- centered VCs, it is found that there are some popular VCs (fractions are larger than 5%) in both ZrCu samples, such as <0,2,8,2>, <0,3,6,3>, and <0,1,10,2>. These VCs have been validated to be typical icosahedral or icosahedral-like VCs in previous work [25]. For instance, like the ideal icosahedron (<0,0,12,0>), <0,2,8,2> and <0,3,6,3> are distorted icosahedra, having the same CN value of 12. For another example, if we add one atom on the shell of the <0,0,12,0> VC, it changes into <0,1,10,2>. The high weights of these icosahedral or icosahedral-like VCs in both Zr70Cu30 and Zr54Cu46 MG compositions indicate that icosahedral or icosahedral-like VCs are the preferred building blocks for forming the microstructure of glassy alloys. This is consistent with the viewpoint presented in previous work that icosahedral or icosahedral-like VCs ease the formation of the amorphous structure in alloys [36,37].
Figure 5. Distribution of the major Voronoi clusters, including: (a) Zr-centered VCs and (b) Cu-centered VCs. Only those whose fractions are larger than 1.5% are selected. The CN value denotes the number of shell atoms of the corresponding VC, i.e., the CN around the center atom.
Metals 05 02093 g005
However, other types of clusters also exist here. For instance, we notice that one non-icosahedral VC indexed as <0,3,6,4> has a relatively large fraction in both samples. According to the efficient cluster-packing model [38], the optimal CN relates to the size ratio between the center atom and the shell atoms in clusters. According to the concentrations of Zr and Cu components in both samples, we can estimate that the optimal CNs around the Zr centers in Zr54Cu46 and Zr70Cu30 are 12.8 and 13.6, respectively. These CNs are a little bit larger than 12 (CN of the ideal icosahedron). Therefore, besides some distorted icosahdral VCs with CNs of 12, such as <0,2,8,2> and <0,3,6,3>, other VCs with CNs of 13 (such as <0,1,10,2> and <0,3,6,4>) and even 14, which also are popular clusters, the average CN around Zr centers equals the estimated optimal CN value. In addition, it is worth noting that there is a tendency for Zr70Cu30 to have relatively high (low) fractions of VCs with large (small) CNs compared with the Zr54Cu46 composition. This is because the optimal CN of Zr70Cu30 (13.6) is larger than that of Zr54Cu46 (12.8) due to the increase of the size ratio between the center atom and the shell atoms when replacing Cu atoms with Zr atoms (Zr atoms are larger than Cu ones).
Concerning the Cu centers, there are some popular VCs with relatively high weights in both ZrCu compositions, such as <0,2,8,1>, <0,2,8,2>, <0,3,6,3>, <0,4,4,3>, <0,3,6,2>, <0,3,6,1>, and so on. Although <0,2,8,1>, <0,2,8,2>, and <0,3,6,3> may be regarded as icosahedral-like VCs (for instance, <0,2,8,1> could be formed by removing one shell atom from <0,0,12,0>), others with CNs of 11 or 10 have no icosahedral-like features at all. This is because the optimal CNs around Cu centers in Zr54Cu46 and Zr70Cu30 are calculated to be 11.3 and 10.9, respectively. These CNs are a little bit smaller than 12. In addition, there also is a tendency for Zr54Cu46 and Zr70Cu30 to have relatively high (low) fractions of Cu-centered VCs with large (small) CNs. This also is because of the relatively high Zr concentration in Zr70Cu30.
From the results and discussion mentioned above, we can conclude that icosahedral or icosahedral-like VCs are the favorite structural units in the microstructure of MGs, because stacking such clusters with abundant five-fold rotation symmetrical features [29] can result in the exclusion of structural periodicity, which is required in crystals. Nevertheless, the microstructures of MGs could not be formed only by stacking icosahedral or icosahedral-like VCs because of the following reasons: (1) it has been revealed that fractal features are popular in amorphous alloys and that icosahedral clusters fail to be packed to fill space [39]; (2) the optimal CN relates to the size ratio between the center atom and the shell atoms of VCs. This value usually does not equal 12 (the CN of a standard icosahedron). Therefore, besides icosahedral or icosahedral-like VCs, some other clusters with no icosahedral-like features (usually with CN not equal to 12) also should exist to fill space. That should be the structural nature of amorphous alloys.
In addition, although icosahedral or icosahedral-like clusters co-existing with other types of clusters is revealed to be the structural nature in both Zr70Cu30 and Zr54Cu46, we have found that there are some obvious differences in the distributions of Zr- and Cu-centered VCs, as shown in Figure 5a,b. A tendency could be observed which shows that Zr70Cu30 has the higher (lower) fractions of Zr- (Cu-) centered VCs with large CN values compared to Zr54Cu46, which is due to the higher concentration of Zr having a relatively large Goldschmidt atomic radius of 1.60 Å. This strongly relates to the atomic-scale differences between Zr70Cu30 and Zr54Cu46 shown in Figure 2, Figure 3. For different systems or compositions enabling the formation of glassy alloys, there must be some atomic- and cluster-level structural differences due to the different concentrations of all the containing elements with different atomic sizes. Nevertheless, icosahedral or icosahedral-like clusters are the preferred structural building blocks. To fill in space efficiently, they should be densely packed with the help of other non-icosahedral clusters, leading to the formation of the microstructure in various glass formers.
Because ZrCu is a typical binary alloy system, it enables the formation of MG, revealing the structural mechanisms for its glass formation that have drawn intense interest that a number of theoretical or experimental works have been published [14,15,16,40,41,42,43]. Therefore, it is necessary to compare the present work with previous work in terms of studying methods and structural information. For instance, in a previous report, the authors did RMC simulation upon neutron diffraction data and compared it with Molecular Dynamics (MD) simulations. They concluded that in the ZrCu system, the basic structural units correspond to “Superclusters”, which is different from our conclusion that “icosahedral-like VCs and other types of clusters co-exist in glassy structure”. This difference is probably because the Voronoi tessellation applied in our work can give more detailed cluster-level structural information. For another instance, in another article, the authors did MD simulations and concluded that a string-like backbone network formed by icosahedral clusters is the amorphous structural basis, which is similar to our conclusion. This indicates that theoretical methods such as MD also can provide detailed structural information on amorphous alloys.
In addition, in order to compare the microstructures between different alloy systems, a ZrCu binary and a ZrCuAl ternary MG compositions also are studied, as described in the Appendix section.

4. Conclusions

In summary, a feasible scheme for investigating the microstructure of amorphous alloys is provided by combining synchrotron radiation–based experiments with simulations. It is revealed that although there are some distribution differences of clusters (local structures) between Zr70Cu30 and Zr54Cu46 MG compositions, icosahedral or icosahedral-like VCs are preferred structural units in both samples. It is further revealed that in order to increase the cluster packing efficiency (space filling) and obtain the optimal CN of clusters corresponding to the chemical distribution of the center and shell atoms, icosahedral-like VCs co-existing with other types of clusters should be the structural nature in amorphous alloys. This work will enhance the understanding of glass-forming mechanisms at the atomic- and cluster-level structural aspect.

Acknowledgments

The authors would like to thank the HASYLAB in Germany, the Shanghai Synchrotron Radiation Facility in China, and the National Synchrotron Radiation Laboratory of China for the use of the advanced synchrotron radiation facilities. Financial support from the National Natural Science Foundation of China (Grant No. U1332112 and 51471088), the Fundamental Research Funds for the Central Universities (Grant No. NE2015004), the Funding for Outstanding Doctoral Dissertation in NUAA (Grant No. BCXJ12-08), the Funding of Jiangsu Innovation Program for Graduate Education (Grant No. CXLX13-152), and the project funded by the Priority Academic Program Development (PAPD) of Jiangsu Higher Education Institutions are gratefully acknowledged.

Author Contributions

Gu-qing Guo performed simulation work with the experimental data. Lang Yang performed the analysis of this work and wrote this article. Shi-yang Wu and Sheng Luo contributed to the experimental research work.

Conflicts of Interest

The authors declare no conflict of interest.

Appendix

A. Introduction

In order to compare the microstructures between different alloy systems, the Zr48Cu45Al7 ternary and Zr50Cu50 binary metallic glass (MG) compositions are studied. They have large differences in physical properties such as glass-forming ability (GFA). In detail, since the critical casting size is an important indicator of GFA, we can say that Zr48Cu45Al7 has a higher GFA than Zr50Cu50, considering the fact that Zr50Cu50 has a critical casting size not more than 2 mm in diameter [44], while such value is enhanced up to 6 mm in Zr48Cu45Al7 [45].
The experimental and the simulation methods are the same with those described in the manuscript. Here we show their atomic-level and cluster-level microstructure below, and will discuss the relationship between the microstructure and GFA. More information refers to our previous work [46].

B. Atomic-Level Structural Information

From the reverse Monte-Carlo (RMC) simulated atomic model, the coordination number (CN) and the nearest interatomic distances can be deduced, as listed in Table A1. The cut-off distances are set to be 3.90, 3.80, 3.80, 3.65, 3.65, and 3.5 Å for Zr–Zr, Zr–Cu, Zr–Al, Cu–Cu, Cu–Al, and Al–Al atomic pairs, respectively, which are consistent with the maximum ranges of the first shell distribution in partial G(r)s. For comparison, interatomic distances are also obtained by summing their Goldschmidt atomic radii. Little difference in the length of Zr–Zr, Zr–Cu, and Cu–Cu pairs can be found. However, a large deviation from the interatomic distances calculated based on the Goldschmidt atomic radii is observed, with values of 0.27, 0.14, and 0.30 Å for Zr–Al, Cu–Al, and Al–Al couples, respectively, i.e., Al–M (M = Zr, Cu, and Al) pairs are greatly shortened in this composition. A similar bond-shortening phenomenon was ever detected in Al-based amorphous alloys [28]. Additionally, in previous computational work on ZrCuAl, strong bonding of Al–Cu was also suggested [47]. The origin of the shortened Al–M pair distance should be the strong bonding effect between Al and it neighbor atoms.
Table A1. Atomic structure information, including average CNs of M (M = Zr, Cu and Al) atoms obtained by RMC simulation; DRMC and DSGAR are the interatomic distances (atomic bonds) calculated from the RMC model and the sum of the Goldschmidt atomic radii (SGAR), respectively.
Atomic PairCNDRMC (Å)DSGAR (Å)
Zr–Zr6.133.183.20
Zr–Cu5.282.852.88
Zr–Al0.822.763.03
Cu–Zr5.62--
Cu–Cu4.742.582.56
Cu–Al0.62.572.71
Al–Zr5.94--
Al–Cu4.05--
Al–Al0.362.562.86

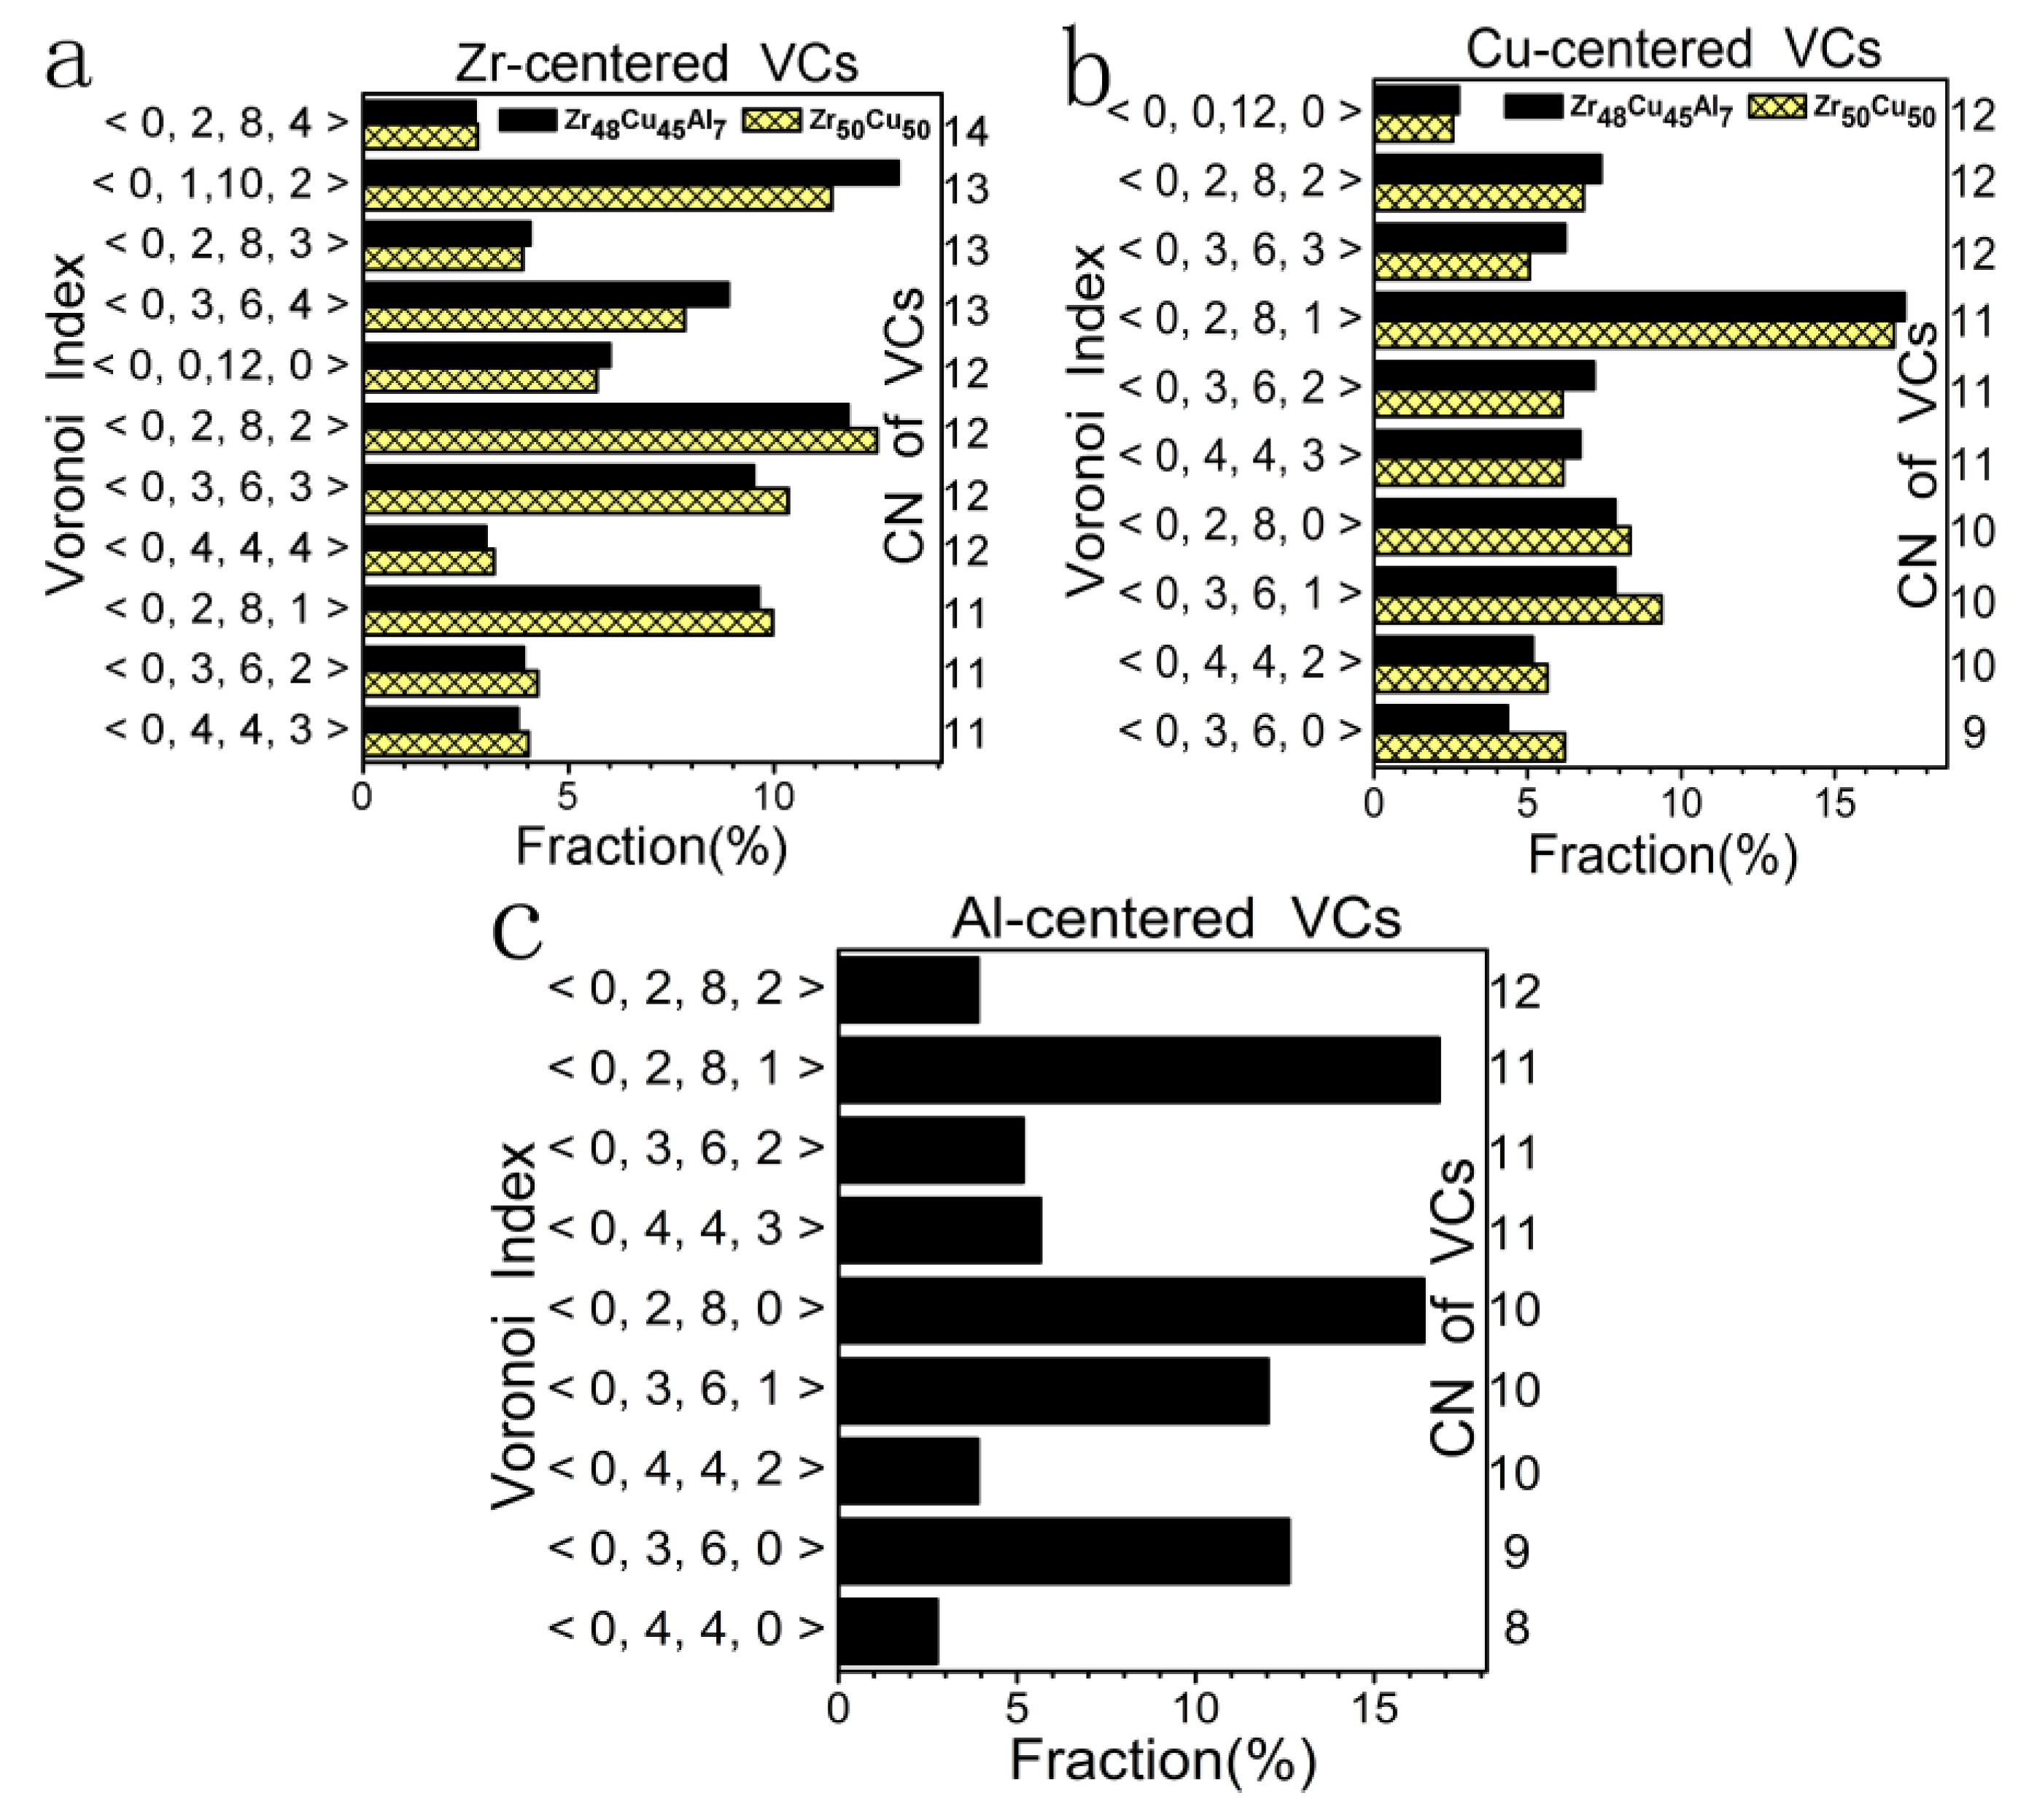
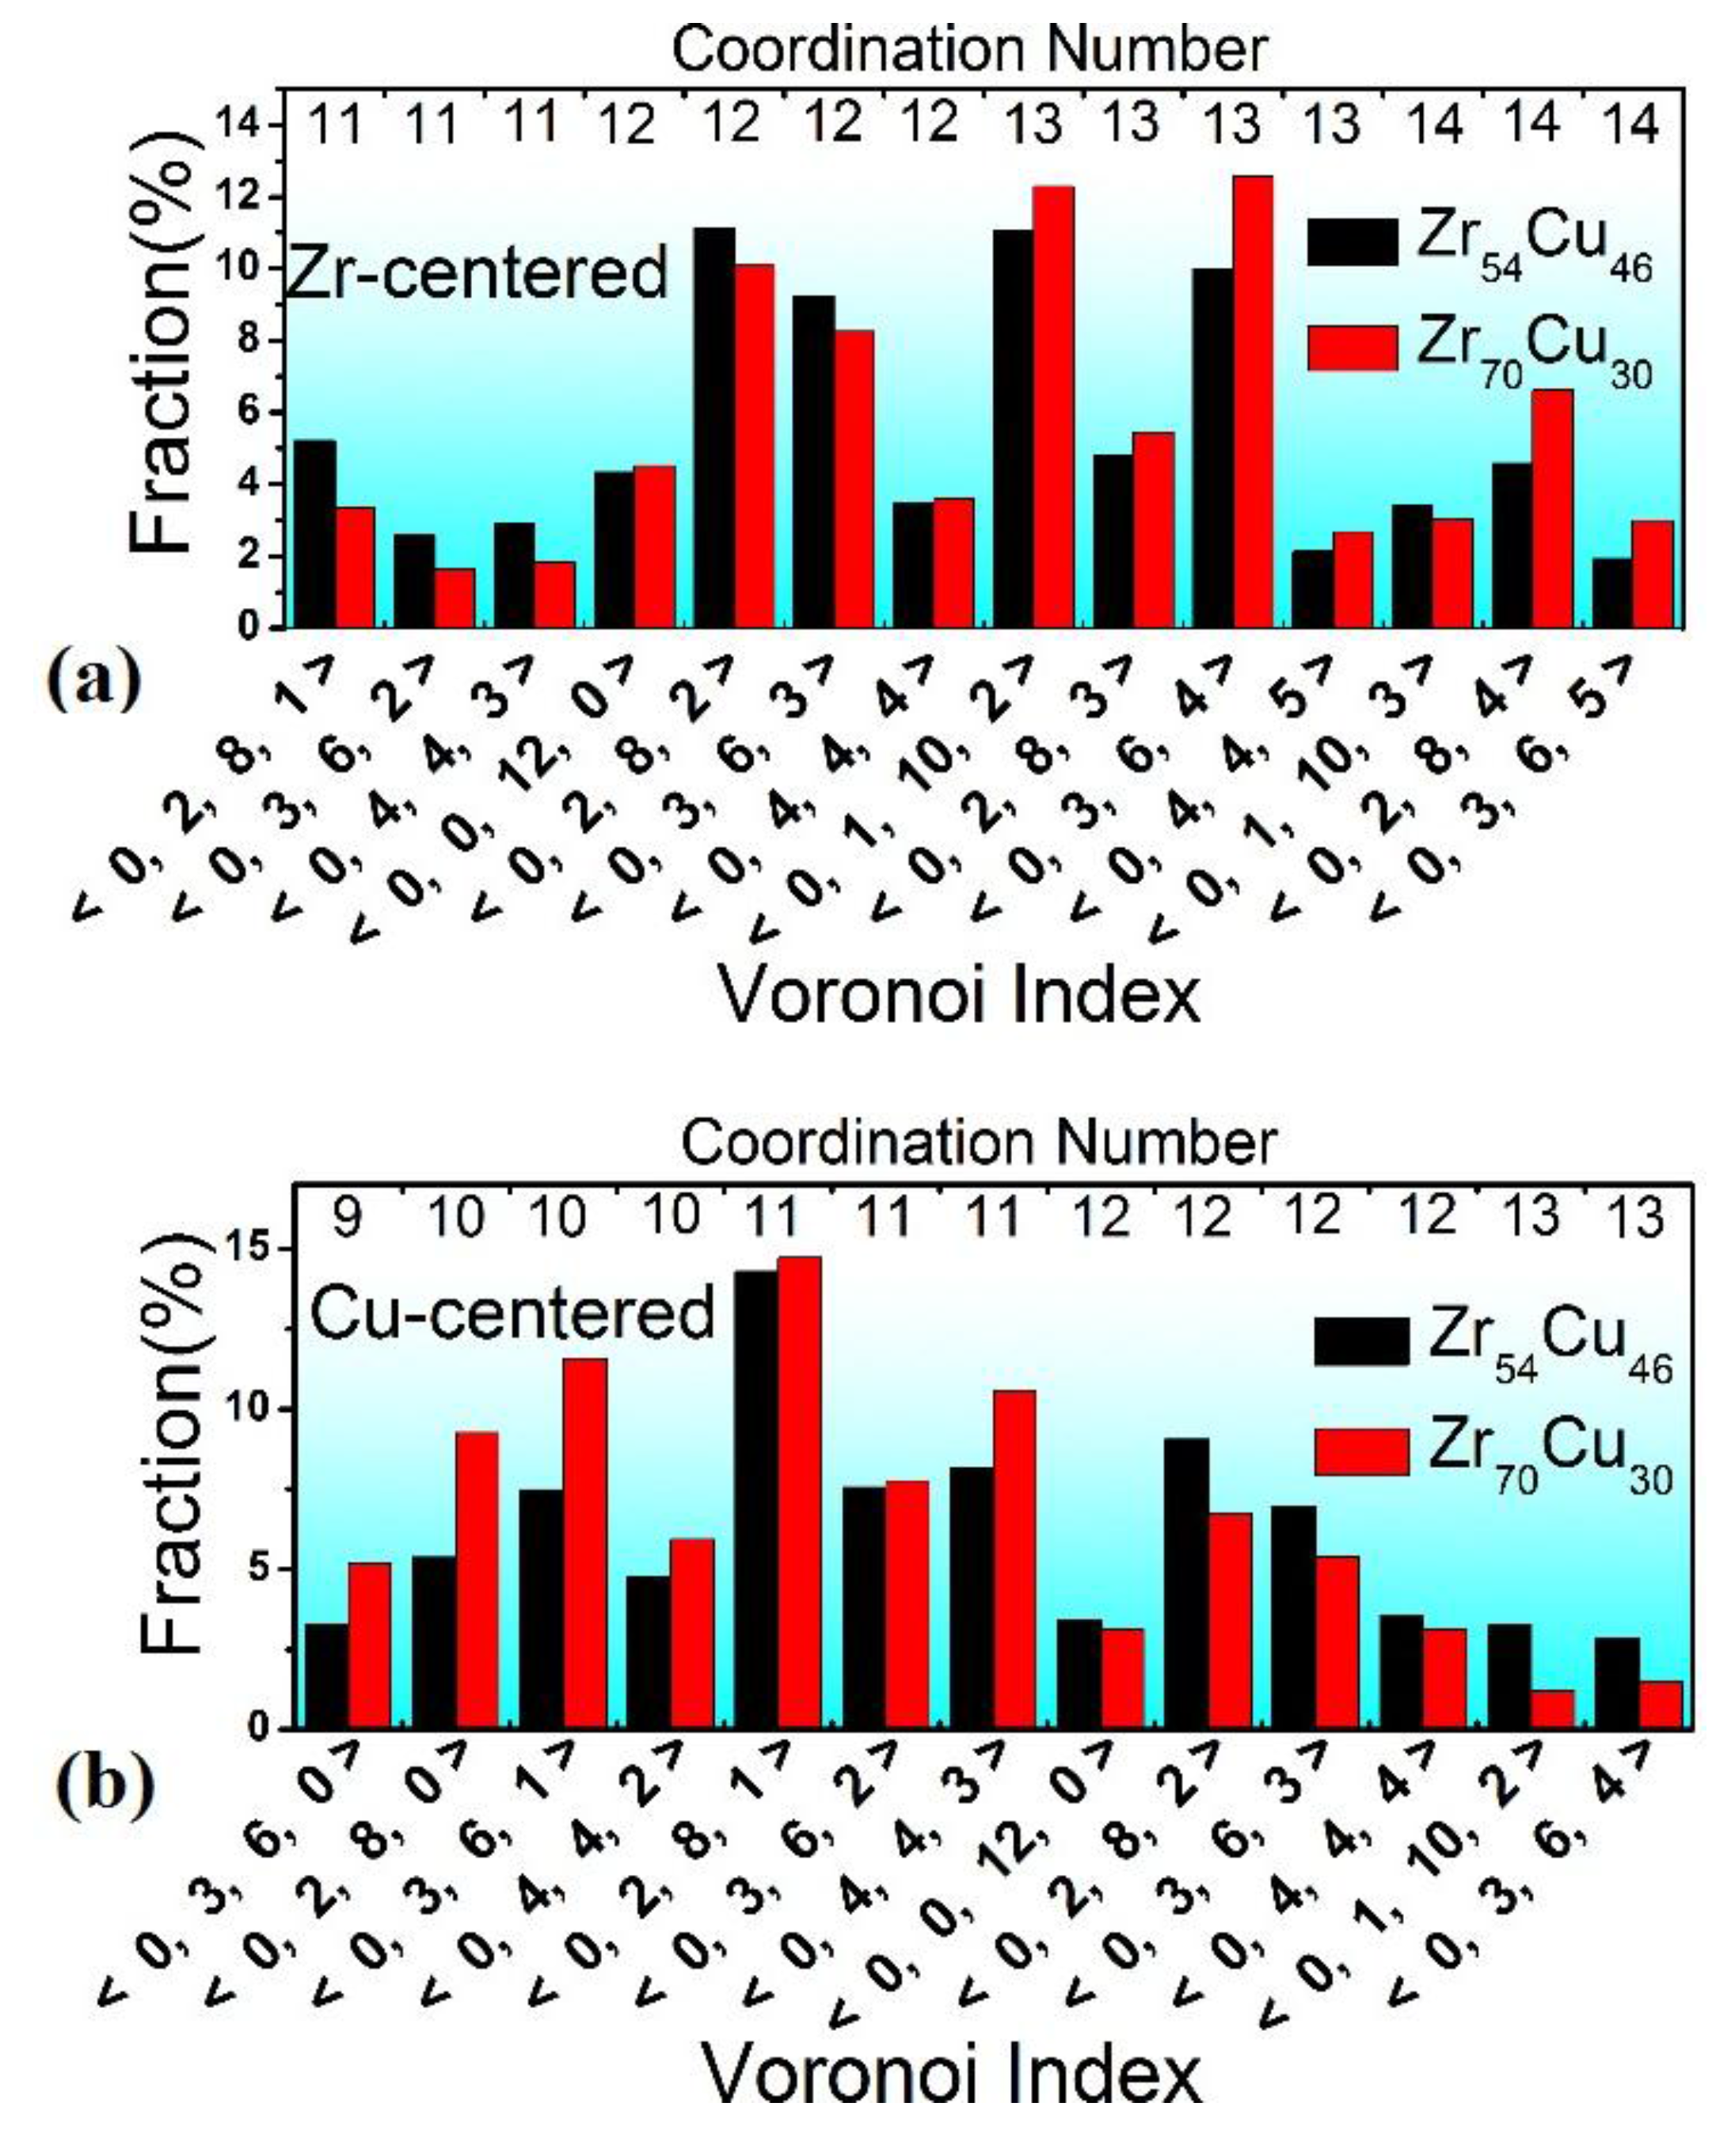
C. Cluster-Level Structural Information

The distribution of major Voronoi clusters (VCs) centered with Zr, Cu, and Al atoms in Zr48Cu45Al7 and Zr50Cu50 is plotted in Figure A1a–c, respectively. Except for little difference for each VC fraction, the similar VC distribution tendency indicates that the surrounding of Zr and Cu atoms is highly alike in both alloys. As shown in Figure A1a, dominant VCs indexed as <0,1,10,2>, <0,3,6,4>, <0,2,8,2>, <0,3,6,3>, and <0,2,8,1> account for a total fraction of about 50%, and most of them may be regarded as icosahedral-like (distorted or irregular icosahedra) clusters [25]. We notice that the ideal icosahedron indexed as <0,0,12,0> only possesses a weight of 6%. Its low fraction may result from the large size gap between Zr and Cu atoms, which may retard the formation of such a regular cluster whose shell atoms are symmetrically packed around the center atom. Concerning Cu-centered VCs, it is remarkable that the fraction of <0,2,8,1> is twice larger than any other fraction, which is quite consistent with a recent report [48]. However, the weight of <0,0,12,0> is rather low, which matches well with the previous work [49]. In short, icosahedral-like Zr- and Cu-centered clusters are the main building blocks in both ZrCu and ZrCuAl samples. Additionally, it is interesting that four Al-centered major clusters indexed as <0,3,6,0>, <0,3,6,1>, <0,2,8,0>, and <0,2,8,1> are deduced with a total weight over 60%, as plotted in Figure A1c. These four VCs are relatively smaller clusters with a CN range of 9–11. We notice that the shortened Al atomic radius is 1.28 Å, one half of the Al-Al bond length (in Table A1). The atomic size ratio R* between the Al solute and its neighbors is thus calculated at 0.87 and may lead to an optimal cluster with a CN of 10–11 [38], which is consistent with the CN range of these four Al-centered major VCs.
Figure A1. Distribution of major VCs, centered with (a) Zr; (b) Cu; and (c) Al atoms. Note only VCs possessing a weight over 2.5% are selected.
Metals 05 02093 g006

D. Relationship between Microstructure and GFA

To reveal the relationship between the local structure and GFA in ZrCuAl, further analysis upon the deduced structural features caused by the Al addition is required. Since structure heredity occurs between molten liquid and solid MG [50], we may discuss the local structure in a molten liquid state based on the above results. Inside Al-centered clusters, Al solute atoms are prone to bonding with Zr and Cu solvent atoms. Depending on the strong interatomic bonding, Cu and Zr neighbors may be tightly connected by Al centers, resulting in shortened pair distances. Therefore, the mobility of atoms is sharply decreased, which may lead to the increase of viscosity in the molten state and ease of glass formation [51]. During the quench, rearrangements of Zr, Cu, and Al atoms by changing or breaking Al-connected bonds are largely retarded. This tendency may help preserve the local structure of the liquid to solid state, which may contribute to the increase of GFA in the ZrCuAl alloy. Considering the cluster scale for Zr50Cu50 composition, icosahedral-like Zr- and Cu-centered clusters with CNs of 11–13 should be the major building blocks. The cluster packing efficiency in the Zr50Cu50 alloy may be not very high because it was suggested that voids could be created due to the incomplete filling in space only by icosahedral-like clusters [52]. However, in the corresponding Al-doped ZrCu amorphous alloy, some of the Al atoms may be regarded as glue atoms [13,53], which may occupy the interstices around Zr- and Cu-centered icosahedral-like clusters to connect and fix them. These Al glue atoms are usually surrounded with fewer neighbors, resulting in smaller Al-centered VCs, such as the deduced <0,2,8,0>, <0,3,6,0>, and <0,3,6,1> with CNs of 9–10. The space may be filled with VCs with various shapes and volumes and the cluster-packing efficiency is accordingly increased. Such cluster-dense packing cause by Al atoms also may reduce the mobility of most atoms and clusters in molten liquid. Therefore, the crystallization is avoided, and the amorphous alloy with enhanced glass-forming ability was obtained.

References

  1. Klement, W.; Willens, R.H.; Duwez, P. Non-crystalline structure in solidified gold-silicon alloys. Nature 1960, 187, 869–870. [Google Scholar] [CrossRef]
  2. Turnbull, D. Under what conditions can a glass be formed? Contemp. Phys. 1969, 10, 473–488. [Google Scholar] [CrossRef]
  3. Greer, A.L. Confusion by Design. Nature 1993, 366, 303–304. [Google Scholar] [CrossRef]
  4. Inoue, A. Stabilization of metallic supercooled liquid and bulk amorphous alloys. Acta Mater. 2000, 48, 279–306. [Google Scholar] [CrossRef]
  5. Lu, Z.P.; Tan, H.; Li, Y.; Ng, S.C. The correlation between reduced glass transition temperature and glass forming ability of bulk metallic glasses. Scr. Mater. 2000, 42, 667–673. [Google Scholar] [CrossRef]
  6. Lu, Z.P.; Liu, C.T. Glass formation criterion for various glass-forming systems. Phys. Rev. Lett. 2003. [Google Scholar] [CrossRef]
  7. Bernal, J.D. A geometrical approach to the structure of liquids. Nature 1959, 183, 141–147. [Google Scholar]
  8. Gaskell, P.H. A new structural model for transition metal-metalloid glasses. Nature 1978, 276, 484–485. [Google Scholar] [CrossRef]
  9. Miracle, D.B. A structural model for metallic glasses. Nat. Mater. 2004, 3, 697–702. [Google Scholar] [CrossRef] [PubMed]
  10. Sheng, H.W.; Luo, W.K.; Alamgir, F.M.; Bai, J.M.; Ma, E. Atomic packing and short-to-medium-range order in metallic glasses. Nature 2006, 439, 419–425. [Google Scholar] [CrossRef] [PubMed]
  11. Lefebvre, S.; Quivy, A.; Bigot, J.; Calvayrac, Y.; Bellissent, R. A neutron diffraction determination of short-range order in a Ni63.7Zr36.3 glass. J. Phys. F 1985, 15, L99–L103. [Google Scholar] [CrossRef]
  12. Luo, W.K.; Sheng, H.W.; Alamgir, F.M.; Bai, J.M.; He, J.H.; Ma, E. Icosahedral Short-Range Order in Amorphous Alloys. Phys. Rev. Lett. 2004. [Google Scholar] [CrossRef]
  13. Yang, L.; Xia, J.H.; Wang, Q.; Dong, C.; Chen, L.Y.; Ou, X.; Liu, J.F.; Jiang, J.Z.; Klementiev, K.; Saksl, K.; et al. Design of Cu8Zr5-based bulk metallic glasses. Appl. Phys. Lett. 2006. [Google Scholar] [CrossRef]
  14. Wang, X.D.; Yin, S.; Cao, Q.P.; Jiang, J.Z.; Franz, H.; Jin, Z.H. Atomic structure of binary Cu64.5Zr35.5 bulk metallic glass. Appl. Phys. Lett. 2008. [Google Scholar] [CrossRef]
  15. Li, M.; Wang, C.Z.; Hao, S.G.; Kramer, M.J.; Ho, K.M. Structural heterogeneity and medium-range order in ZrxCu100−x metallic glasses. Phys. Rev. B 2009. [Google Scholar] [CrossRef]
  16. Yang, L.; Guo, G.Q.; Chen, L.Y.; Huang, C.L.; Ge, T.; Chen, D.; Liaw, P.K.; Saksl, K.; Ren, Y.; Zeng, Q.S.; et al. Atomic-Scale Mechanisms of the Glass-Forming Ability in Metallic Glasses. Phys. Rev. Lett. 2012. [Google Scholar] [CrossRef]
  17. Saida, J.; Kasai, M.; Matsubara, E.; Inoue, A. Stability of glassy state in Zr-based glassy alloys correlated with nano icosahedral phase formation. Ann. Chim. Sci. Mater. 2002, 27, 77–89. [Google Scholar] [CrossRef]
  18. Liss, K.D.; Bartels, A.; Schreyer, A.; Clemens, H. High energy X-rays: A tool for advanced bulk investigations in materials science and physics. Textures Microstruct. 2003, 35, 219–252. [Google Scholar] [CrossRef]
  19. Qu, D.D.; Liss, K.D.; Yan, K.; Reid, M.; Almer, J.D.; Wang, Y.B.; Liao, X.Z.; Shen, J. On the atomic anisotropy of thermal expansion in bulk metallic glass. Adv. Eng. Mater. 2011, 13, 861–864. [Google Scholar] [CrossRef]
  20. Liss, K.D.; Qu, D.D.; Yan, K.; Reid, M. Variability of Poisson’s Ratio and Enhanced Ductility in Amorphous Metal. Adv. Eng. Mater. 2013, 15, 347–351. [Google Scholar] [CrossRef]
  21. Hammersley, A.P.; Svensson, S.O.; Hanfland, M.; Fitch, A.N.; Häusermann, D. Two-dimensional detector software: From real detector to idealised image or two-theta scan. High Press. Res. 1996, 14, 235–248. [Google Scholar] [CrossRef]
  22. Qiu, X.; Thompson, J.W. PDFgetX2: A GUI-driven program to obtain the pair distribution function from X-ray powder diffraction data. J. Appl. Crystallogr. 2004, 37, 110–116. [Google Scholar] [CrossRef]
  23. Guo, G.Q.; Yang, L. Structural mechanisms of the microalloying-induced high glass forming abilities in metallic glasses. Intermetallics 2015, 65, 66–74. [Google Scholar] [CrossRef]
  24. Klementev, K.V. Extraction of the fine structure from X-ray absorption spectra. J. Phys. D 2001, 34, 209–217. [Google Scholar] [CrossRef]
  25. Wang, S.Y.; Kramer, M.J.; Xu, M.; Wu, S.; Hao, S.G.; Sordelet, D.J.; Ho, K.M.; Wang, C.Z. Experimental and ab initio molecular dynamics simulation studies of liquid Al60Cu40 alloy. Phys. Rev. B 2009, 79, 144205–144209. [Google Scholar] [CrossRef]
  26. McGreevy, R.L.; Pusztai, L. Reverse Monte Carlo Simulation: A new technique for the determination of disordered structures. Mol. Simul. 1988, 1, 359–367. [Google Scholar] [CrossRef]
  27. McGreevy, R.L. Reverse Monte Carlo modelling. J. Phys. Condens. Matt. 2001, 13, R877–R913. [Google Scholar] [CrossRef]
  28. Saksl, K.; Jovari, P.; Franz, H.; Zeng, Q.S.; Liu, J.F.; Jiang, J.Z. Atomic structure of Al89La6Ni5 metallic glass. J. Phys. Condens. Matter 2006, 18, 7579–7592. [Google Scholar] [CrossRef] [PubMed]
  29. Yang, L.; Guo, G.Q. Preferred clusters in metallic glasses. Chin. Phys. B 2010, 12. [Google Scholar] [CrossRef]
  30. Medvedev, N.N. The algorithm for three-dimensional Voronoi polyhedra. J. Comput. Phys. 1986, 67, 223–229. [Google Scholar] [CrossRef]
  31. Zeng, Q.S.; Sheng, H.W.; Ding, Y.; Wang, L.; Yang, W.G.; Jiang, J.Z.; Mao, W.L.; Mao, H.K. Long-range topological order in metallic glass. Science 2011, 332, 1404–1406. [Google Scholar] [CrossRef] [PubMed]
  32. Mattern, N.; Kuhn, U.; Hermann, H.; Ehrenberg, H.; Neuefeind, J.; Eckert, J. Short-range order of Zr62−xTixAl10Cu20Ni8 bulk metallic glasses. Acta Mater. 2002, 50, 305–314. [Google Scholar] [CrossRef]
  33. Yang, L.; Guo, G.Q.; Zhang, G.Q.; Chen, L.Y. Structural origin of the high glass-forming ability in Y-doped bulk metallic glasses. J. Mater. Res. 2010, 25, 1701–1705. [Google Scholar] [CrossRef]
  34. Guo, G.Q.; Yang, L.; Huang, C.L.; Chen, D.; Chen, L.Y. Structural origin of the different glass-forming abilities in ZrCu and ZrNi metallic glasses. J. Mater. Res. 2011, 26, 2098–2102. [Google Scholar]
  35. Keen, D.A.; McGreevy, R.L. Structural modelling of glasses using reverse Monte Carlo simulation. Nature 1990, 344, 423–425. [Google Scholar] [CrossRef]
  36. Saksl, K.; Franz, H.; Jovari, P.; Klementiev, K.; Welter, E.; Ehnes, A.; Saida, J.; Inoue, A.; Jiang, J.Z. Evidence of icosahedral short-range order in Zr70Cu30 and Zr70Cu29Pd1 metallic glasses. Appl. Phys. Lett. 2003, 8333, 3924–3926. [Google Scholar] [CrossRef]
  37. Saida, J.; Matsushita, M.; Inoue, A. Direct observation of icosahedral cluster in Zr70Pd30 binary glassy alloy. Appl. Phys. Lett. 2002, 79, 412–414. [Google Scholar] [CrossRef]
  38. Miracle, D.B.; Sanders, W.S.; Senkov, O.N. The influence of efficient atomic packing on the constitution of metallic glasses. Philos. Mag. 2003, 83, 2409–2428. [Google Scholar] [CrossRef]
  39. Ma, D.; Stoica, A.D.; Wang, X.L. Power-law scaling and fractal nature of medium-range order in metallic glasses. Nature Mater. 2009, 8, 30–34. [Google Scholar] [CrossRef] [PubMed]
  40. Antonowicz, J.; Pietnoczka, A.; Pękała, K.; Latuch, J.; Evangelakis, G.A. Local atomic order, electronic structure and electron transport properties of Cu-Zr metallic glasses. J. Appl. Phys. 2014. [Google Scholar] [CrossRef]
  41. Almyras, G.A.; Papageorgiou, D.G.; Lekka, C.E.; Mattern, N.; Eckert, J.; Evangelakis, G.A. Atomic cluster arrangements in Reverse Monte Carlo and Molecular Dynamics structural models of binary Cu-Zr Metallic Glasses. Intermetallics 2011, 19, 657–661. [Google Scholar] [CrossRef]
  42. Bokas, G.B.; Lagogianni, A.E.; Almyras, G.A.; Lekka, Ch.E.; Papageorgiou, D.G.; Evangelakis, G.A. On the role of Icosahedral-like clusters in the solidification and the mechanical response of Cu-Zr metallic glasses by Molecular Dynamics simulations and Density Functional Theory computations. Intermetallics 2013, 43, 138–141. [Google Scholar] [CrossRef]
  43. Antonowicz, J.; Pietnoczka, A.; Drobiazg, T.; Almyras, G.A.; Papageorgiou, D.G.; Evangelakis, G.A. Icosahedral order in Cu-Zr amorphous alloys studied by means of X-ray absorption fine structure and molecular dynamics simulations. Philos. Mag. 2012, 92, 1865–1875. [Google Scholar] [CrossRef]
  44. Zhu, Z.W.; Zhang, H.F.; Sun, W.S.; Ding, B.Z.; Hu, Z.Q. Processing of bulk metallic glasses with high strength and large compressive plasticity in Cu50Zr50. Scr. Mater. 2006, 54, 1145–1149. [Google Scholar] [CrossRef]
  45. Xu, D.H.; Duan, G.; Johnson, W.L. Unusual glass-forming ability of bulk amorphous alloys based on ordinary metal copper. Phys. Rev. Lett. 2004. [Google Scholar] [CrossRef]
  46. Yang, L.; Guo, G.Q.; Chen, L.Y.; Wei, S.H.; Jiang, J.Z.; Wang, X.D. Atomic structure in Al-doped multicomponent bulk metallic glass. Scr. Mater. 2010, 63, 879–882. [Google Scholar] [CrossRef]
  47. Cheng, Y.Q.; Ma, E.; Sheng, H.W. Atomic level structure in multicomponent bulk metallic glass. Phys. Rev. Lett. 2009. [Google Scholar] [CrossRef]
  48. Fujita, T.; Konno, K.; Zhang, W.; Kumar, V.; Matsuura, M.; Inoue, A.; Sakurai, T.; Chen, M.W. Atomic-scale heterogeneity of a multicomponent bulk metallic glass with excellent glass forming ability. Phys. Rev. Lett. 2009. [Google Scholar] [CrossRef]
  49. Wang, X.D.; Jiang, Q.K.; Cao, Q.P.; Bednarcik, J.; Franz, H.; Jiang, J.Z. Atomic structure and glass forming ability of Cu46Zr46Al8 bulk metallic glass. J. Appl. Phys. 2008. [Google Scholar] [CrossRef]
  50. Dyre, J.C. Glasses: Heirs of liquid treasures. Nat. Mater. 2004, 3, 749–750. [Google Scholar] [CrossRef] [PubMed]
  51. Mukherjee, S.; Schroers, J.; Zhou, Z.; Johnson, W.L.; Rhim, W.K. Viscosity and specific volume of bulk metallic glass-forming alloys and their correlation with glass forming ability. Acta Mater. 2004, 52, 3689–3695. [Google Scholar] [CrossRef]
  52. Doye, J.P.K.; Wales, D.J.; Simdyankin, S.I. Global optimization and the energy landscapes of Dzugutov clusters. Faraday Discuss. 2001, 118, 159–170. [Google Scholar] [CrossRef] [PubMed]
  53. Xia, J.H.; Qiang, J.B.; Wang, Y.M.; Wang, Q.; Dong, C. Ternary bulk metallic glasses formed by minor alloying of Cu8Zr5 icosahedron. Appl. Phys. Lett. 2006. [Google Scholar] [CrossRef]

