Article

Microstructure, Mechanical, and Machining Properties of 2024 Al Composites Reinforced with TiB2, SiC, and Diamond Particles


1
School of Materials Science and Engineering, Kunming University of Science and Technology, Kunming 650093, China
2
State Key Laboratory for Advanced Metals and Materials, University of Science and Technology Beijing, Beijing 100083, China
*
Author to whom correspondence should be addressed.
Metals 2026, 16(1), 18; https://doi.org/10.3390/met16010018
Submission received: 20 November 2025 / Revised: 21 December 2025 / Accepted: 23 December 2025 / Published: 24 December 2025
(This article belongs to the Special Issue Design and Development of Metal Matrix Composites (2nd Edition))

Abstract

Particle-reinforced aluminum matrix composites demonstrate remarkable potential for use in aerospace, precision instruments, and electronic packaging applications due to their superior specific strength, high specific stiffness, and low thermal expansion coefficient. However, increasing the reinforcement volume fraction to enhance the elastic modulus often leads to a reduction in plasticity and machining performance. This study investigates hot-pressed 27 vol.% TiB2/2024, 15 vol.% diamond/2024, and 37 vol.% SiC/2024 composite with equivalent elastic moduli, focusing on the effects of TiB2 particle size and T6 heat treatment on their microstructure, mechanical properties, and machining performance. The results reveal that increasing the TiB2 particle size from 7 μm to 25 μm reduces the tensile strength from 397.1 MPa to 371.7 MPa, increases surface roughness values from 110 nm to 177 nm, but simultaneously decreases tool wear. Among the tested composites, the 27 vol.% TiB2/2024 composite exhibits optimal interfacial bonding without Al4C3 formation, providing the most effective load-bearing strengthening, as well as the lowest surface roughness and minimal tool wear. Moreover, the T6 heat treatment further enhanced the tensile strength of the 27 vol.% TiB2/2024 composite from 397.1 MPa to 421.7 MPa, while reducing the surface roughness values during turning from 110 nm to 79 nm and further minimizing tool wear, thus achieving outstanding overall mechanical and machining performance.

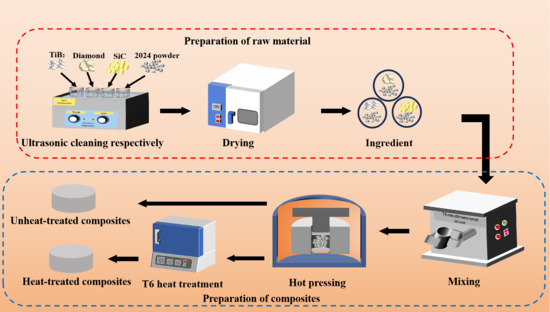
Graphical Abstract

1. Introduction

Particle-reinforced aluminum matrix composites (PRAMCs) are a class of metal matrix composites formed by incorporating hard ceramic particles, such as SiC, Al2O3, TiC, TiB2, and BN, into an aluminum or aluminum alloy matrix. These materials synergistically combine the lightweight nature and ease of processing of the aluminum matrix with the high strength, high modulus, elevated temperature resistance, and wear resistance of the ceramic reinforcements. Owing to this superior combination of properties, they have garnered significant attention in aerospace, precision instruments, electronic packaging, and defense [1]. However, with technological advancement and the need to meet the requirements of special applications, a high-volume fraction of reinforcements must be incorporated to enhance the strength and elastic modulus of composites. This leads to a significant degradation in both ductility and machining properties. Currently, the methods for balancing the high elastic modulus and processability of composite materials remain insufficiently refined Su et al. [2] fabricated 2CNT/2SiC/6013Al composite materials, where the intragranular distribution of carbon nanotubes and silicon carbide particles resulted in dislocation pinning and retention, significantly enhancing both strength and ductility. Peng et al. [3] achieved synergistic improvement in strength and ductility of SiC-reinforced aluminum matrix composites through an interface substitution strategy. Salifu, S. et al. [4] summarized the use of high-entropy alloys to replace ceramic reinforcement particles. The core challenge of these methods lies in increasing the toughness of high-modulus reinforcements. As a transitional approach, this study adopts a more straightforward strategy: by screening commonly used reinforcements and utilizing particles with different elastic moduli to reinforce the composites and comparing the machining performance of the composites. The goal is to develop a composite that possesses high strength, high elastic modulus, and excellent machining properties.
The elastic modulus, a fundamental parameter that quantifies a material’s resistance to elastic deformation under applied stress, directly determines structural rigidity; higher modulus values correspond to lower elastic deformation under identical stress conditions. Tensile strength, another key mechanical property, defines the load-bearing capacity and reliability of composites in engineering applications. Furthermore, improving the machining performance of PRAMCs can significantly enhance the surface quality of machined components by reducing surface roughness, residual stress, and the formation of micro-cracks.
Current studies addressing composites that simultaneously achieve high elastic modulus, superior mechanical properties, and excellent machining properties remain scarce. The primary factors influencing the elastic modulus include particle volume fraction, particle size, porosity in composites [5], and interfacial bonding characteristics, among which the volume fraction exerts the most significant impact. Increasing the particle volume fraction markedly enhances the elastic modulus of aluminum matrix composites due to the load-transfer strengthening effect of stiff reinforcement particles. At low to medium particle fractions, the elastic modulus exhibits an approximately linear increase with rising reinforcement content [6]. However, once the volume fraction surpasses a critical threshold, issues such as particle agglomeration, interfacial debonding, and increased porosity become more pronounced, slowing or even reversing the modulus enhancement trend [7]. Liu et al. [8] fabricated a 10 vol.% SiC/2024 composite via powder metallurgy. The composite exhibited a yield strength of 257 MPa, an ultimate tensile strength of 350 MPa, and an elongation of 4.4%. Similarly, Chen et al. [9] produced a 0.5 wt.% SiC/2024 composite using powder metallurgy, reporting a yield strength of 188.3 MPa, an ultimate tensile strength of 354.27 MPa, and an elongation of 4.44%. Heat treatment can further enhance the mechanical properties of composites. Wang et al. [10] fabricated the TiB2/2024 composite component using selective laser melting (SLM). Their study found that after T6 heat treatment, the TiB2 particles were homogeneously distributed within the aluminum matrix, the grains were notably refined, and the originally precipitated coarse secondary phases dissolved, leading to a significant enhancement in material properties. The mechanical behavior also depends on particle volume fraction, with tensile strength and elongation showing nonlinear variations. At lower fractions, reinforcement particles strengthen the matrix by refining grains, impeding dislocation motion, and sharing the applied load, though at the expense of reduced ductility due to disrupted matrix continuity. Beyond this range, particle clustering and poor interfacial bonding lead to a decline in tensile strength. During turning, higher reinforcement contents amplify cutting forces and accelerate tool wear. The intensified friction and impact between hard particles and the cutting edge induce edge chipping and abrasive wear, resulting in increased surface roughness, while particle pull-out or fracture may cause surface microcracks [11]. Although the wear morphology of cutting tools does not change significantly with varying SiC particle volume fractions, the wear amount and rate differ substantially. When machining SiC/Al composite with low particle fractions, tool wear develops slowly and remains minimal; however, for high-volume-fraction composites, tool wear intensifies sharply with increasing cutting distance. It can be observed that the elastic modulus and machining performance of the composites are primarily governed by the volume fraction of reinforcement particles.
TiB2, SiC, and diamond all possess high hardness and elastic modulus, making them suitable reinforcements for aluminum matrix composites [12]. By maintaining a constant elastic modulus of the composite and selecting reinforcement particles with a higher elastic modulus, the required volume fraction of reinforcements can be reduced. This strategy ensures high elastic modulus and strength while further enhancing the machining properties of the composites. Additionally, the application of appropriate heat treatment processes is expected to further optimize both its mechanical and machining properties. Ultimately, this study aims to develop a particle-reinforced aluminum matrix composite that achieves an ideal combination of high elastic modulus, excellent strength, and superior machining properties.

2. Materials and Methods

2.1. Materials and Preparation

This study employed spherical 2024 aluminum alloy powder as the matrix, with an average particle size of 13 μm (range: 10–15 μm, with over 80% at 13 μm). The chemical composition of the alloy is listed in Table 1. The reinforcements consisted of angular and irregular TiB2 (Qinghe County Science and Technology Metallurgical Materials, Hebei, China), diamond (Henan Zhenzuan Abrasives Co., Ltd., Henan, China), and SiC (Shanghai Weibang Metal New Materials, Shanghai, China) particles with an average size of 7 μm (range: 5–10 μm, with over 80% at 7 μm), as well as SiC particles with an average size of 25 μm (range: 20–25 μm, with over 80% at 25 μm). The morphology of some of the powder is shown in Figure 1.
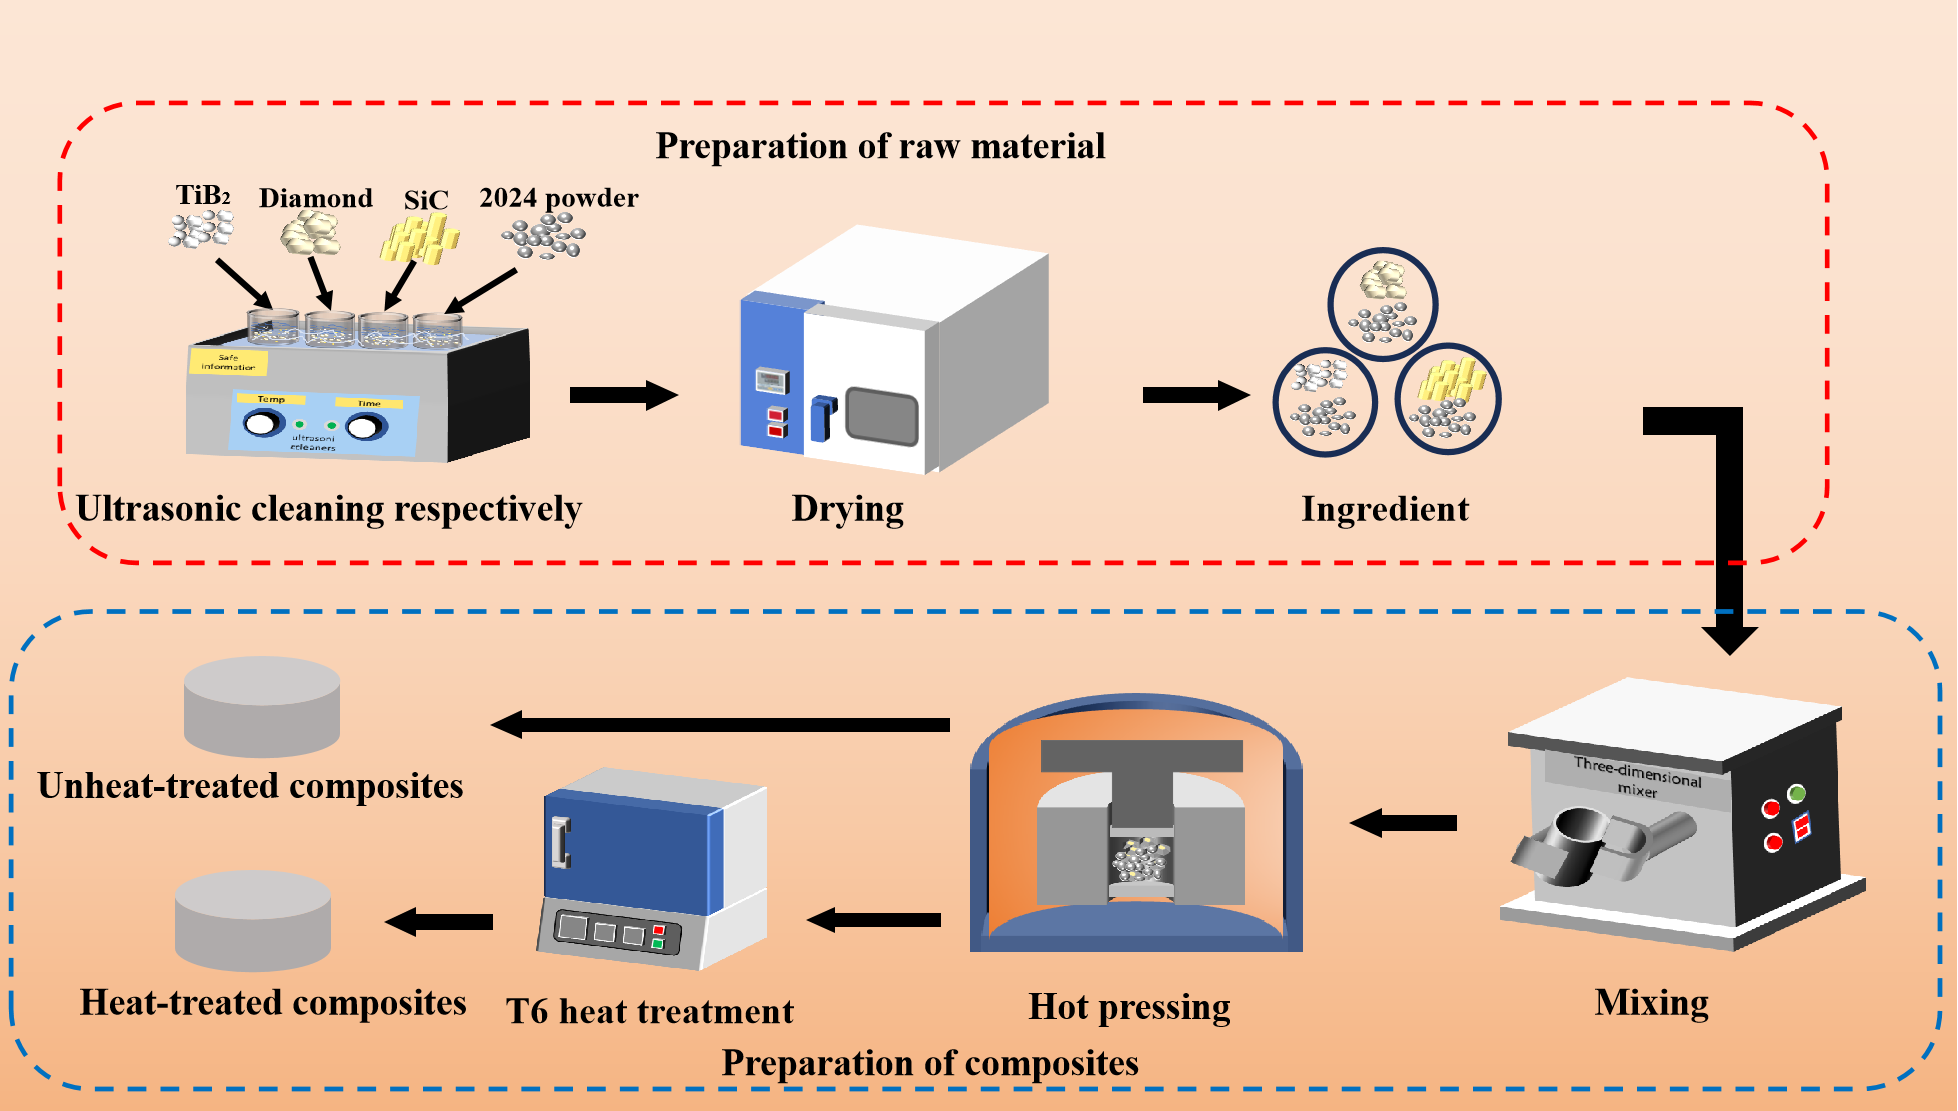
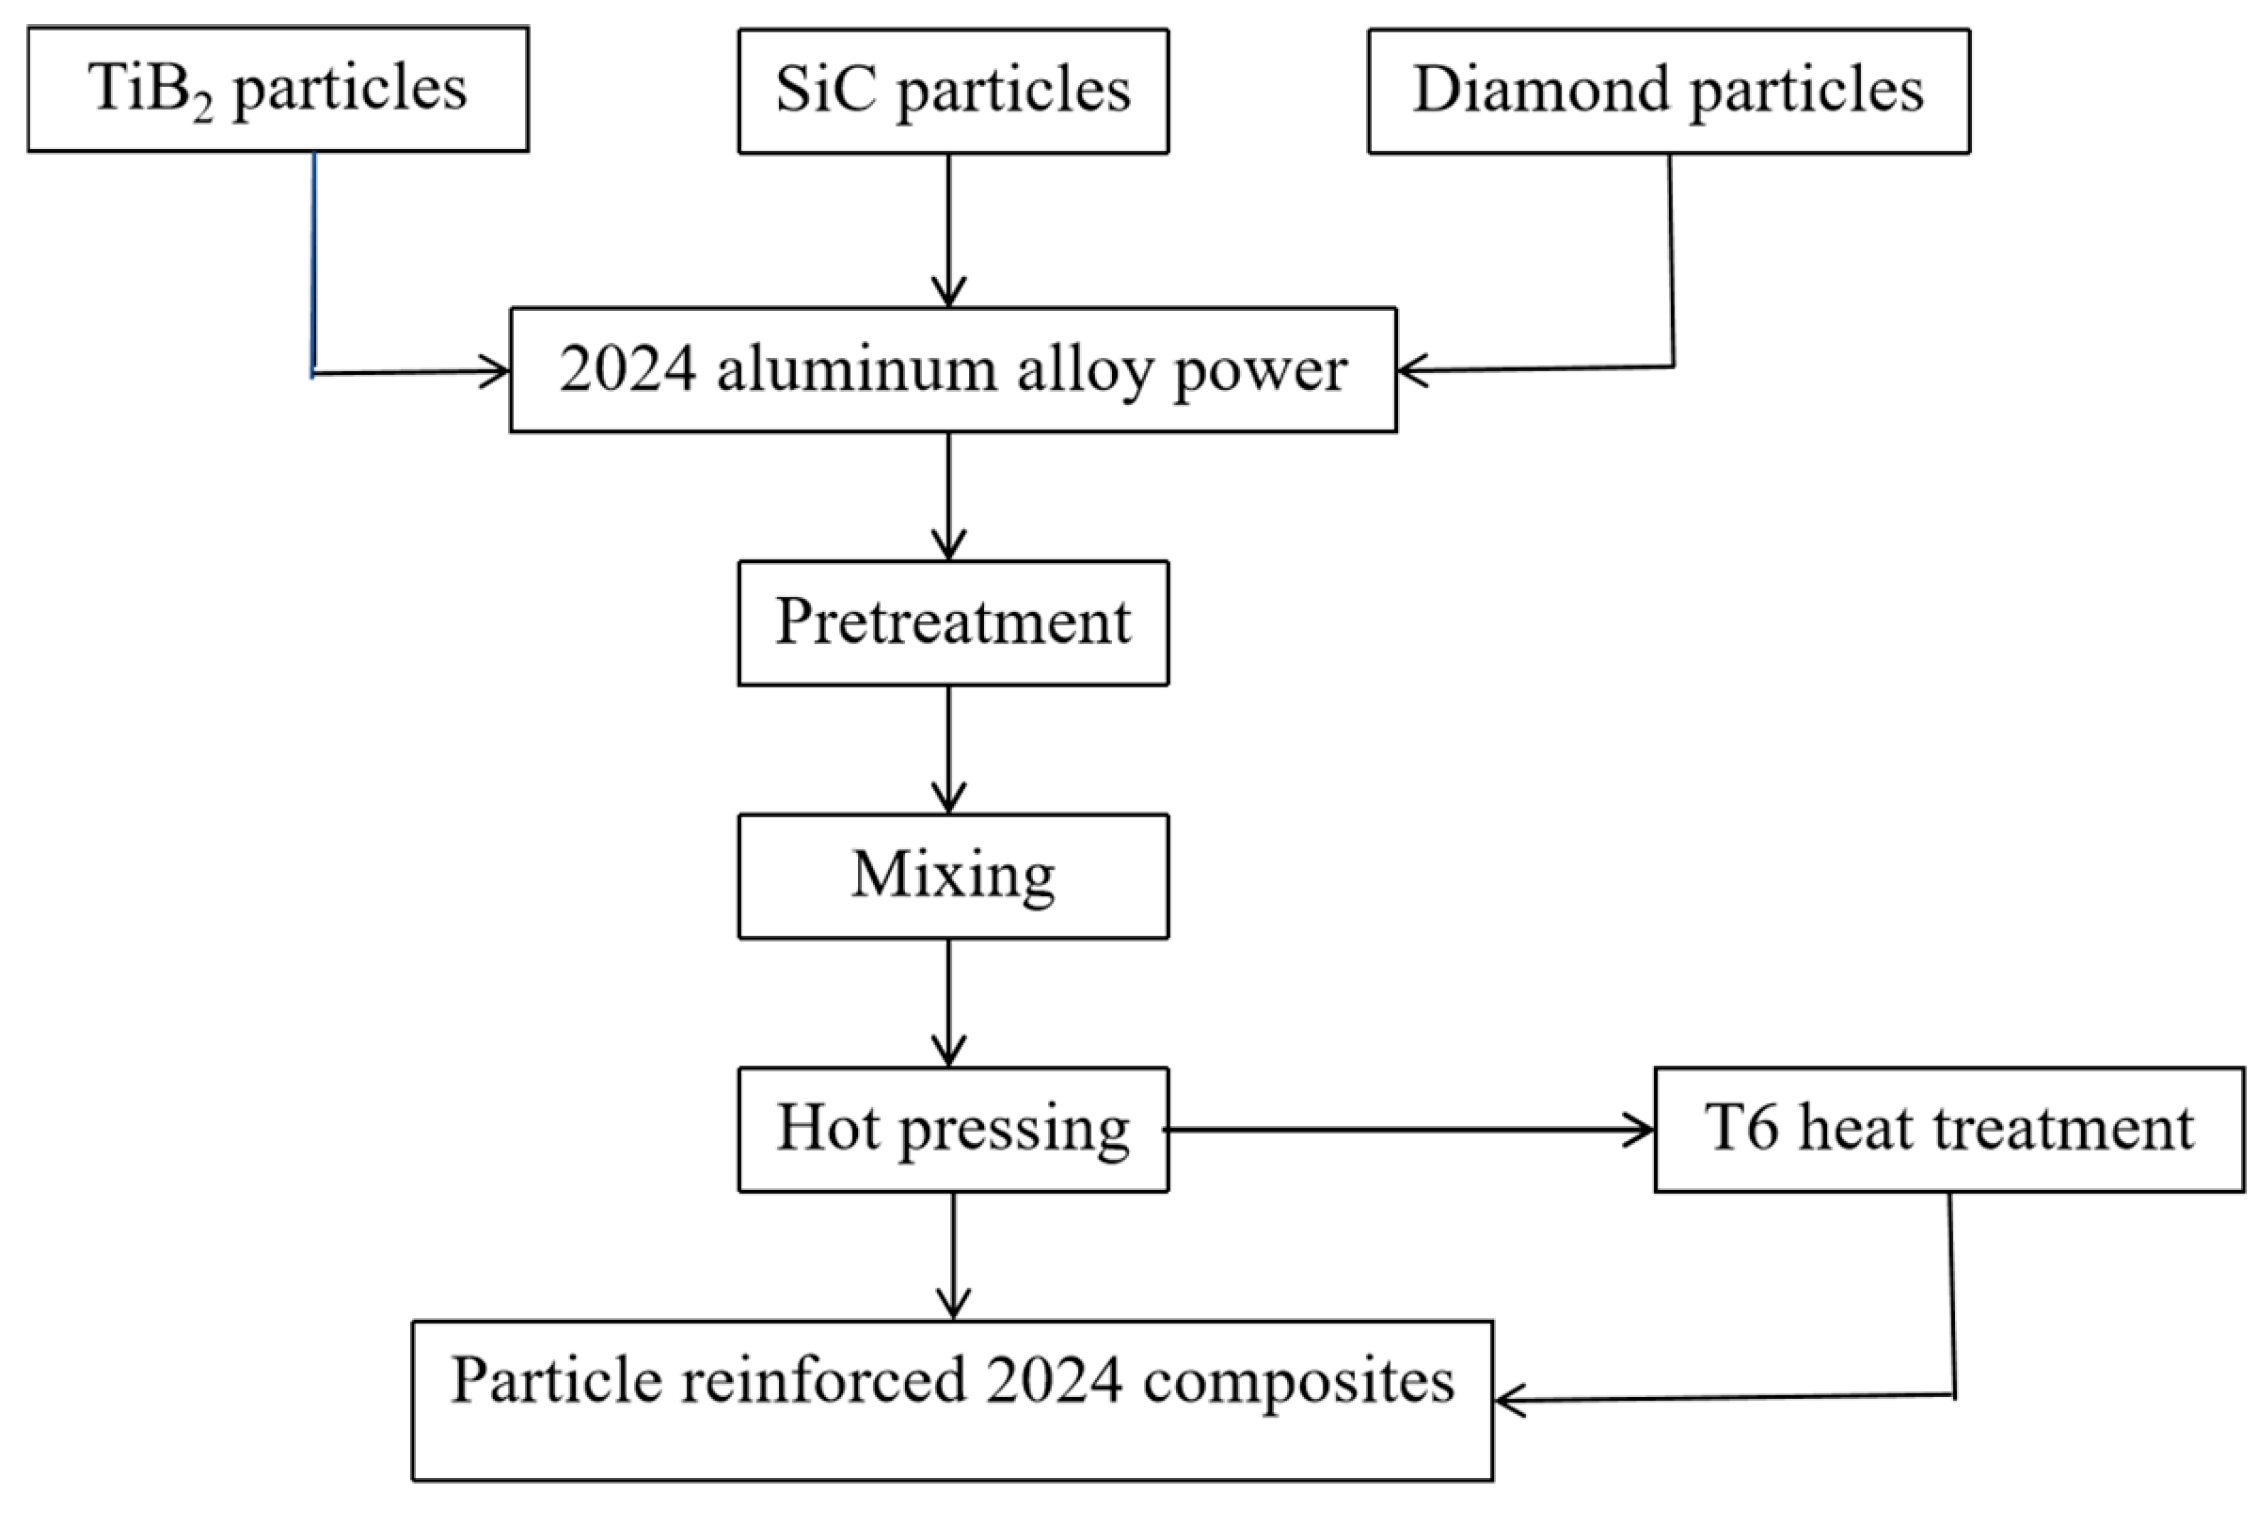
The composites were fabricated using the powder metallurgy process. Initially, the powders were pretreated to remove surface impurities and then prepared according to the experimental procedure. Using the mixing rule, the elastic moduli of 35 vol.% SiC/2024, 15 vol.% diamond/2024, and 27 vol.% TiB2/2024 composite were calculated to be comparable. The pretreated powders were uniformly mixed using a 3D mixer, after which an appropriate amount of the mixed powder was loaded into a hot-pressing mold, assembled, and placed in a hot-pressing furnace. Under an argon atmosphere, gradient compaction was performed at pressures of 20–100 MPa and within the semi-solid temperature range of 2024 aluminum alloy (490–560 °C). After sample preparation, the relative density was measured using the water displacement method. Samples with a relative density of 100% were selected for further investigation. The detailed experimental process is illustrated in Figure 2. To further enhance the mechanical strength of the composite material, a T6 heat treatment was applied to the particle-reinforced 2024 composite, consisting of solution treatment at 495 °C for 1 h, water quenching, aging at 190 °C for 10 h, and subsequent air cooling. The sample designations and processing parameters are listed in Table 2.

2.2. Test and Characterization Methods

2.2.1. Characterization of Microstructure

The metallographic structures of the composites were analyzed and characterized using a metallographic microscope. The microstructure, precipitated phases, and interfacial characteristics were examined with a scanning electron microscope (SEM). Energy-dispersive spectroscopy (EDS) was employed to scan the precipitated phases and analyze their elemental composition. Variations in interfacial element distribution were further investigated through line-scanning analysis. Additionally, an X-ray diffractometer (XRD) was utilized to examine the composites within a 2θ range of 20–90° at a scanning speed of 5°/min. The resulting XRD patterns were analyzed and refined using Jade software (Release 6.5.26@07/02/05), with phase identification carried out by referencing the standard XRD pattern database (PDF).

2.2.2. Characterization of Mechanical Properties

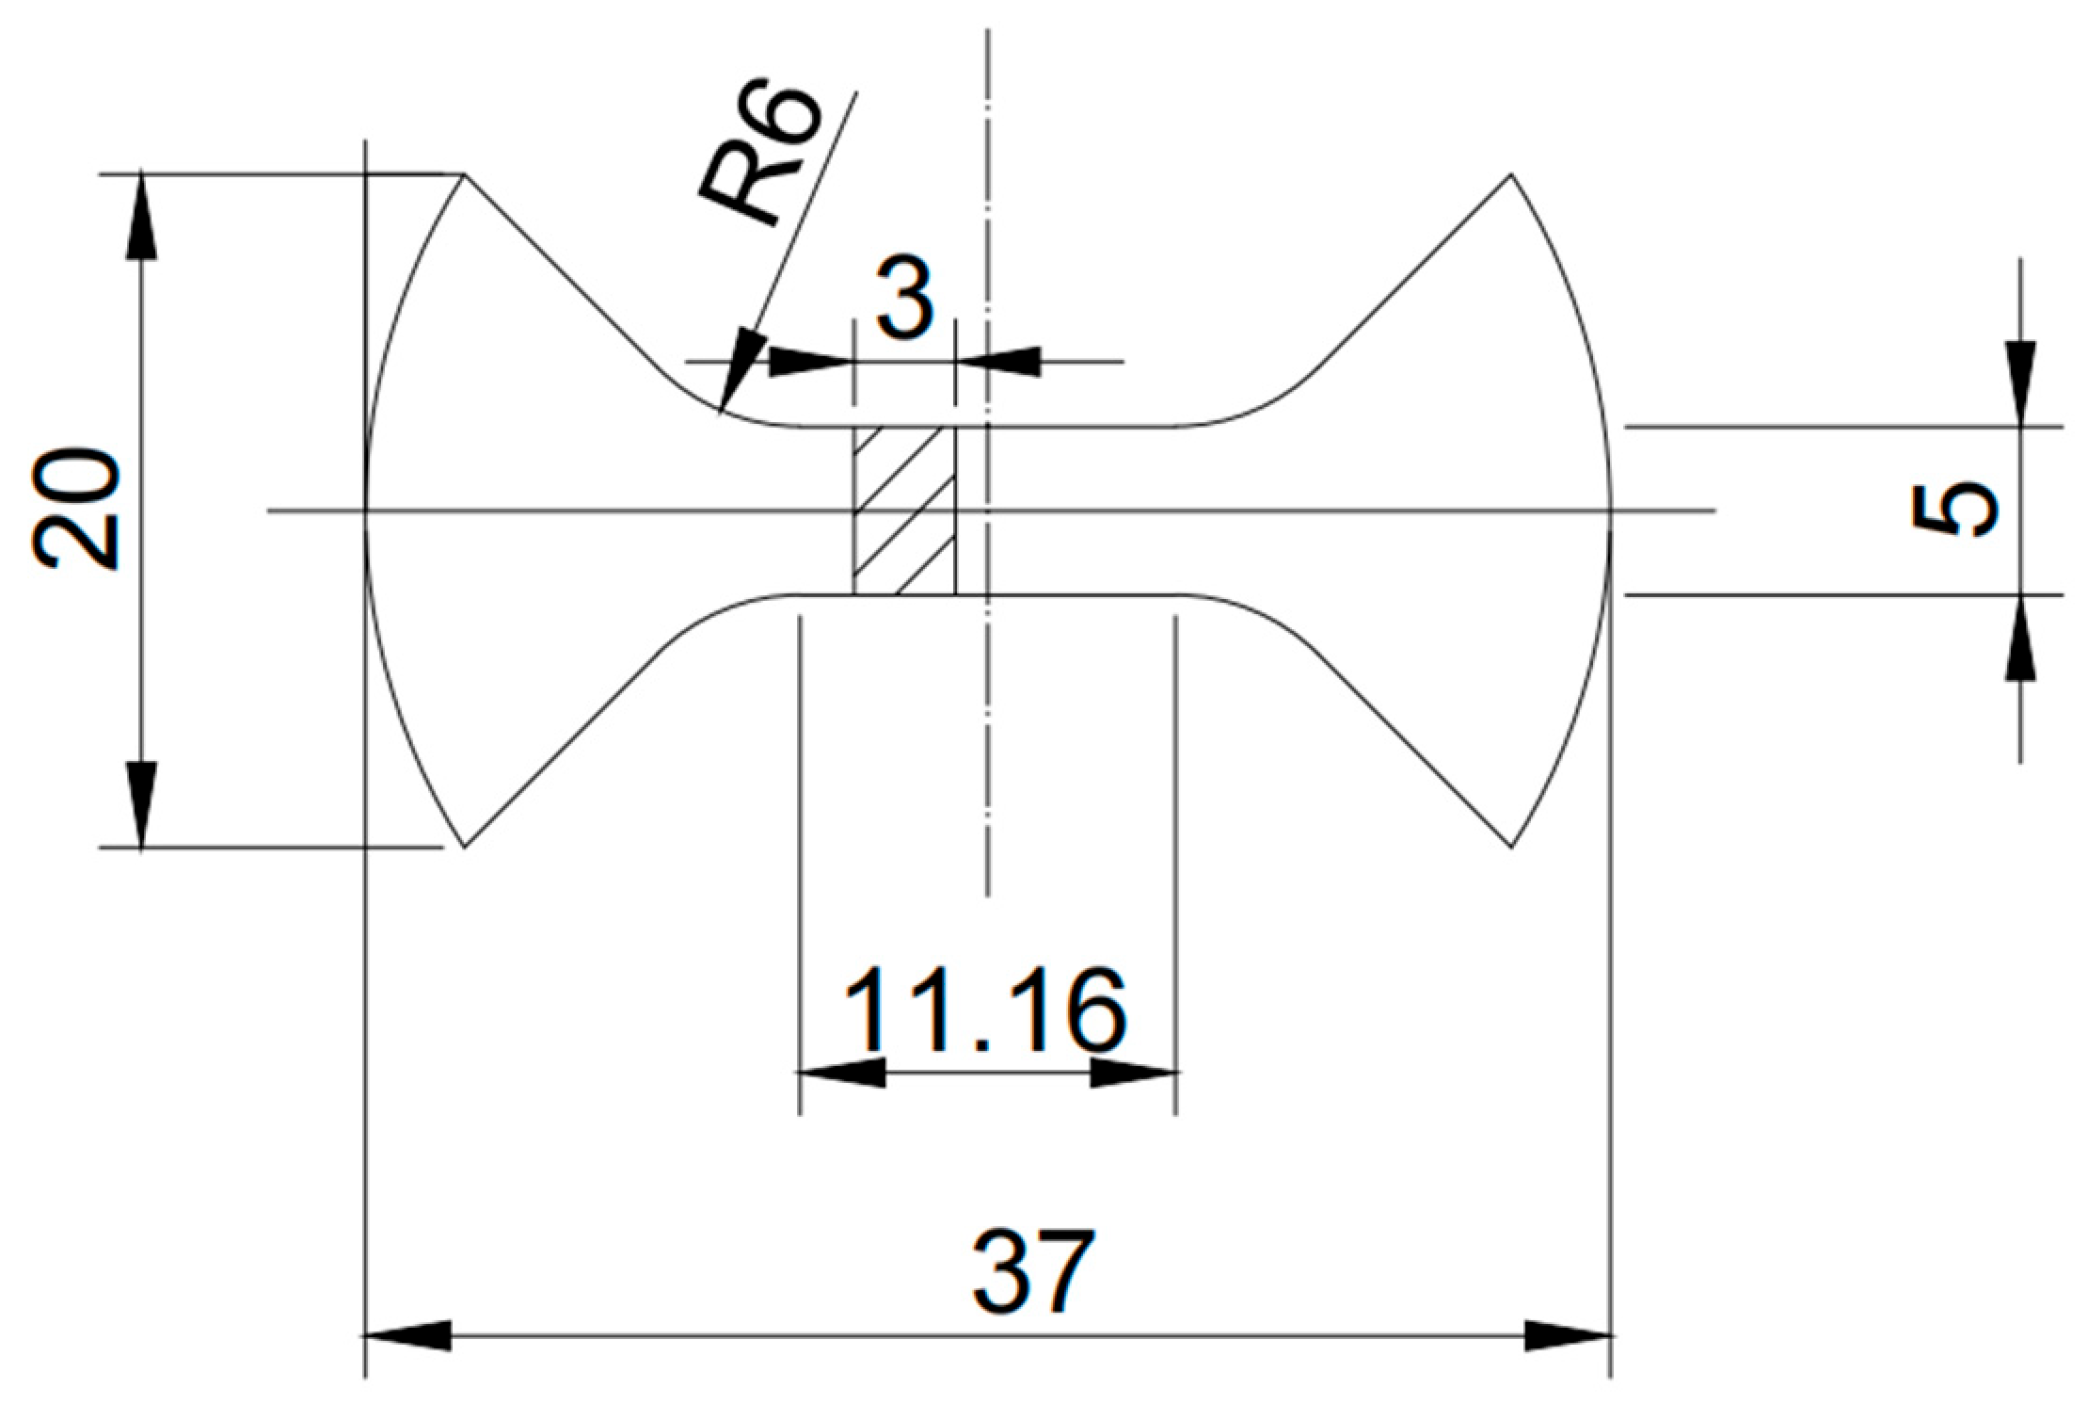
According to the tensile testing standard for metallic materials at room temperature (GB/T 228.1-2021) [13], the tensile specimens were machined into a non-standard geometry, as illustrated in Figure 3, using wire electrical discharge cutting. The tensile strength and elongation of the composites at room temperature were measured using a universal testing machine. Since the composites prepared in this study exhibit brittle behavior, the displacement measured by the machine stroke could not accurately represent the actual deformation of the material. Therefore, the elongation of the composites was determined using an extensometer attached to the universal testing machine. The fracture morphology of the tensile specimens after failure was examined using a SEM. The composites were processed into square test samples with dimensions of 8 mm × 8 mm × 8 mm, which were then ground and polished until surface scratches were completely eliminated.

2.2.3. Characterization of Machining Properties

The machining performance of the composites was primarily evaluated in terms of surface roughness, surface defects, and tool wear rate. The faces of the composite samples with dimensions of 37 mm in diameter and 18 mm in height were turned. A new cutting edge was employed for each experimental group to minimize the influence of extraneous variables. Dry machining tests were performed on composites using a conventional lathe and a PCD tool. The PCD tools used in this study were provided by SELLENA Company; the parameters are as follows: heat resistance: 700–800 °C; hardness: >8000 HV; thermal conductivity: 700 W/m·K; coefficient of thermal expansion: 0.9–1.18 (10–6/K). The tools used in the experiments had a corner radius R4 and a rake angle of 0°. The cutting parameters were set as follows: spindle speed n = 500 r/min, feed f = 0.012 mm/rev, and depth of cut ap = 0.01 mm. The surface morphology of the machined samples, as well as the tool wear before and after turning, was observed using a metallographic microscope. A white light interferometer was utilized to analyze surface topography, with a scanning range of 130 μm × 130 μm and a resolution of 550 × 550 scanning points. Three-dimensional surface maps were generated to assess the processed surface morphology. The surface roughness value (Sa) was obtained using the interferometer, based on regional surface topography, to evaluate the overall roughness of the detection plane and more accurately characterize the nonuniform defects present on the machined surfaces. In this study, the experimental conditions, machining parameters, and characterization methods were strictly identical for all three composites.

3. Results and Discussion

3.1. Microstructure of Composites

3.1.1. Microstructure of TiB2/2024 Composite with Different TiB2 Particle Sizes

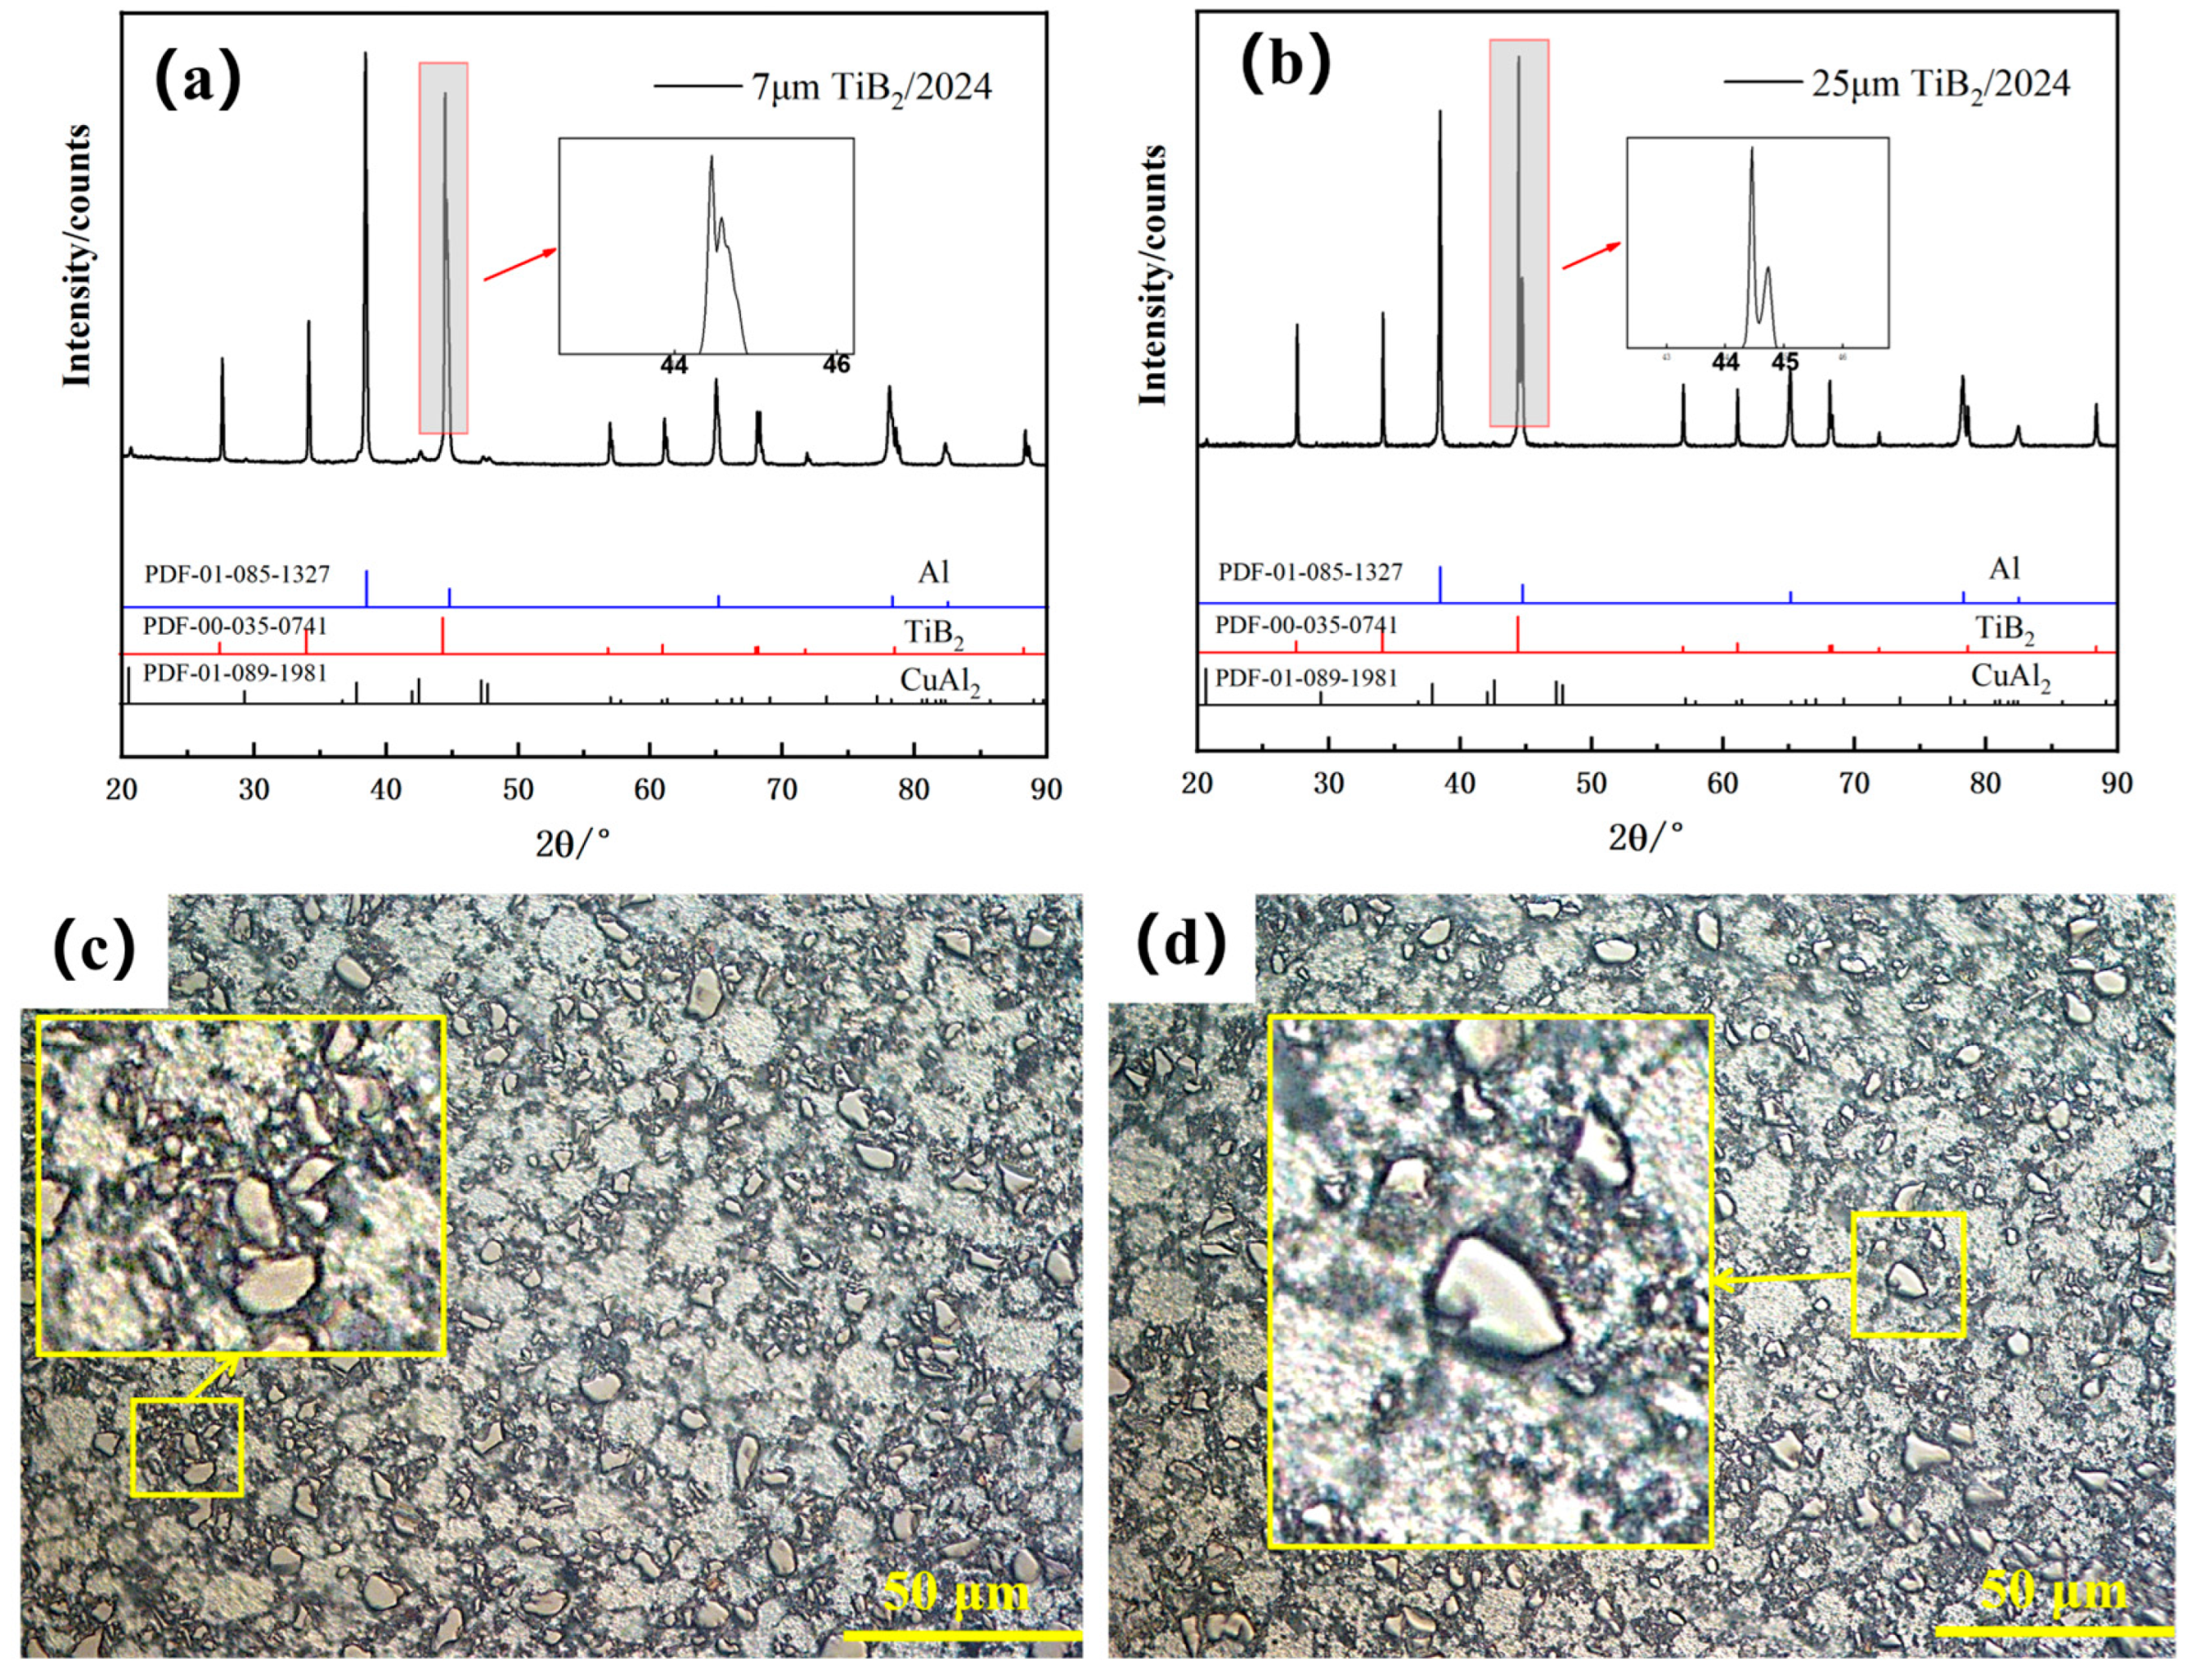
The XRD patterns and metallographic structures of the 27 vol.% TiB2/2024 composite prepared with 7 μm and 25 μm TiB2 particles are presented in Figure 4. XRD analysis indicates that the phase composition of the TiB2/2024 composite remains consistent across different TiB2 particle sizes, consisting primarily of Al, TiB2, and CuAl2 phases. With increasing TiB2 particle size, the diffraction peak positions and intensities of the composites show no significant variation, suggesting that particle size has minimal influence on phase formation. Metallographic observations reveal that the 2024 aluminum alloy matrix forms a relatively continuous network, with TiB2 particles uniformly dispersed throughout the matrix. However, in the magnified area of Figure 4c, localized agglomeration of the smaller 7 μm TiB2 particles can be observed, while in the magnified area of Figure 4d, the damage to the 25 μm TiB2 particles is more pronounced. This difference can be attributed to the lower surface energy and weaker van der Waals interactions of larger particles, which reduce their tendency to agglomerate but make them more susceptible to collision-induced damage during the preparation process.
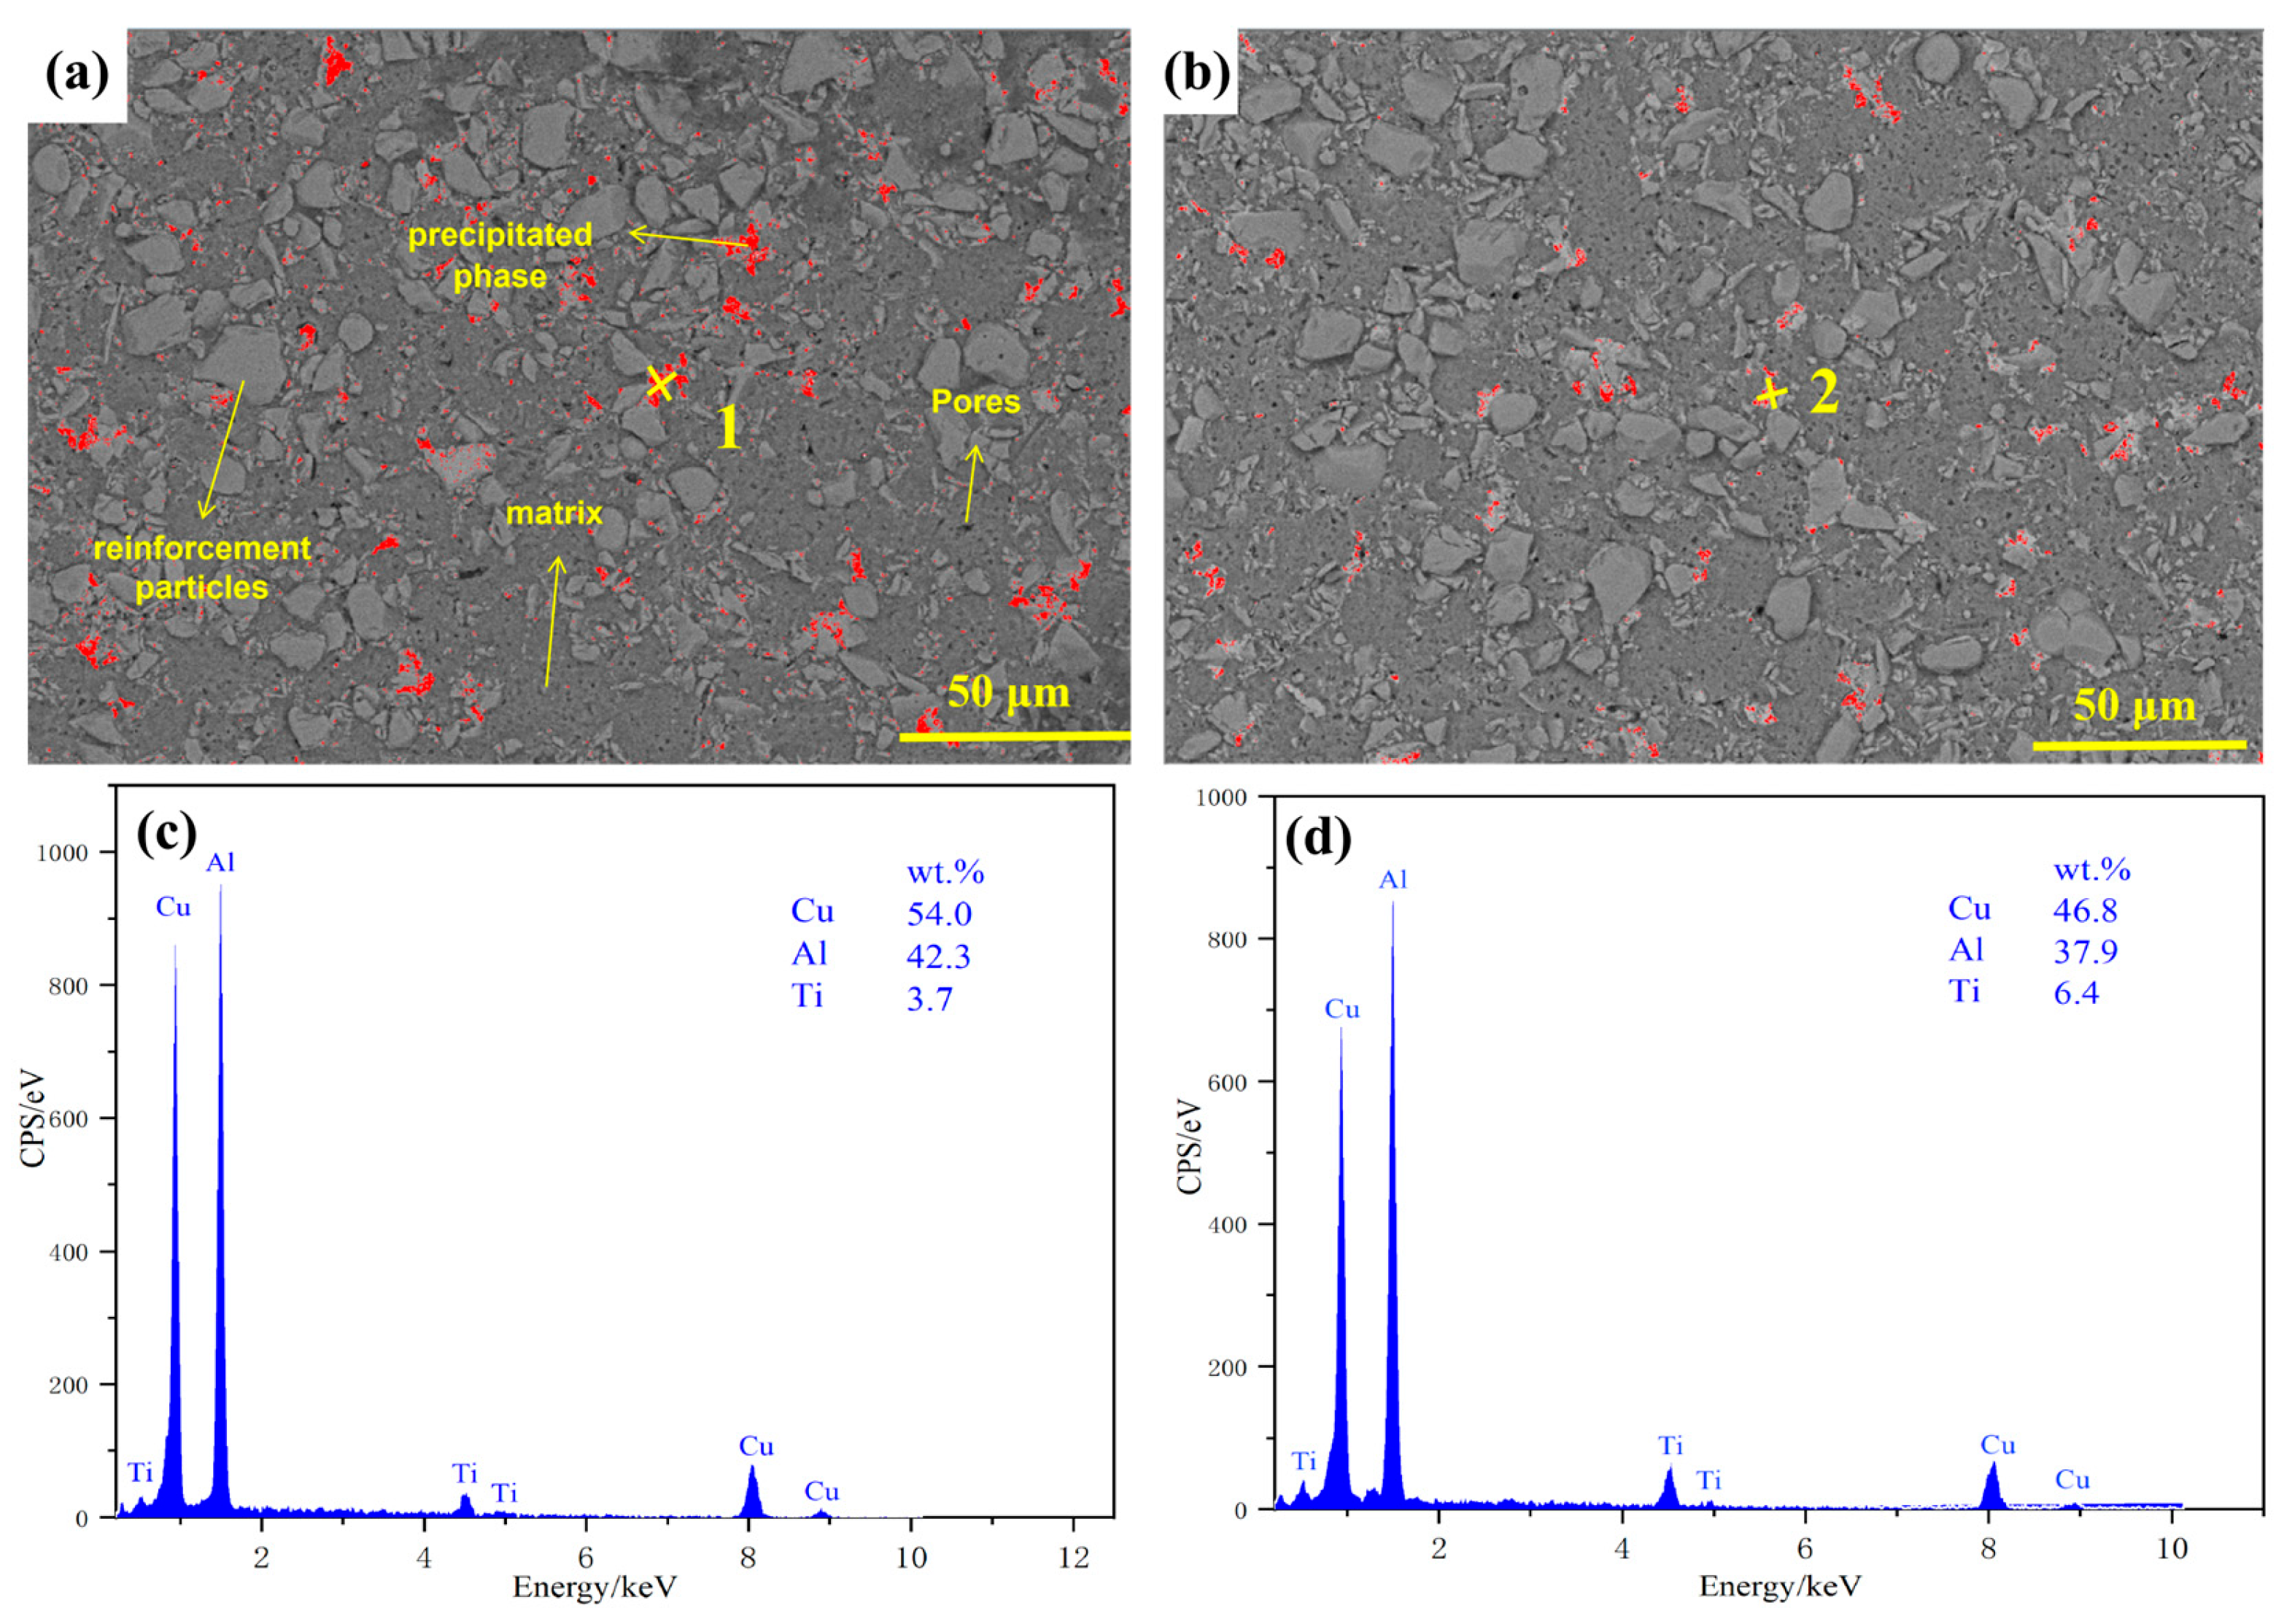
Figure 5 presents the backscattered electron (BSE) images and EDS analyses of the 2024 aluminum matrix composites reinforced with 27 vol.% TiB2 particles of 7 μm and 25 μm sizes. A comparison between Figure 5a,b shows that the composite containing 25 μm TiB2 particles exhibits a slight reduction in the quantity of the red precipitated phase compared with the composite reinforced with 7 μm TiB2 particles; the area fractions of the red phase were measured to be 1.3% and 0.61%, respectively. However, the phase size remains similar (3–10 μm) and displays flake-like or columnar morphologies. The overall distribution of the precipitated phase is relatively uniform, though localized interfacial segregation is evident. This behavior can be attributed to the lower specific surface area of larger TiB2 particles, which decreases their interfacial contact area with the aluminum matrix, thereby reducing the number of active nucleation sites available for precipitate formation. Moreover, the thermal mismatch stress induced by the larger particles is relatively low (owing to their larger volume but smaller number), leading to a reduced dislocation density in the surrounding matrix. Since dislocations act as essential nucleation sites for precipitation, their reduction directly suppresses the formation of the precipitated phase. EDS analysis confirms that the precipitated phase primarily consists of Al and Cu elements, indicating a binary Al–Cu eutectic composition. Combined with the XRD results, the bright red phase is identified predominantly as the CuAl2 phase.

3.1.2. Microstructure of Composites with Different Reinforcements

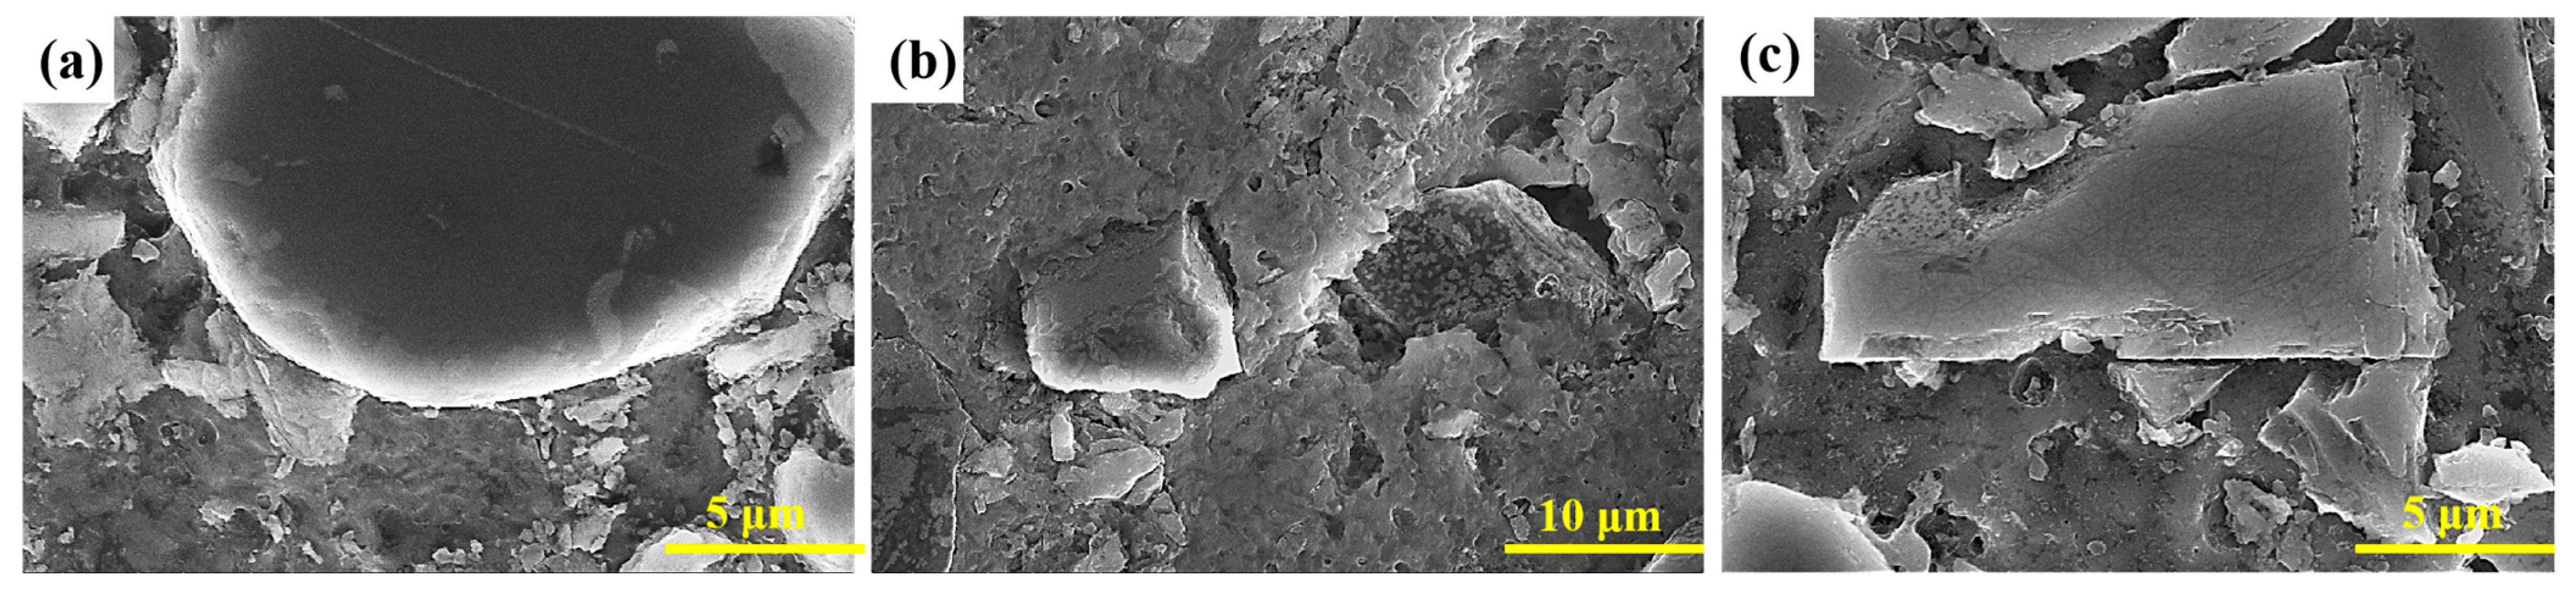
Figure 6 displays the SEM images of the interfacial morphologies of TiB2-, diamond-, and SiC-reinforced 2024 aluminum matrix composites, revealing distinct differences in their bonding characteristics. The surface of TiB2 particles appears smooth with rounded edges and corners, forming a flat and dense interface with the aluminum matrix. No visible pores or cracks are observed, and only a few fine particles are present at the interface. Zhang et al. [14] observed the TiB2/A390 composite using transmission electron microscopy (TEM) and found that the interface between TiB2 particles and the α-Al matrix was seamless and tightly bonded, with no impurities present. The excellent interfacial bonding can be attributed to the favorable particle geometry, which reduces stress concentration, the excellent wettability between TiB2 and the aluminum matrix, and the minimal structural damage to the particles during hot pressing. The fine interfacial particles are likely derived from agglomeration of fine raw powder particles, crushing during hot pressing, or segregation of eutectic phases within the matrix. In contrast, diamond-reinforced composites exhibit the poorest interfacial bonding. Despite having relatively smooth particle surfaces, evident cracks, voids, and matrix tearing are observed at the interface, with clear signs of matrix adhesion and particle detachment. This deterioration primarily results from the poor wettability between diamond and aluminum (θ > 120°). Although a chemical reaction between diamond and aluminum can form Al4C3, which temporarily enhances bonding strength, Al4C3 is highly unstable and prone to hydrolysis. Additionally, the large mismatch in thermal expansion coefficients generates residual stresses, preventing the formation of a stable chemical bond. For SiC-reinforced composites, the particles exhibit sharp edges and corners, producing a rough interface with small pores and fragmented fine particles. The angular morphology induces localized stress concentration, leading to secondary particle fracture during hot pressing. Moreover, the wettability between SiC and aluminum is moderate (θ ≈ 105°), and the liquid-phase coating formed during processing is incomplete, ultimately resulting in an interface dominated by mechanical rather than metallurgical bonding.
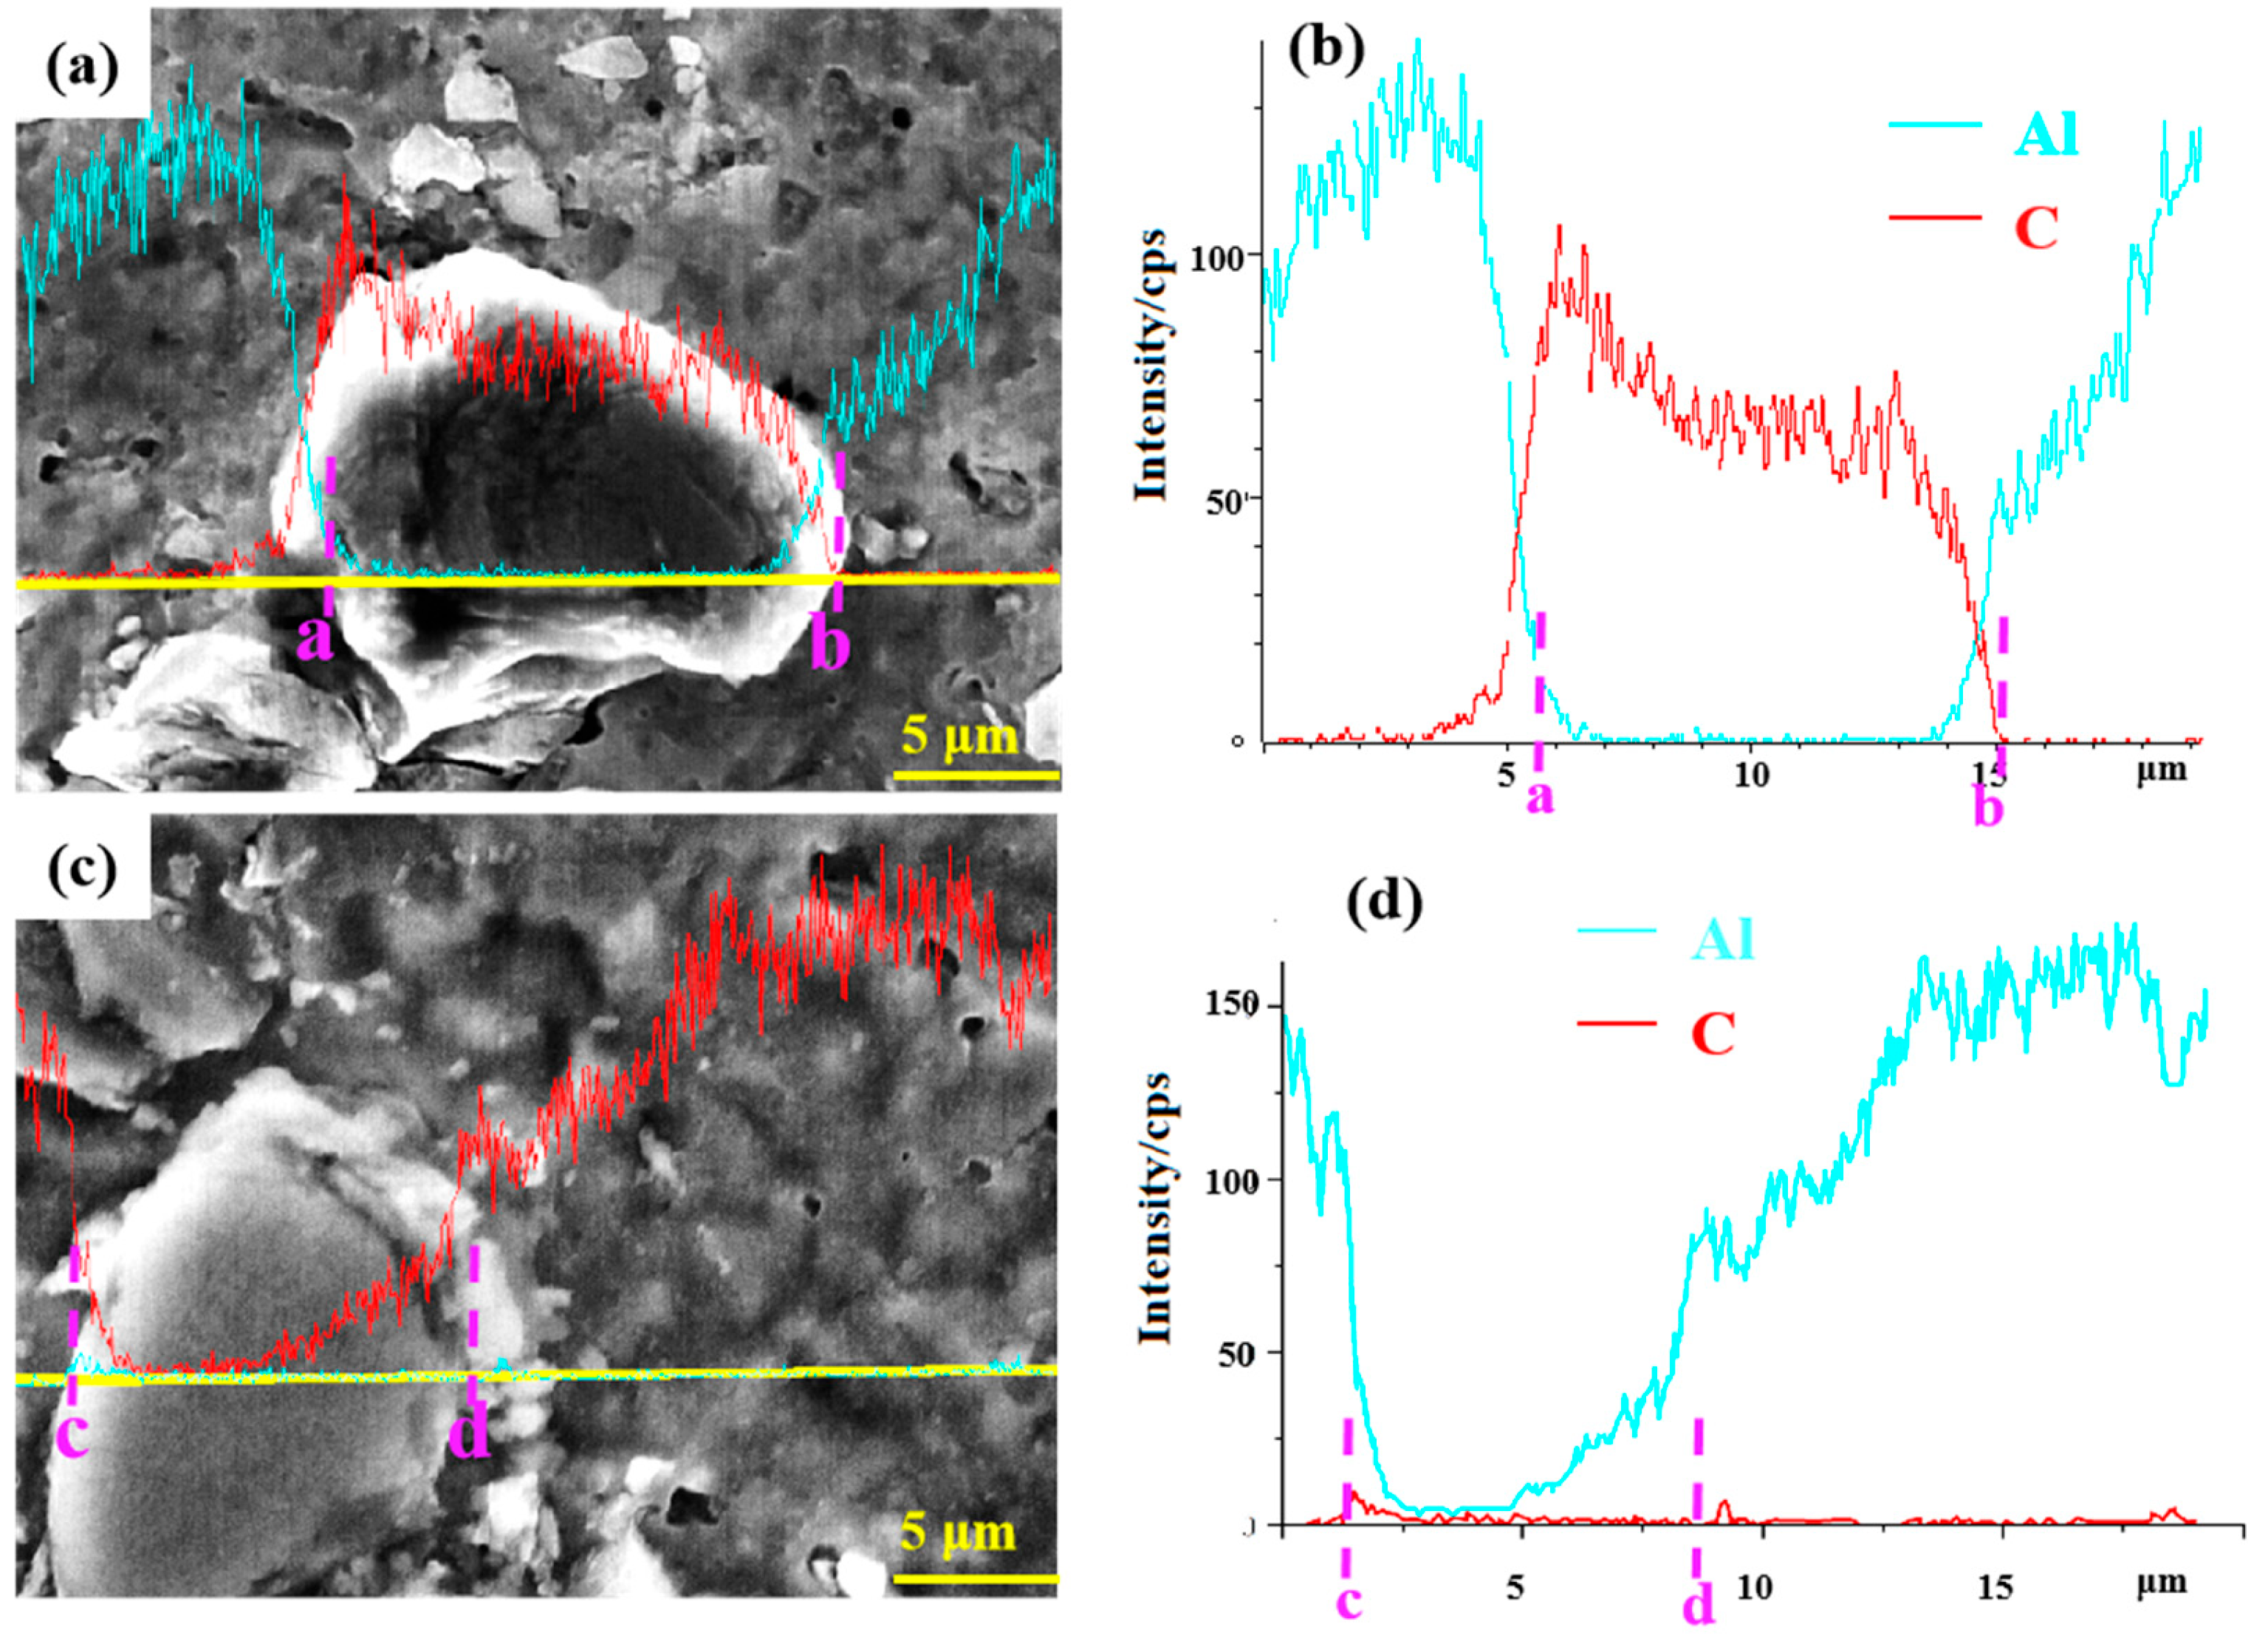
Figure 7 presents the line-scan analysis of the interfaces between the aluminum matrix and the reinforcing particles in the 2024 composite. For the 15 vol.% diamond/2024 composite, the line-scan path is indicated in Figure 7a, and the corresponding elemental distribution results are shown in Figure 7b. A pronounced decrease in the Al content and a simultaneous increase in the C content were observed across the interface. Since the Al signal remained at a detectable level at interface region a and began to rise again before interface region b, the overlapping trends of Al and C distributions indicate the formation of an interfacial Al4C3 phase. Similarly, for the SiC/2024 composite, the line-scan path and results are shown in Figure 7c,d, respectively. Due to the low content of C element, the change in C element content was not significant, but at interface c between the SiC particles and the 2024 matrix, the contents of C and Al elements showed a slight increasing trend, and it is speculated that a small amount of Al4C3 was also formed at the interface.

3.1.3. Microstructure of TiB2/2024 Composite After T6 Heat Treatment

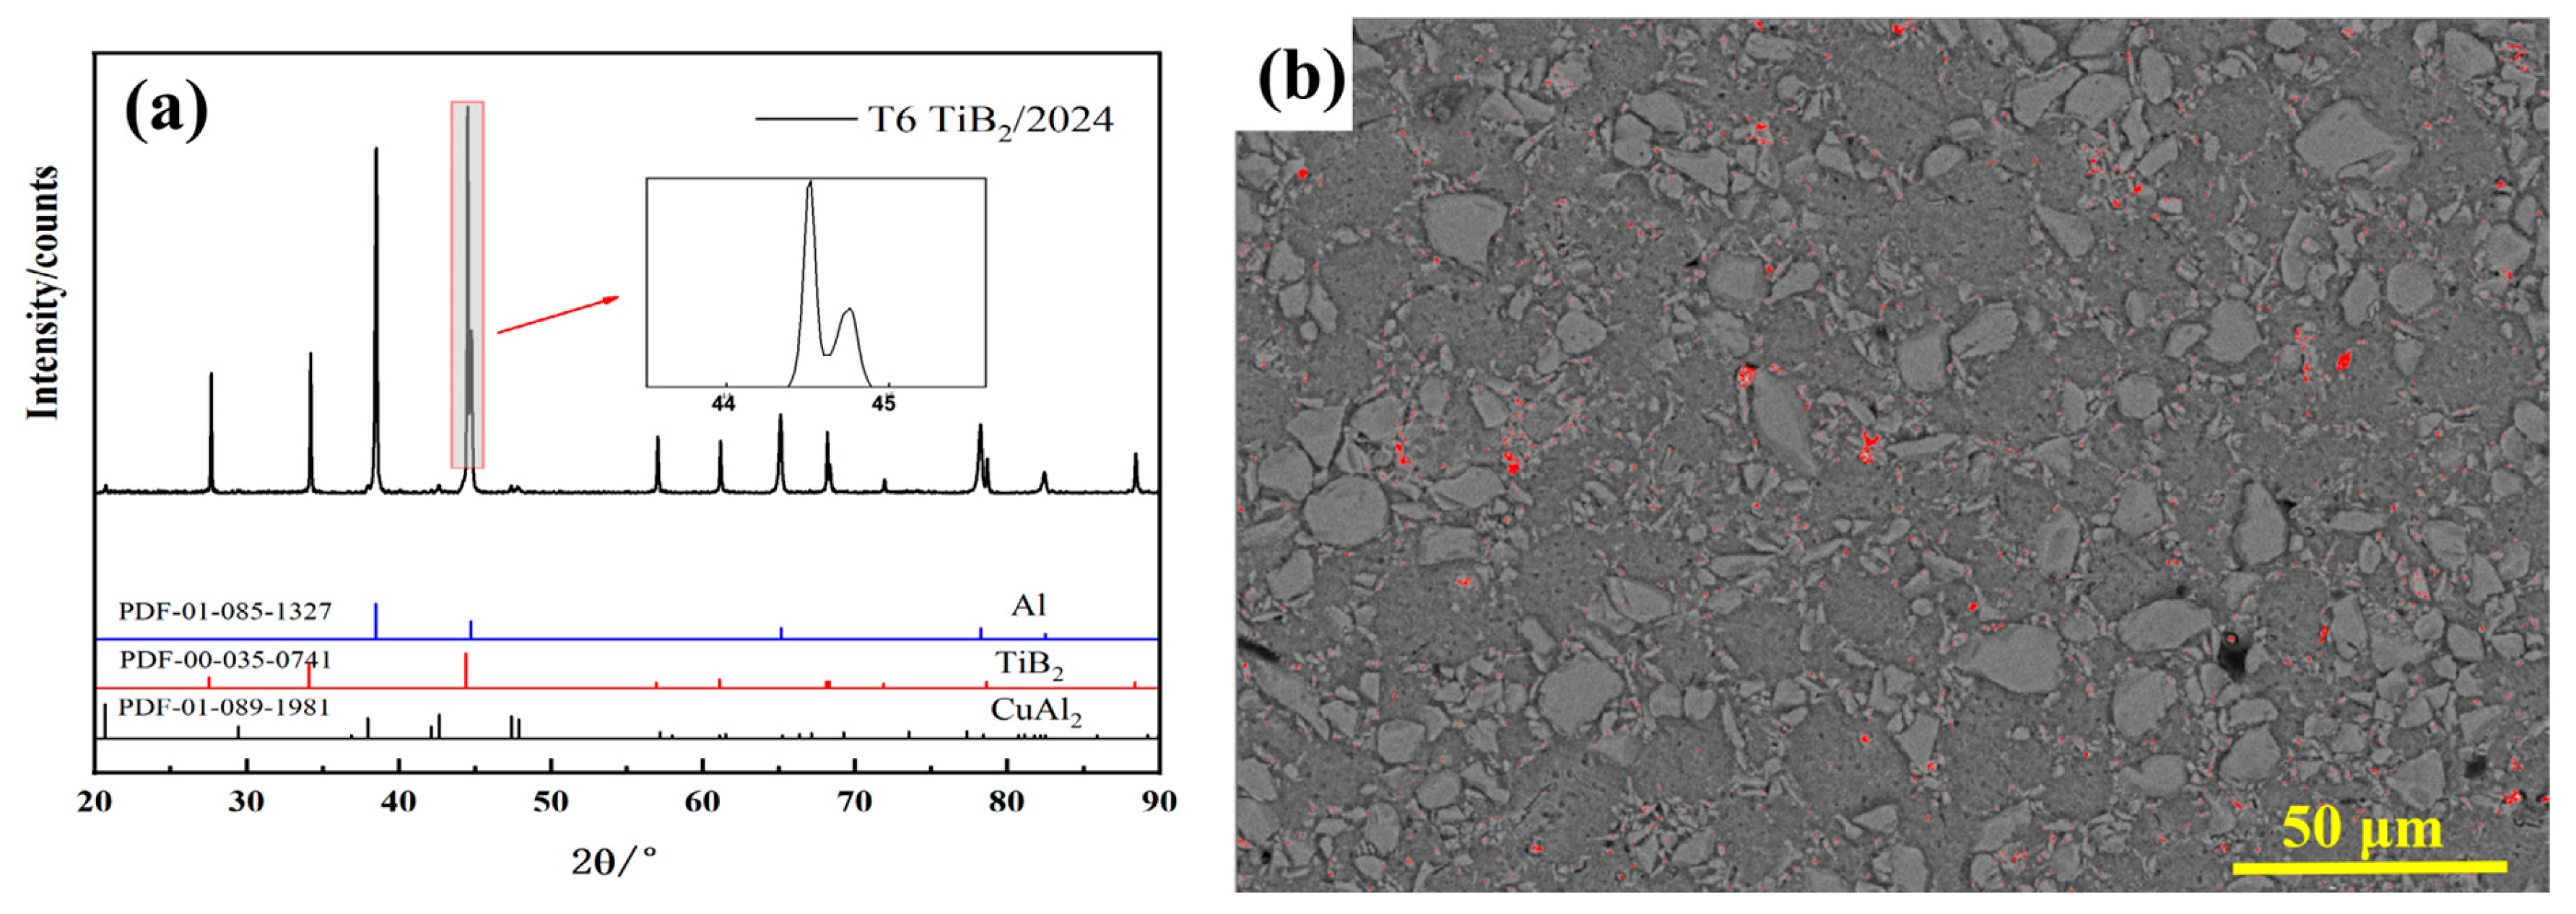
To enhance the mechanical and machining properties of the TiB2/2024 composite, heat treatment was performed. Figure 8 presents the XRD patterns and BSE images of the T6 heat treatment 7 μm, 27 vol.% TiB2/2024 composite. The area fractions of the red phase were measured to be 0.30%, compared with the hot-pressed composites (Figure 5a), the T6 heat treatment samples exhibited a significant reduction in both the quantity and size of the precipitated phases, with the precipitates refined to 1–3 μm and displaying columnar or dendritic morphologies. This refinement is attributed to the partial dissolution of precipitates during heat treatment, leading to the formation of a supersaturated solid solution. Subsequently, Cu and Mg atoms precipitated from the matrix as nano-scale clusters that could not be resolved under SEM observation. XRD analysis confirmed that both the hot-pressed and T6 heat treatment composites consisted of the same phases, Al, TiB2, and CuAl2. However, the CuAl2 diffraction peaks in the T6 heat treatment samples appeared weaker and slightly broadened, indicating reduced crystallinity and smaller particle size of this phase.

3.2. Mechanical Properties of Composites

3.2.1. Mechanical Properties of TiB2/2024 Composite with Different TiB2 Particle Sizes

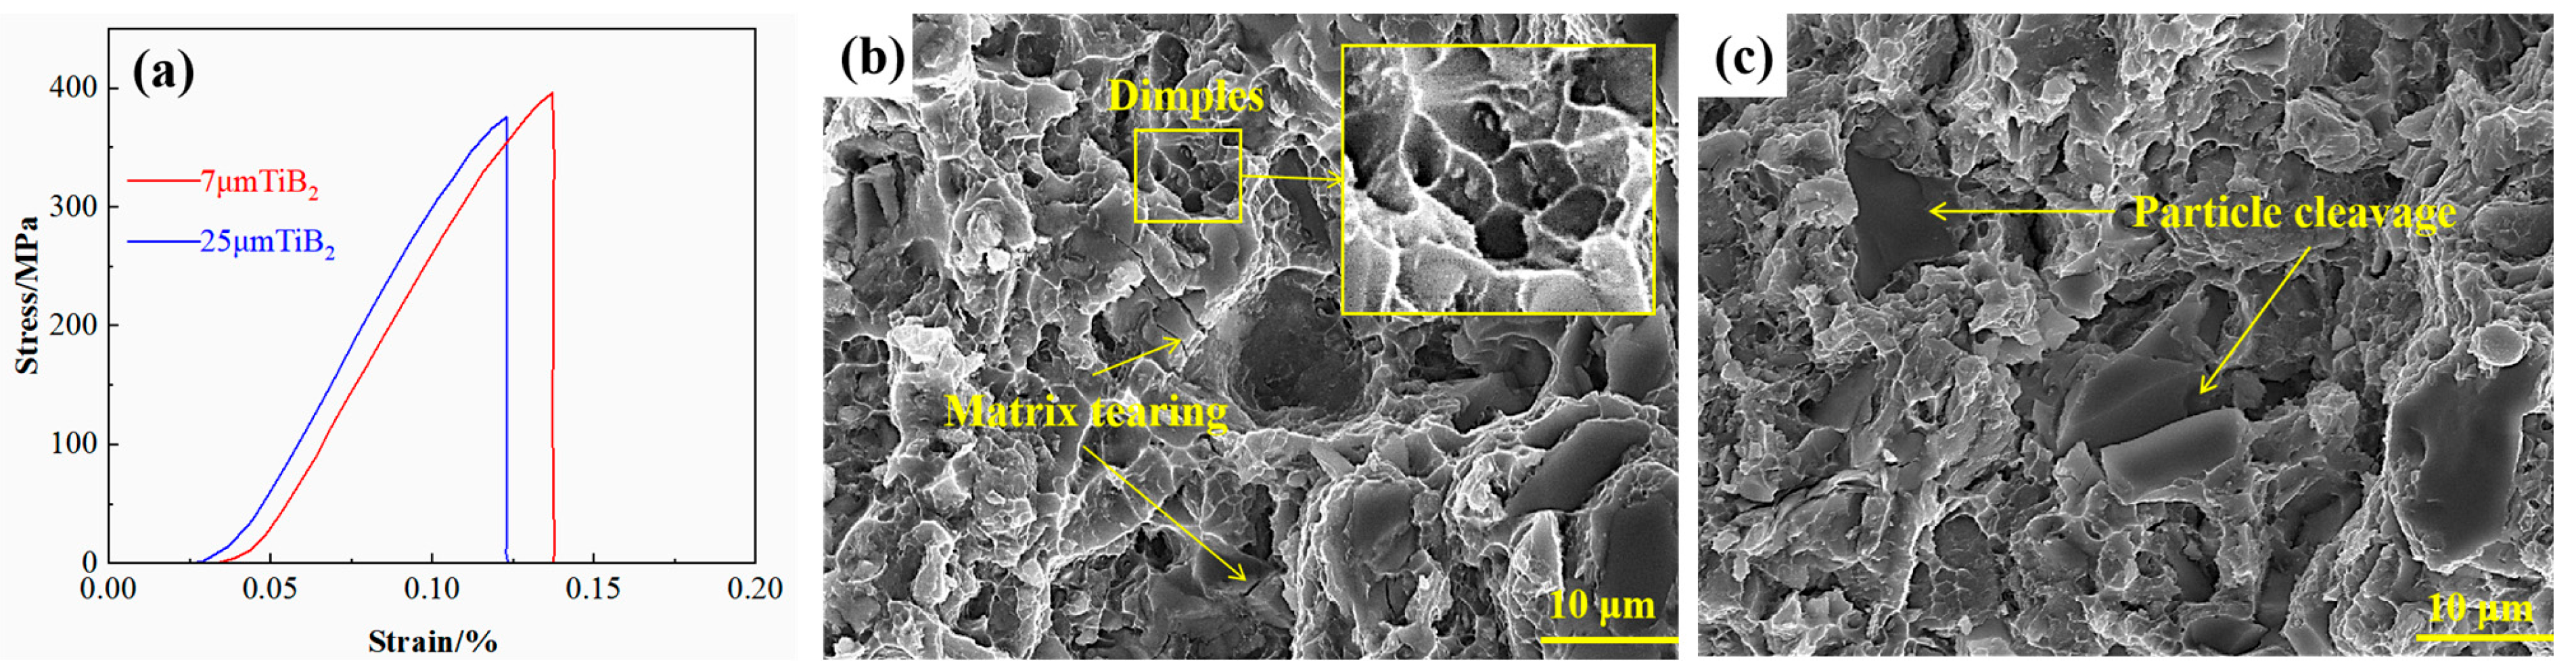
When the matrix of PRAMCs is subjected to an external load, the resulting stress is transferred from the matrix to the reinforcement through the interface, thereby enhancing the material’s load-bearing capacity and constraining matrix deformation to achieve strengthening. The content, size, distribution, and morphology of the reinforcement particles significantly influence the load transfer efficiency of the composites [15,16,17]. Table 3 shows the tensile strength of the 27 vol.% TiB2/2024 composite with different TiB2 particle sizes, while Figure 9 presents their corresponding tensile fracture morphology and tensile stress-strain curves. The results indicate that as the TiB2 particle size increases from 7 μm to 25 μm, the tensile strength of the composites decreases from 397.1 MPa to 371.7 MPa, while the elongation slightly increases to 2.4%; as a reference, the tensile strength of sintered 2024 aluminum alloy is merely 228.2 MPa [18]. The 7 μm TiB2 particles effectively impede dislocation movement through the Orowan strengthening mechanism [19], leading to the formation of more dimples and enhanced tensile strength. However, the tendency of small particles to agglomerate can introduce pore defects, thereby reducing matrix ductility. Conversely, larger particles are more prone to fracture due to pre-existing cracks formed during hot pressing, which diminishes their load-bearing contribution. Fractographic analysis further reveals that cracks preferentially initiate and propagate within the matrix due to the smaller bonding area between the 7 μm particles and the matrix, accompanied by intergranular tearing features. In contrast, the larger 25 μm particles exhibit longer bonding interfaces, and their fracture behavior is dominated by particle cleavage following transgranular fracture. This results in a more direct crack propagation path, enabling energy release and consequently improving the elongation of the material [20].

3.2.2. Mechanical Properties of Different Reinforcement Composites

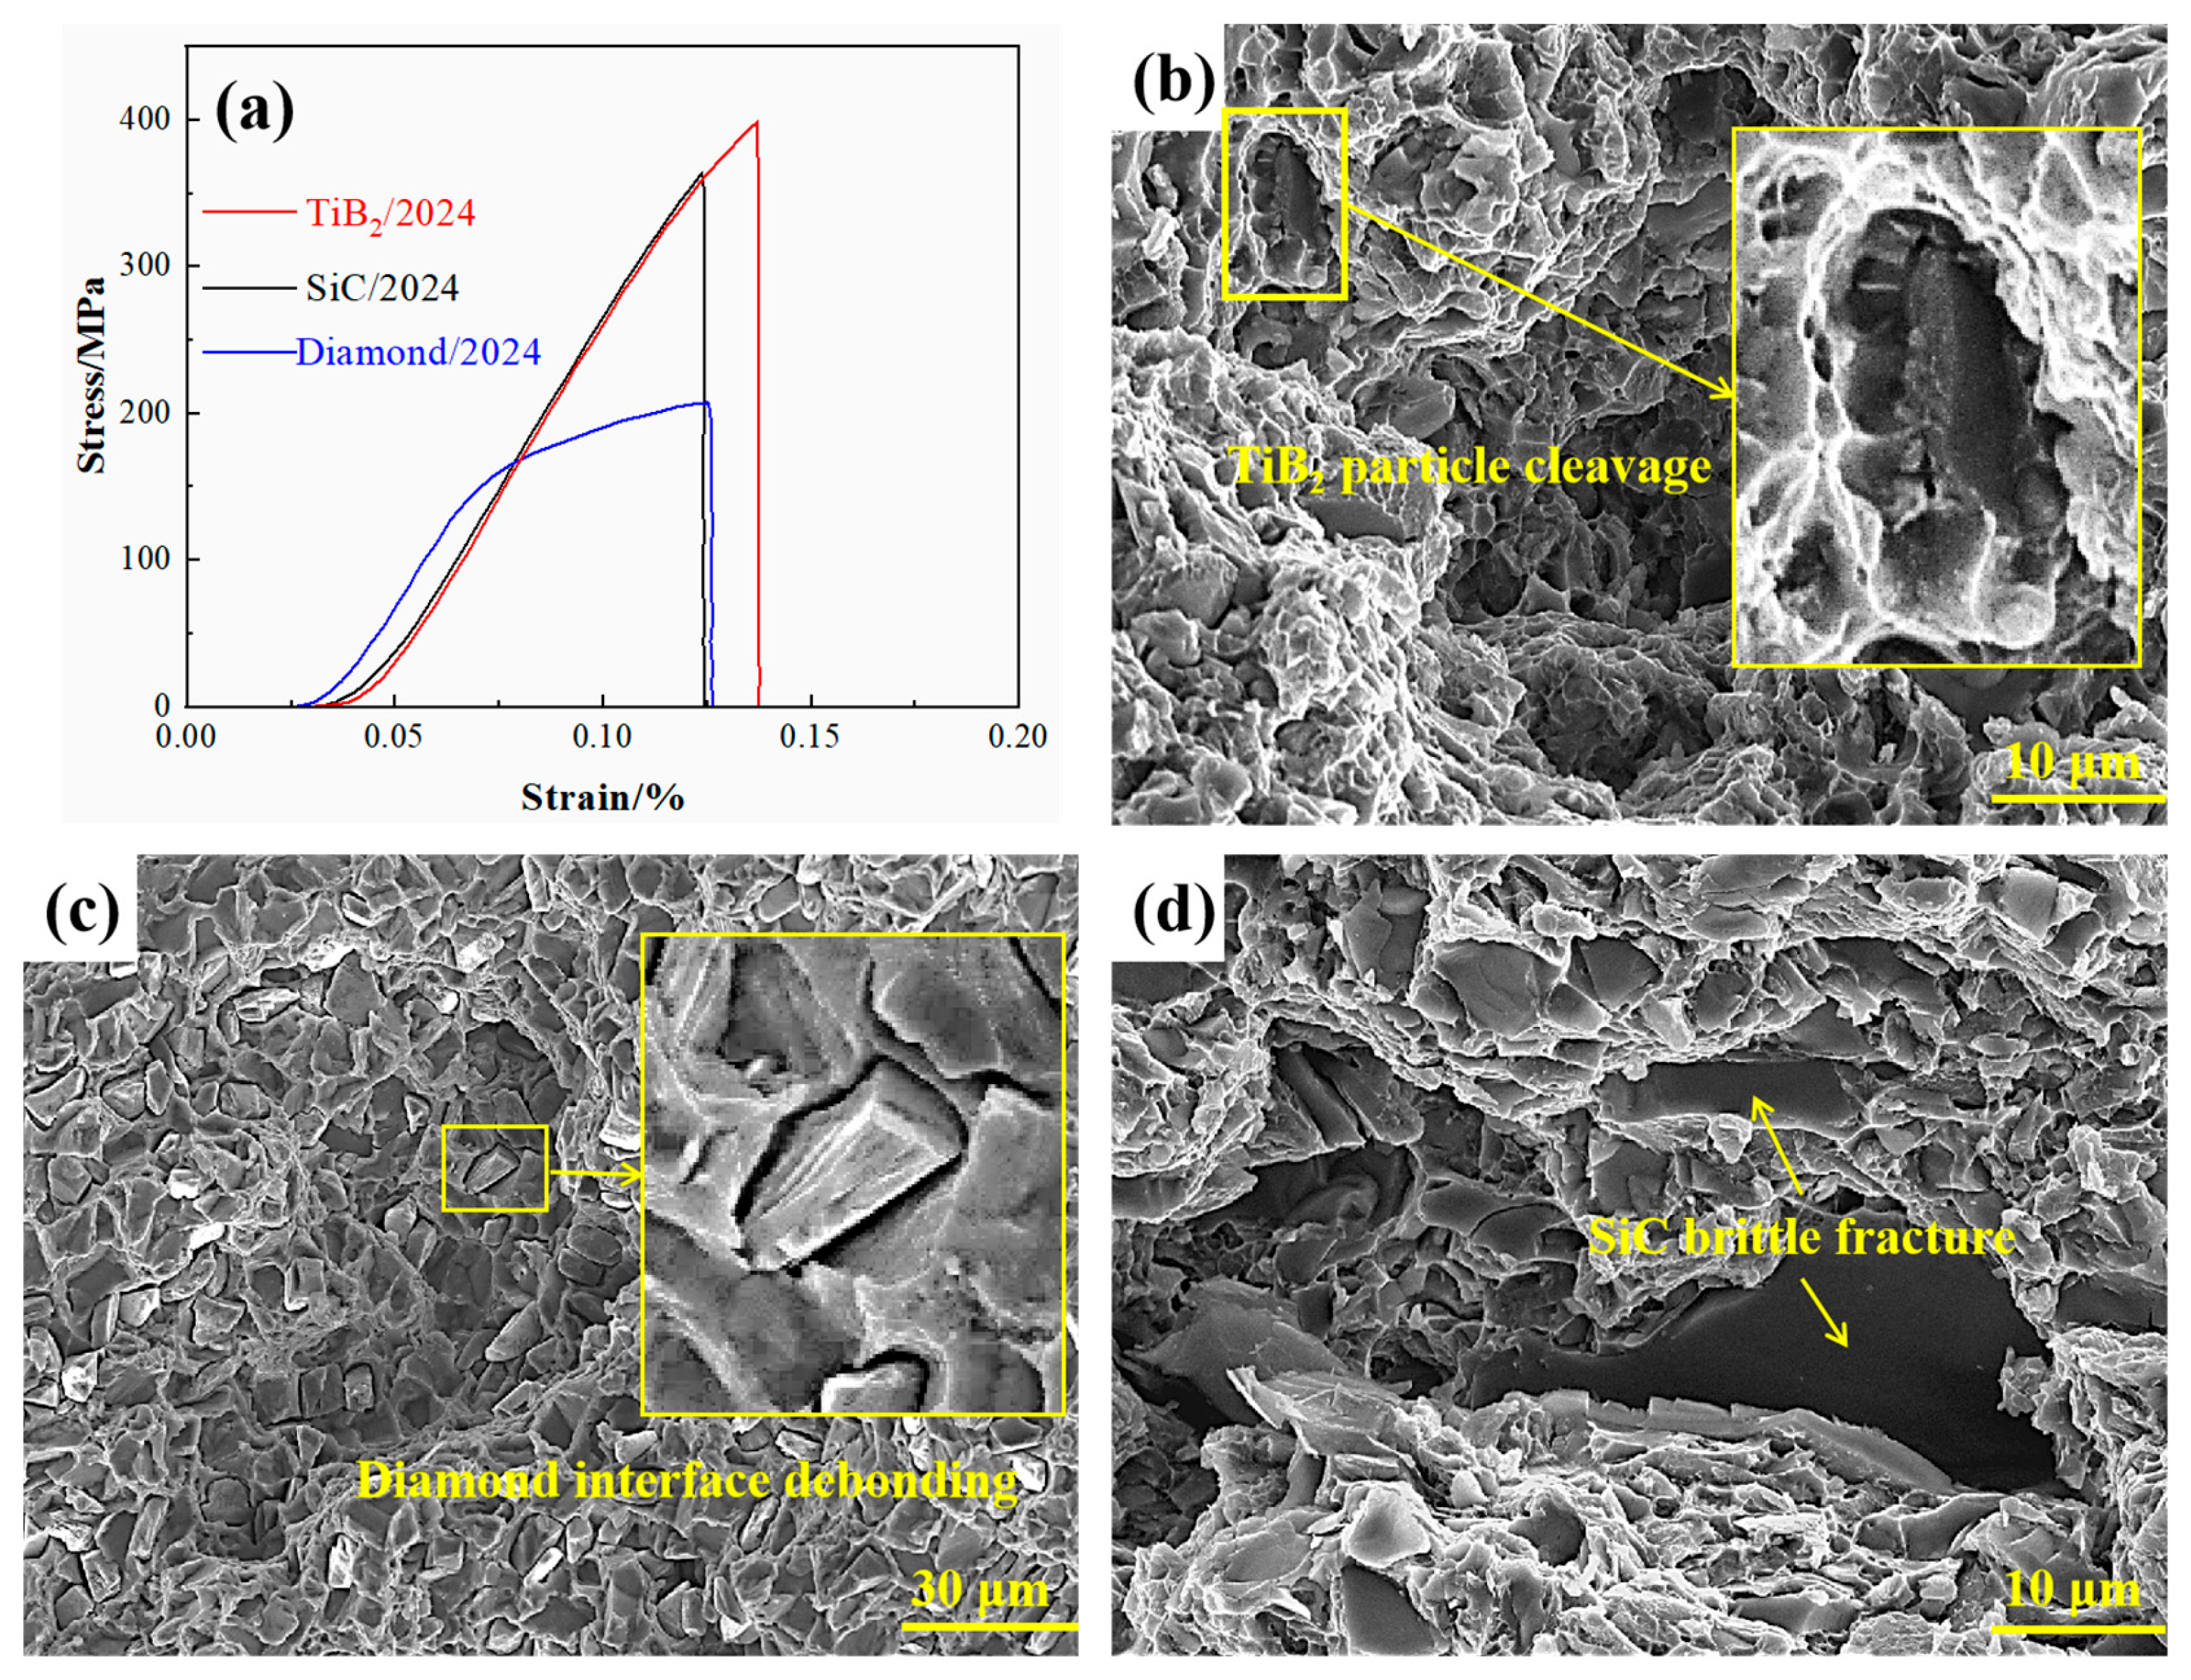
Table 4 presents the tensile strength of composites reinforced with different particles, while Figure 10 shows their corresponding stress-strain curves and tensile fracture morphologies. As evidenced by the stress–strain curves, the three materials exhibit comparable elastic moduli. The mechanical properties of 2024 aluminum matrix composites vary significantly with the type of reinforcement, which can be attributed to the combined effects of particle characteristics, interfacial bonding, and interfacial reactions. As shown in Figure 10b, the tensile fracture morphology of the 27 vol.% TiB2/2024 composite reveals that the formation of a dense interface with excellent wettability and the absence of brittle phase generation facilitates an optimal combination of intergranular and transgranular fracture modes, resulting in superior mechanical performance. Figure 10c illustrates the tensile fracture morphology of the 15 vol.% diamond/2024 composite. Due to the poor wettability of the diamond {111} surface with the 2024 aluminum alloy matrix, the interface exhibits visible pores and other defects that lead to interfacial debonding and inefficient load transfer, ultimately yielding the lowest mechanical performance among the samples. Figure 10d shows the tensile fracture morphology of the 37 vol.% SiC/2024 composite, where the reaction between SiC particles and the aluminum matrix forms the brittle Al4C3 phase and causes particle agglomeration, leading to localized stress concentration, brittle mixed fracture, and moderate mechanical strength. Both SiC and diamond reinforcements react with the 2024 matrix to form the Al4C3 brittle phase; although this phase can improve interfacial bonding to some extent, its instability and susceptibility to hydrolysis ultimately degrade the overall mechanical properties of the composites [21].

3.2.3. Mechanical Properties of TiB2/2024 Composite After T6 Heat Treatment

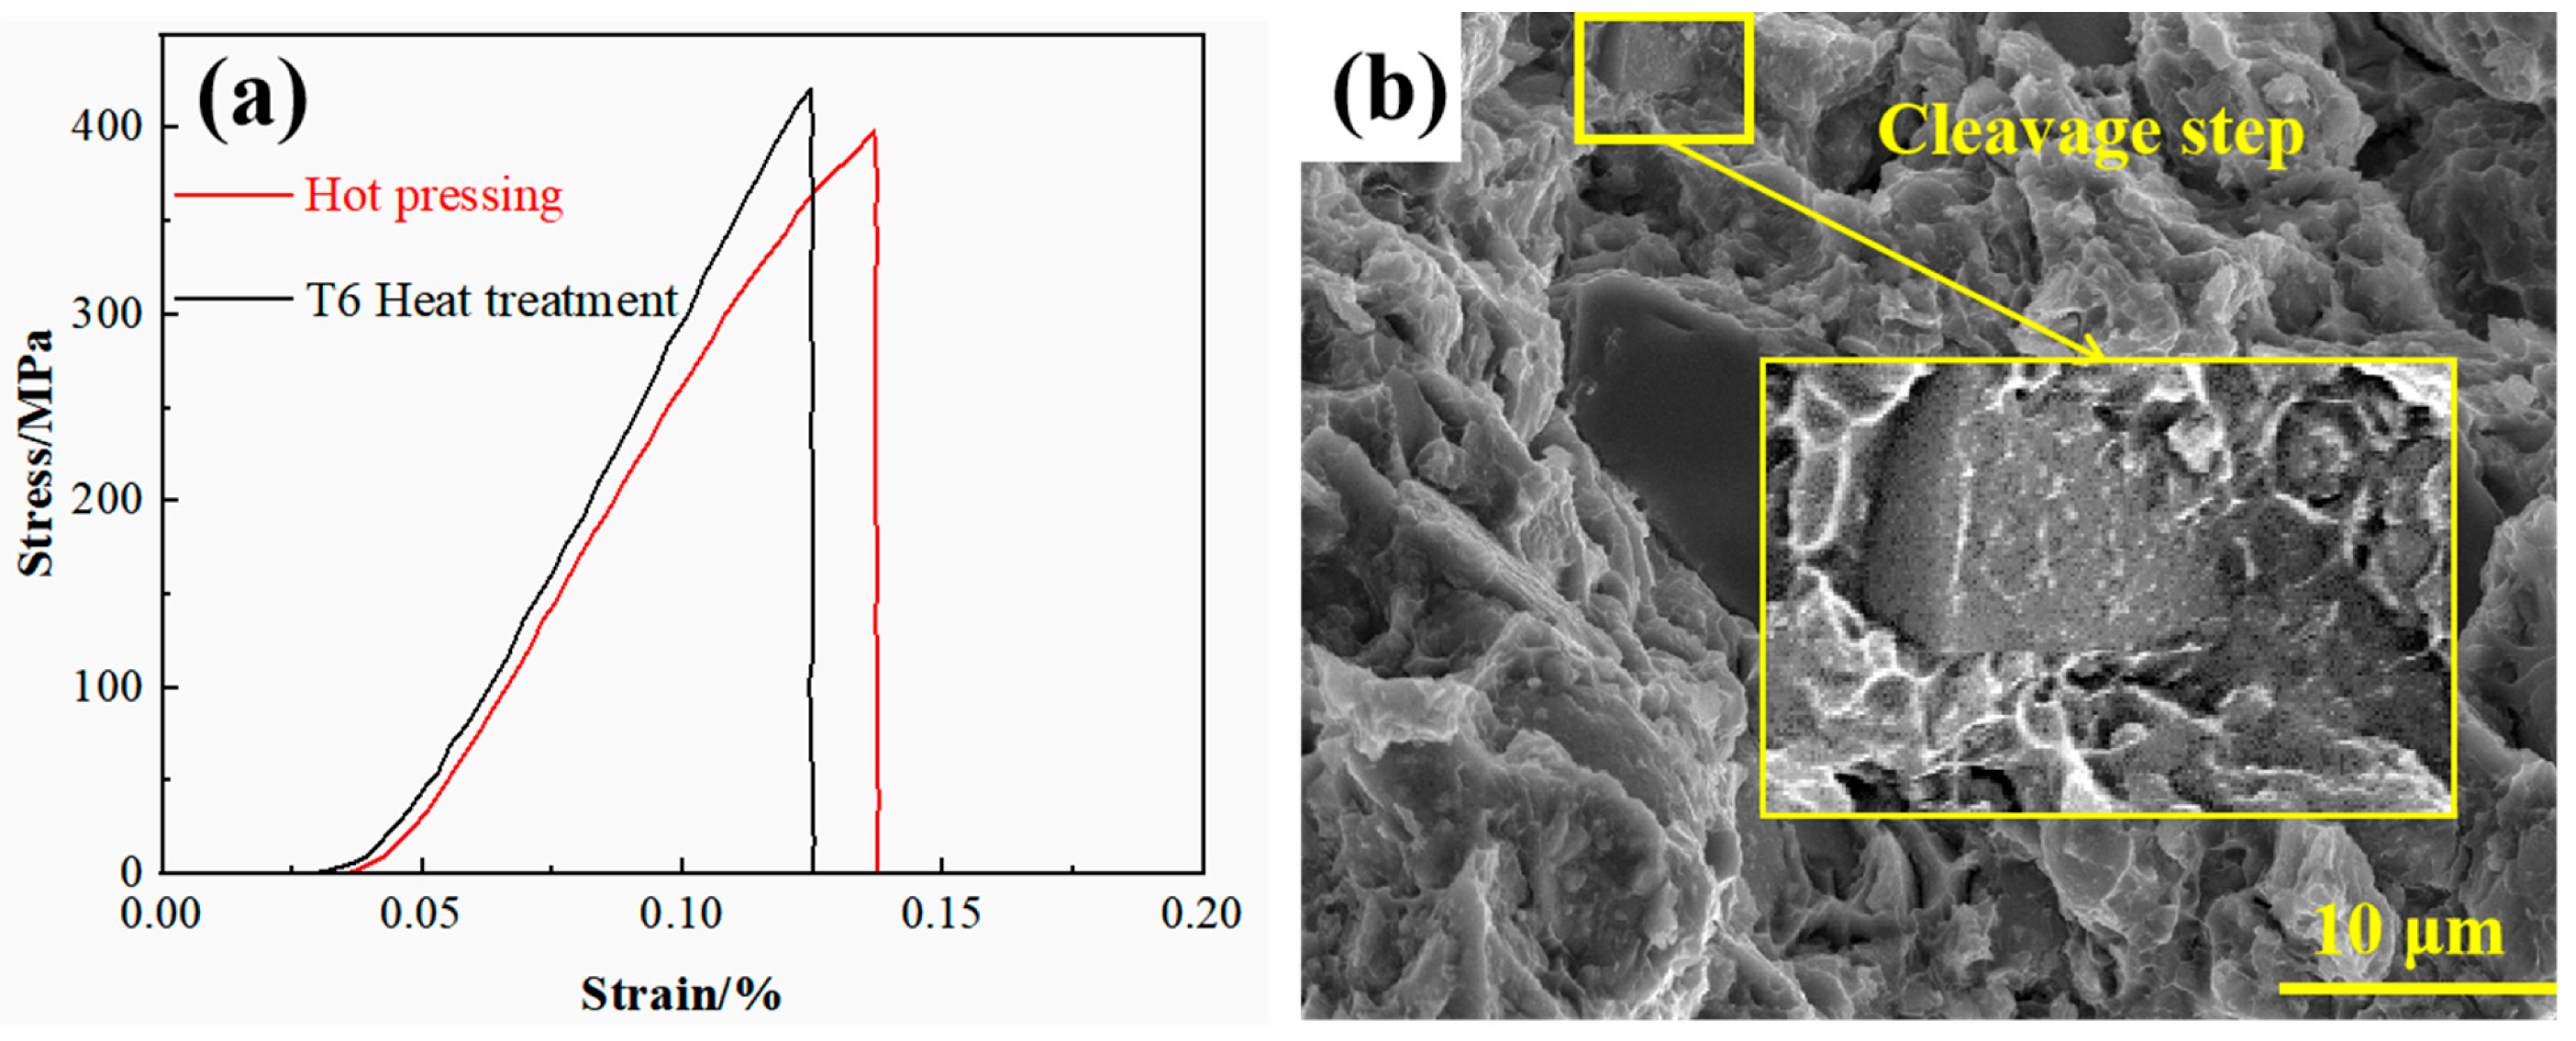
Table 5 presents the tensile strength of the T6 heat-treated 7 μm, 27 vol.% TiB2/2024 composite, while Figure 11 shows the stress-strain curves and fracture morphology of the composite in both the as-hot-pressed and T6 heat-treated states. After T6 heat-treated, the tensile strength of the TiB2/2024 composite increased from 397.1 MPa to 421.7 MPa, while the elongation decreased from 2.3% to 1.1%. The T6 heat treatment reduces the amount of coarse, incoherent CuAl2 phases through solid-solution and aging processes, leading to the precipitation of finer and more uniformly dispersed CuAl2 phases during prolonged aging. These finely distributed precipitates impede dislocation motion, causing the dislocations to bypass the second phase via the Orowan mechanism, which results in local stress concentration that acts as crack initiation sites [22]. This phenomenon explains the simultaneous enhancement of tensile strength and reduction in ductility [23]. Fractographic analysis further reveals that the T6 heat treatment significantly reduces both dimples and matrix tearing. This is attributed to the formation of abundant precipitates and hard phases within the material, which impede dislocation motion and plastic deformation capacity, thereby shallowing the dimples typically associated with ductile fracture. Concurrently, the presence of distinct cleavage steps in transgranular regions indicates a transition in the fracture mechanism towards brittle fracture. This alteration in the fracture mode accounts for the observed increase in the tensile strength of the composite, accompanied by a reduction in elongation.

3.3. Machining Performance of Composites

3.3.1. Machining Performance of TiB2/2024 Composite with Different TiB2 Particle Sizes

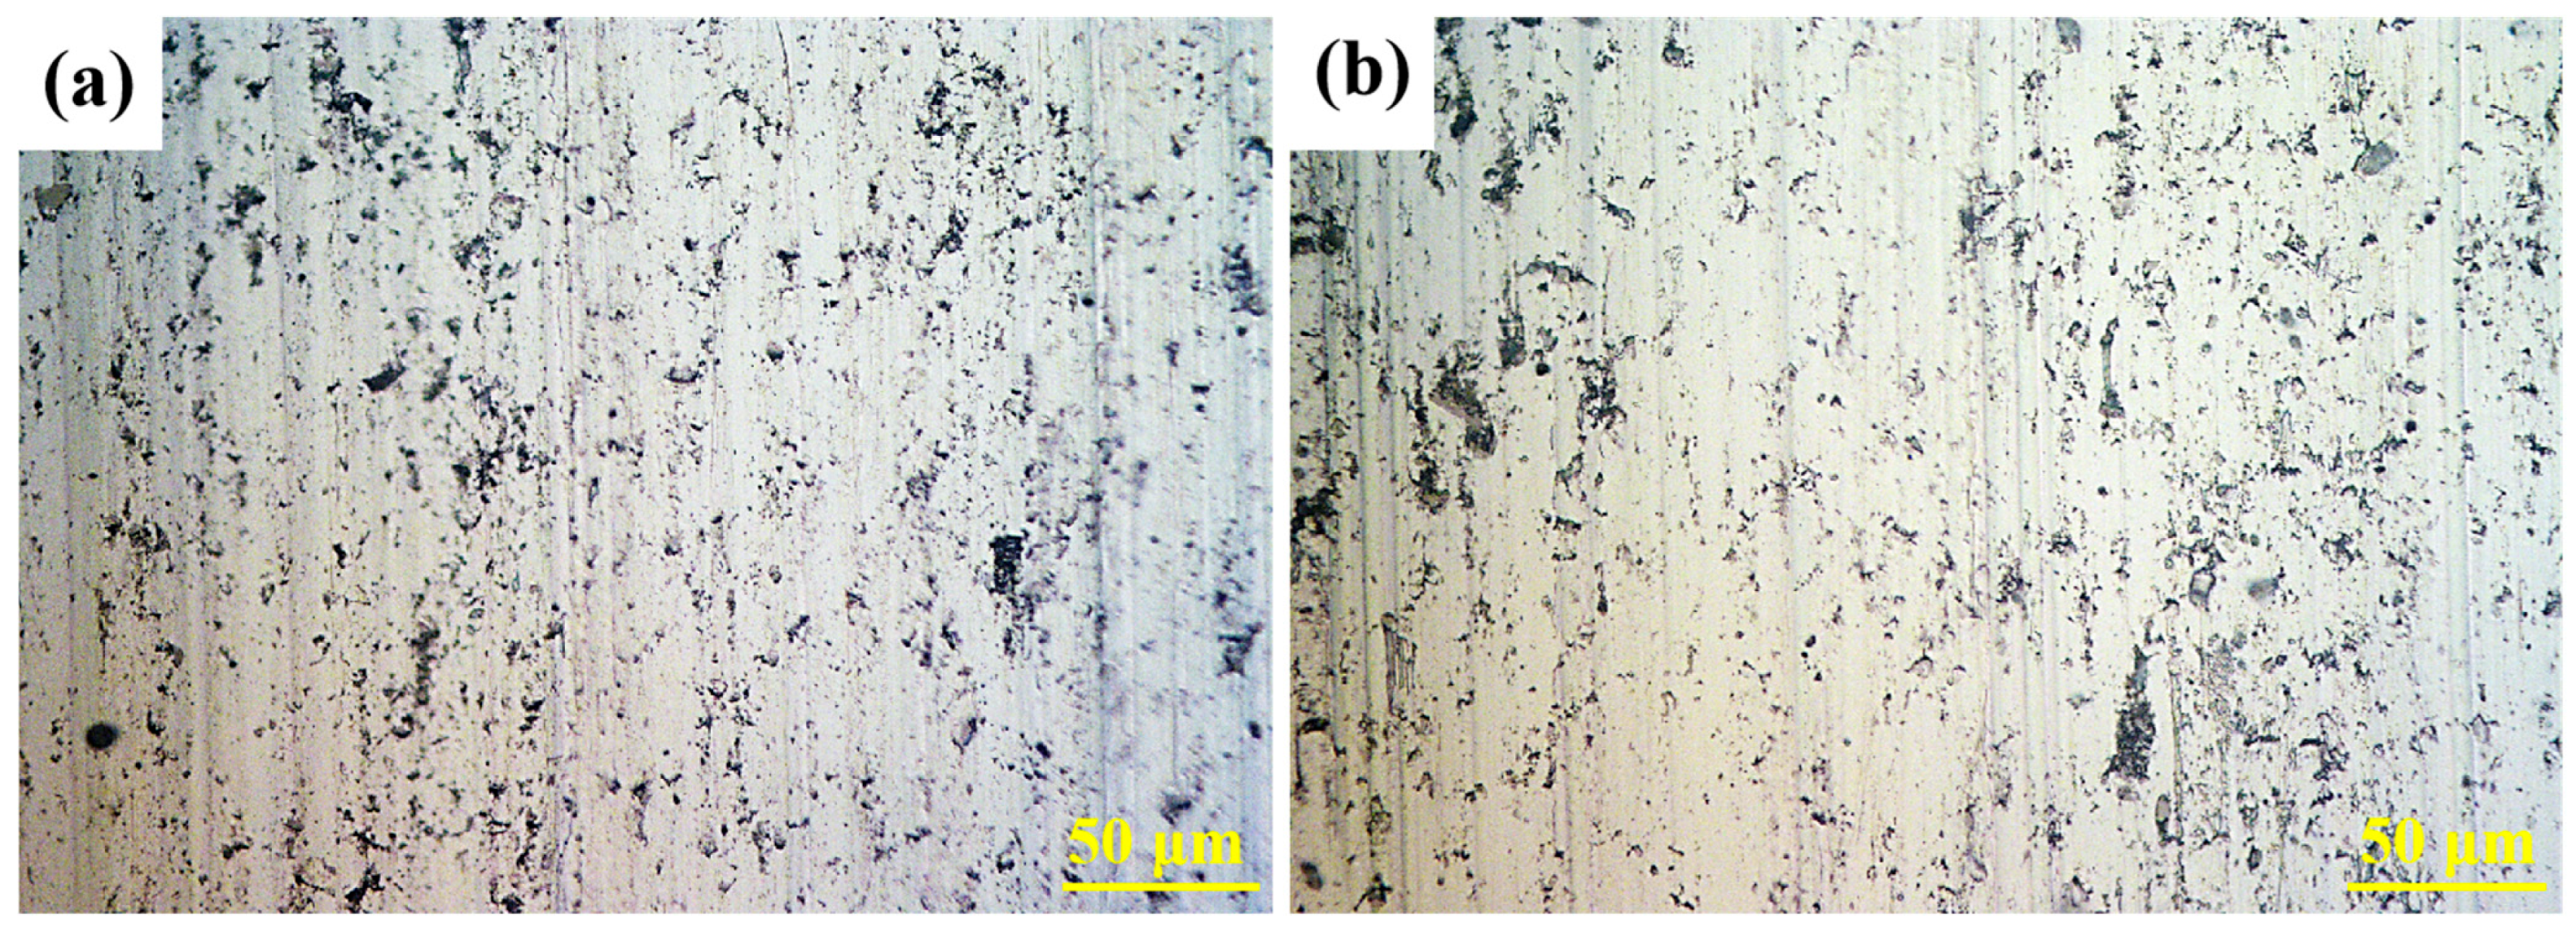
Figure 12 shows the surface morphology of 27 vol.% TiB2/2024 composite fabricated using 7 μm and 25 μm TiB2 particles after turning. In the images, the gray-black regions correspond to TiB2 particles or voids, the gray-white regions represent the 2024 aluminum matrix, and the vertical grooves are generated during the turning process. Prominent turning defects, such as matrix adhesion, voids, and particle scratches, are visible along the machining path. During cutting, the 2024 aluminum matrix exhibits high plasticity and adhesion, and chip accumulation promotes the formation of built-up edges consisting of TiB2 debris embedded in the matrix. At elevated temperatures, these chips may partially melt and re-solidify on the matrix surface, forming adhesion layers that manifest as matrix adhesion defects. The interaction between the cutting tool and TiB2 particles disrupts the interfacial bonding between the reinforcement and the 2024 matrix, increasing particle loosening and shedding, which appear as void defects on the turned surface. Due to the high rigidity of TiB2 particles and their limited plastic deformation, detached particles remain partially embedded in the matrix, producing particle-scratch defects as the cutting tool advances. Compared with the composites reinforced with 7 μm TiB2 particles, those containing 25 μm TiB2 particles exhibit more pronounced turning defects. This occurs because larger particles increase cutting force concentration and the likelihood of particle fracture, while insufficient cutting force or tool wear can interrupt tool motion when encountering these larger reinforcements.
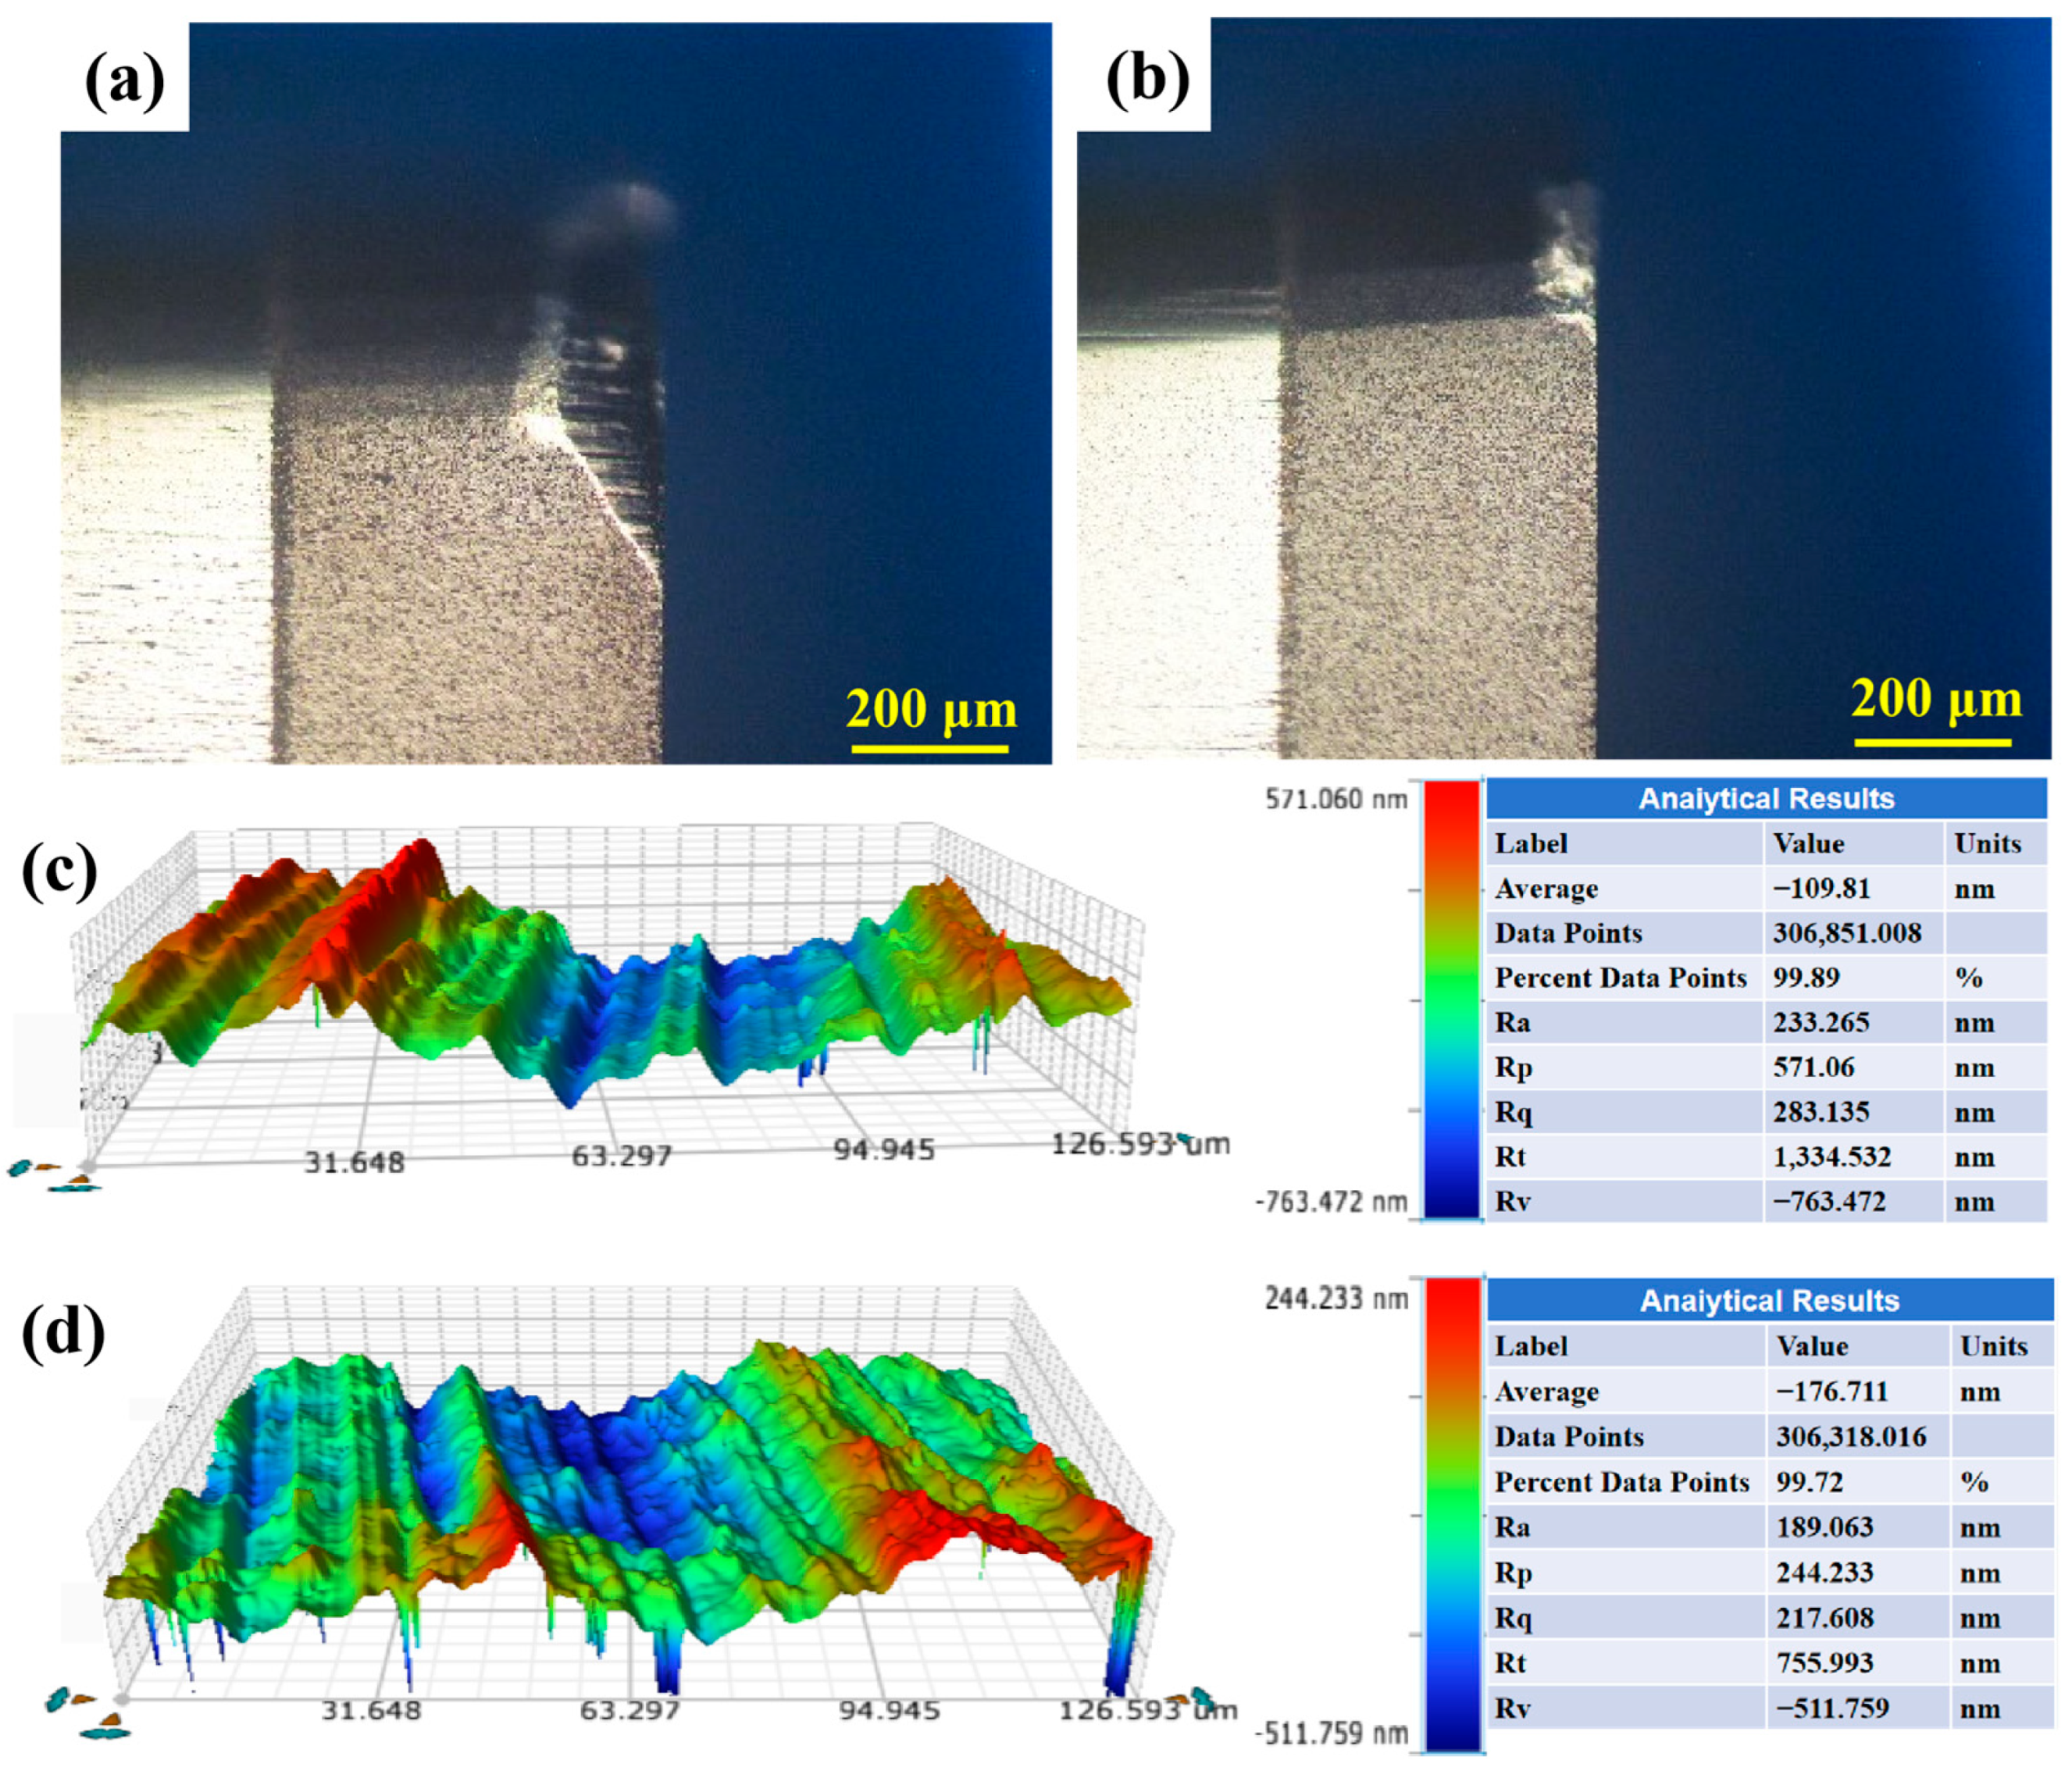
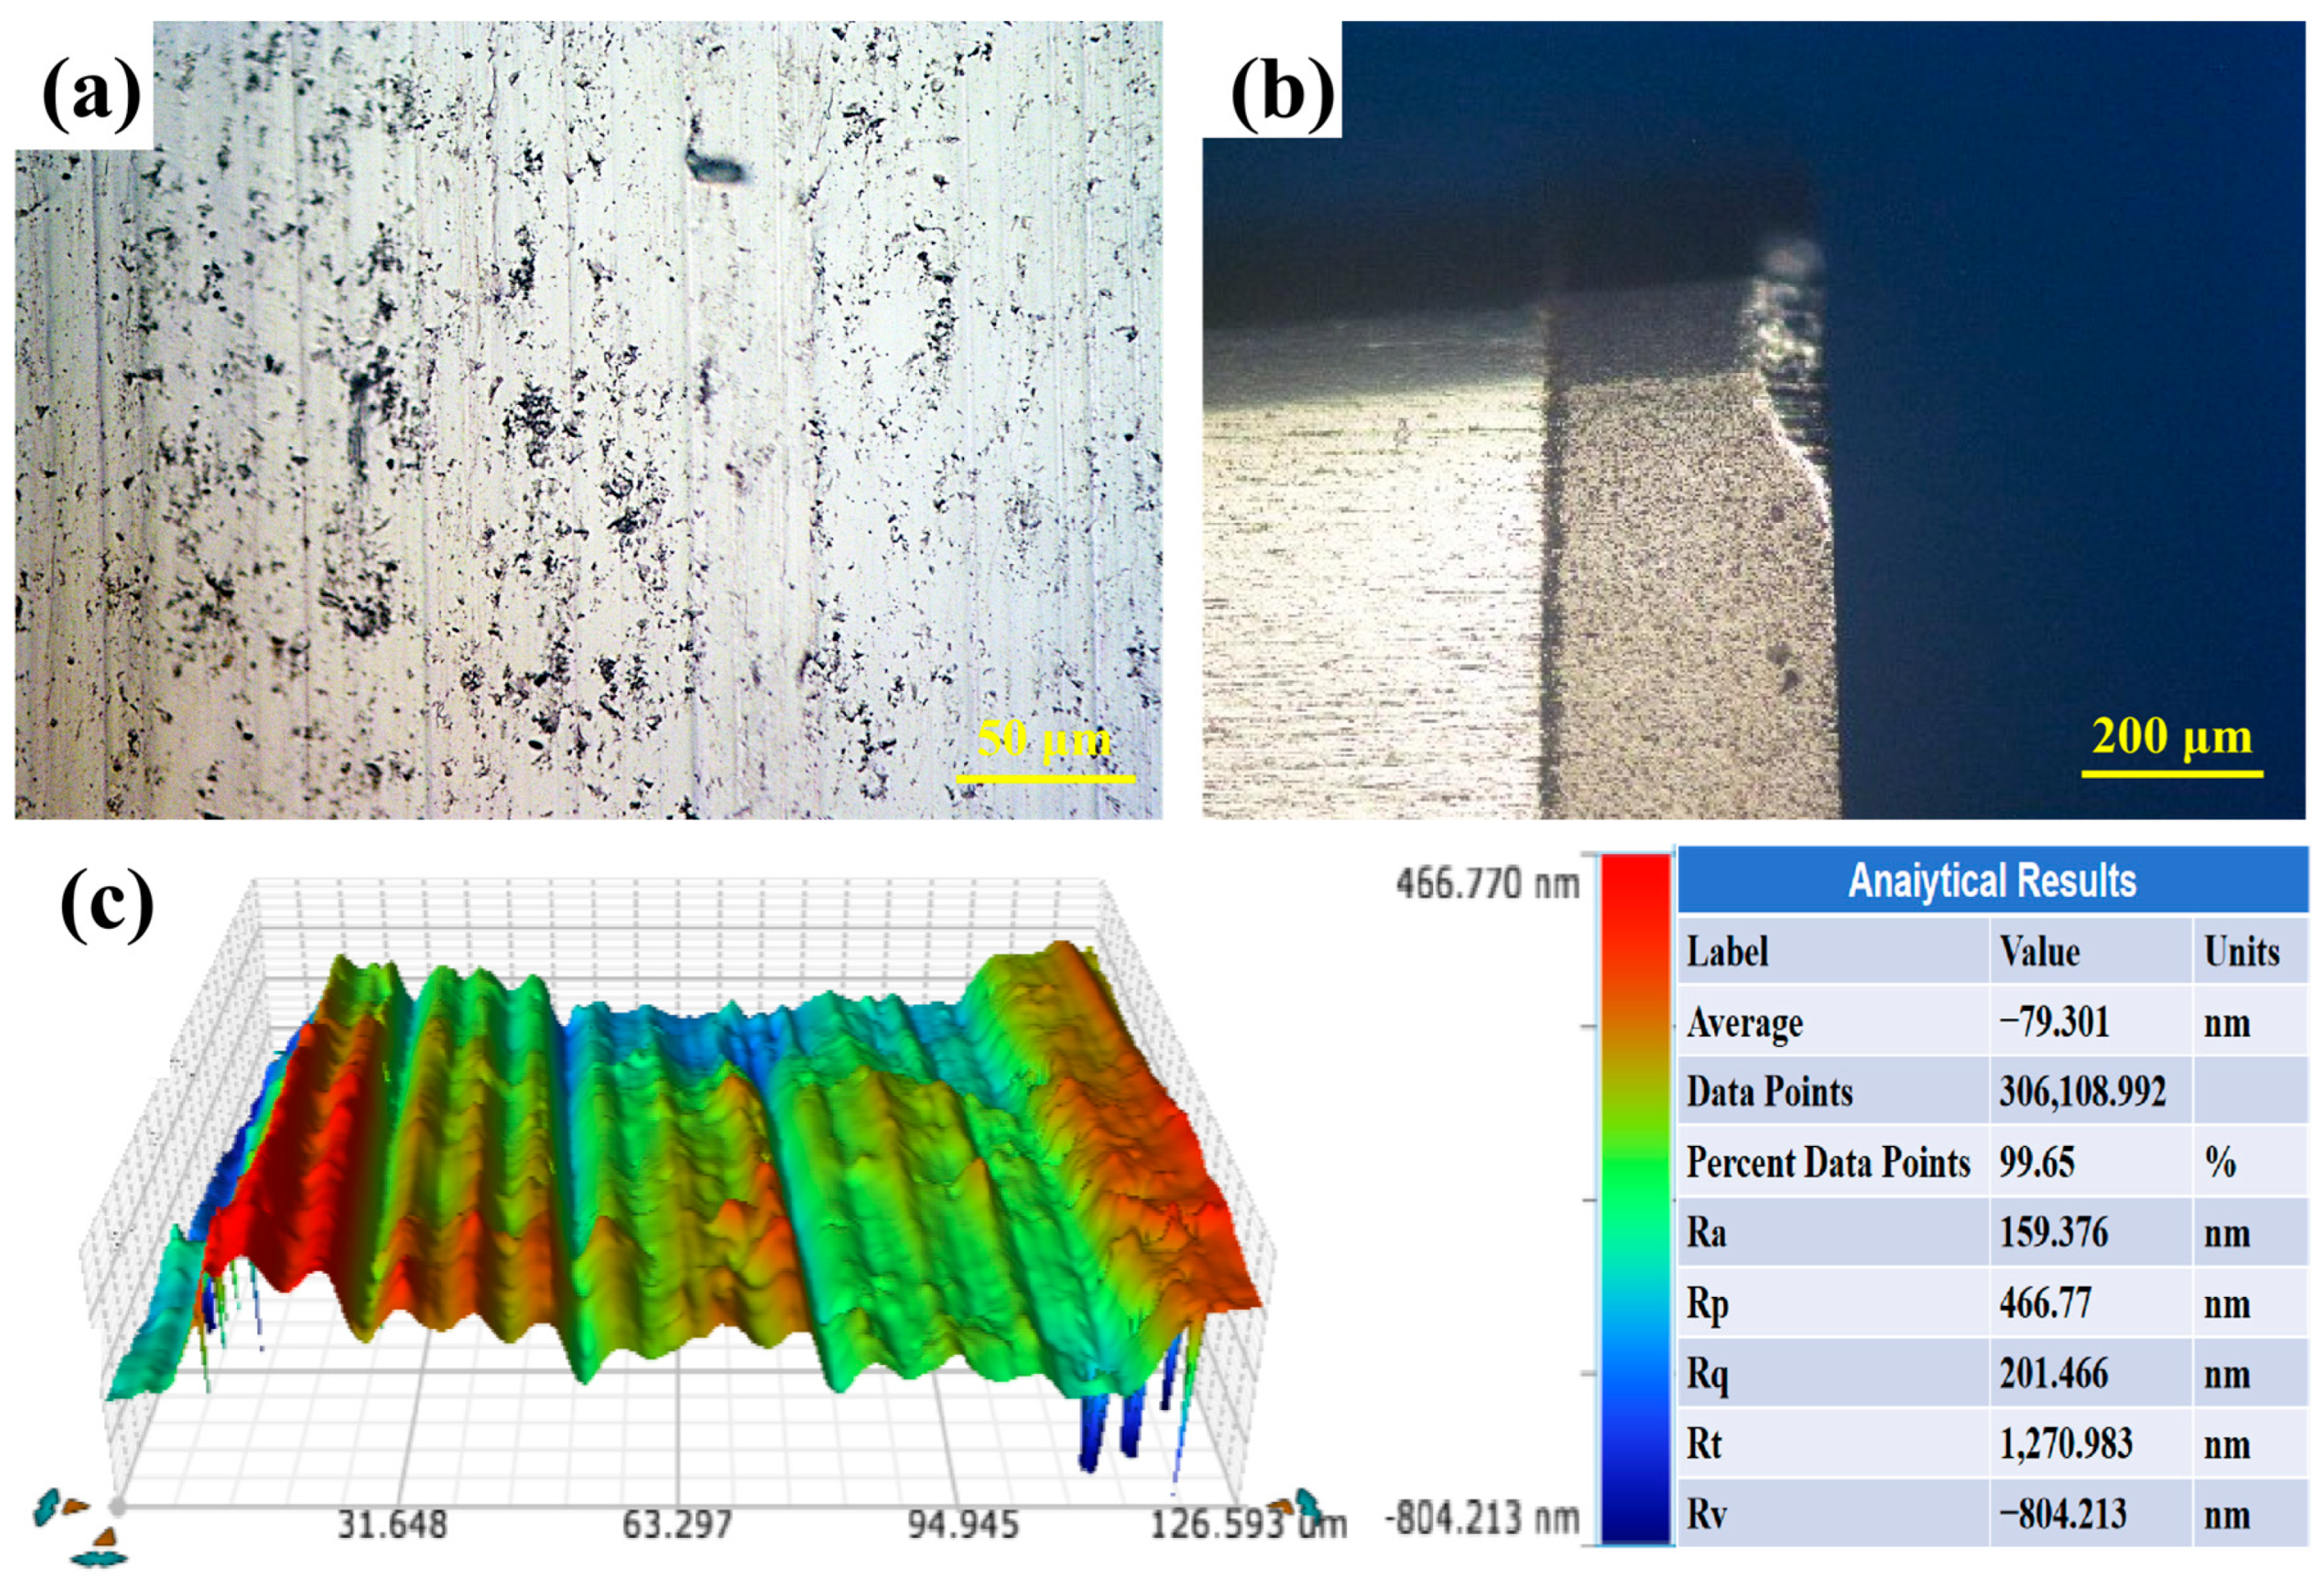
Figure 13a,b illustrate the morphology of the PCD tool after turning hot-pressed TiB2/2024 composite reinforced with TiB2 particles of different sizes. The flank wear widths of the tools after machining the 7 μm and 25 μm TiB2 reinforced composites were 98.69 μm and 92.12 μm, respectively, indicating reduced tool wear when machining the 25 μm TiB2/2024 composite. When machining the 25 μm TiB2/2024 composite, the PCD tool exhibits reduced wear. Under a constant volume fraction of reinforcing particles, a decrease in particle size not only increases the effective frictional contact area between the particles and the tool but also exacerbates tool damage from the perspective of abrasive wear mechanisms: on one hand, fine hard particles are more easily embedded into the relatively soft aluminum matrix under cutting forces, leading to continuous micro-cutting and ploughing on the tool edge; on the other hand, the reduction in particle size results in a significant increase in particle count, causing the tool to experience a substantially higher frequency of hard particle impacts per unit cutting path. This high-frequency micro-mechanical impact accelerates the fatigue and removal of the tool material. Furthermore, the accompanying increase in the number of fine particles promotes three-body wear [24]. A large number of small, free particles dislodged from the matrix roll and grind at the interfaces between the tool, workpiece, and chip, further accelerating tool wear and thereby comprehensively degrading the machining properties of the composite. Figure 13c presents the 3D surface morphology of 7 μm, 27 vol.% TiB2/2024 composite after turning. Average is the mean value, representing roughness. Ra is the arithmetical average roughness, indicating the overall average level of fluctuations. Rq is the root mean square roughness, a weighted average fluctuation that is more sensitive to peaks and valleys. Rp is the maximum peak height, Rv is the maximum valley depth, and Rt is the total height of the profile, representing the total range from the highest peak to the lowest valley. The machined surface displays distinct turning traces and pronounced groove patterns, along with pits and a wavy distribution of peaks and valleys, resulting in a surface roughness value (Sa) of approximately 110 nm. Figure 13d shows the 3D surface morphology of 25 μm, 27 vol.% TiB2/2024 composite after turning. Pit defects are observed on the machined surface, and within the X-axis range of 110–126 μm, the cutting marks become gradually blurred. It is hypothesized that during cutting, the tool encounters large TiB2 particles, resulting in instantaneous elastic rebound or slight displacement. This effect temporarily reduces the actual depth of cut, preventing the formation of a continuous shear band and consequently producing an incomplete cutting zone on the machined surface [25]. The pronounced height differences between valleys and peaks, particularly near 63 μm and 100 μm, suggest tool vibration induced by these collisions with larger TiB2 particles. Compared with the 7 μm TiB2/2024 composite, the surface roughness values (Sa) of the 25 μm TiB2/2024 composite increased to approximately 177 nm. Cheung, C.F. [26] studied the surface quality of SiC/Al composite and observed that surfaces produced by particle cutting exhibited superior quality compared to those where SiC particles were pulled out. Similarly, due to the high hardness of TiB2 particles, larger TiB2 reinforcements tend to fracture or generate larger void defects under the cutting force, ultimately degrading the surface quality.

3.3.2. Machining Performance of Different Reinforced Composites

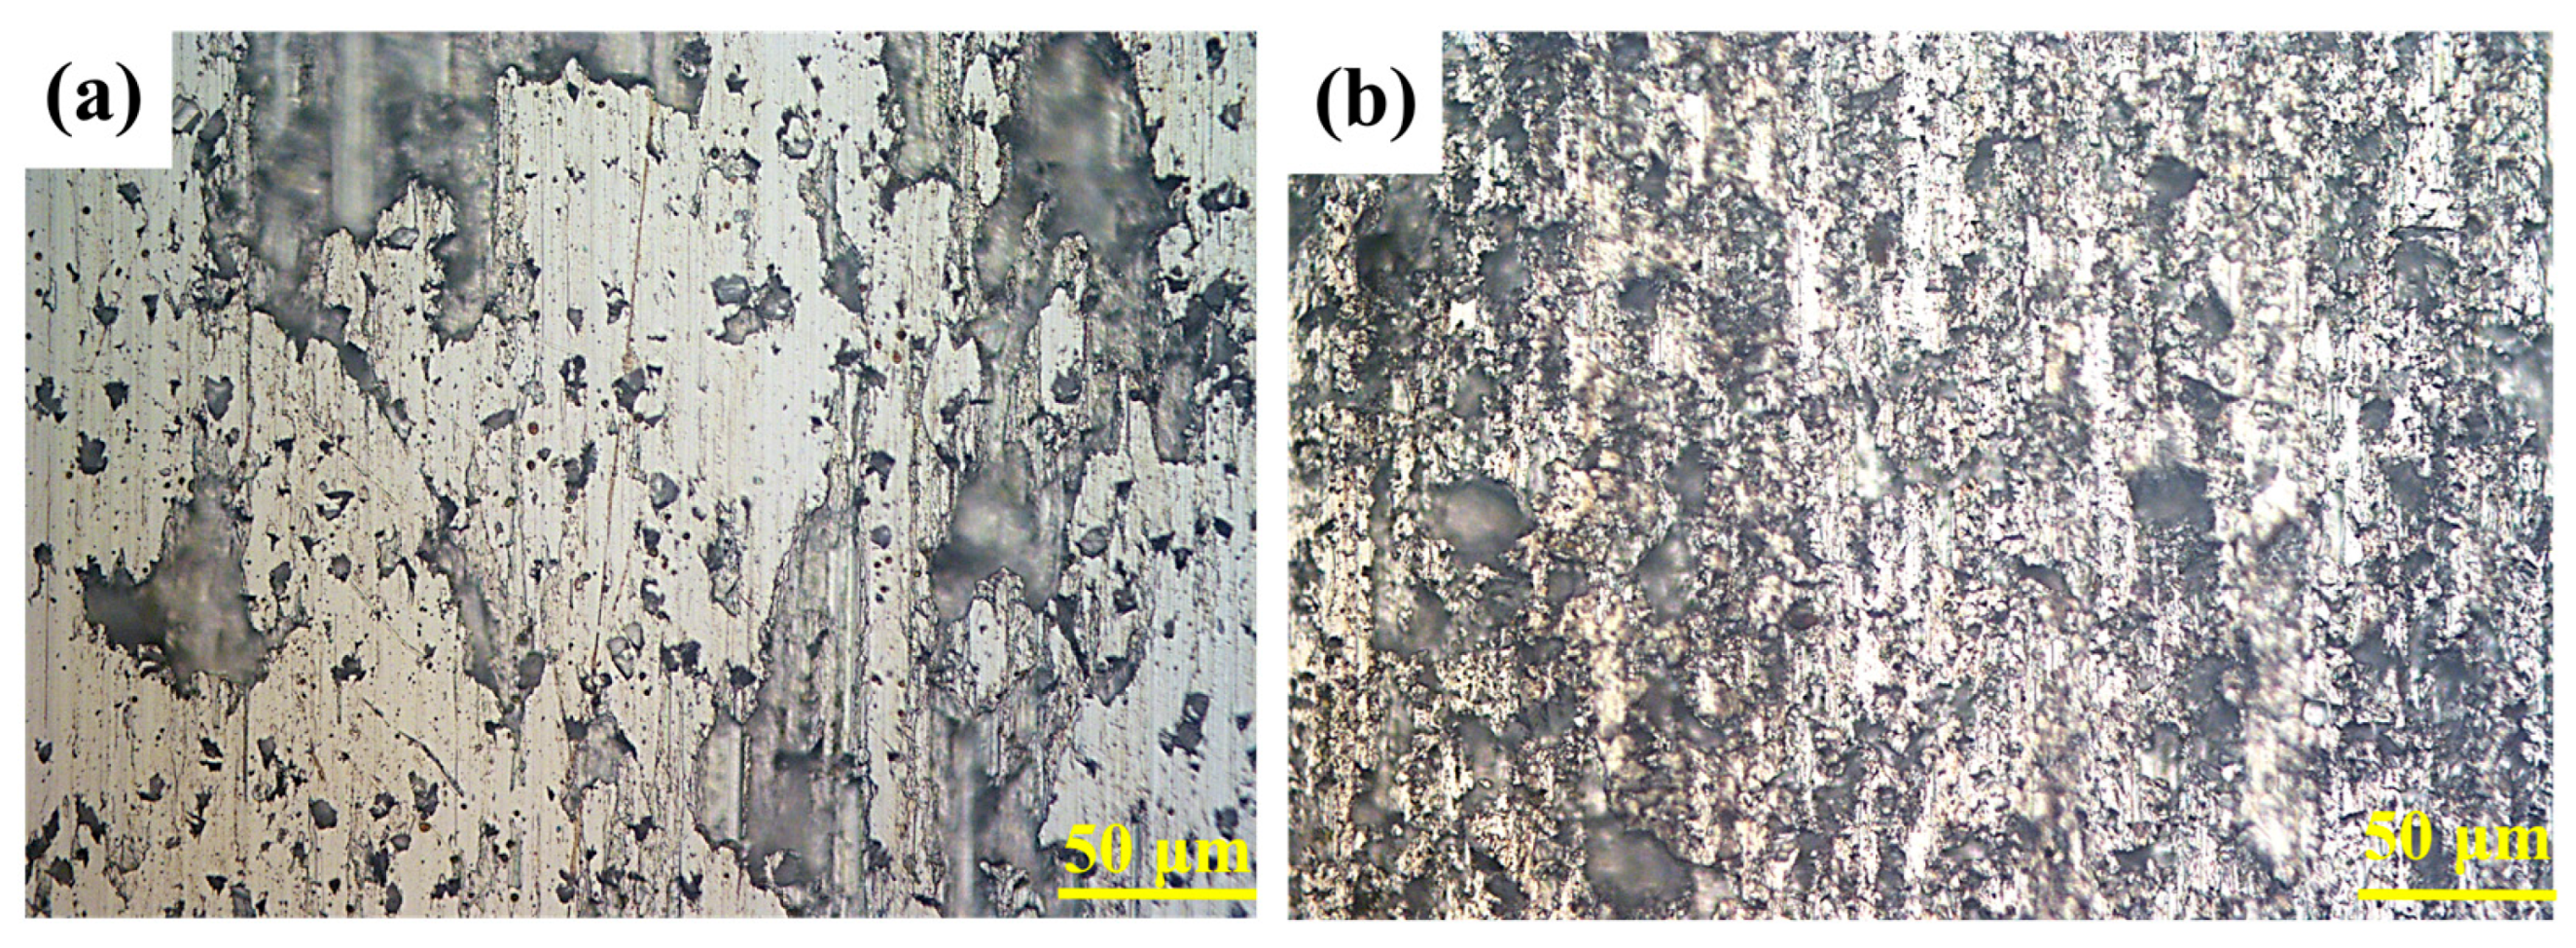
Figure 14 presents the surface morphology of 15 vol.% diamond/2024 and 37 vol.% SiC/2024 composite after turning. Compared with the 27 vol.% TiB2/2024 composite shown in Figure 12a, the surface morphology of the TiB2/2024 composite is the most superior after machining. This is attributed to the excellent wettability of TiB2 particles with the 2024 aluminum matrix and the formation of strong metallurgical bonding at the interface during hot pressing [27,28]. Although a small number of TiB2 particles detach during turning, resulting in localized holes, scratches, and other machining defects, the overall turned surface remains relatively smooth and intact [29].
As shown in Figure 14a, the 15 vol.% diamond/2024 composite exhibits the most severe particle detachment. This occurs because diamond particles have the poorest wettability with the 2024 aluminum alloy matrix, leading to weak interfacial bonding. When the cutting tool contacts the diamond particles, they tend to separate easily from the matrix, causing particle scratching and re-adhesion of detached particles on the surface. These phenomena produce extensive sheet-like surface defects. However, due to the extremely high hardness of diamond, no significant particle fracture or breakage is observed [30]. As shown in Figure 14b, the surface morphology of the 37 vol.% SiC/2024 composite after machining displays numerous holes and widespread particle-scratching marks across the entire turned surface. This is primarily due to the moderate wettability between SiC particles and the 2024 matrix, coupled with the relatively high particle content. Consequently, the number of hole and scratch defects resulting from particle detachment and abrasion is greater than that observed in the 15 vol.% diamond/2024 composite [31].
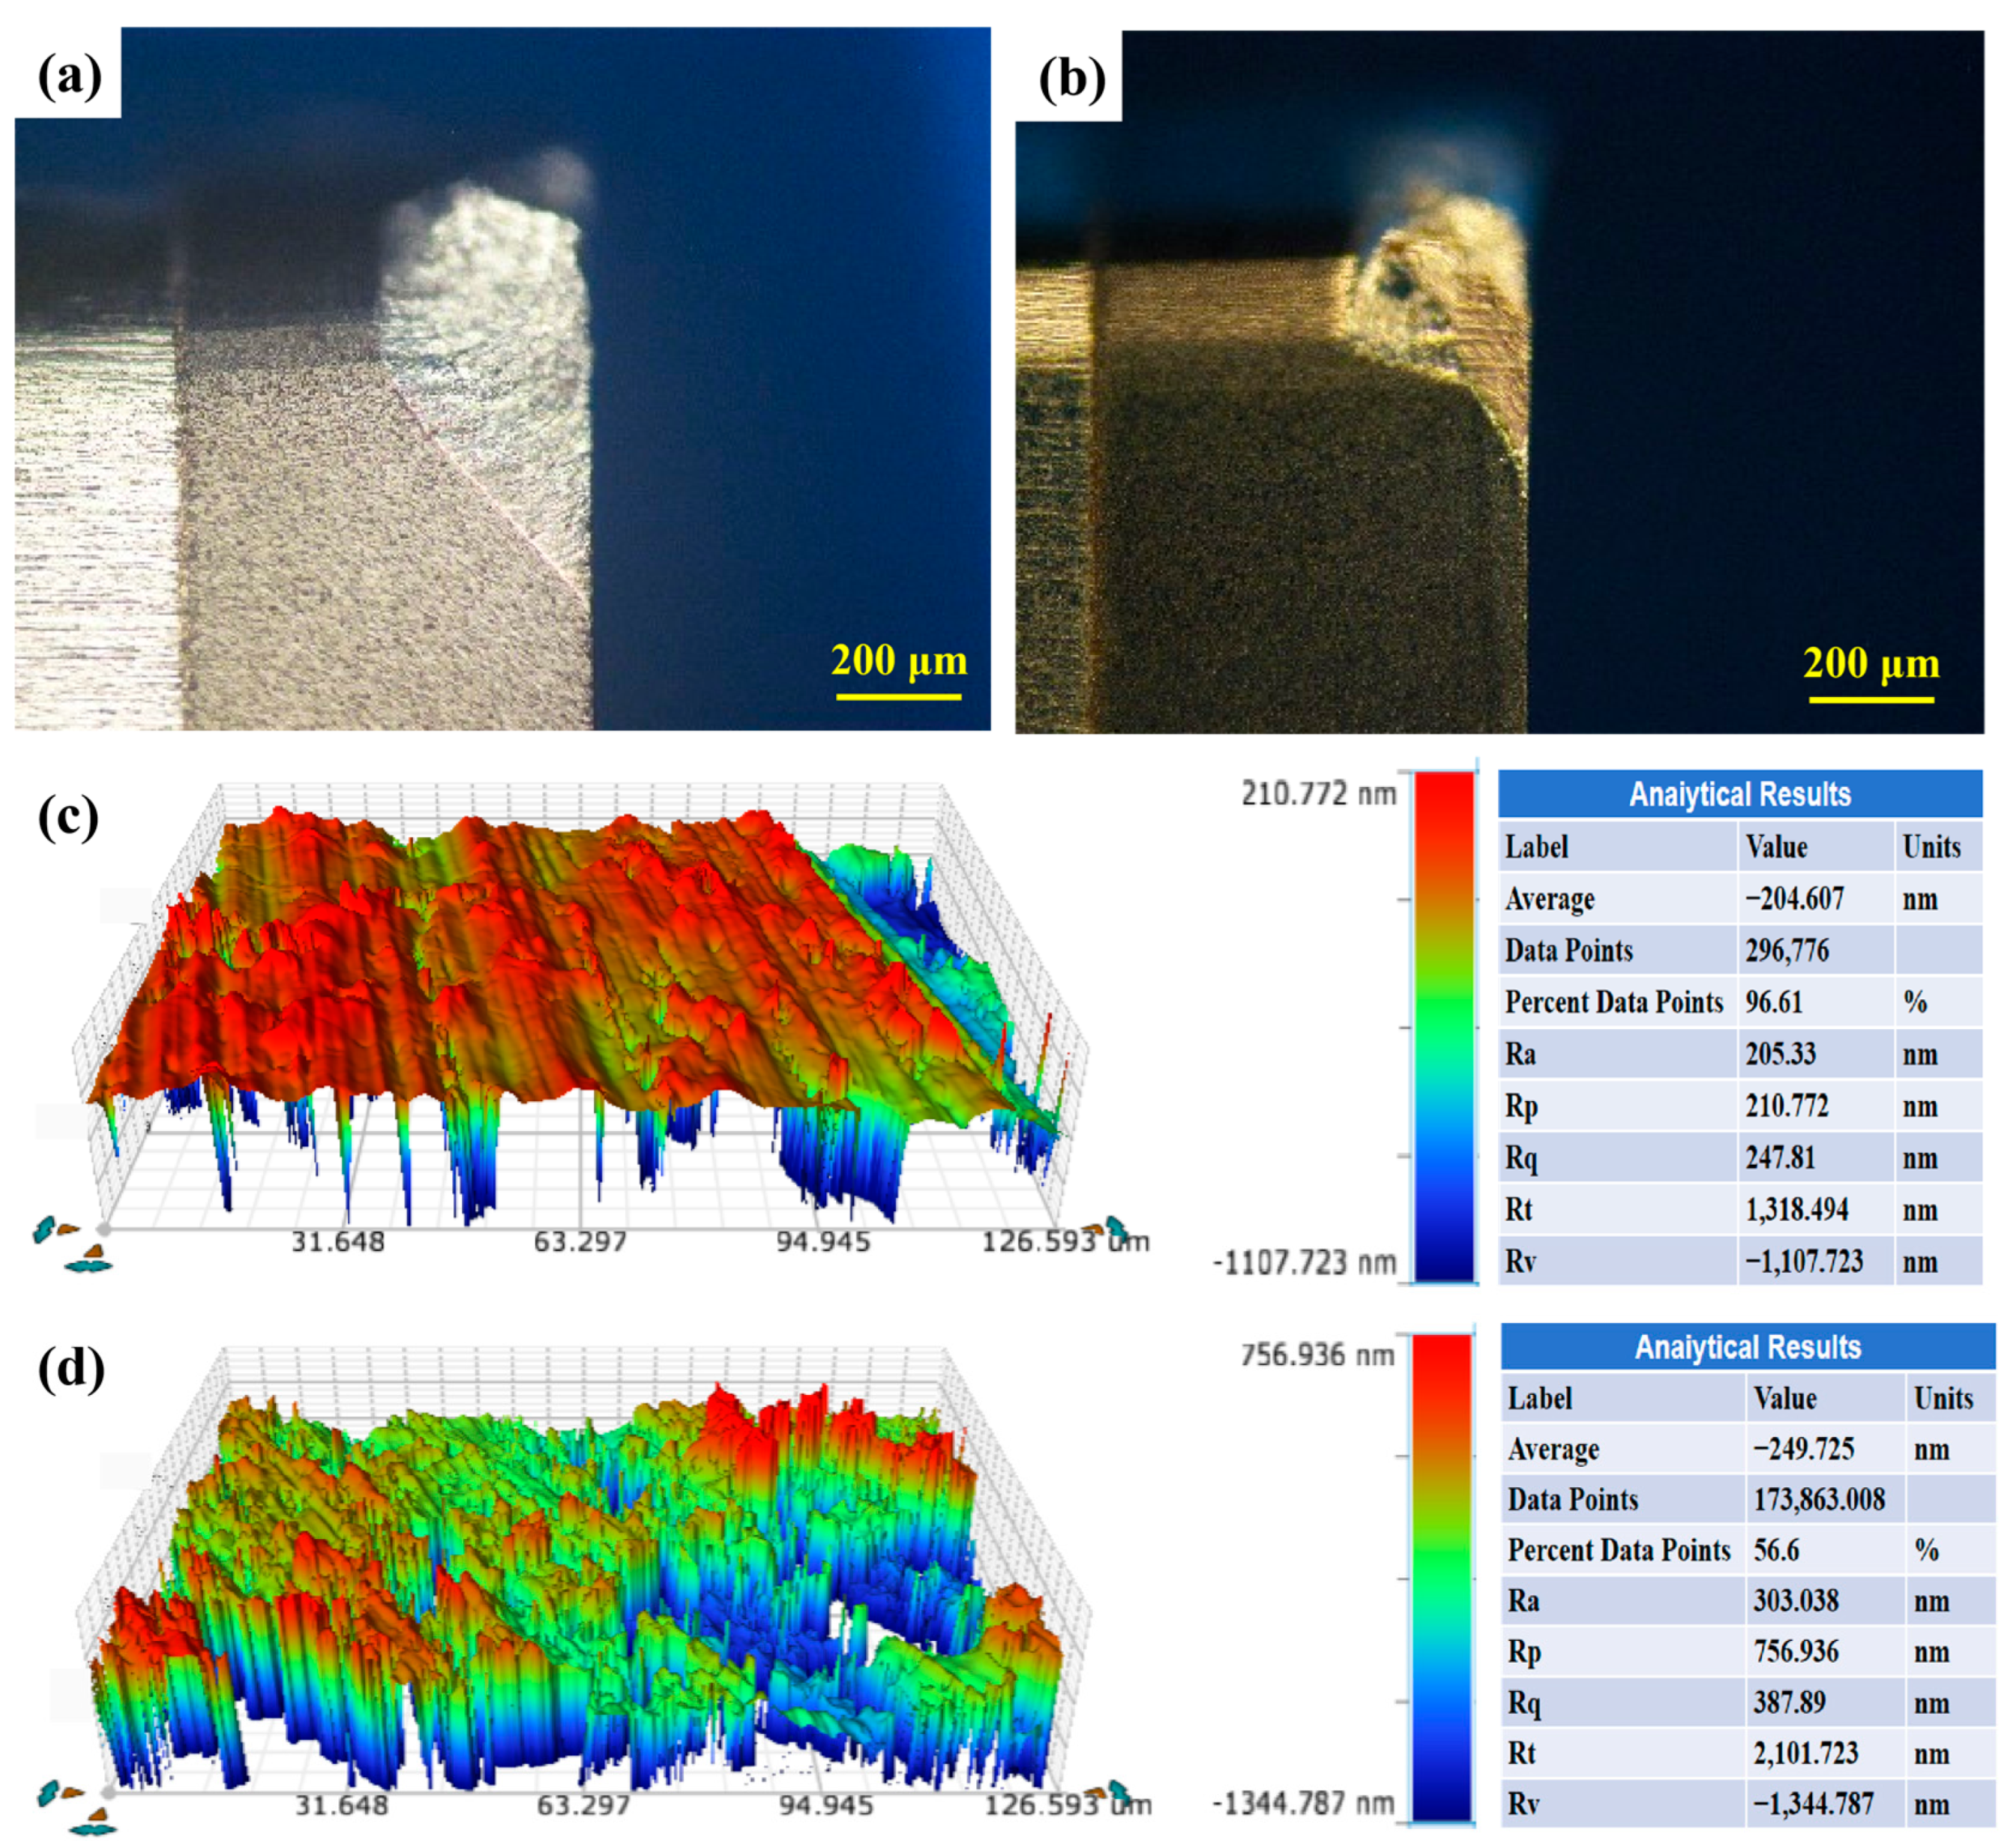
Figure 15a,b show the PCD tool morphologies after turning the 15 vol.% diamond/2024 composite and the 37 vol.% SiC/2024 composite, with their flank wear widths measured at 325.29 μm and 209.84 μm, respectively. Compared with the PCD tool morphology obtained during the turning of 7 μm TiB2/2024 composite shown in Figure 13a, it is evident that the TiB2/2024 system exhibits the least tool wear. This is primarily because it has a lower particle volume fraction than SiC/2024 and superior interfacial bonding to diamond/2024. These combined advantages reduce built-up edge formation and matrix adhesion during machining. In contrast, the 15 vol.% diamond/2024 composite causes severe tool wear because of the extremely high hardness of diamond particles and the poor interfacial bonding between the diamond and the aluminum matrix. These factors lead to significant built-up edge formation and pronounced adhesion at the tool tip. Similarly, in the case of SiC/2024 composite, weak bonding between SiC particles and the matrix, combined with the higher particle content, results in fine SiC particles accumulating on the tool surface, thereby accelerating tool wear. A comparison among the three reinforcement systems reveals that tool wear severity increases with the hardness of the reinforcement particles. However, stronger interfacial bonding between reinforcement and matrix reduces defects such as particle scratching, voids, matrix cracking, and adhesion, ultimately minimizing tool vibration, surface roughness, and overall tool wear.
Figure 15c,d show the 3D surface topography of 15 vol.% diamond/2024 and 37 vol.% SiC/2024 composite after turning. Compared with the 3D surface topography of the TiB2/2024 composite in Figure 13c, it is evident that the TiB2/2024 composite exhibits the least surface defects and the lowest surface roughness. This is attributed to the moderate content of TiB2 particles and their excellent interfacial bonding with the matrix, which reduces particle detachment during machining [32]. As shown in Figure 15c, the surface of the 15 vol.% diamond/2024 composite is uneven, with local grooved features generated during turning; the groove widths are notably narrower than those of the TiB2/2024 composite. The surface roughness value (Sa) is approximately 225 nm, primarily due to the high hardness of diamond particles, which makes cutting with the PCD tool more difficult. Additionally, the weak bonding between the diamond particles and the matrix results in surface protrusions and pits. Figure 15d shows that the surface of the SiC/2024 composite lacks distinct turning grooves and exhibits an irregular, uneven morphology. The surface roughness is the highest, approximately 250 nm, due to weak particle–matrix bonding, particle detachment, adhesion, and scratching. Furthermore, the high content of SiC particles leads to excessive and disordered defects, including particle adhesion, detachment, and matrix scratches, resulting in the poorest surface quality among the composites.

3.3.3. Machining Performance of TiB2/2024 Composite After T6 Heat Treatment

Figure 16a shows the turned surface morphology of the TiB2/2024 composite after T6 heat treatment. Compared with the surface morphology of the hot-pressed TiB2/2024 composite (Figure 12a), the T6 heat-treated composite exhibits significantly reduced turning scratches, matrix adhesion, and substrate cracking. This improvement can be attributed to the formation of fine Al–Cu and Al–Cu–Mg precipitates in the composite matrix following T6 heat treatment, which enhance the strength and hardness of the composite. This, in turn, restricts plastic flow in the cutting zone, reduces matrix cracking and adhesion, and mitigates surface scratches induced by turning. Figure 16b displays the tool morphology after turning the T6 heat-treated TiB2/2024 composite, with a flank wear width of 91.34 μm. Compared with machining the hot-pressed composite, tool wear is further reduced. Figure 16c presents the 3D surface morphology of the T6 heat-treated TiB2/2024 composite after turning. In comparison to the hot-pressed composite (Figure 13c), the surface roughness value (Sa) is significantly reduced to approximately 79 nm. The turning marks on the machined surface are uniform, with minimal variation in peak and valley heights, resulting in an almost planar surface. This improvement is attributed to the dissolution of coarse CuAl2 precipitates during T6 heat treatment and the re-dissolution of solute atoms into the matrix, which reduces cutting-induced heat generation and stabilizes the cutting process. Furthermore, T6 heat treatment decreases tool wear (Figure 16b), thereby minimizing fluctuations in cutting force and contributing to a smoother, more consistent machined surface [33].

4. Conclusions

Based on the investigation of three composites with comparable elastic moduli, this study demonstrates that the type of reinforcement, particle size, and heat treatment have a significant impact on the microstructure, mechanical, and machining properties of the composites. The principal findings are summarized as follows:
(1)
With an increase in reinforcement particle size, the agglomeration of reinforcing particles decreases, but the tensile strength of the composite shows a declining trend. Larger reinforcement particles are more prone to pull-out during machining, inducing surface cracks and consequently leading to higher surface roughness in turning. However, the presence of coarse particles can reduce abrasive wear, thereby lowering tool wear.
(2)
Among the three composites with similar elastic moduli, the TiB2-reinforced phase exhibits the best interfacial bonding performance with the 2024 aluminum matrix, and no brittle Al4C3 phase forms. This material combination achieves the highest tensile strength. Since TiB2 has lower hardness than diamond and a lower volume fraction than SiC, turning the TiB2/2024 composite results in the lowest surface roughness and the least tool wear.
(3)
T6 heat treatment allows coarse precipitates to re-dissolve and precipitate as finer phases, hindering dislocation movement and further enhancing the mechanical properties of the composite. The dissolution and refinement of coarse CuAl2 phases during solution treatment and aging effectively reduce tool wear during turning, leading to further improvements in surface quality. The 27 vol.% TiB2/2024 composite subjected to T6 heat treatment demonstrates the optimal balance between mechanical properties and machining properties.
The synergistic effect of particle size and heat treatment processes provides an effective strategy for balancing the mechanical and machining properties of composites. This study offers an important reference for the precision manufacturing of high-modulus lightweight particle-reinforced aluminum matrix composites. However, this paper only investigated the mechanical and machining properties of TiB2-, diamond-, and SiC-reinforced aluminum matrix composites. There is a lack of models for more intuitive analysis of the reinforcement mechanisms and wear mechanisms. Future work could involve comparing more types of reinforcement particles and studying the thermophysical and other properties of the composites.

Author Contributions

C.T.: Conceptualization; methodology; software; validation; formal analysis; investigation; data curation; writing—original draft preparation; writing—review and editing; visualization. S.X.: methodology; validation. Q.B.: methodology; validation. H.W.: Conceptualization; methodology; resources; writing—review and editing; supervision; funding acquisition. B.L.: methodology; validation. L.J.: methodology; validation. J.Y.: conceptualization; methodology; resources; writing—review and editing; supervision; funding acquisition. X.Z.: conceptualization; methodology; resources; writing—review and editing; supervision; project administration; funding acquisition. All authors have read and agreed to the published version of the manuscript.

Funding

This study was financially supported by Beijing Mojin Technology Co., Ltd.—Kunming University of Science and Technology cooperation project (KKK0201651079), and the National Natural Science Foundation of China (52261009).

Data Availability Statement

The original contributions presented in this study are included in the article. Further inquiries can be directed to the corresponding author.

Acknowledgments

The authors also gratefully acknowledge the school of Materials Science and Engineering of Kunming University of Science and Technology for their helpful technical support.

Conflicts of Interest

The authors declare that this study received funding from Beijing Mojin Technology Co., Ltd. The funder was not involved in the study design, collection, analysis, interpretation of data, the writing of this article or the decision to submit it for publication.

References

  1. Laghari, R.A.; Jamil, M.; Laghari, A.A.; Khan, A.M. Material characteristics and machinability of metal matrix composite materials: A critical review on recent advances and future perspectives. Measurement 2024, 242, 115839. [Google Scholar] [CrossRef]
  2. Su, N.; Liu, K.; Su, Y.; Cai, Y.; Dong, Y.; Hua, A.; Guan, L.; Cao, H.; Liu, Y.; Ouyang, Q.; et al. Fabrication, microstructural characterization and mechanical properties of carbon nanotubes and silicon carbide nanoparticles hybrid reinforced aluminum matrix composites. Mater. Sci. Eng. A 2025, 937, 148444. [Google Scholar] [CrossRef]
  3. Peng, Y.; Song, M.; Li, C.; Xu, Z.; Fu, L.; Liu, L.; Liu, L.; Chen, X.; Yi, J.; Eckert, J. Strength and ductility synergy of SiC reinforced aluminum matrix composites through interface replacement strategy. Int. J. Plast. 2025, 193, 104450. [Google Scholar] [CrossRef]
  4. Salifu, S.; Olubambi, P.A. High entropy alloy reinforced lightweight metal matrix composites: A review of the fundamentals, fabrication, properties, and prospects. Mater. Today Sustain. 2025, 32, 101216. [Google Scholar] [CrossRef]
  5. Rivera-Salinas, J.E.; Gregorio-Jáuregui, K.M.; Romero-Serrano, J.A.; Cruz-Ramírez, A.; Hernández-Hernández, E.; Miranda-Pérez, A.; Gutierréz-Pérez, V.H. Simulation on the Effect of Porosity in the Elastic Modulus of SiC Particle Reinforced Al Matrix Composites. Metals 2020, 10, 391. [Google Scholar] [CrossRef]
  6. Jiang, T.; Zhu, T.; Chen, Z.; Hou, H.; Jin, M.; Wang, L. Research on Young’s Modulus Prediction Model of Particle Reinforced Composites. In Proceedings of the 2022 5th World Conference on Mechanical Engineering and Intelligent Manufacturing (WCMEIM), Ma’anshan, China, 18–20 November 2022; pp. 462–466. [Google Scholar] [CrossRef]
  7. Liu, X.; Yao, L.; Li, H.; Wang, B.; Zhao, C.; Zheng, L.; Liao, Y.; Wang, D. AWJ machining of high-volume fraction SiCp/Al composites. Int. J. Adv. Manuf. Technol. 2023, 129, 941–954. [Google Scholar] [CrossRef]
  8. Liu, G.; Chen, T.; Wang, Z. Effects of solid solution treatment on microstructure and mechanical properties of SiCp/2024 Al composite: A comparison with 2024 Al alloy. Mater. Sci. Eng. A 2021, 817, 141413. [Google Scholar] [CrossRef]
  9. Chen, B.; Xi, X.; Gu, T.; Tan, C.; Song, X. Influence of heat treatment on microstructure evolution and mechanical properties of TiB2/Al 2024 composites fabricated by directed energy deposition. J. Mater. Res. Technol. 2020, 9, 14223–14236. [Google Scholar] [CrossRef]
  10. Wang, P.; Gammer, C.; Brenne, F.; Niendorf, T.; Eckert, J.; Scudino, S. A heat treatable TiB2/Al-3.5Cu-1.5Mg-1Si composite fabricated by selective laser melting: Microstructure, heat treatment and mechanical properties. Compos. Part B Eng. 2018, 147, 162–168. [Google Scholar] [CrossRef]
  11. Chen, J.-P.; Gu, L.; He, G.-J. A review on conventional and nonconventional machining of SiC particle-reinforced aluminium matrix composites. Adv. Manuf. 2020, 8, 279–315. [Google Scholar] [CrossRef]
  12. Singh, H.; Singh, K.; Vardhan, S.; Mohan, S.; Singh, V. A comprehensive review of aluminium matrix composite reinforcement and fabrication methodologies. Funct. Compos. Struct. 2021, 3, 015007. [Google Scholar] [CrossRef]
  13. GB/T 228.1-2021; Metallic Materials—Tensile Testing—Part 1: Method of Test at Room Temperature. China Standards Press: Beijing, China, 2021.
  14. Zhang, J.; Zhang, X.; Zhang, N.; Jiang, F.; Li, L.; Yuan, Z.; Wang, X.; Li, Z.; Cao, P.; Hayat, M. Microscopic mechanical properties of TiB2/A390 composites studied using in-situ synchrotron X-ray diffraction. J. Mater. Res. Technol. 2025, 38, 1890–1897. [Google Scholar] [CrossRef]
  15. Yu, H.; Jiaqin, L.; Yucheng, W. Latest research progress of SiCp/Al composite for electronic packaging. Rev. Adv. Mater. Sci. 2023, 62, 20230158. [Google Scholar] [CrossRef]
  16. Wang, Y.; Monetta, T. Systematic study of preparation technology, microstructure characteristics and mechanical behaviors for SiC particle-reinforced metal matrix composites. J. Mater. Res. Technol. 2023, 25, 7470–7497. [Google Scholar] [CrossRef]
  17. Singh, B.; Kumar, I.; Saxena, K.K.; Mohammed, K.A.; Khan, M.I.; Ben Moussa, S.; Abdullaev, S.S. A future prospects and current scenario of aluminium metal matrix composites characteristics. Alex. Eng. J. 2023, 76, 1–17. [Google Scholar] [CrossRef]
  18. Wu, L.; Yu, Z.; Liu, C.; Ma, Y.; Huang, Y.; Wang, T.; Yang, L.; Yan, H.; Liu, W. Microstructure and tensile properties of aluminum powder metallurgy alloy prepared by a novel low-pressure sintering. J. Mater. Res. Technol. 2021, 14, 1419–1429. [Google Scholar] [CrossRef]
  19. Anand, S.H.; Venkateswaran, N.; Sathishkumar, B.; Rajeshkumar, L. Microstructural, Mechanical and Tribological Analysis of TiB2 Ceramic-Reinforced Al6061 Aluminium Alloy Composites. Arab. J. Sci. Eng. 2024, 49, 1827–1842. [Google Scholar] [CrossRef]
  20. Hu, L.; Zhang, X.; Xie, C.; Zhang, X.; Shen, J. The effects of network reinforcement distribution on the mechanical properties and cutting behavior of SiCp/Al composites. Int. J. Mater. Form. 2024, 17, 49. [Google Scholar] [CrossRef]
  21. Li, Q.; Zhang, X.; Wang, L.; Qiao, J. The Effect of Extrusion and Heat Treatment on the Microstructure and Tensile Properties of 2024 Aluminum Alloy. Materials 2022, 15, 7566. [Google Scholar] [CrossRef]
  22. Xue, W.; Jiang, L.; Zhang, B.; Jing, D.; He, T.; Chen, G.; Xiu, Z.; Wu, G. Quantitative analysis of the effects of particle content and aging temperature on aging behavior in B4C/6061Al composites. Mater. Charact. 2020, 163, 110305. [Google Scholar] [CrossRef]
  23. Wang, L.; Yang, S.; Wang, S.; Pan, Y.; Xing, Y. Microstructure and mechanical properties of 6H–SiC/6092Al composites prepared by powder metallurgical method. J. Mater. Res. Technol. 2025, 35, 6007–6025. [Google Scholar] [CrossRef]
  24. Pugazhenthi, A.; Dinaharan, I.; Selvam, J.D.R.; Jen, T.-C. Influence of cutting speed and particulate content on polycrystalline diamond tool wear in machining AA7075/TiB2 in situ aluminum matrix composites. Measurement 2024, 234, 114873. [Google Scholar] [CrossRef]
  25. Ma, K.; Liu, Z.; Wang, B.; Song, Q.; Cai, Y. How does the uncut chip thickness affect the deformation states within the primary shear zone during metal cutting? Int. J. Mach. Tools Manuf. 2024, 199, 104161. [Google Scholar] [CrossRef]
  26. Cheung, C.; Chan, K.; To, S.; Lee, W. Effect of reinforcement in ultra-precision machining of Al6061/SiC metal matrix composites. Scr. Mater. 2002, 47, 77–82. [Google Scholar] [CrossRef]
  27. Hua, G.; Ran, L.; Zhang, S.; Su, Y. Microstructure and mechanical properties of extruded TiB2/2024 aluminum matrix composites. Mater. Res. Express 2023, 10, 016516. [Google Scholar] [CrossRef]
  28. James, S.J.; Venkatesan, K.; Kuppan, P.; Ramanujam, R. Hybrid Aluminium Metal Matrix Composite Reinforced with SiC and TiB2. Procedia Eng. 2014, 97, 1018–1026. [Google Scholar] [CrossRef]
  29. Lin, K.; Wang, W.; Jiang, R.; Xiong, Y. Effect of Rake Angle and Feed Rate on the Surface Quality While Turning In Situ TiB2/7050 Al Metal Matrix Composites. In Proceedings of the ASME 2018 International Mechanical Engineering Congress and Exposition, Pittsburgh, PA, USA, 15–19 November 2018. [Google Scholar] [CrossRef]
  30. Wang, P.; Xiu, Z.; Jiang, L.; Chen, G.; Lin, X.; Wu, G. Enhanced thermal conductivity and flexural properties in squeeze casted diamond/aluminum composites by processing control. Mater. Des. 2015, 88, 1347–1352. [Google Scholar] [CrossRef]
  31. Diler, E.A.; Ipek, R. Main and interaction effects of matrix particle size, reinforcement particle size and volume fraction on wear characteristics of Al–SiCp composites using central composite design. Compos. Part B Eng. 2013, 50, 371–380. [Google Scholar] [CrossRef]
  32. Pugazhenthi, A.; Kanagaraj, G.; Dinaharan, I.; Selvam, J.D.R. Turning characteristics of in situ formed TiB2 ceramic particulate reinforced AA7075 aluminum matrix composites using polycrystalline diamond cutting tool. Measurement 2018, 121, 39–46. [Google Scholar] [CrossRef]
  33. Anandakrishnan, V.; Mahamani, A. Investigations of flank wear, cutting force, and surface roughness in the machining of Al-6061–TiB2 in situ metal matrix composites produced by flux-assisted synthesis. Int. J. Adv. Manuf. Technol. 2010, 55, 65–73. [Google Scholar] [CrossRef]
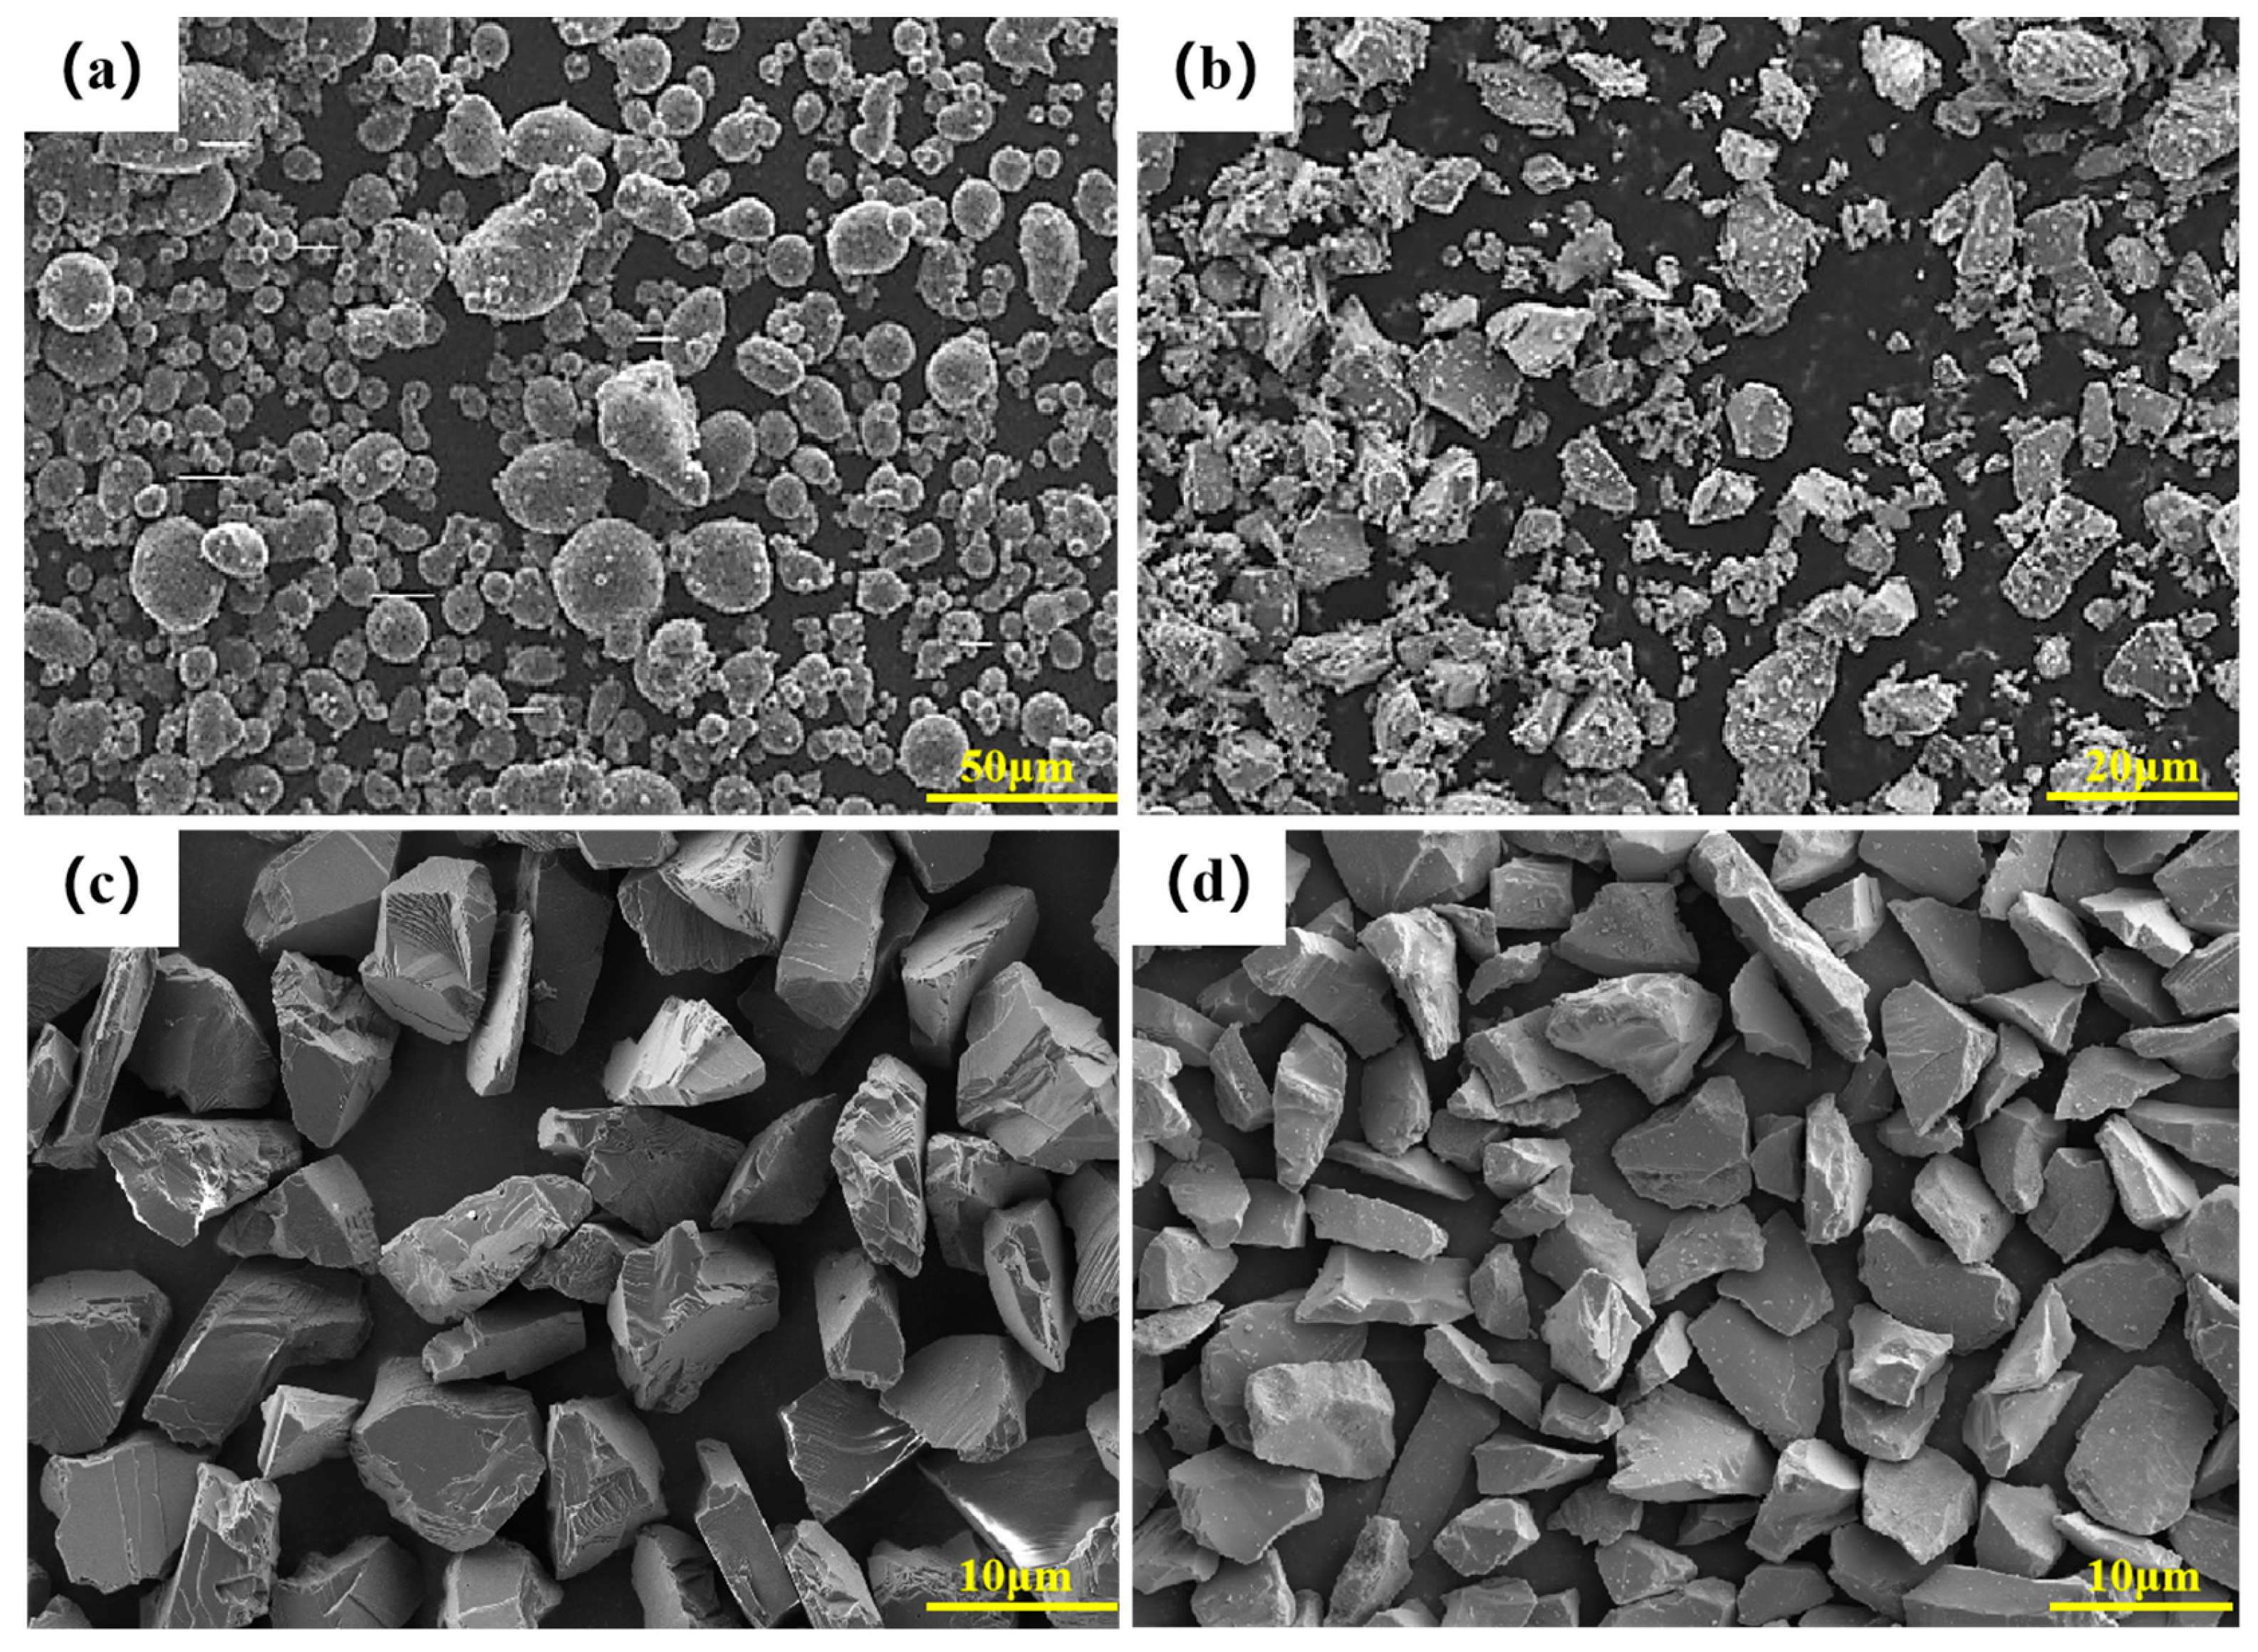
Figure 1. Particle morphology: (a) 13 μm 2024 aluminum alloy particles; (b) 7 μm TiB2 particles; (c) 7 μm diamond particles; (d) 7 μm SiC particles.
Metals 16 00018 g001
Figure 2. Preparation of particle-reinforced 2024 composites.
Metals 16 00018 g002
Figure 3. Tensile specimens of PRAMCs (unit: mm).
Metals 16 00018 g003
Figure 4. Hot-pressed 27 vol.% TiB2/2024 composite: (a,c) 7 μm TiB2/2024 composite XRD, metallographic structure; (b,d) 25 μm TiB2/2024 composite XRD, metallographic structure.
Metals 16 00018 g004
Figure 5. 27 vol.% TiB2/2024 hot-pressed composite BSE image and EDS analysis: (a) 7 μm composite BSE image; (b) 25 μm composite BSE image; (c) Point 1 EDS analysis; (d) Point 2 EDS analysis.
Metals 16 00018 g005
Figure 6. Interfacial morphology of hot-pressed 2024 composite with different reinforcements: (a) 27 vol.% TiB2/2024; (b) 15 vol.% diamond/2024; (c) 37 vol.% SiC/2024.
Metals 16 00018 g006
Figure 7. Element line scan at the interface of hot-pressed 2024 composite with different reinforcement particles: (a,b) 15 vol.% diamond/2024; (c,d) 37 vol.% SiC/2024.
Metals 16 00018 g007
Figure 8. T6 heat treatment 7 μm, 27 vol.% TiB2/2024 composite: (a) XRD pattern; (b) BSE image.
Metals 16 00018 g008
Figure 9. Tensile stress–strain curves and fracture morphology of hot-pressed TiB2/2024 composite with different TiB2 particle sizes: (a) stress-strain curves; (b) 7 μm TiB2/2024 composite; (c) 25 μm TiB2/2024 composite.
Metals 16 00018 g009
Figure 10. Tensile stress–strain curves and fracture morphology of hot-pressed 2024 composite with different reinforcement particles: (a) stress–strain curves; (b) 27 vol.% TiB2/2024; (c) 15 vol.% diamond/2024; (d) 37 vol.% SiC/2024.
Metals 16 00018 g010
Figure 11. Tensile stress–strain curves and fracture morphology of TiB2/2024 composite: (a) stress–strain curves; (b) T6 heat treatment TiB2/2024 composite fracture morphology.
Metals 16 00018 g011
Figure 12. Turning surface morphology of hot-pressed 2024 composite with different TiB2 particle sizes: (a) 7 μm TiB2/2024 composite; (b) 25 μm TiB2/2024 composite.
Metals 16 00018 g012
Figure 13. Tool morphology: (a) Turning TiB2/2024 composite with 7 μm reinforcement particles; (b) Turning TiB2/2024 composite with 25 μm reinforcement particles; 3D surface topography: (c) TiB2/2024 composite with 7 μm reinforcement particles, (d) TiB2/2024 composite with 25 μm reinforcement particles.
Metals 16 00018 g013
Figure 14. Turning surface morphology of hot-pressed (a) 15 vol.% diamond/2024 composite; (b) 37 vol.% SiC/2024 composite.
Metals 16 00018 g014
Figure 15. Tool morphology: (a) Turning 15 vol.% diamond/2024 composite; (b) Turning 37 vol.% SiC/2024 composite; 3D surface topography: (c) 15 vol.% diamond/2024 composite; (d) 37 vol.% SiC/2024 composite.
Metals 16 00018 g015
Figure 16. Turning T6 heat treatment TiB2/2024 composite: (a) The surface morphology of TiB2/2024 composite; (b) PCD tool morphology; (c) 3D surface morphology of TiB2/2024 composite.
Metals 16 00018 g016
Table 1. 2024 Aluminum alloy composition/wt.%.
CuMgMnFeSiZnNiTiAl
4.41.580.720.250.380.060.030.03Margin
Table 2. Composite sample table.
NumberingCompositesReinforcement ParticlesReinforcement Content/vol.%Reinforcement Size/μmState
1#TiB2/2024TiB2277hot pressed
2#TiB2/2024TiB22725hot pressed
3#TiB2/2024TiB2277T6 heat treatment
4#diamond/2024diamond157hot pressed
5#SiC/2024SiC377hot pressed
Table 3. Mechanical properties of composites with different reinforcement sizes.
CompositesTiB2 Sizes/μmElastic Modulus/GPaTensile Strength/MPaElongation/%
TiB2/20247211397.12.3
TiB2/202425211371.72.4
Table 4. Mechanical properties of composites with different reinforcements.
CompositesReinforcement Particle Size/μmElastic Modulus/GPaTensile Strength/MPaElongation/%
diamond/20247223205.91.5
SiC/20247209381.41.2
Table 5. Mechanical properties of composites after T6 heat treatment.
CompositesHeat TreatmentElastic Modulus/GPaTensile Strength/MPaElongation/%
TiB2/2024T6211421.71.1
Disclaimer/Publisher’s Note: The statements, opinions and data contained in all publications are solely those of the individual author(s) and contributor(s) and not of MDPI and/or the editor(s). MDPI and/or the editor(s) disclaim responsibility for any injury to people or property resulting from any ideas, methods, instructions or products referred to in the content.