Article

Recovery of Rare Earth Elements from Spent NdFeB Magnets: Metal Extraction by Molten Salt Electrolysis (Third Part)

1
IME Process Metallurgy and Metal Recycling, RWTH Aachen University, 52056 Aachen, Germany
2
Chemical Engineering Department, Universitas Gadjah Mada, Yogyakarta 55281, Indonesia
3
TRIMET Aluminium SE, Aluminiumalle 1, 45356 Essen, Germany
4
Department of Electrochemistry, Institute of Chemistry, Technology and Metallurgy, National Institute, University of Belgrade, Njegoševa 12, 11000 Belgrade, Serbia
*
Author to whom correspondence should be addressed.
Metals 2023, 13(3), 559; https://doi.org/10.3390/met13030559
Submission received: 8 February 2023 / Revised: 28 February 2023 / Accepted: 7 March 2023 / Published: 10 March 2023

Abstract

:
The results obtained from the work on a concept of a recycling process for NdFeB magnets to recover rare earth elements for remanufacturing similar magnets are presented. This paper investigates the viability of extracting rare earth metals from magnet recycling-derived oxide (MRDO) by means of molten salt electrolysis. The MRDO was produced from spent NdFeB magnets through oxidation in air and subsequently carbothermic reduction under an 80 mbar Ar gas atmosphere. This MRDO contained roughly 33 wt.% Nd and 10 wt.% Pr. The electrochemical reduction process of the MRDO on molybdenum electrodes in NdF3 + LiF and NdF3 + PrF3 + LiF fused salts systems was investigated by cyclic voltammetry and chronoamperometry measurements. The resulting electrolytes and electrodes were examined after potentiostatic deposition by scanning electron microscopy (SEM), inductively coupled plasma optical emission spectroscopy (ICP-OES), and X-ray diffraction (XRD) analysis. The electrodeposited metals appeared to accumulate on the cathode and X-ray diffraction analysis confirmed the formation of metallic Nd and Pr on the working substrate. The suitability of the obtained alloy intended for the remanufacturing of NdFeB magnets was then evaluated.

1. Introduction

In order to achieve a greener environment by means of efficient energies and manufacturing technologies that underpin climate transition, the demand for rare earth assets has since skyrocketed over the past two decades [1,2,3]. China’s dominance in rare earth production and supply along with an increase in the available NdFeB magnets in the market [1], strongly motivates the recovery of rare earth elements from secondary sources such as production scrap, waste, and spent materials. NdFeB magnets are also among the most valuable secondary rare earth sources because of their high content of Dy, Nd, and Pr of up to 31–32 wt.% [1,4,5,6,7,8]. The potential recycling-to-supply ratio of Dy and Nd is expected to rise in the next 10 years due to the increasing amount of spent products [7]. Albeit the high recycling potential, the secondary production of rare earth elements is not well established and it is not conducted on an industrial scale [1]. Rare earth recycling efforts are heavily hindered by the absence of recycling technology, infrastructure, and strategies [9,10,11].
For this purpose, efforts were made to develop a complete recycling process for NdFeB magnets, producing raw materials for remanufacturing similar magnets and closing the loop for recycling [12,13]. Several recycling scenarios are available, including the one obtaining the rare earth in the form of their metallic phase [10,13]. This approach is more feasible and promising compared to other scenarios, as it is more suitable for current available spent magnet feedstock and can take many different magnet compositions as inputs [1,11]. Even though the composition of NdFeB magnets may differ based on their application, their manufacturing generally consists of two steps, namely, magnet alloy production and magnet production. Briefly, magnet alloy production prepares the NdFeB mixture from the raw material, which later will be magnetized during the magnet activation step. A recycling process that supplies rare earth metal as the product will be suitable to provide the material for the magnet alloy production step.
The first and second part of the study has been published under [4,7]. In the first part, spent NdFeB magnets were converted to mixed oxides by oxidizing them in an air atmosphere for 3 h at 1000 °C. The results of the quantitative analysis showed, in (wt.%) 53.41 Fe2O3, 10.37 Fe3O4; 16.45 NdFeO3; 0.45 Nd2O3, 1.28 Dy2O3, 1.07 Pr2O3, and 5.22 α-Fe.
The second part attempts and successfully remove a substantial amount of the iron from the oxidized magnets [7]. This was achieved by carbothermic reduction under a low-pressure Ar gas atmosphere using a carbon crucible as a source of reductant. For a laboratory scale of 100 g input materials, the solid-state reduction has been proven to be effective and sufficient. The smelting of the oxidized magnets produced rare earth oxide slags or magnet recycling-derived oxide (MRDO) and the metallic iron phase. ICP-OES analysis showed a total rare earth element content of 47.47 wt.%. The resulting MRDO from the second part can then be used in further processes of RE elements recovery.
Proceeding from the first two parts, this paper investigates the possibility of producing metallic Nd-Pr alloy from the smelted products via molten salt electrolysis. The production of the alloy is one of the crucial steps in NdFeB magnet industries. This alloy production is achievable through different processes, for instance, the Molycorp process which utilizes Nd (from calciothermic reduction of NdF3) and Fe and FeB as material during melting [8]. Other processes such as Ames, Comurhex and General Motors process uses Nd2O3 as starting Nd material instead of Nd(NO)3 in Molycorp process. The Nd2O3 then undergoes different but similar unit operations to produce Nd2Fe14B ingot or alloy powder [14]. The obtained alloy is then conveyed to the next step to activate its magnetic capability, either a melt-spinning route or a sintering route [14]. Among those processes, molten salt electrolysis (MSE) is the important technology to acquire either RE metal or RE-alloy.
A comprehensive review of this technology also confirmed that MSE has been mainly used as a primary industrial process for producing neodymium [15,16,17]. The feasibility of neodymium production from its oxide, considering its environmental impact, has been reported by Vogel et al. [5]. In the author’s work, besides neodymium electrolysis, the influence of the rare earth oxides’ presence that suppresses the occurrence of greenhouse gas (GHG) emissions was also investigated. The mechanism of gas emission during the MSE process was discussed in more detail elsewhere [15,18]. Fundamental aspects of the process have also been addressed, it was shown that Nd deposits in two steps, from Nd(III) to Nd(II) at ≈−0.40 V, then Nd(II) + 2e− → Nd(0) at ≈−0.525 V (with tungsten as reference electrode) [17,18]. Further work on the co-deposition leading to Nd-Pr alloy formation revealed that praseodymium can be deposited within one-step 3 electrons exchanged following the neodymium deposition [18,19,20]. Since the main parameters in the Nd-Pr alloy formation via MSE have been discussed [19,20,21], the next step of this development would be implementing this knowledge on a more actual and complex raw material, such as NdFeB-based rare earth oxide. The attempt to produce NdFeB magnets from recycled rare earth alloy scraps is a feasible concept [2,3,22]. Instead of using all parts of the magnet as the raw material, these methods lie in the production of REE alloy through the production of the metallic phase, which consists of the REE and iron. As the discussion on the production of rare earth oxide from magnet scraps has already been covered in the first and second parts of this endeavour, this third part will focus on completing the process of recycling the NdFeB magnet by means of the MSE process.
Therefore, this study is expected to produce Nd-Pr alloy that could be fed directly back to the vacuum alloying step in the production of new NdFeB magnets. The success and reproducibility of this process should ensure the circulation of already scarce rare earth elements.

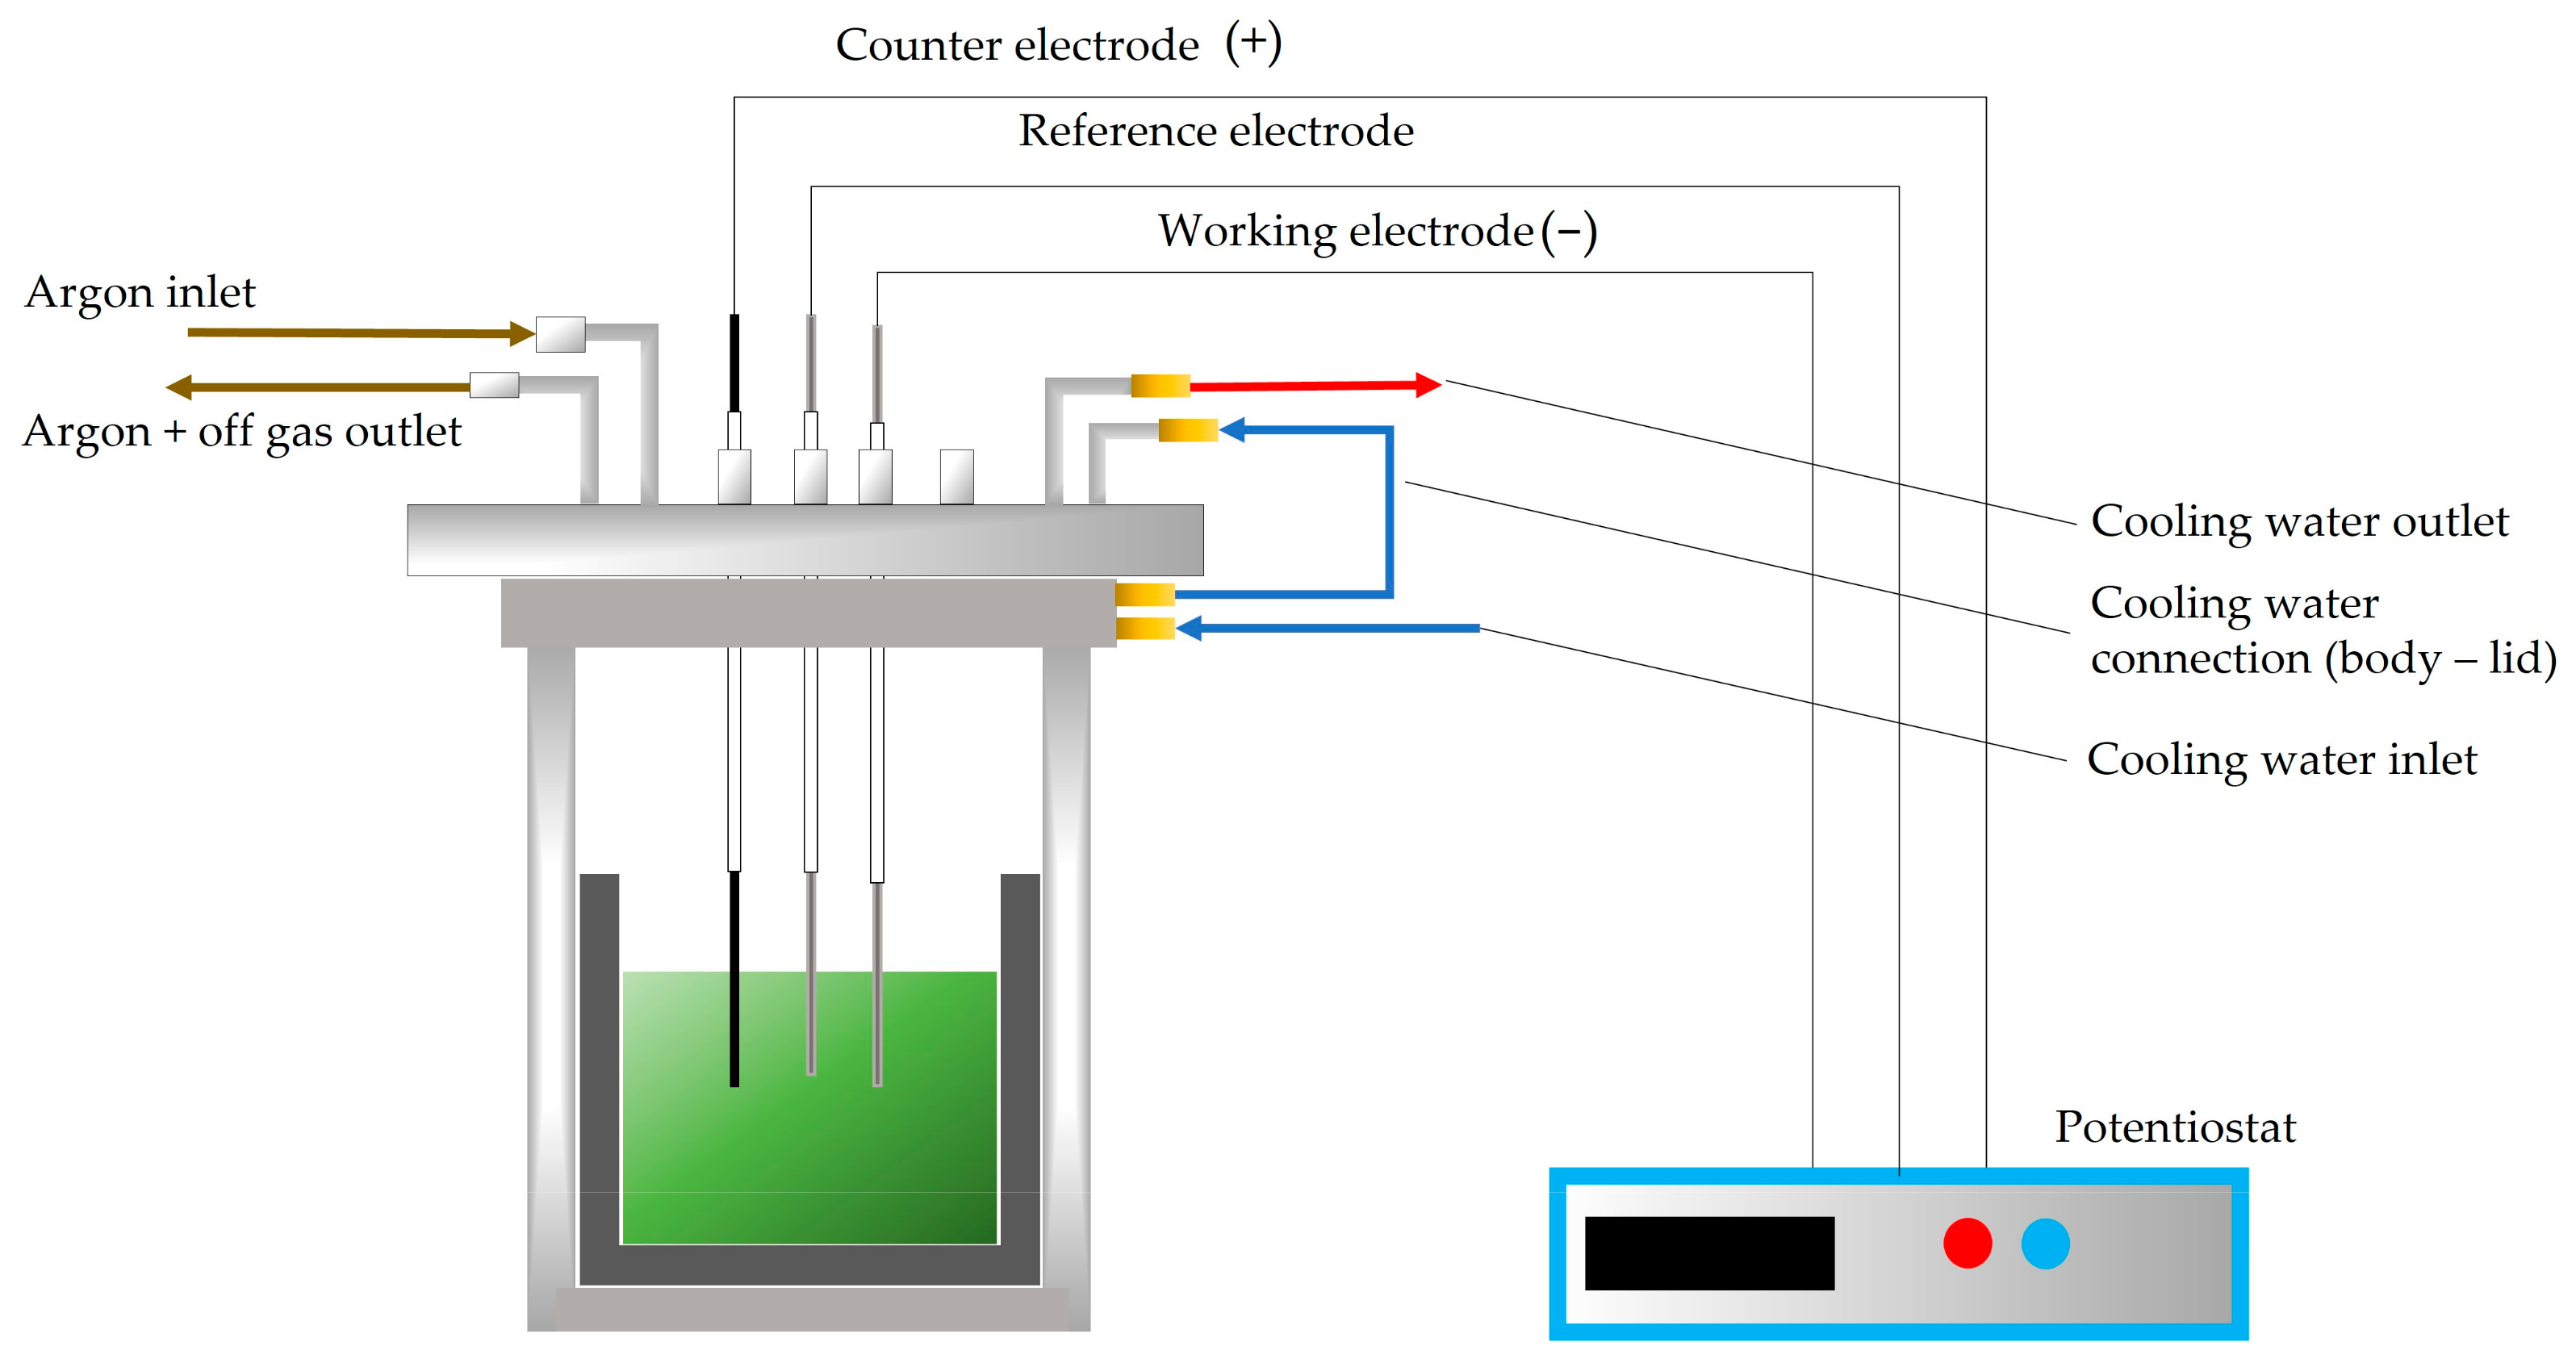
2. Materials and Method

The first step for the experimental phase of electrolysis is the preparation of the electrolyte. For the purpose of this work, two salts mixture with were prepared, LiF+NdF3 and LiF+NdF3+PrF3. The ternary phase diagram for fluoride-based electrolytes composed of NdF3+PrF3+LiF was constructed in our previous investigation [19]. The results provide theoretical support for the optimization of the rare earth electrolyte composition and realization of the rare earth electrolysis energy-savings. The electrolyte composition was chosen based on the data provided by a ternary phase diagram [19] and the operating temperature was set at 1050 °C based on previous studies [17,19,20].
The fluorides, NdF3 (Treibacher Industrie AG, Althofen, Austria, >99%), PrF3 (Treibacher Industrie AG, >99%), and LiF (Less Common Metals Ltd., Ellesmere Port, UK, >99%), were weighed and dried for 2 h at 200 °C inside a drying furnace. The dried powders were then mixed and fed into a high-purity graphite crucible (CTG GmbH & Co. KG, Bad Breisig, Germany) within a vacuum induction furnace according to [18]. A second crucible was placed in front of the coil to cast the electrolyte. The preparation of the electrolytes starts with floating the furnace with Ar gas twice and then setting an overpressure of 1800 mbar. This technique was to ensure an air and oxygen-free atmosphere. The mixture is then melted and homogenized in the furnace at up to 1100 °C.
After that, the respective electrolytes (83.33 wt.% NdF3 + 16.66 wt.% LiF and 61.10 wt.% NdF3 + 26.3 wt.% PrF3 + 12.60 wt.% LiF) were mixed with the ground MRDO inside a carbon crucible. The counter electrode (CE) consists of a glassy carbon rod (EWG 99.95%, 4 mm diameter), the working electrode (WE) was made of molybdenum (EWG > 99.95%, 2 mm diameter), and the reference electrode (RE) was made from tungsten (2 mm diameter, EWG 99.95%). The potential of the WE was measured relative to the RE in the melt under given conditions. The electrodes were polished with SiC emery paper and then consecutively rinsed with deionized water and ethanol to remove any impurities before being inserted into the cell using Swagelok connections in the lid and alumina tubes to separate the sealing from the heat. Notably, 1.5 cm of the electrode′s body was submerged in the electrolytes. To keep dangerous gases from escaping the cell during the experiments, the cell was covered with a water-cooled, gas-tight lid with Swagelok connections. To get the cell to the process temperature of 1050 °C in the electrolyte, the crucible containing electrolyte was placed inside a resistance-heated furnace and heated up to the temperature set in advance. A thermocouple Type B connected to a Swagelok connector was used to measure the temperature. To keep the melt from coming into contact with air, a 1.5 L/min continual argon flow purged the system. The exhaust system was used to treat the off-gas after it was moved into washing bottles filled with water and NaOH. An illustration of the electrolysis setup is shown in Figure 1. To avoid damage to the rubber sealing in the reactor’s lid, water cooling system was provided to cool the upper part of the cell.
The raw materials for the metal extraction are the MRDO obtained from the carbothermic reduction step of the recycling process in the second part [7]. The ICP-OES (Spectro Arcos, SPECTRO Analytical Instruments Gmbh, Kleve, Germany) analysis of the rare earth oxides is shown in Table 1, with total rare earth content of 43.4 wt.% and with significantly lower amount of iron compared to its raw magnet form. In addition to that, the phase composition of the MRDO was analyzed by a Rietveld-refined XRD analysis (Bruker D8 Advance, Karlsuhe, Germany), and results are listed in Table 2.
The ICP-OES result showed the presence of rare earth in the MRDO, but the XRD results give the inside into its composition. This analysis provides the information that different NdFeB-based rare earth oxides present in the MRDO can be the raw material for molten salt electrolysis processes.
A potentiostat model Ivium Stat (5 A, 10 V, IviumTechnologies, Eindhoven, The Netherlands) was used for the voltammetric measurements and to determine a suitable deposition potential. Cyclic voltammetry (CV) experiments were conducted on the Mo cathodes starting from initial potential to several different cathodic end potentials and back to the initial potential with different scan rates.
A total of four experiments with two different electrolyte compositions were used for the electrolysis of the same input materials (compare Table 3). Electrodeposition on molybdenum cathodes at different deposition potentials and times in different electrolyte systems was conducted at 1050 °C. After the deposition is completed, the WE was removed from the cell, allowing it to cool down at room temperature. The surfaces of the samples were examined by Scanning Electron Microscope (SEM) using the JSM 7000F by JEOL (construction year 2006, JEOL Ltd., Tokyo, Japan). The deposited metal and electrolyte were analyzed by ICP-OES. Solidified electrolyte was mechanically removed from the working electrode and subsequently analyzed by X-ray diffraction (XRD) with Philips PW 1050 powder diffractometer at room temperature with Ni filtered CuKα radiation (λ = 1.54178 Å), scintillation detector within 20–85° 2θ range in steps of 0.05°, and scanning time of 5 s per step.

3. Results and Discussion

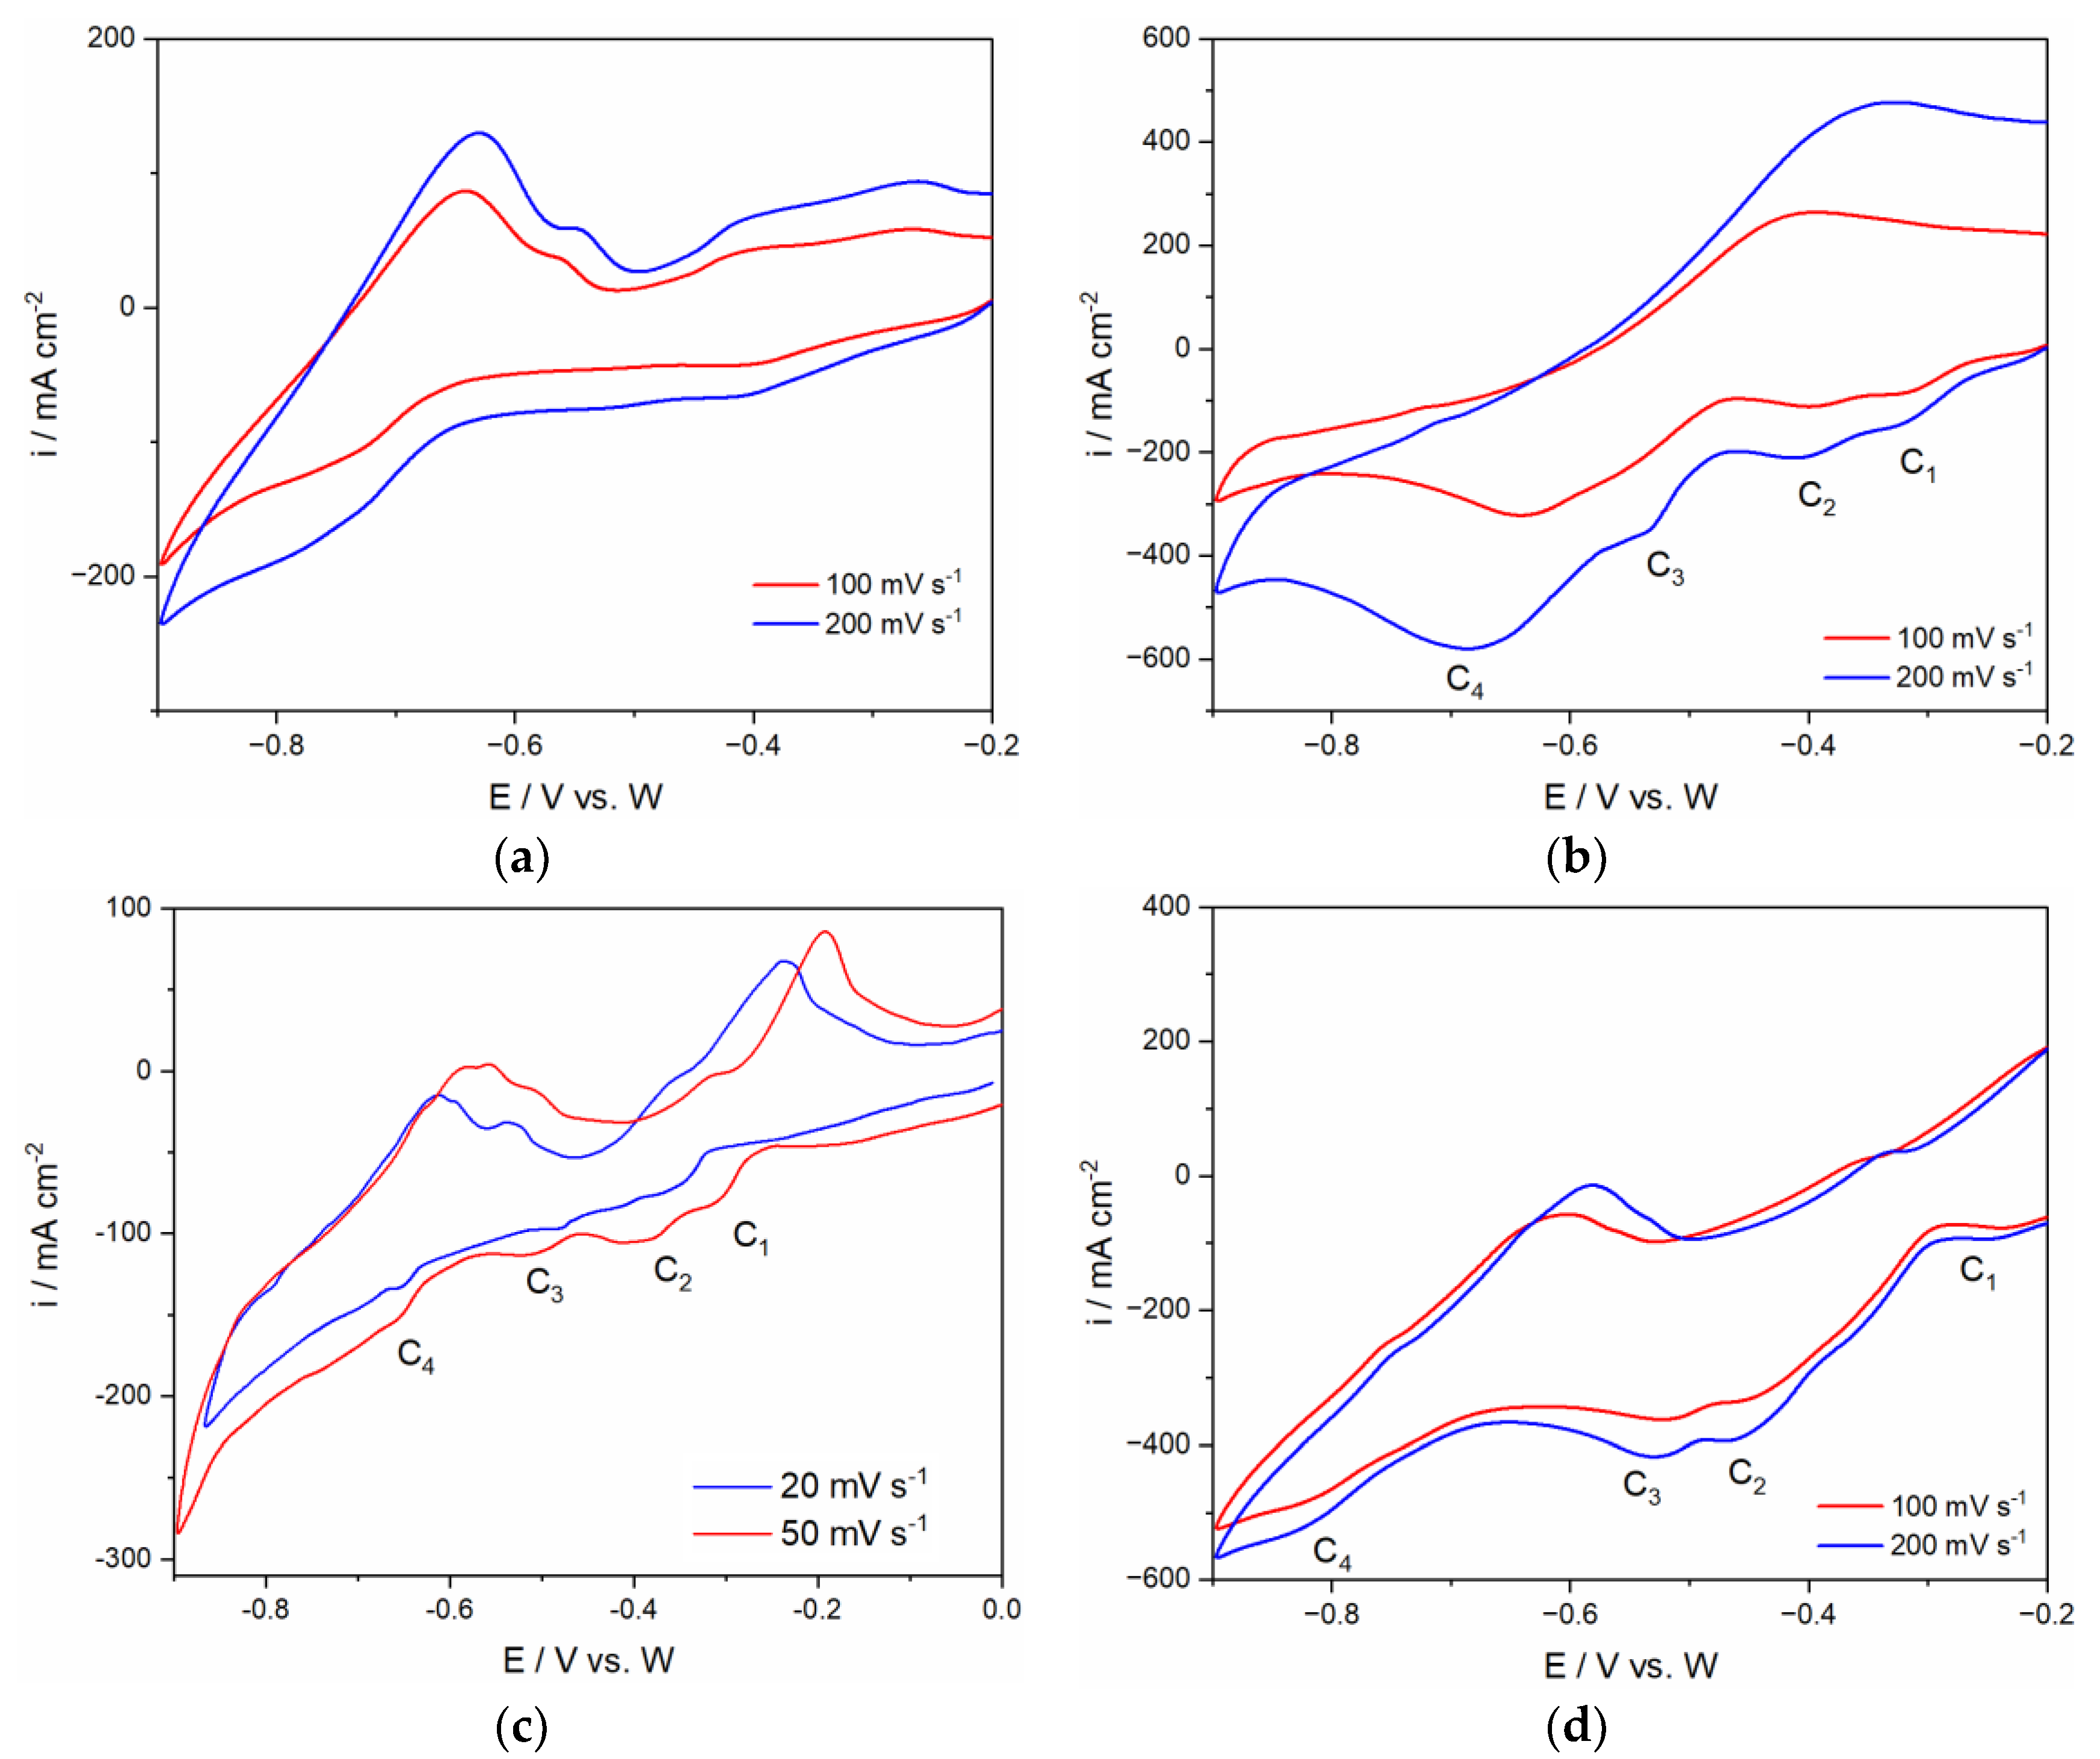
3.1. Cyclic Voltammetry

The voltammograms obtained on the Mo cathode from the LiF+NdF3 and LiF+NdF3+PrF3 system are presented in Figure 2a–d in the potential window starting from initial potential Ei = 0.00 V or −0.20 V to final cathodic end potential of −0.90 V at different sweep rates. The results are consistent with those previously reported from fluoride-based melts [19,20].
The goal is to determine the cathodic limits of the electrolyte that correspond to the reduction of Li. The anodic limit, on the other hand, should imply the oxidation of F ions and the formation of fluorocarbons such as CF4 and C2F6 at the anode. Determination of the cathodic limit could indicate the suitable deposition potential for the system. Compared to Fe, Nd, Pr, and Dy, Li has the most negative reduction potential. It should be noted that the content of LiF and rare earth oxides in the electrolyte system affects the change of current range and peak visibility within the potential range investigated. Dissolving a mixture of neodymium, praseodymium, and dysprosium oxides in a corresponding rare earth fluoride bath is based on the mass exchange between the added oxides and the rare earth fluorides [23]. In the electrolyte system composed of LiF combined with either PrF3 or NdF3, LiF as a donor of F ions acts as a diluting agent to dissolve rare earth oxides [24]. As a result, LiF improves the electrolyte conductivity and helps to reduce the electrolytes’ viscosity. Zuo et al. stated that when the mass of lithium fluoride in the electrolyte is 12.5 wt.%, with the temperature of 1100 °C, the conductivity of PrF3-NdF3-DyF3-LiF electrolyte reaches a maximum value of 2.34 S/cm [24]. However, if the LiF concentration in the original electrolyte is increased above this value, it reduces rare earth oxide solubility [19,23]. Therefore, up to 12.5 wt.% was selected as the best addition of LiF for REO dissolution in the system [19,24]. This means that under the same conditions, the addition of 16.67 wt.% LiF in one of the investigated electrolytes in this study (E-1) lowers the REO solubility from the MRDO resulting in lower current density and not well-pronounced corresponding cathodic current waves of the Nd and Pr redox processes recorded by the CV, Figure 2a. This is expected because rare earth oxides from the MRDO in fluoride-based electrolytes have relatively similar solubility due to the similarity in their atomic structure [23].
The addition of different rare earth oxides from the MRDO to the corresponding fluoride-based melt at a certain melt temperature most probably causes the distribution of dysprosium oxide/fluoride between praseodymium-neodymium fluoride and lithium fluoride as well [24]. Based on the present information and literature data the addition of an REO alone or a mixture in the corresponding fluoride electrolyte at a certain temperature, through dissolution produces the formation of various RE-O-F or/and RE-F complex groups [18,25,26,27]. The presence of the cathodic/anodic current waves on CV attributed to Nd or Pr or Dy redox transitions are the results of a number of those complexes formed in the melt, leading to rare earth metals deposition/dissolution on the cathode.
In the voltammograms illustrated in Figure 2a–d, at least three redox processes can be recognized. However, the identity of these individual current peaks is difficult to be determined due to the complexity of the system. Despite this, the diagrams confirmed that the system consisting of the MRDO and the chosen electrolyte (61.1 wt.% NdF3 + 26.3 wt.% PrF3 + 12.6 wt.% LiF) is not featureless.
As can be seen on voltammograms in Figure 2b–d, the change in MRDO concentration in the electrolyte is the reason for the different values of the reduction current densities recorded. A system with a lesser concentration of MRDO manifests a lower current range compared to a system with a higher percentage of MRDO. This finding is in agreement with previous works [5,19,25] which indicated that higher oxides concentration leads to a higher average current density of the redox processes. Moreover, adding more oxide also prevents anode passivation [5]. This condition allows the MSE process to be conducted safely within the investigated current range. Comparing the current wave peak potentials shown in Figure 2b,c to the similar current wave peak potentials obtained in our previous study with 64.4 wt.% NdF3 + 21.37 wt.% PrF3 + 12.25 wt.% LiF based electrolyte containing 2 wt.% or 4 wt.% in a total of the corresponding RE oxides, Nd2O3 or Pr6O11, on W and Mo working substrate for the Nd and Pr deposition and dissolution, under the same conditions, helped attribution of the redox processes that involved the deposition and dissolution of rare earth present in this electrolyte system [20].
Cvetkovic et al. reported that in the system of 64.41 wt.% NdF3 + 21.37 wt.% PrF3 + 12.25 wt.% LiF + 1 wt.% Pr6O11 + 1 wt.% Nd2O3, on Mo working electrodes, three well-pronounced cathodic current waves within the potential range applied were recorded [20]. The cathodic current waves (C2 and C3) with peak potentials starting at ≈−0.40 V and ≈−0.525 V which corresponds to the electrochemical reduction of Nd(III) to Nd(II) and Nd(II) to Nd(0) were also observed in recorded CV’s, Figure 2b. The electroreduction current wave of Pr(III) to Pr(0) in the previous study was recorded at ≈ −0.650 V and is in good agreement with the reduction peak C4 in this study, attributed to the same reduction process. The second system was studied by the same authors with 63.17 wt.% NdF3 + 20.96 wt.% PrF3 + 12.02 wt.% LiF + 2 wt.% Pr6O11 + 2 wt.% Nd2O3 showed on CV’s cathodic current waves (C1, C2, and C3) with peak potentials at ≈−0.40 V, ≈−0.55 V, and ≈−0.80 V, [20]. These results are again comparable with the data obtained from E-2 and E-3 electrolytes (Figure 2b,c), most probably because both systems have similar initial amounts of rare earth oxides. Within the potential range applied, Figure 2b, four peak potentials (C1 ≈ −0.32 V, C2 ≈ −0.40 V, C3 ≈ −0.52 V, C4 ≈ −0.70 V) could be observed and their values are close to the values noted on CV’s obtained under the similar conditions, as shown in Table 4.
This behavior remains almost unchanged during subsequent scanning from fluoride electrolytes E-2 containing 3 wt.% of MRDO, Figure 2c. Compared with the previous CVs, e.g., Figure 2b, the cathodic current waves were better pronounced with the lower scan rates applied. It seems that the values of the peak potentials for the cathodic current waves C2, C3, and C4 (C2 ≈ −0.40 V; C3 ≈ −0.51 V and C4 ≈ −0.67 V vs. W) deviate slightly from the other values recorded in our previous study but still remain in the range obtained in E-3. In the voltammograms of Figure 2c the cathodic current waves C2, C3, and C4 could be again correlated to the electrochemical steps of Nd(III) and Pr(III) cations being reduced to the metals on the working substrate.
In the voltammograms obtained from the E-4 electrolyte, as illustrated in Figure 2d, the potential was scanned starting from initial potential, Ei = −0.20 V in a negative direction to the final cathodic end potential of EC = −0.90 V vs. W, with different scan rates. From the voltammograms, it can be seen that at least three redox processes are better defined than the rest. Moreover, with increasing amounts of MRDO in the electrolyte, a shift in the reduction peaks of C4 toward the more negative values was observed. For example, the cathodic peak C4 in the electrolytes with 3 and 4wt.% of MRDO was observed at ≈−0.70 V, and in the electrolyte with 6wt.% of MRDO at ≈−0.80 V. The peak potential values slightly deviate from the values obtained in Cvetkovic’s study but still remain in the range. It seems that the presence of different content of the MRDO in the electrolyte causes changes in the cathodic current density but did not significantly influence the position of current peaks on the voltammograms.
However, in this study, the cathodic current peak C1, Figure 2b–d that appeared at around −0.32 V has not been recorded in previous studies [19,20,21]. According to the data published from our earlier work, in the fluoride electrolyte under the same conditions, the cathodic current peak C1 can be assigned to the possible deposition of Fe. This was supported by XRD analysis, showing that this metal is present as deposited on the cathode.
Corresponding anodic counterparts to the cathodic reduction current waves present in the CV indicate that stripping of the deposited material is not well-pronounced. In other words, the recorded CV in the anodic part gives the picture reflecting the dissolution of a number of individual metals and possible alloys formed during the deposition [28]. It has been shown that from fluoride and chloride-based melts made of different rare earth salts, including Nd, Pr, Dy, Fe, Al, etc., in the range of the temperatures applied in this study, a number of iron and aluminum alloys could be produced. This should inevitably influence well-pronounced current waves reflecting individual deposition/dissolution of Nd, Pr, and Dy, as in our previous investigation. However, a further detailed investigation is necessary.
When the electrode potential is set more negative than −1.00 V, current density showed a straight-up increase, meaning that this redox reaction should be a reduction of Li+ ions. Based on this, the cathodic boundary was chosen to be −1.02 V for E-4 and −0.85 V for E-2 electrolyte. The CV results have shown that these cathodic end potentials are negative enough to sustain neodymium and praseodymium co-deposition without triggering the lithium deposition. The electrolyte E-4 was made from E-3 by adding more MRDO. The total MRDO content in the electrolyte finally was roughly 6 wt.%.

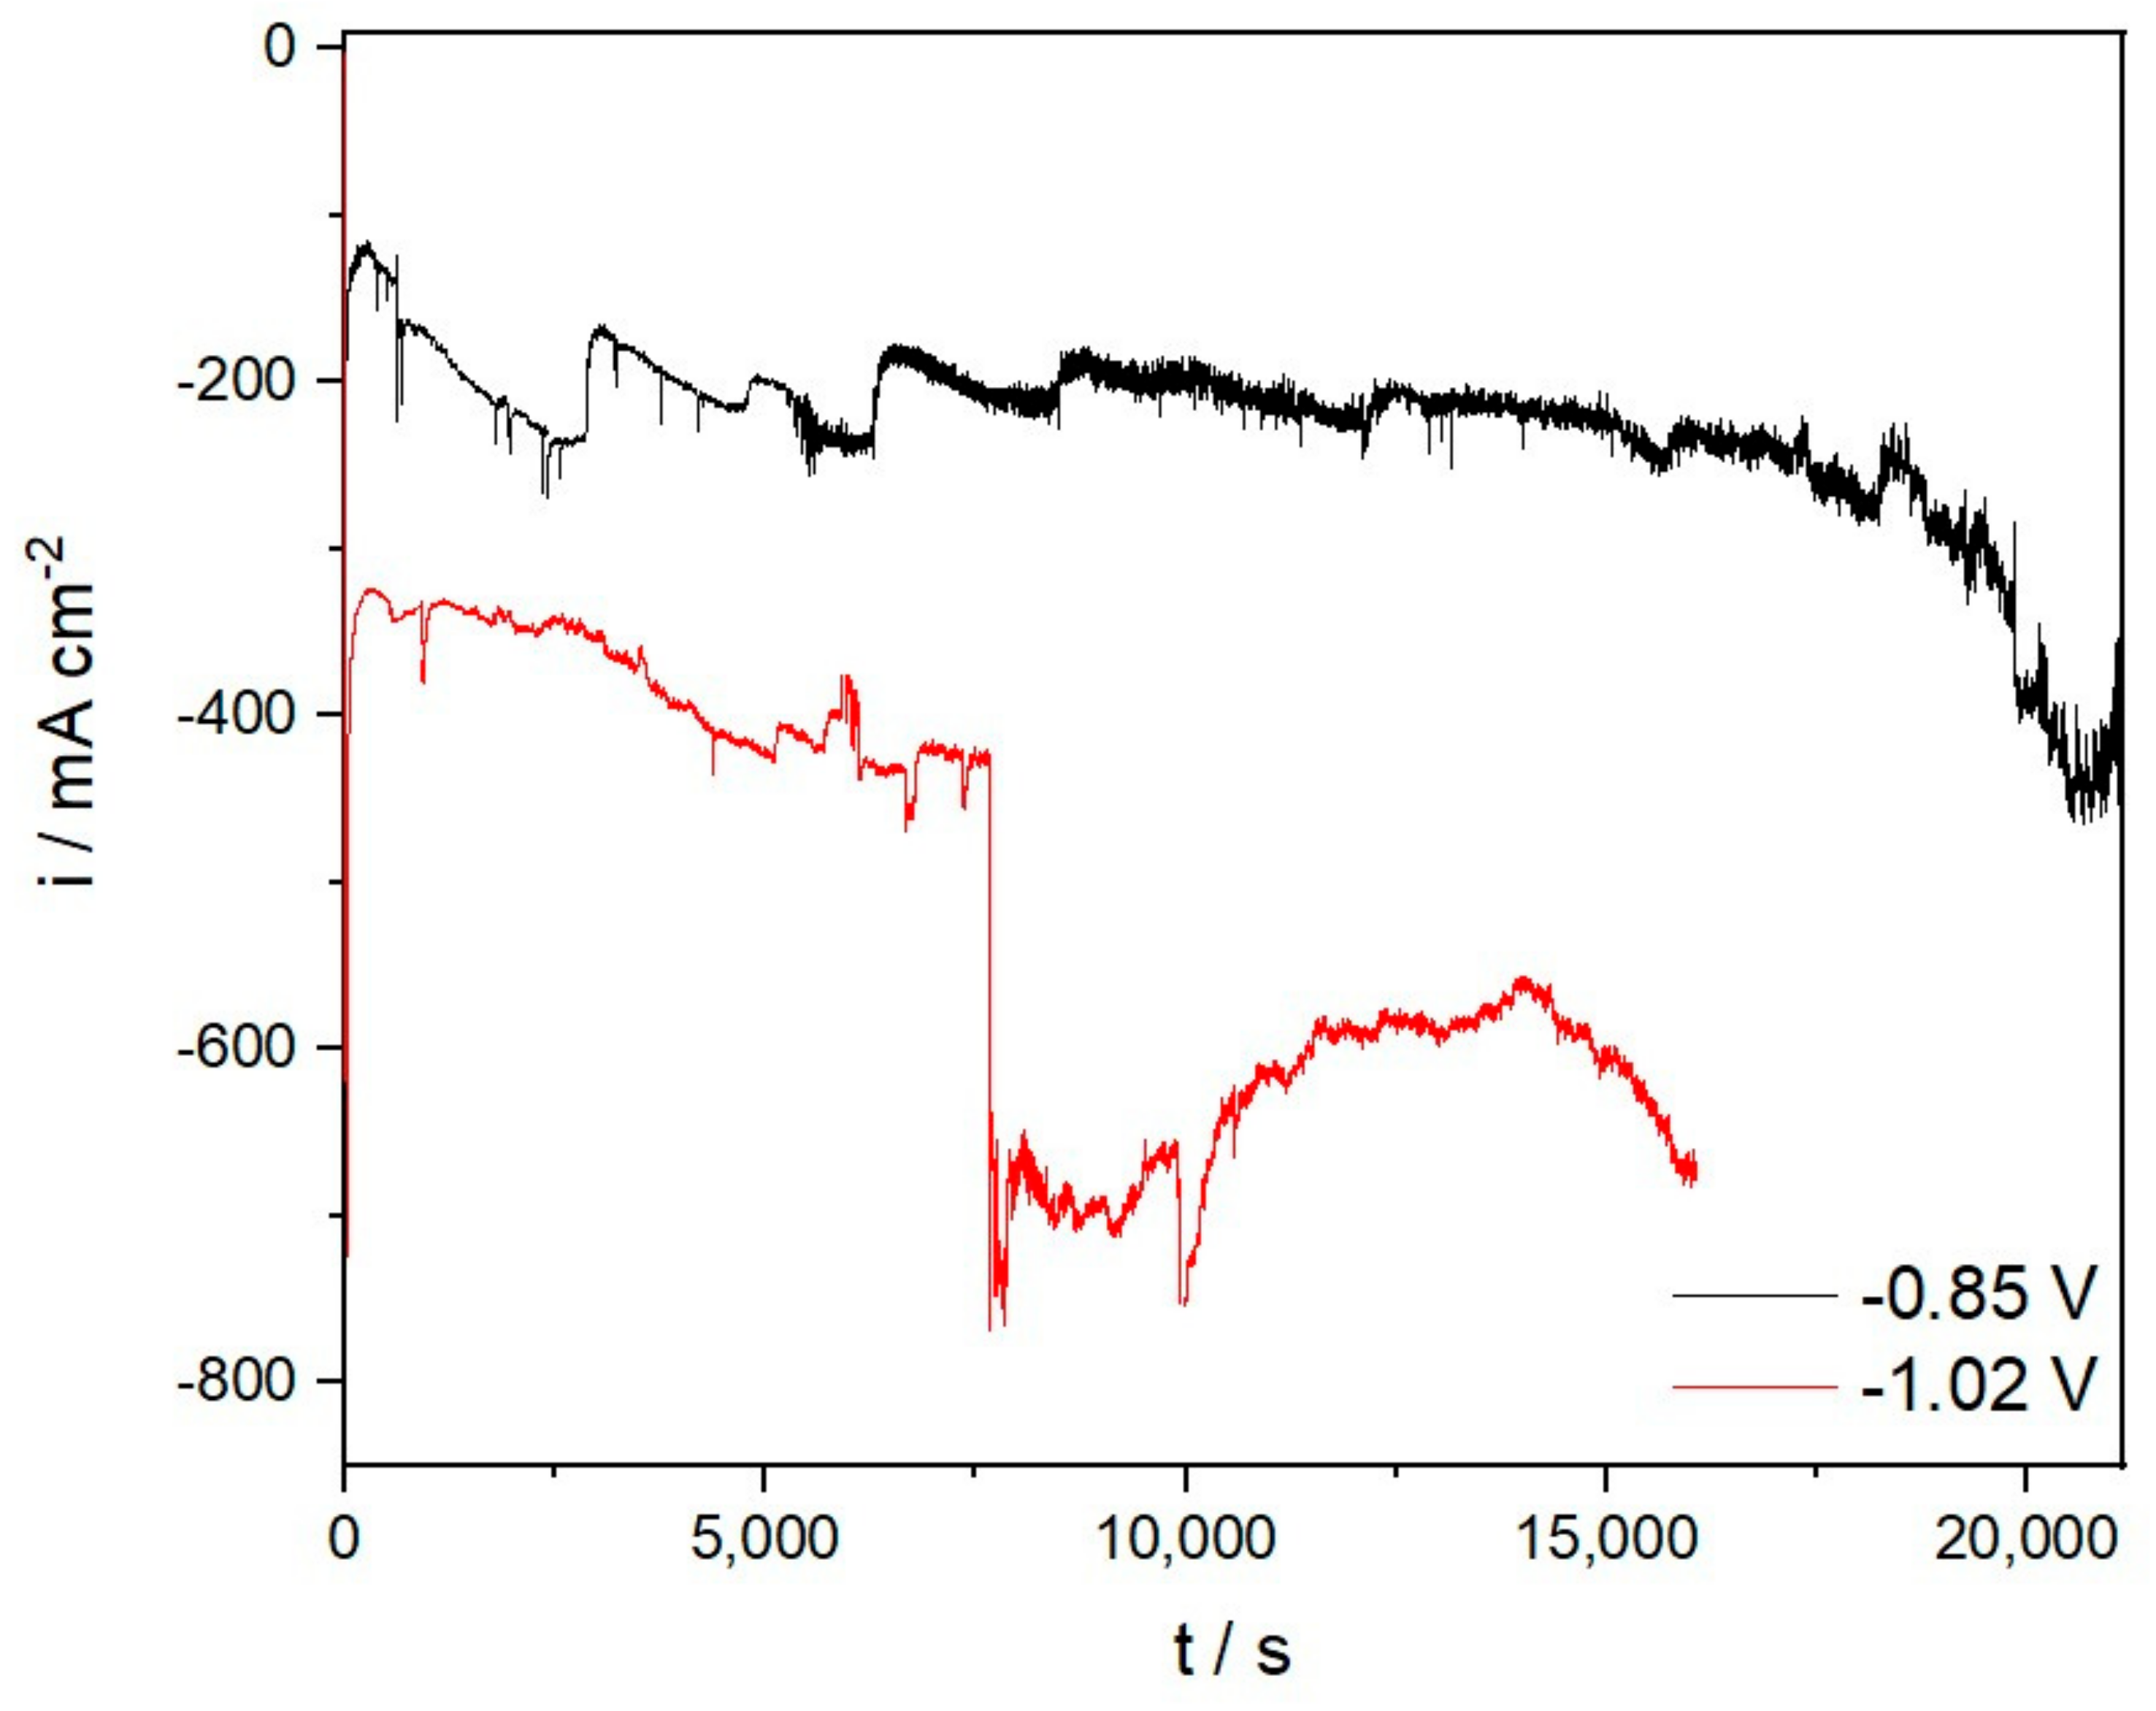
3.2. Potentiostatic Deposition (Chronoamperometry)

In this study, electrochemical potentiostatic deposition was also performed to evaluate possible metal products from the used systems. The deposition was carried out in all electrolyte samples mentioned in this study. In this novel work on the recovery of rare earth from the MRDO (Figure 3), the deposition was done from the molten fluoride-based electrolyte containing MRDO as a source of rare earth oxides. The deposition was carried out in a potentiostatic mode and at different holding times. The deposition in E-1 was terminated after 2 h because the deposition was inconsistent and reflected increasing and decreasing current density.
Such a large step increase or decrease in the current density is, however, not observed in E-2 and E-4, which means that in this electrolysis, the deposition could be more optimal with the variations in the MRDO content used.

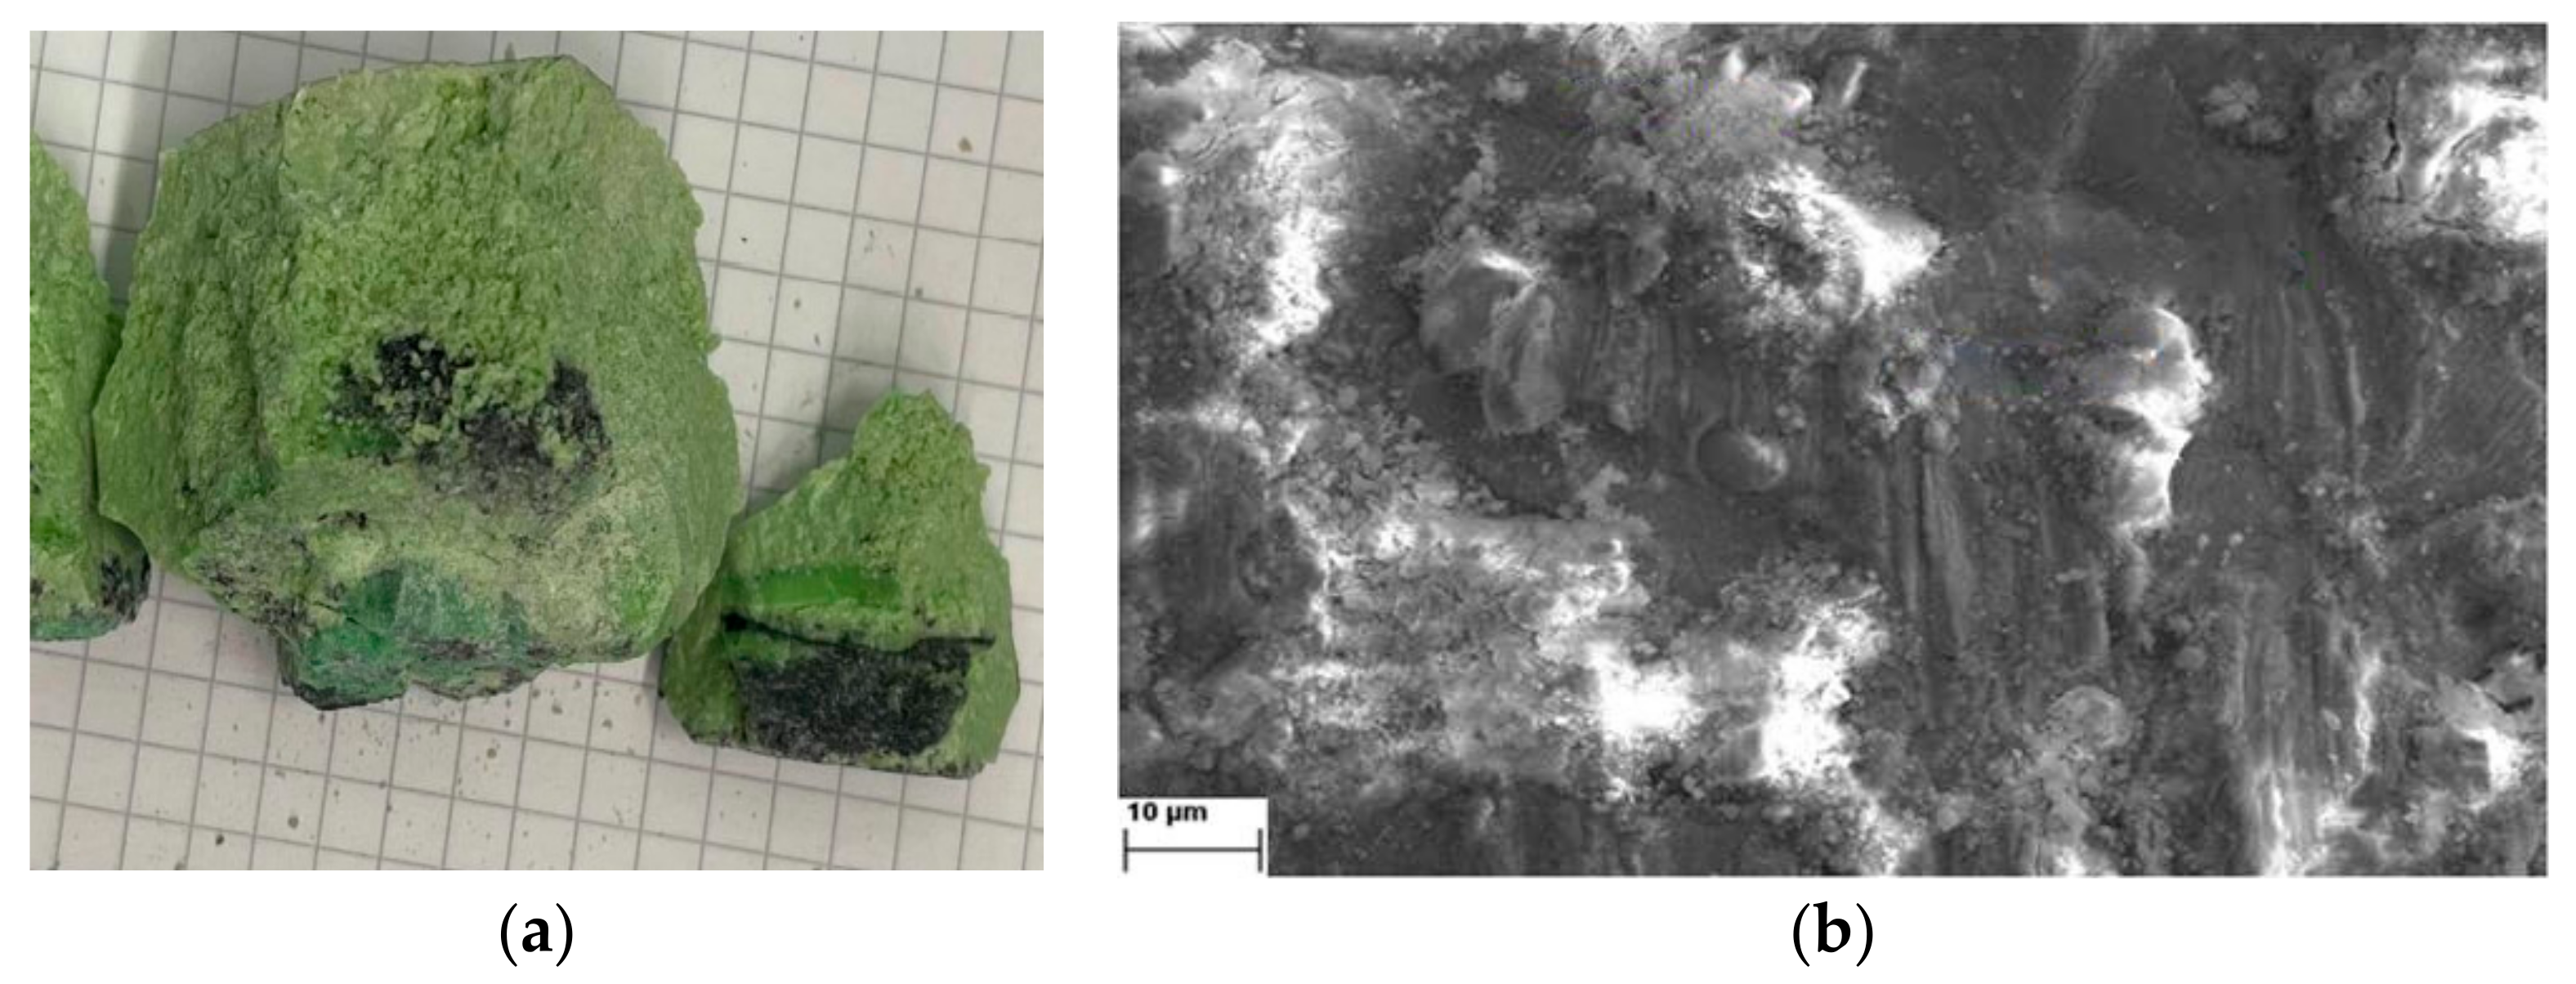
3.3. Post-Experimental Observations

Deposited metal could not be directly seen on the cathodes investigated immediately after the deposition due to the coating of a solidified electrolyte on it. After the deposition, the solidified electrolyte from the crucible was then cracked open in search of metal droplets, but to no avail. However, dark black patches can be seen at the bottom of the electrolyte E-4 block, close to the bottom of the crucible, Figure 4a. This was not observed in electrolyte E-2 when, after the deposition, the solidified electrolyte was cracked. A conjecture here is such that the input MRDO was not able to dissolve within the electrolyte and sediment at the bottom of the crucible. This type of behavior has been observed previously in similar investigations [24]. It was said that the insoluble rare earth oxides and rare earth oxyfluoride due to their higher specific gravity of the electrolyte are distributed in lower parts of the electrolytic cells [24]. Another possible reason for the appearance of those black patches at the bottom of the crucible could be the limitations of REO dissolution in fluoride-based melts. Further origin of those black patches may be the existence of thermal screens/shields preventing proper temperature distribution inside the reactor and in the measuring crucible. Too low temperatures (wrong thermal zone and gradients) could cause a decrease in the dissolution of REO obtained from recycled magnets. Literature reports that REO solubility in fluoride-based melts is limited, approximately to 3–5 wt.% [24]. Of course, the solubility increases at elevated temperatures, as was observed in the work of Sarfo et al. [25]. Based on our previous investigations, however, in similar fluoride (63.17 wt.% NdF3 + 20.96 wt.% PrF3 + 12.02 wt.% LiF) electrolyte and working temperature of 1050 °C, it seems that undissolved material from MRDO is settled at the bottom of the crucible. In this study, the input material, apart from rare earth oxides, contains a substantial amount of neodymium boron, iron neodymium, and dysprosium iron oxides, without indication of their solubility in this particular media. In addition, Figure 4b shows the SEM image of the electrode surface.
To further understand the deposition, the cathodes with the possible deposited metals were sent for ICP-OES and XRD analysis. For the ICP-OES analysis, the cathode tip that emerged in the electrolyte of E-4 was first etched in HNO3 solution and then in HCl solution, under an ultrasound tank. This is to remove all solidified leftover electrolytes on the tip of the electrode. Since the whole electrode was analyzed, a large portion of the sample contains the metal deposited on the electrode. The chemical result is shown in Table 5 below, excluding the electrode material.
The working electrode surface after prolonged deposition was studied using a powder X-ray diffractometer. The electrode surface was analyzed after the solidified electrolyte was mechanically removed from the working electrode. The XRD pattern recorded from the Mo cathode surface after 240 min potentiostatic deposition at −0.85 V vs. W and 1050 °C from molten NdF3 + PrF3 + LiF + 3wt.% MRDO electrolyte is presented in Figure 5. At the first site, the peaks indicating Mo cathode [JCPDS No. 01-088-2331] and the melt residue, NdF3 and PrF3 and DyF3, are easily noticed. It seems that dysprosium fluoride is embedded between neodymium-praseodymium fluoride. These observations are in agreement with those reported in the literature [24]. There are also relatively strong peaks at the 2θ values ≈ 44.5° and 64.8° which apart from Mo are related to Fe [JCPDS No. 01-085-1410].
In the diffractogram, the peaks indicating neodymium metal [JCPDS No. 03-065-3424] and praseodymium metal [JCPDS No. 01-089-2921] were observed. Because of very similar lattice parameters, the peaks with a slight variation of 2θ values are corresponding to both metals. However, it should be emphasized that the peaks recorded at 2θ values around 29.18°, 30.28°, 32.06°, 48.06°, 49.8°, 54.93°, 70.38°, 79.0° are characteristic only to Nd and Pr metal. No similar conclusion can be made concerning dysprosium metal because its characteristic 2θ values were not recorded within XRD data.
Besides neodymium and praseodymium metals, the peaks of NdF2 were identified as well [JCPDS No. 00-033-0934]. The explanation could be that NdF2 is a product of the disproportionation reaction: Nd(0) + 2Nd(III) → 3 Nd(II). Formation of NdF2 is unavoidable during Nd electrodeposition from the fluoride or halide electrolytes [19,20,27,29].
The characteristics of this XRD pattern in Figure 5 are very similar to those shown earlier in our previous investigation and confirm the applicability of the electrolyte composition used in the present work [19,20]. It is evident that the additional diffraction signals related to Fe are observed when MRDO is used in the based molten fluoride instead of pure REO. The results from this study, and our previous work, validated our choice of the electrolyte composition employed and the efficiency of the electrolysis process applied. Chemical and XRD analysis suggests that, under the applied conditions, Nd and Pr can be extracted in metal form from the electrolyte composed of NdFeB-based rare earth oxides present in the MRDO and corresponding rare earth salt. The results of this analysis confirmed the viability of using MRDO in the electrolysis as a part of fluoride molten salt electrolyte and established the route for recycling rare earth elements from used magnet scraps.

4. Conclusions

In this work, rare earth oxides from used NdFeB permanent magnet (MDRO) were fed into a molten salt electrolysis process, making different electrolyte compositions and RE oxide concentrations. The content of the MRDO in the fluoride-based electrolyte composed of 61.1 wt.% NdF3 + 26.3 wt.% PrF3 + 12.6 wt.% LiF has proven to be suitable for Nd and Pr metal production by molten salt electrolysis. The metals were electrodeposited by low overpotential potentiostatic deposition on Mo cathode at 1050 °C. In addition to Nd and Pr, iron was also deposited on the working electrode. The samples obtained after potentiostatic deposition clearly verified that rare earth metals were produced on the Mo working electrode from the fluoride-based electrolyte made of the MRDO produced from used magnet scraps. With this investigation, we have established the route for the successful recovery of rare earth metals from used permanent NdFeB magnets. Our next step will be to adjust parameters for MRDO production and deposition parameters in order to get the alloy to be directly fed into industrial NdFeB magnet production.

Author Contributions

Conceptualization, H.C.; methodology, H.C. and D.F.; software, H.C. and D.F.; validation, V.S.C. and L.P.; formal analysis, H.C. and S.R.S.; investigation, H.C. and L.P.; resources, S.R.S.; data curation, H.C. and L.P.; writing—original draft preparation, H.C. and L.P.; writing—review and editing, H.C., L.P. and V.S.C.; visualization, H.C.; supervision, B.F. and V.S.C.; project administration, H.C.; funding acquisition, S.R.S. and B.F. All authors have read and agreed to the published version of the manuscript.

Funding

This research was funded by Federal Ministry for Economic Affairs and Climate Action, grant number 287 EN and the APC was funded by Project “Sustainable recovery of rare earth elements (Nd, Pr, Dy) from spent magnets”. Part of this research was supported by the funds of the bilateral research project (ID: 337-00-19/2023-01/5), supported by the Ministry of Education, Science and Technological Development of the Republic of Serbia and German Academic Exchange Service (DAAD).

Data Availability Statement

Not applicable.

Conflicts of Interest

The authors declare no conflict of interest.

References

  1. Yang, Y.; Walton, A.; Sheridan, R.; Güth, K.; Gauß, R.; Gutfleisch, O.; Buchert, M.; Steenari, B.-M.; Van Gerven, T.; Jones, P.T.; et al. REE Recovery from End-of-Life NdFeB Permanent Magnet Scrap: A Critical Review. J. Sustain. Metall. 2017, 3, 122–149. [Google Scholar] [CrossRef]
  2. Yang, Y.; Lan, C.; Guo, L.; An, Z.; Zhao, Z.; Li, B. Recovery of rare-earth element from rare-earth permanent magnet waste by electro-refining in molten fluorides. Sep. Purif. Technol. 2020, 233, 116030. [Google Scholar] [CrossRef]
  3. Yasuda, K.; Kondo, K.; Kobayashi, S.; Nohira, T.; Hagiwara, R. Selective Formation of Rare-Earth–Nickel Alloys via Electrochemical Reactions in NaCl–KCl Molten Salt. J. Electrochem. Soc. 2016, 163, D140–D145. [Google Scholar] [CrossRef]
  4. Stopic, S.; Polat, B.; Chung, H.; Emil-Kaya, E.; Smiljanić, S.; Gürmen, S.; Friedrich, B. Recovery of Rare Earth Elements through Spent NdFeB Magnet Oxidation (First Part). Metals 2022, 12, 1464. [Google Scholar] [CrossRef]
  5. Vogel, H.; Flerus, B.; Stoffner, F.; Friedrich, B. Reducing Greenhouse Gas Emission from the Neodymium Oxide Electrolysis. Part I: Analysis of the Anodic Gas Formation. J. Sustain. Metall. 2017, 3, 99–107. [Google Scholar] [CrossRef]
  6. Stefanidaki, E.; Hasiotis, C.; Kontoyannis, C. Electrodeposition of neodymium from LiF-NdF3-Nd2O3 melts. Electrochim. Acta 2001, 46, 2665–2670. [Google Scholar] [CrossRef]
  7. Chung, H.; Stopic, S.; Emil-Kaya, E.; Gürmen, S.; Friedrich, B. Recovery of Rare Earth Elements from Spent NdFeB magnets: Separation of Iron through Reductive Smelting of the Oxidized Material (Second Part). Metals 2022, 12, 1615. [Google Scholar] [CrossRef]
  8. Gupta, C.K.; Krishnamurthy, N. Extractive metallurgy of rare earths. Int. Mater. Rev. 1992, 37, 197–248. [Google Scholar] [CrossRef]
  9. Fujita, Y.; McCall, S.K.; Ginosar, D. Recycling rare earths: Perspectives and recent advances. MRS Bull. 2022, 47, 283–288. [Google Scholar] [CrossRef]
  10. Binnemans, K.; Jones, P.T.; Blanpain, B.; Van Gerven, T.; Yang, Y.; Walton, A.; Buchert, M. Recycling of rare earths: A critical review. J. Clean. Prod. 2013, 51, 1–22. [Google Scholar] [CrossRef]
  11. Rademaker, J.H.; Kleijn, R.; Yang, Y. Recycling as a Strategy against Rare Earth Element Criticality: A Systemic Evaluation of the Potential Yield of NdFeB Magnet Recycling. Environ. Sci. Technol. 2013, 47, 10129–10136. [Google Scholar] [CrossRef]
  12. Rombach, E.; Friedrich, B. Recycling of Rare Metals. In Handbook of Recycling; Worrell, E., Reuter, M., Eds.; Elsevier: Waltham, MA, USA, 2014; pp. 125–150. [Google Scholar]
  13. Firdaus, M.; Rhamdhani, M.A.; Durandet, Y.; Rankin, W.J.; McGregor, K. Review of High-Temperature Recovery of Rare Earth (Nd/Dy) from Magnet Waste. J. Sustain. Metall. 2016, 2, 276–295. [Google Scholar] [CrossRef]
  14. Vogel, H.; Friedrich, B. Reducing Greenhouse Gas Emission from the Neodymium Oxide Electrolysis. Part II: Basics of a Process Control Avoiding PFC Emission. Int. J. Nonferrous Metall. 2017, 06, 27–46. [Google Scholar] [CrossRef]
  15. Milicevic, K.; Feldhaus, D.; Friedrich, B. Conditions and Mechanisms of Gas Emissions from Didymium Electrolysis and Its Process Control. In Light Metals 2018; Martin, O., Ed.; TMS 2018; The Minerals, Metals & Materials Series; Springer: Cham, Switzerland, 2018; pp. 1435–1441. ISBN 978-3-319-72283-2. [Google Scholar]
  16. Abbasalizadeh, A.; Malfliet, A.; Seetharaman, S.; Sietsma, J.; Yang, Y. Electrochemical Recovery of Rare Earth Elements from Magnets: Conversion of Rare Earth Based Metals into Rare Earth Fluorides in Molten Salts. Mater. Trans. 2017, 58, 400–405. [Google Scholar] [CrossRef]
  17. Cvetković, V.S.; Vukićević, N.M.; Feldhaus, D.; Barudžija, T.S.; Stevanović, J.; Friedrich, B.; Jovićević, J.N. Study of Nd Deposition onto W and Mo Cathodes from Molten Oxide-Fluoride Electrolyte. Int. J. Electrochem. Sci. 2020, 15, 7039–7052. [Google Scholar] [CrossRef]
  18. Cvetković, V.S.; Feldhaus, D.; Vukićević, N.M.; Barudžija, T.S.; Friedrich, B.; Jovićević, J.N. Investigation on the electrochemical behaviour and deposition mechanism of neodymium in NdF3–LiF–Nd2O3 melt on Mo electrode. Metals 2020, 10, 576. [Google Scholar] [CrossRef]
  19. Cvetković, V.S.; Feldhaus, D.; Vukićević, N.M.; Milicevic-Neumann, K.; Barudžija, T.S.; Friedrich, B.; Jovićević, J.N. Influence of Rare Earth Oxide Concentration on Electrochemical Co-Deposition of Nd and Pr from NdF3-PrF3-LiF Based Melts. Metals 2022, 12, 1204. [Google Scholar] [CrossRef]
  20. Cvetković, V.S.; Feldhaus, D.; Vukićević, N.M.; Barudžija, T.S.; Friedrich, B.; Jovićević, J.N. Electrochemical Study of Nd and Pr Co-Deposition onto Mo and W from Molten Oxyfluorides. Metals 2021, 11, 1494. [Google Scholar] [CrossRef]
  21. Cvetković, V.S.; Feldhaus, D.; Vukićević, N.; Nikolić, N.D.; Friedrich, B.; Jovićević, J.N. Electrodeposition of Nd and Pr onto W from fluoride based melts. In Proceedings of the Meeting Point of the Science and Practice in the Fields of Corrosion, Materials and Environmental Protection, XXII YuCorr International Conference, Tara, Serbia, 13–16 September 2021; Miroslav Pavlović, M., Pantović Pavlović, M.P., Eds.; Serbian Society of Corrosion and Materials Protection UISKOZAM: Belgrade, Serbia, 2021; pp. 157–160. [Google Scholar]
  22. Martinez, A.M.; Kjos, O.; Skybakmoen, E.; Solheim, A.; Haarberg, G.M. Extraction of Rare Earth Metals from Nd-based Scrap by Electrolysis from Molten Salts. ECS Trans. 2012, 50, 453–461. [Google Scholar] [CrossRef]
  23. Senanu, S.; Ratvik, A.; Gudbrandsen, H.; Martinez, A.; Støre, A.; Gebarowski, W. Dissolution and Online Monitoring of Nd and Pr Oxides in NdF3–PrF3–LiF Electrolytes. Metals 2021, 11, 326. [Google Scholar] [CrossRef]
  24. Zuo, Z.; Liu, Y.; Yang, X.; Liu, F. PrF3-NdF3-DyF3-LiF electrolyte system for preparation of Pr-Nd-Dy alloy by electrolysis. J. Rare Earths 2021, in press. [Google Scholar] [CrossRef]
  25. Sarfo, P.; Das, A.; Young, C. Extraction and optimization of neodymium from molten fluoride electrolysis. Sep. Purif. Technol. 2021, 256, 117770. [Google Scholar] [CrossRef]
  26. Ciumag, M.; Gibilaro, M.; Massot, L.; Laucournet, R.; Chamelot, P. Neodymium electrowinning into copper-neodymium alloys by mixed oxide reduction in molten fluoride media. J. Fluor. Chem. 2016, 184, 1–7. [Google Scholar] [CrossRef]
  27. Kwon, S.; Ryu, H.-Y.; Cho, S.-H.; Lee, J.-H. Effect of the electrolyte composition on the electrochemical behavior of Nd fluoride complex in a LiF-NdF3-Nd2O3 molten salt. J. Electroanal. Chem. 2020, 879, 114751. [Google Scholar] [CrossRef]
  28. Yin, T.; Xue, Y.; Yan, Y.; Ma, Z.; Ma, F.; Zhang, M.; Wang, G.; Qiu, M. Recovery and separation of rare earth elements by molten salt electrolysis. Int. J. Miner. Metall. Mater. 2021, 28, 899–914. [Google Scholar] [CrossRef]
  29. Shen, D.; Akolkar, R. Electrodeposition of Neodymium from NdCl3-Containing Eutectic LiCl–KCl Melts Investigated Using Voltammetry and Diffusion-Reaction Modeling. J. Electrochem. Soc. 2017, 164, H5292–H5298. [Google Scholar] [CrossRef]
Figure 1. Schematic illustration of the electrolysis setup with lid-cooled reactor and potentiostat.
Metals 13 00559 g001
Figure 2. Voltammograms obtained on Mo WE from (a) E-1 electrolyte with 4wt.% MRDO; (b) E-3 electrolyte with 4 wt.% MRDO; (c) E-2 with 3 wt.% MRDO; (d) E-4 electrolyte with 6 wt.% MRDO. Potential range: Initial potential (Ei) to final cathodic end potential (Ec) and back; scan rates are embedded in the pictures; T = 1050 °C.
Metals 13 00559 g002
Figure 3. Potentiostatic deposition on Mo cathode from E-2 (−0.85 V) and E-4 (−1.02 V).
Metals 13 00559 g003
Figure 4. Post-experimental observation of the (a) electrolyte and (b) SEM image of the working electrode from system E-4.
Metals 13 00559 g004
Figure 5. X-ray diffraction analysis of the deposit obtained after deposition at −0.85 V vs. W on a Mo cathode from molten NdF3 + PrF3 + LiF + 3 wt.% MRDO, E-2 electrolyte, for 240 min. at 1050 °C. (the solidified electrolyte was removed from the electrode).
Metals 13 00559 g005
Table 1. Elemental Analysis of the Rare Earth Oxide (MRDO).
Elements NdPrDyFeBAl
Weight (%)33.210.200.312.421.931.04
Table 2. The MRDO Composition from Rietveld-refined XRD Analysis.
PhaseWeight in %PhaseWeight in %
NdBO323.07FeB25.57
Fe3B11.03Dy2O34.25
Fe8.73Nd3Fe5O123.83
C8.4Nd2O22.74
B2O8.1NdO22.57
FeBO36.98Pr5O91.14
Nd2O36.18Pr2O31.08
DyFeO35.62PrNdO20.75
Table 3. Electrolyte Composition.
Trials CodeWeight Percentage (wt.%)MRDO Content
E-183.33—NdF3
16.67—LiF
4 wt.%
E-261.10—NdF3
26.30—PrF3
12.60—LiF
3 wt.%
E-361.10—NdF3
26.30—PrF3
12.60—LiF
4 wt.%
E-461.10—NdF3
26.30—PrF3
12.60—LiF
6 wt.%
Table 4. Cathodic Peaks Potentials Comparison with Literature.
Current Study Literature Reference [20]

C1 ≈ −0.32 V,
C2 ≈ −0.40 V,
C3 ≈ −0.52 V,
C4 ≈ −0.70 V
1 wt.% Pr6O11 + 1 wt.% Nd2O3 2 wt.% Pr6O11 + 2 wt.% Nd2O3
--
−0.400 V (Nd3+ → Nd2+)−0.400 V (Nd3+ → Nd2+)
−0.525 V (Nd2+ →Nd0)−0.550 V (Nd2+ →Nd0)
−0.650 V (Pr3+→ Pr0)−0.800 V (Pr3+→ Pr0)
Table 5. Elemental Analysis from Deposited Layer on E-4 Working Electrode.
Elements NdPrDyFeBAl
Weight (%)72.7723.9190.5960.5670.7751.372
Disclaimer/Publisher’s Note: The statements, opinions and data contained in all publications are solely those of the individual author(s) and contributor(s) and not of MDPI and/or the editor(s). MDPI and/or the editor(s) disclaim responsibility for any injury to people or property resulting from any ideas, methods, instructions or products referred to in the content.

