Abstract
Based on the solidification heat transfer model and the CAFE model, the solidification behavior and structure of 2311 die steel, with a cross-section dimension of 415 × 2270 mm at different casting speeds, specific water flow and superheat, is numerically simulated. Nail-shooting and acid-etching experiments are carried out on the slab to verify the model’s macroscopic size. With the increase in casting speed, the slab’s central equiaxed grain ratio (ECR) decreases and the average grain size increases. The increase in superheat promotes the growth of columnar grains and inhibits the growth of central equiaxed grains. When the superheat increases from 23 to 38 K, the ECR decreases from 43.2 to 29.64%, and the average radius of grains increases from 0.89 to 1.01 mm. With the increase in specific water flow, the ECR decreases, and the average grain radius is the smallest when the specific water content is 0.32 L kg−1. Finally, the slab quality is improved by process optimization, and the central segregation index of carbon decreases from mean value of 1.15 to 1.05.
1. Introduction
As a widely used plastic die steel in the world, 2311 die steel has good anti-rust ability. With improvement of the internal quality control ability of the continuous casting slab, the continuous casting process has become the main method to prepare 2311 die steel, but the center segregation of 2311 in 420 mm extra-thick is very serious [1]. This is mainly because the extra-thick slab has large thickness, low casting speed and long solidification time, which makes it easy to produce central segregation in the production process [2,3]. Soft reduction and electromagnetic stirring are main means to control the macrosegregation of the casting slab [4,5], which can compensate for shrinkage at the end of solidification and increase the ECR [6]. Soft reduction technology can obviously improve the center quality of the slab and effectively improve the quality of the subsequent rolled products [7,8,9].
The soft reduction technique was developed in the 1990s and is considered the best way to minimize centerline segregation by reducing the shrinkage cavity to compensate for negative pressure [10]. Rogberg et al. studied the effect of reduction amount on centerline segregation in high carbon and stainless steel [11]. Zhu et al. studied the influence of reduction position and reduction on center segregation by numerical simulation [10]. VAI believes that when the fs < 30 %, the central porosity and segregation almost does not occur. At this time, the shrinkage roll gap makes it easy to increase the incidence of internal cracks, so it is recommended that the best solid phase rate (fs) is 0.30–0.95 [12]. Chen et al. believed that the central segregation was significantly improved by the soft reduction when the fs is between 0.55 and 0.75 [13]. Moreover, with the increase in slab thickness, it is difficult to find the best optimization parameters. Slabs with a thickness of 210,240 and 300 mm are the most studied. However, the influence of reduction parameters on macrosegregation were rarely studied for 420 mm thickness. Only a few people have studied the optimum parameters for 400 mm thickness [14]. In actual production, the continuous casting process parameters will affect the solidification end position, thus affecting the reduction position. Therefore, it is particularly important to determine the soft reduction parameters by studying the influence of the process parameters on the solidification structure and the position of the solidification end point of the 420 mm extra-thick slab. To determine the solidification end point, it is necessary to measure the solidified shell thickness of the continuous casting slab. Because a nail-shooting test is convenient and accurate [15], the nail-shooting method is commonly used to determine the solidified shell thickness of continuous casting slabs.
In addition, macrosegregation is also closely related to the solidification characteristic structure [16,17]. This is mainly because macrosegregation is closely related to the liquid phase flow between dendrites [18,19,20], and grain size and the ECR will affect the liquid phase flow between dendrites [21,22,23]. Therefore, it is valuable to study the grain size and ECR of the continuous casting slab. Although research has provided some useful information for practical production, there are few studies on the simulation of the solidification structure of ultra-thick slabs.
In this paper, the solidification heat transfer model of a 2311 die steel slab with an area of 2270 × 415 mm2 is established by ProCAST software, and the accuracy of the model is verified by a nail-shooting experiment and surface temperature measurement. Then, the solidification structure of the slab is simulated and verified by an acid etching test. The ECR and the average grain size under the different casting speeds, superheats and specific water are calculated and analyzed. On this basis, the soft reduction position and reduction amount are optimized. Finally, an industrial test is carried out to verify the optimized process parameters, which effectively improves the central segregation of the slab.
2. Model Descriptions
2.1. Solidification Heat Transfer Model
To simplify the calculation process of the numerical simulation, the following assumptions are made [24]:
- Heat transfer along the casting direction is ignored.
- The heat exchange of the slab in the secondary cooling zone is described by the heat transfer coefficient.
- The influence of mold vibration and protective slag film on heat transfer is ignored.
- The effect of fluid flow on heat transfer is described by adjusting the thermal conductivity.
Equations (1) and (2) are the two-dimensional heat transfer-governing equations for slab continuous casting:
where T is the temperature, t is the time, ρ is the liquid density, CP is the heat capacity, λ is the effective thermal conductivity, L is the latent heat of fusion and fs is the solid fraction. The main chemical compositions of 2311 die steel are listed in Table 1. The composition of steel was inputted into the material database to calculate the density, enthalpy, solid fraction and other thermal physical parameters.

Table 1.
Chemical composition (mass%) of 2311 die steel.
2.2. Nucleation Model
In 1989, Rappaz [25] proposed a continuous nucleation model based on Gaussian distribution, as shown in Equations (3) and (4):
where ΔT is the undercooling, K; nmax is the maximum nucleation density, m−3 for volume and m−2 for surface; ΔTσ is the standard deviation undercooling, K; and ΔTn is the mean undercooling, K. The effect of melt movement on the grain morphology cannot be considered in ProCAST software. The effect of melt movement on the grain morphology can only be expressed by adjusting nucleation parameters. The effect of fluid flow on the equiaxed grain rate is described by increasing the number of nuclei, but the effect of melt movement on the grain morphology cannot be described directly. The nucleation parameters and growth parameters used in this paper are shown in Table 2.
Table 2.
Nucleation parameters of CAFE model.
2.3. Dendrite Tip Growth Kinetics Model
In casting, the growth kinetics of equiaxed crystals and columnar crystals can be calculated by the KGT model [26,27]. Based on the marginal stability criterion, Equation (5) is obtained:
where V is the dendritic tip growth rate, m∙s−1; Γ is the Gibbs-Thomson coefficient, P is the solutal Peclet number, D is the solute diffusion coefficient, m is the liquidus slope, C0 is the nominal concentration, k0 is the partition coefficient, G is the temperature gradient, and set as 0, without considering the thermal effect, Iv(P) is the Ivantsov function Iv(P) = Pexp(P)E1(P) and E1 is the exponential integral.
In the actual calculation process, to accelerate the calculation process, the KGT model is fitted to obtain the following equation (Equations (6)–(8)) [28]:
where α2 and α3 are the fitting polynomial coefficients of dendrite tip growth kinetics parameters, the units are m·s−1·K−2 and m·s−1·K−3 and ρ is the density of steel.
In this paper, the 2311 die steel is divided into seven binary systems of Fe-C, Fe-Si, Fe-Mn, Fe-P, Fe-S, Fe-Al and Fe-Cr. The composition c, distribution coefficient k, liquidus slope m, solute diffusion coefficient D [29] and Gibbs-Thompson coefficient Γ [30] of Fe-X alloys are shown in Table 3.
Table 3.
Liquidus slope, solute partition coefficient, diffusion coefficient and Gibbs-Thompson coefficient of binary Fe-X steels.
3. Solution Conditions and Model Validation
3.1. Geometric Model
The solidification process of the slab is simulated by the thin−slicing method. The ProCAST software is used for grid division. The geometric model and mesh are shown in Figure 1.
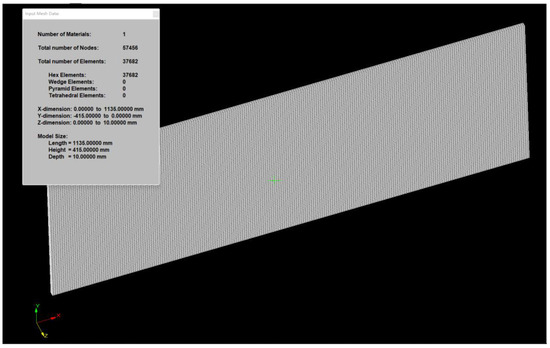
Figure 1.
Information about geometric model.
3.2. Initial and Boundary Conditions
3.2.1. Initial Condition
The initial condition is given by Equation (9):
where T0 is the initial temperature, K; TC is the casting temperature, K.
3.2.2. Boundary Condition
In the mold, the heat flux is calculated by Equations (10) and (11) [31]:
where qm is the heat flux of the mold, W·m−2; β is a coefficient depending on the mold cooling condition, W·m−2·s−1/2; qc is the average heat flux in the mold, W·m−2; lm is the effective length of the mold, m; t is the time in the mold, s and v is the casting speed, m·s−1.
In the foot roller section and the secondary cooling zone, the heat transfer coefficient is calculated by Equations (12) and (13):
where h1 and h2 are the heat transfer coefficient of the foot roller section and the secondary cooling zone, W/(m2·K); W is the water flow rate, L/(m2·s); Tw is the temperature of the environment, K and α and γ are the correction factors.
h1 = α·[581W0.541(1 − 0.0075TW)
h2 = γ·(130 + 350W)
In the air-cooling zone, the heat flux is calculated by Equations (14) and (15) [32]:
where ε is the radiation coefficient and σ is Stefan-Boltzmann constant, 5.67 × 10⁻⁸ W/(m2·K4).
qa = εσ(T4 − Ta4)
ε = 0.85/(1 + exp(42.68 − 0.02682Ts)0.0115
The cooling parameters are shown in Table 4.
Table 4.
Parameters at different sections of secondary cooling zone.
3.3. Model Validation
3.3.1. Validation of Heat Transfer
The surface temperature measured at half of the narrow surface of the slab is compared with the simulation results, as shown in Figure 2. The error between the simulated temperature and the measured temperature is within 5%. The absolute error is not more than 40°C, which indicates that the processing of model boundary conditions is close to the actual production process. In this paper, the accuracy of the solidification heat transfer model is further verified by the nail-shooting experiment. The liquid zone thickness at the end of segment 7 is 84 mm and the actual shell thickness is 331 mm, as shown in Figure 3a. The liquid zone thickness at the end of segment 8 is 56 mm and the actual shell thickness is 359 mm, as shown in Figure 3b, and the simulated shell thickness is 351.2 mm, with an error of 2.2%. The liquid core thickness at the end of segment 9 is 17 mm and the actual shell thickness is 394 mm, as shown in Figure 3c. The solidification end position is 27.54 m from the meniscus. The error does not exceed 2.2%, which accurately reflects the solidification characteristics of the slab continuous casting process.
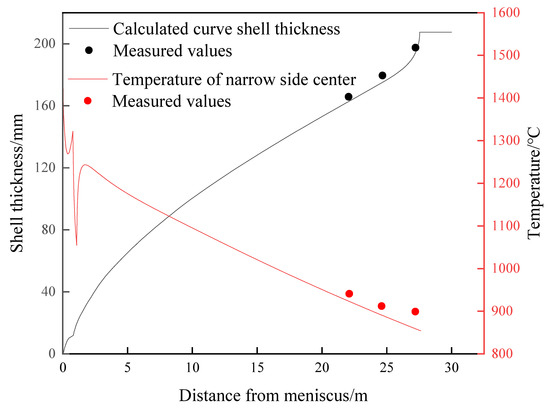
Figure 2.
Comparison of the calculated temperature of the slab narrow side center.
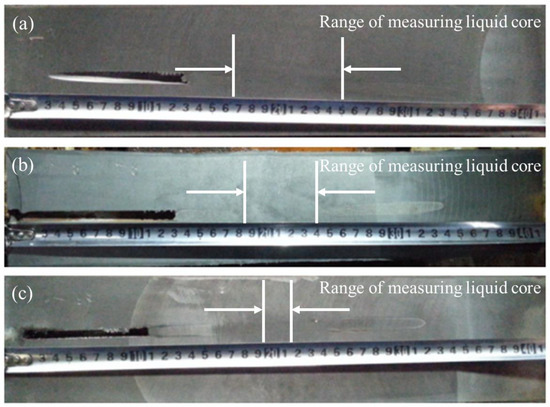
Figure 3.
Photographs of sulfur printing samples for nail-shooting experiments: (a) the end of segment 7; (b) the end of segment 8; (c) the end of segment 9. The white arrows represent the range of liquid core.
3.3.2. Validation of Solidification Structure
The calculated ECR is 29.64%, as shown in Figure 4a. The macrograph of the solidification structure after pickling is shown in Figure 4b, and the ECR in the inner arc is about 30.36%. Different colors in Figure 4 represent grain orientation. The experimental and simulated ECR are almost identical, which indicates the model accuracy is high enough to predicate the solidification structure of the slab.
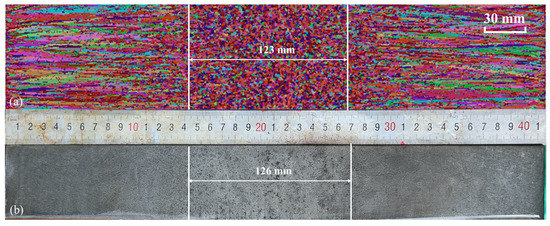
Figure 4.
Comparison of numerical and experimental structure of 2311 die steel: (a) simulated solidification structure (b) experimental solidification structure.
4. Results and Discussion
4.1. Effect of Superheat on Solidification Structure
Under the casting speed of 0.5 m·min−1 and the specific water flow of 0.32 L·kg−1, the solidification structures with various superheats of 23, 28, 33 and 38 K are simulated.
When the superheat is 23 K, the ECR is 43.2%, as shown in Figure 5a. The ECR is 37.84% when the superheat is 28 K, as shown in Figure 5b. As can be seen from Figure 5c, the ECR is 32.43%. Figure 5d shows the solidification structure when the superheat is 38 K and the ECR is 29.64%. With the increase in superheat, the ECR decreases and the columnar crystals zone expands. At the same time, the width of the columnar crystals increases significantly. This is because with the increase in superheat, the number of free grains decreases, which leads to the decrease in the number of nucleation sites at the solid–liquid interface and the decrease in undercooling degree. This promotes the growth of dendrites and inhibits the development of equiaxed crystals. In addition, the excessive growth of dendrites leads to the widening of the columnar crystal zone. This may lead to the formation of a bridge, making shrinkage more serious. Too low superheat can cause nozzle clogging. Therefore, it is suggested that the appropriate superheat should be adopted to obtain fine grains and high ECR.
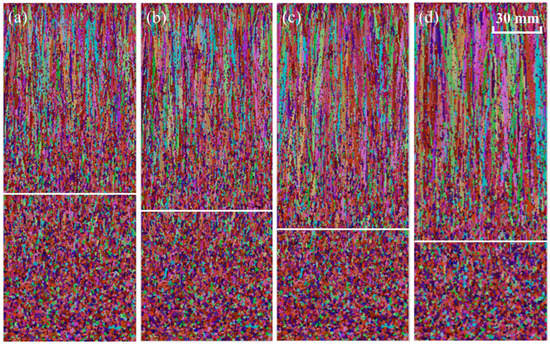
Figure 5.
Simulated solidification structures under different superheats: (a) 23 K; (b) 28 K; (c) 33 K; (d) 38 K. (Different colors in figure represent grain orientation).
Table 5 lists the statistical results of grain parameters and distribution under different superheats. When the superheat is 23 K, the total number of grains is 20,509, and when the superheat rises to 38 K, the total number of grains is 17,025. When the superheat increases from 23 to 38 K, the average surface area of the grains increases from 0.8260 × 10⁻⁶ to 0.9950 × 10⁻⁶ m2, and the average radius of the grains increases from 0.89051 to 1.01031 mm. With the increase in superheat, the number of grains per meter and per square meter decreases.
Table 5.
Statistical results of grain parameters and distribution in simulated area under different superheats.
4.2. Effect of Casting Speed on Solidification Structure
With a superheat of 38 K and a specific water flow of 0.32 L·kg−1, the solidification structures with casting speeds of 0.45, 0.50, 0.55 and 0.60 m·min−1 are simulated. When the casting speed is 0.45, 0.50, 0.55 and 0.60 m min−1, the ECR is 31.08 (Figure 6a), 29.64 (Figure 6b), 28.67 (Figure 6c) and 27.71% (Figure 6d), respectively.
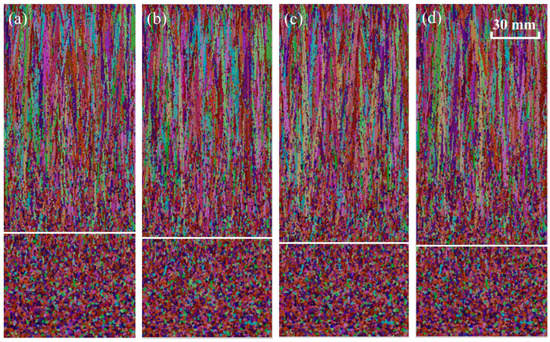
Figure 6.
Simulated solidification structures under different casting speeds: (a) 0.45 m·min−1; (b) 0.45 m·min−1; (c) 0.50 m·min−1; (d) 0.50 m·min−1. (Different colors in figure represent grain orientation).
Under the same specific water flow, the ECR decreases with the increase in casting speed. In the range of 0−15 mm from the slab surface, the cooling rate decreases with the increase in casting speed, as shown in Figure 7a. The main reason is that with the increase in casting speed, the residence time of molten steel in the mold decreases, which makes the export of superheat delayed. This promotes the growth of columnar crystals and reduces the ECR. In the range of 15−50 mm from the slab surface, the cooling rate increases with the increase in casting speed, as shown in Figure 7b. This is mainly due to being under the same specific water; the greater the total water, the higher the cooling intensity, resulting in a bigger temperature gradient at the solid–liquid interface, thereby promoting the growth of columnar crystals. The cooling rate is basically the same in the range of 50−220 mm from the slab surface, as shown in Figure 7c,d. The cooling water volume is small, so that there is no significant difference in cooling intensity. As the casting speed increases, the average grain radius increases, as shown in Figure 8. The reason for this is the short residence time of the slab in the mold and the secondary cooling zone, which is unfavorable for eliminating the superheat of molten steel.
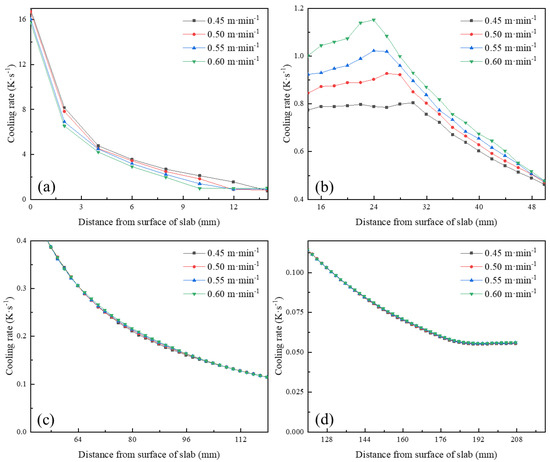
Figure 7.
Cooling rate at different positions from surface of slab under different casting speeds: (a) 0−15 mm; (b) 15−50 mm; (c) 50−120 mm; (d) 120−220 mm.
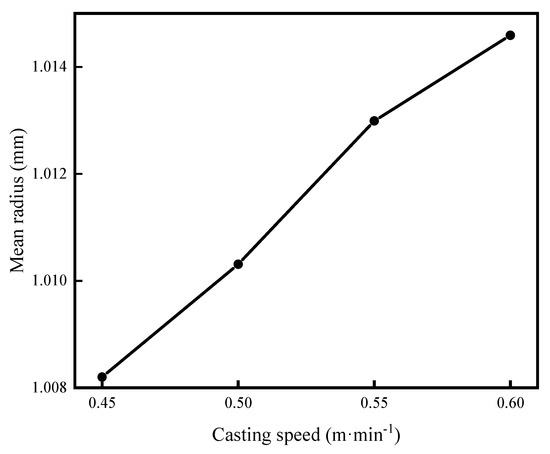
Figure 8.
The average grain size of the slab with different casting speeds.
4.3. Effect of Specific Water Flow on Solidification Structure
Four kinds of specific water flow of 0.28, 0.32, 0.36 and 0.40 L·kg−1 were selected to study the effect of specific water flow on the surface temperature of slab. With the increase in specific water flow, the liquid core length of the slab decreases. For every 0.04 L·kg−1 increase in specific water flow, the position which superheat is eliminated is decreased by about 0.25 m, as shown in Figure 9a. Before the slab completely solidified, the specific water flow has a great influence on the slab surface temperature, especially in the secondary cooling zone, as shown in Figure 9b. For every 0.04 L·kg−1 increase in specific water flow, the surface temperature of the slab decreases by about 20 °C. As the specific water flow increases from 0.28 to 0.40 L·kg−1, the superheat−eliminating position and the solidification position slightly reduces.
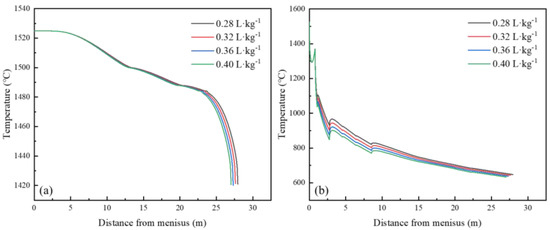
Figure 9.
Surface and center temperature curves of casting slab under different specific water flow: (a) center temperature; (b) surface temperature.
With a superheat of 38 K and the casting speed of 0.5 m·min−1, the solidification structures with the specific water flow of 0.28, 0.32, 0.36, and 0.40 L·kg−1 are simulated. When the specific water flow is 0.28 L·kg−1, the ECR is 31.08%, as shown in Figure 10a. The ECR is 29.64% when the specific water flow is 0.32 L·kg−1, as shown in Figure 10b. It can be seen from the Figure 10c, the ECR is 28.67%. Figure 10d shows the solidification structure when the specific water flow is 0.40 L·kg−1, the ECR is 27.71%. It indicates that as the specific water flow increases, the ECR decreases. The main reason is that with the increase in specific water, the heat transfer coefficient in the secondary cooling zone also increases, which makes the cooling intensity increase. The increase in temperature gradient promotes the growth of columnar crystals and enlarges the columnar zone.
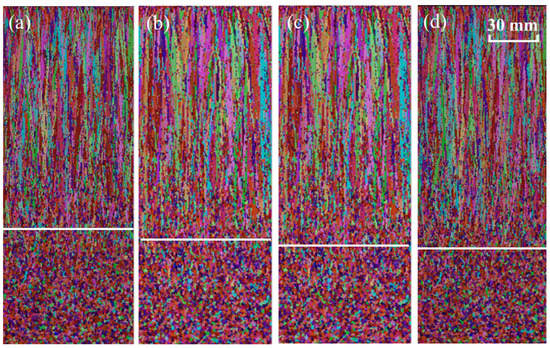
Figure 10.
Simulated solidification structures under different specific water flow: (a) 0.28 L·kg−1; (b) 0.32 L·kg−1; (c) 0.36 L·kg−1; (d) 0.40 L·kg−1. (Different colors in figure represent grain orientation).
As the specific water flow increases from 0.28 to 0.40 L·kg−1, the average grain radius decreases first and then increases, as shown in Figure 11. When the specific water flow is 0.32 L·kg−1, the average grain radius reaches the minimum. With the increase in specific water flow, the cooling intensity increases, which makes the grain refined. In addition, the slab surface temperature is low (Figure 9b) and the temperature gradient in the thickness direction is large, which promotes the growth of columnar crystals. When the specific water is greater than 0.32 L·kg−1, the cooling intensity is further enhanced. This promotes the growth of columnar crystals; the columnar crystals become wider, and the refined equiaxed crystals are not enough to offset the increase in grain size caused by the expansion of the columnar crystal region. Therefore, the grain size increases.
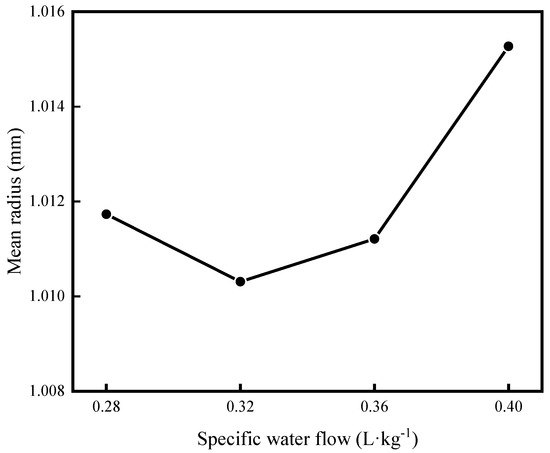
Figure 11.
The average grain size of the slab with different specific water flow.
4.4. Optimization of CC Process Parameter
When the specific water flow is 0.32 L/kg, the average grain size reaches the minimum value. Therefore, the specific water flow does not need to be adjusted. According to the simulation results, the increase in casting speed will reduce the ECR and increase the average grain size. Therefore, the adjustment of the process parameters has little effect on the improvement of central segregation.
The center porosity and centerline segregation of the 2311 die slabs are difficult to control. The current control methods mainly include secondary cooling system control, soft/heavy reduction, electromagnetic stirring, etc. The soft reduction is an important method to reduce the center porosity and centerline segregation of the slab. Therefore, the soft reduction process of the slab is optimized. Taking the BT/50 and S355 slab of Xinyu Steel as the research object, the slab center quality was improved by soft reduction when the fs is between 0.65 and 0.75 [33]. In this paper, when the solid fraction is between 0.7 and 0.8, soft reduction is used to improve the central segregation.
Through the previous calculation and analysis, the slab has completely solidified when it is 27.54 m away from the meniscus. The central solid fraction at the end of segment 7 is less than 0.3. For every 0.04 L·kg−1 increase in specific water flow, the position which superheat is eliminated is decreased by about 0.25 m, as shown in Figure 12a. It can be seen from the Figure 12b that the central solid fraction at the end of segment 8 is greater than 0.3. Figure 12c shows the central solid fraction at the end of segment 9. From the position of soft reduction, the solidification end point calculated by the dynamic soft reduction system is relatively forward, and there is no effective soft reduction at the end of solidification, which has little effect on the improvement of central segregation and porosity of the slab. Therefore, it is necessary to move the position of soft reduction backwards (relative to the casting direction) accordingly. The optimized soft reduction parameters are shown in Table 6. The slab before optimization is shown in Figure 13a, showing that center segregation is very serious. Figure 13b shows the slab after optimization.
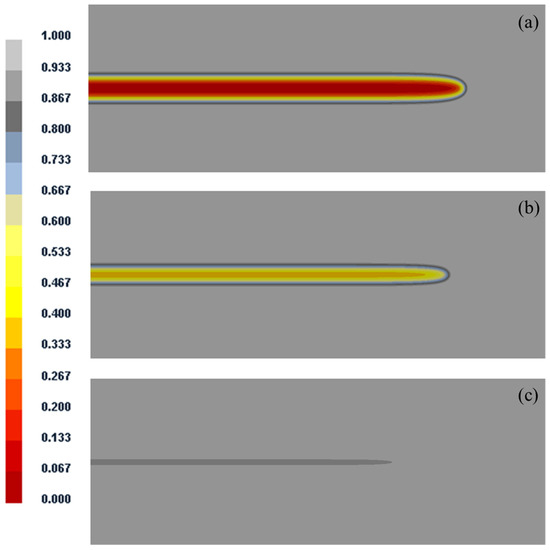
Figure 12.
The solid fraction of slab center: (a) the end of segment 7; (b) the end of segment 8; (c) the end of segment 9.
Table 6.
The soft reduction parameters after optimization.
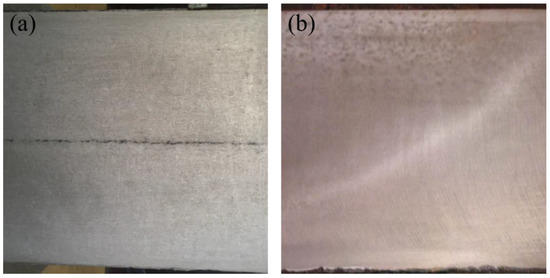
Figure 13.
The slab before and after optimization: (a) before optimization; (b) after optimization.
To quantitatively describe the macrosegregation, the carbon segregation index of the slabs is quantitatively measured by a chemical analysis of the drillings, as shown in Figure 14. A carbon−sulfur analyzer is used to obtain the carbon content at different locations in the slab. The carbon segregation index before and after optimization is shown in Figure 15. The carbon segregation at the center of the slab is reduced from 1.045 to 0.98. It proves that the centerline segregation is weakened.
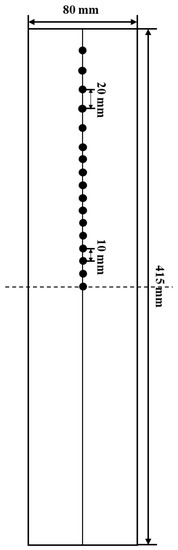
Figure 14.
Carbon segregation sampling schematic.
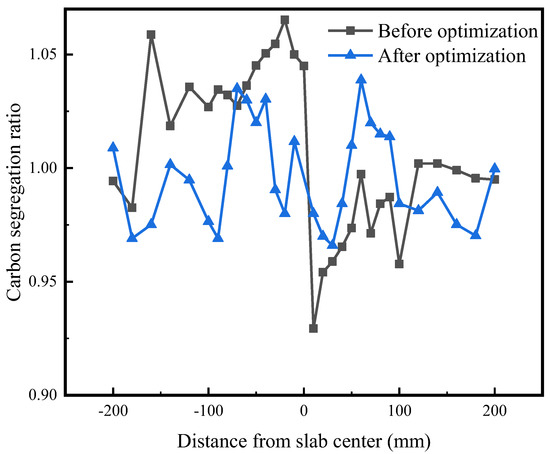
Figure 15.
Comparison of carbon segregation index before and after optimization.
5. Conclusions
- The simulation results are verified by a nail-shooting experiment, acid etching and a surface temperature measurement. The error of the shell thickness and surface temperature is controlled within 5 %.
- The ECR decreases with the increase in the casting speed and the specific water flow. Superheat has a great influence on the ECR, which is mainly because the nucleation amount in the molten steel decreases with the increase in superheat.
- The average grain radius increases with the increase in the casting speed and superheat. As the specific water flow increases from 0.28 L·kg−1 to 0.40 L·kg−1, the average grain radius decreases first and then increases. When the specific water flow is 0.32 L·kg−1, the average grain radius reaches the minimum.
- With the optimized the position of soft reduction, the central carbon segregation is weakened.
Author Contributions
L.X.: original draft preparation, validation; P.Z.: writing—review and editing, Conceptualization; Y.S.: data curation; P.S.: formal analysis; Z.Z.: project administration; M.W.: writing—review and editing, methodology. All authors have read and agreed to the published version of the manuscript.
Funding
This research received no external funding.
Institutional Review Board Statement
Not applicable.
Informed Consent Statement
Not applicable.
Conflicts of Interest
The authors declare no conflict of interest.
References
- Zhen, X.; Zhu, Z.; Jiang, H.; Li, J.; Wang, Y.; Bai, Z.; Zhao, J.; Sun, B. Effect of the positon on the central segregation of 400 mm ultra-thick slabs. Steelmaking 2012, 28, 20–23. [Google Scholar]
- Miao, J.; Ruan, X.; Han, Z.; Kong, K.; Liu, Q. Control of susceptible quality defects in heavy plate continuous casting process. Contin. Cast. 2015, 40, 25–28. [Google Scholar]
- Ma, R.; Zhen, X. Especially thick slab continuous casting quality defects and the control. Contin. Cast. 2011, 1, 67–75. [Google Scholar] [CrossRef]
- Li, Y.J.; Li, L.; Zhang, J.Q. Study and application of a simplified soft reduction amount model for improved internal quality of continuous casting bloom. Steel Res. Int. 2017, 88, 170–176. [Google Scholar] [CrossRef]
- Jiang, D.B.; Zhu, M.Y. The fluid flow and solidification phenomenon in billet continuous casting process with mold and final electromagnetic stirrings. In Advances in the Science and Engineering of Casting Solidification; Nastac, L., Fredriksson, H., Lacaze, J., Hong, C.-P., Catalina, A.V., Buhrig-Polaczek, A., Monroe, C., Sabau, A.S., Ruxanda, R.E.L., Luo, A., et al., Eds.; Springer: Berlin/Heidelberg, Germany, 2015. [Google Scholar]
- Li, J.; Wu, H.; Liu, Y.; Sun, Y. Solidification structure simulation and casting process optimization of GCr15 bloom alloy. China Foundry. 2022, 19, 63–74. [Google Scholar] [CrossRef]
- Cenanovic, M.B.; Maureira, H.A.; Ng, M.K.C. Electromagnetic technology for continuous casting in the steel industry. Direct Roll. Hot Charg. Strand Cast Billets 1989, 139–148. [Google Scholar] [CrossRef]
- Guo, L.L.; Tian, Y.; Yao, M.; Shen, H.F. Temperature distribution and dynamic control of secondary cooling in slab continuous casting. Int. J. Miner. Metall. Mater. 2009, 16, 626–631. [Google Scholar]
- Yong, C.H.E.N.; Xiao, M.F.; Wu, G.R. Dynamic Soft Reduction Technology for Bloom Casting. J. Iron Steel Res. Int. 2010, 17, 1–5. [Google Scholar]
- Chu, R.-S.; Li, Z.-J.; Liu, J.-G.; Fan, Y.; Liu, Y.; Ma, C.-W. Effect of soft reduction process on segregation of a 400 mm thick high-alloy steel slab. J. Iron Steel Res. Int. 2021, 28, 272–278. [Google Scholar] [CrossRef]
- Rogberg, B.; Ek, L. Influence of Soft Reduction on the Fluid Flow, Porosity and Center Segregation in CC High Carbon- and Stainless Steel Blooms. ISIJ Int. 2018, 58, 478–487. [Google Scholar] [CrossRef]
- Feng, L. Research on Soft Reduction Theory and Internal Quality Improvement for Continuous Casting Slab; Northeastern University: Shenyang, China, 2018. [Google Scholar]
- Chen, Y.K.; Feng, F. Improvement of center segregation for high carbon steel bloom. In Proceedings of the Seventy Ninth Conference of the Steelmaking Division of the Iron and Steel Society, Pittsburgh, PA, USA, 24–27 March 1996; pp. 505–512. [Google Scholar]
- Matsumiya, T. Recent Topics of Research and Development in Continuous Casting. ISIJ Int. 2006, 46, 1800–1804. [Google Scholar] [CrossRef]
- Cherepanov, A.N.; Popov, V.N.; Komshukov, V.P. Flow structure in solidifying continuous-cast steel ingot. Steel Transl. 2007, 37, 842–846. [Google Scholar] [CrossRef]
- Ludlow, V.; Normanton, A.; Anderson, A. Strategy to minimize central segregation in high carbon steel grades during billet casting. Ironmak. Steelmak. 2005, 32, 68–74. [Google Scholar] [CrossRef]
- Ayata, K.; Mori, T.; Fujimoto, T.; Ohnishi, T.; Wakasugi, I. Improvement of macrosegregation in continuously cast bloom and billet by electromagnetic stirring. Trans. ISIJ 1984, 24, 931–939. [Google Scholar] [CrossRef]
- Flemings, M.C.; Nereo, G.E. Macrosegregation: Part I. Trans. AIME 1967, 239, 1449. [Google Scholar]
- Flemings, M.C. Our Understanding of Macrosegregation: Past and Present. ISIJ Int. 2000, 40, 833–841. [Google Scholar] [CrossRef]
- Lesoult, G. Macrosegregation in steel strands and ingots: Characterisation, formation and consequences. Mater. Sci. Eng. A 2005, 19, 413–414. [Google Scholar] [CrossRef]
- Apelian, D.; Flemings, M.C.; Mehrabian, R. Specific permeability of partially solidified dendritic networks of Al-Si alloys. Metall. Trans. 1974, 5, 2533–2537. [Google Scholar] [CrossRef]
- Streat, N.; Weinberg, F. Interdendritic fluid flow in a lead-tin alloy. Metall. Trans. B 1976, 7, 417. [Google Scholar] [CrossRef]
- Poirier, D.R. Permeability for flow of interdendritic liquid in columnar-dendritic alloys. Metall. Trans. B 1987, 18, 245. [Google Scholar] [CrossRef]
- Lally, B.; Biegler, L.; Henein, H. Finite difference heat transfer modeling for continuous casting. Metall. Mater. Trans. B 1990, 21, 761–770. [Google Scholar] [CrossRef]
- Rappaz, M.; Gandin, C.A. Probabilistic modelling of microstructure formation in solidification processes. Acta Metall. Mater. 1993, 41, 345–360. [Google Scholar] [CrossRef]
- Kurz, W.; Giovanola, B.; Trivedi, R. Theory of microstructural development during rapid solidification. Acta Metallurgica 1986, 34, 823–830. [Google Scholar] [CrossRef]
- Kurz, W.; Fisher, D.J. Fundaments of Solidification, 4th revised ed.; Trans Tech Publishers: Aedermannsdorf, Switzerland, 1998; p. 77. [Google Scholar]
- Bai, L.; Wang, B.; Zhong, H.; Ni, J.; Zhai, Q.; Zhang, J. Experimental and numerical simulations of the solidification process in continuous casting of slab. Metals 2016, 6, 53. [Google Scholar] [CrossRef]
- Li, W.C. Metallurgy and Physical Chemistry of Materials; Metallurgical Industry Press: Beijing, China, 2001; pp. 531–533. (In Chinese) [Google Scholar]
- Fang, Q.; Ni, H.W.; Zhang, H.; Wang, B.; Lv, Z.A. The effects of a submerged entry nozzle on flow and initial solidification in a continuous casting bloom mold with electromagnetic stirring. Metals 2017, 7, 146. [Google Scholar] [CrossRef]
- Savage, J.; Pritchard, W.H. The problem of rupture of the billet in the continuous casting of steel. J. Iron Steel Inst. 1954, 178, 269–277. [Google Scholar]
- Hardin, R.A.; Liu, K.; Beckermann, C.; Kapoor, A. A transient simulation and dynamic spray cooling control model for continuous steel casting. Metall. Mater. Trans. B 2003, 34, 297–306. [Google Scholar] [CrossRef]
- Shuai, Y. Solidification Structure Control and Process Optimization of Ultra thick Slab; Central Iron and Steel Research Institute: Beijing, China, 2020. [Google Scholar]


Disclaimer/Publisher’s Note: The statements, opinions and data contained in all publications are solely those of the individual author(s) and contributor(s) and not of MDPI and/or the editor(s). MDPI and/or the editor(s) disclaim responsibility for any injury to people or property resulting from any ideas, methods, instructions or products referred to in the content. |
© 2022 by the authors. Licensee MDPI, Basel, Switzerland. This article is an open access article distributed under the terms and conditions of the Creative Commons Attribution (CC BY) license (https://creativecommons.org/licenses/by/4.0/).