Article

Laser Powder Bed Fusion of an Al-Mg-Sc-Zr Alloy: Manufacturing, Peak Hardening Response and Thermal Stability at Peak Hardness

Department of Industrial and Materials Science, Chalmers University of Technology, Rännvägen 2A, 41296 Gothenburg, Sweden
*
Author to whom correspondence should be addressed.
Metals 2022, 12(1), 57; https://doi.org/10.3390/met12010057
Submission received: 13 October 2021 / Revised: 28 November 2021 / Accepted: 22 December 2021 / Published: 27 December 2021

Abstract

:
This study shows a rapid and systematic approach towards identifying full density and peak hardness for an Al-Mg-Sc-Zr alloy commonly known as Scalmalloy®. The alloy is tailored for the laser powder bed fusion process and has been shown to be printable with >99.8% relative density. The microstructure suggests Al grain refinement in melt pool boundaries, associated with formation of primary A l 3 ( S c , Z r ) particles during solidification. Peak hardening response was identified by heat treatment tests at 573,598 and 623 K between 0 and 10 h. A peak hardness of 172 HV0.3 at 598 K for 4 h was identified. The mechanical properties were also tested with yield and ultimate strengths of 287 MPa and 364 MPa in as-printed and 468 MPa and 517 MPa in peak hardened conditions, respectively, which is consistent with the literature. Such an approach is considered apt when qualifying new materials in industrial laser powder bed fusion systems. The second part of the study discusses the thermal stability of such alloys post-peak-hardening. One set of samples was peak hardened at the conditions identified before and underwent secondary ageing at three different temperatures of 423,473 and 523 K between 0 and 120 h to understand thermal stability and benchmark against conventional Al alloys. The secondary heat treatments performed at lower temperatures revealed lower deterioration of hardness over ageing times as compared to the datasheets for conventional Al alloys and Scalmalloy®, thus suggesting that longer ageing times are needed.

1. Introduction

Additive manufacturing (AM) summarises a range of highly dynamic manufacturing methods in which discretised material is selectively merged using some kind of fusing medium to build a 3D structure in a layer-by-layer fashion [1]. In laser-based powder bed fusion (LB-PBF) processing for metals, which is a type of AM method, fine metal powder is selectively melted and thus joined using a high-energy laser on a build-plate allowing very fine and complex shapes to be built. Once the relevant cross sections have been scanned by the laser, a new layer of powder is applied using a recoater in order to successively build the final component. The very localised melting of the material yields extremely high cooling rates, reaching levels of 10 4 10 6 K/s, which allows for an extended alloying space as well as significantly different properties compared to conventionally manufactured materials [2].
Aluminium has several alloying systems suitable for AM production and the LB-PBF method in particular [2,3,4]. One such system of interest is the Al-Sc alloy system, from which Scalmalloy® was derived. Initially developed by Airbus in the 1970s, the resulting microstructure of Scalmalloy® after LB-PBF processing has gained the system a lot of traction for AM applications, mostly due to the precipitation scheme of A l 3 S c precipitates playing various roles during processing and solidification [5,6,7,8]. The significance of these precipitates on the overall material properties is evident in both the conventionally manufactured Scalmalloy® and in the AM material and has been studied at length [9,10,11]. During the LB-PBF processing, primary A l 3 S c particles are formed at the melt pool boundaries and act as heterogeneous nucleation sites for Al matrix grains. This creates a refined grain structure of equiaxed grains at the melt pool boundaries in contrast to the elongated columnar grains found inside of the melt pool [12,13,14]. Further, the supersaturation of elements in the matrix due to the high local thermal gradients during processing provides a benign structure for the growth of single-digit nano-sized A l 3 S c precipitates during subsequent ageing, giving a significant contribution to material strength as peak hardness is reached. The overall concept of precipitation hardening Al alloys and the subsequent effect of the alloying elements have been studied at length for manufacturing by LB-PBF and serve as a springboard for further development of alloys and process parameters [15,16,17]. Even alloys of similar characters in terms of precipitation schemes without the addition of Sc have been extensively researched, yielding similar benefits to the Al-Sc equivalent but with lower mechanical properties [18,19].
As more and more attention turns towards AM because of its immense potential in high-performance engineering, it is easy to overlook that the technology is still in its infancy in many regards and challenges still exist within the AM production chain [20,21,22]. Considering the often grand final designs of components tailored to AM, other aspects of the manufacturing process such as choice and tailoring of materials, feedstock manufacture, component design, printability and post-processing might be neglected. However, in the integrated chain of the AM process, all these steps play crucial roles in obtaining a desirable and suitable final product [23]. For AM and LB-PBF in particular, factors such as feedstock properties like powder quality, density variations in the final component and the overall extreme conditions during printing need to be considered to achieve a defect-free final component [2]. To fully reap the benefits of AM, the entire production from raw feedstock to potential post-processing of the resulting structure needs to be studied and assessed for each material and specific alloy manufacturer [12,14]. Different LB-PBF machines, for example, use different setups for powder feeding and distribution or use different laser configurations to process the same materials [2]. For example, machines may be using different spot sizes such as 40 µm or 100 µm but using similar laser wattage (200 W). That would mean that the machine with a smaller spot size of 40 µm will have maximum power density of 1.59 × 10 7 W/cm 2 whereas another machine with a larger spot size of 100 µm will have a power density of 2.55 × 10 6 W/cm 2 , which is approximately an order of magnitude lower. This means that with a smaller spot size, the laser contains much higher energy concentration per unit area and thus, processing conditions for printing any material need to be adjusted while identifying regions with high density. It is thus important to develop an approach taking into account certain materials and machines, for example, to develop consistent properties.
In this study, a use case with Scalmalloy® printed using an EOS M100 machine has been shown and thus compared with other researchers’ results and results from the alloy manufacturer. The procedure followed simple steps such as performing a processability test with 10 mm side cubes printed in a simple design of the experimental approach to identify regions with high density (>99.5%), followed by heat treatments at different temperatures of interest to identify full hardness. The peak hardened condition was tested using tensile tests to corroborate the mechanical properties meeting standard data sheets. This procedural approach is beneficial when trying to qualify materials for different LB-PBF systems as they may have different resulting properties if a consistent approach is not used. Such an approach is considered good as it removes uncertainties arising from some of the process-related issues. It can thus be useful for researchers to qualify new materials for LB-PBF machines. This approach has also been used by the authors on four novel Al alloys, which are tailored for the LB-PBF process with successful results, and which are part of another study. Thus, the results from this study act as a benchmark to verify the validity of such a method as Scalmalloy® is a famous material with known properties. Finally, the thermal stability of the peak hardened material at medium temperatures (423–523 K) was tested using microhardness testing as an indicator. These properties could be crucial when developing materials, for example aerospace structures [19]. The results were not conclusive as the deterioration in hardness was lower than suggested from the material data sheet; thus, it was suggested that longer ageing times would be needed to develop a full picture of thermal stability.

2. Materials and Methods
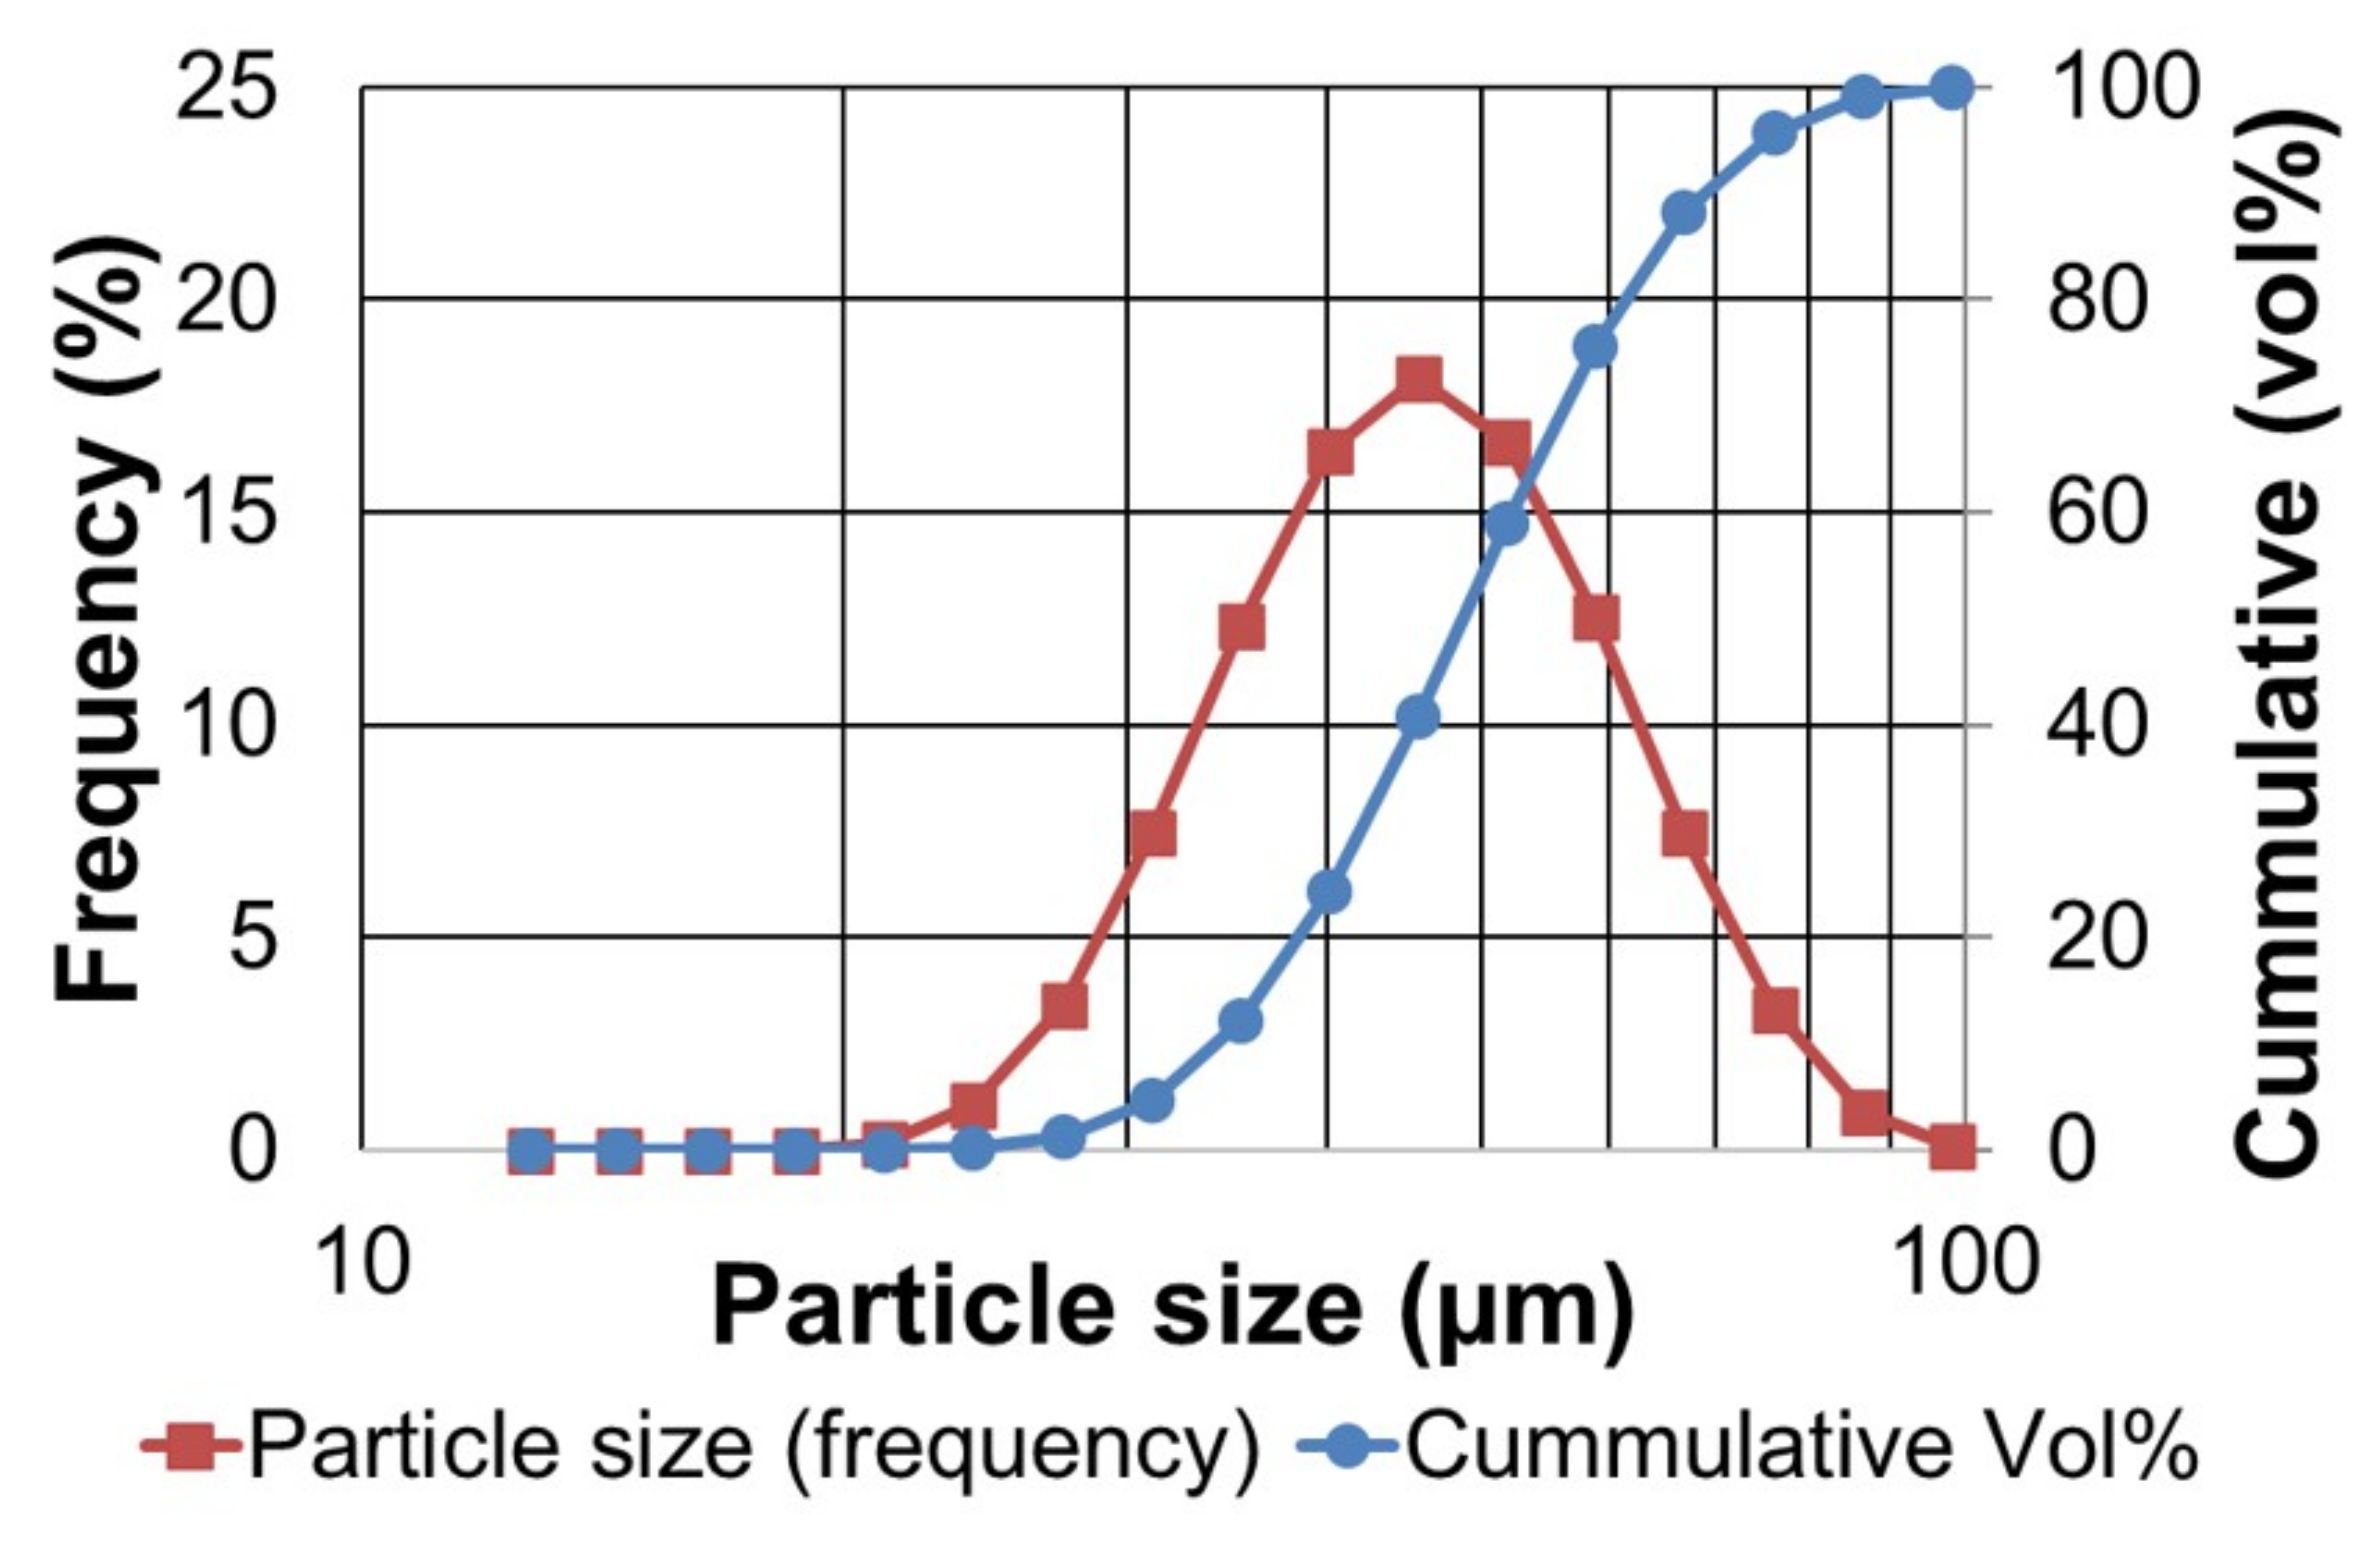
2.1. Materials

The atomised Scalmalloy® powder used was provided by Höganäs AB. The powder size distributions in as-received condition are mentioned in Figure 1 and Table 1. Table 2 shows the chemical composition of the powder in as-received condition and of the as-printed material. The powder size distribution was measured by laser diffraction using a Mastersizer 3000 from Malvern, UK, at RISE, Mölndal. The results were averaged over five measurements. The chemical composition was calculated using the inductively coupled plasma (ICP-AES) technique conducted at Höganäs AB.

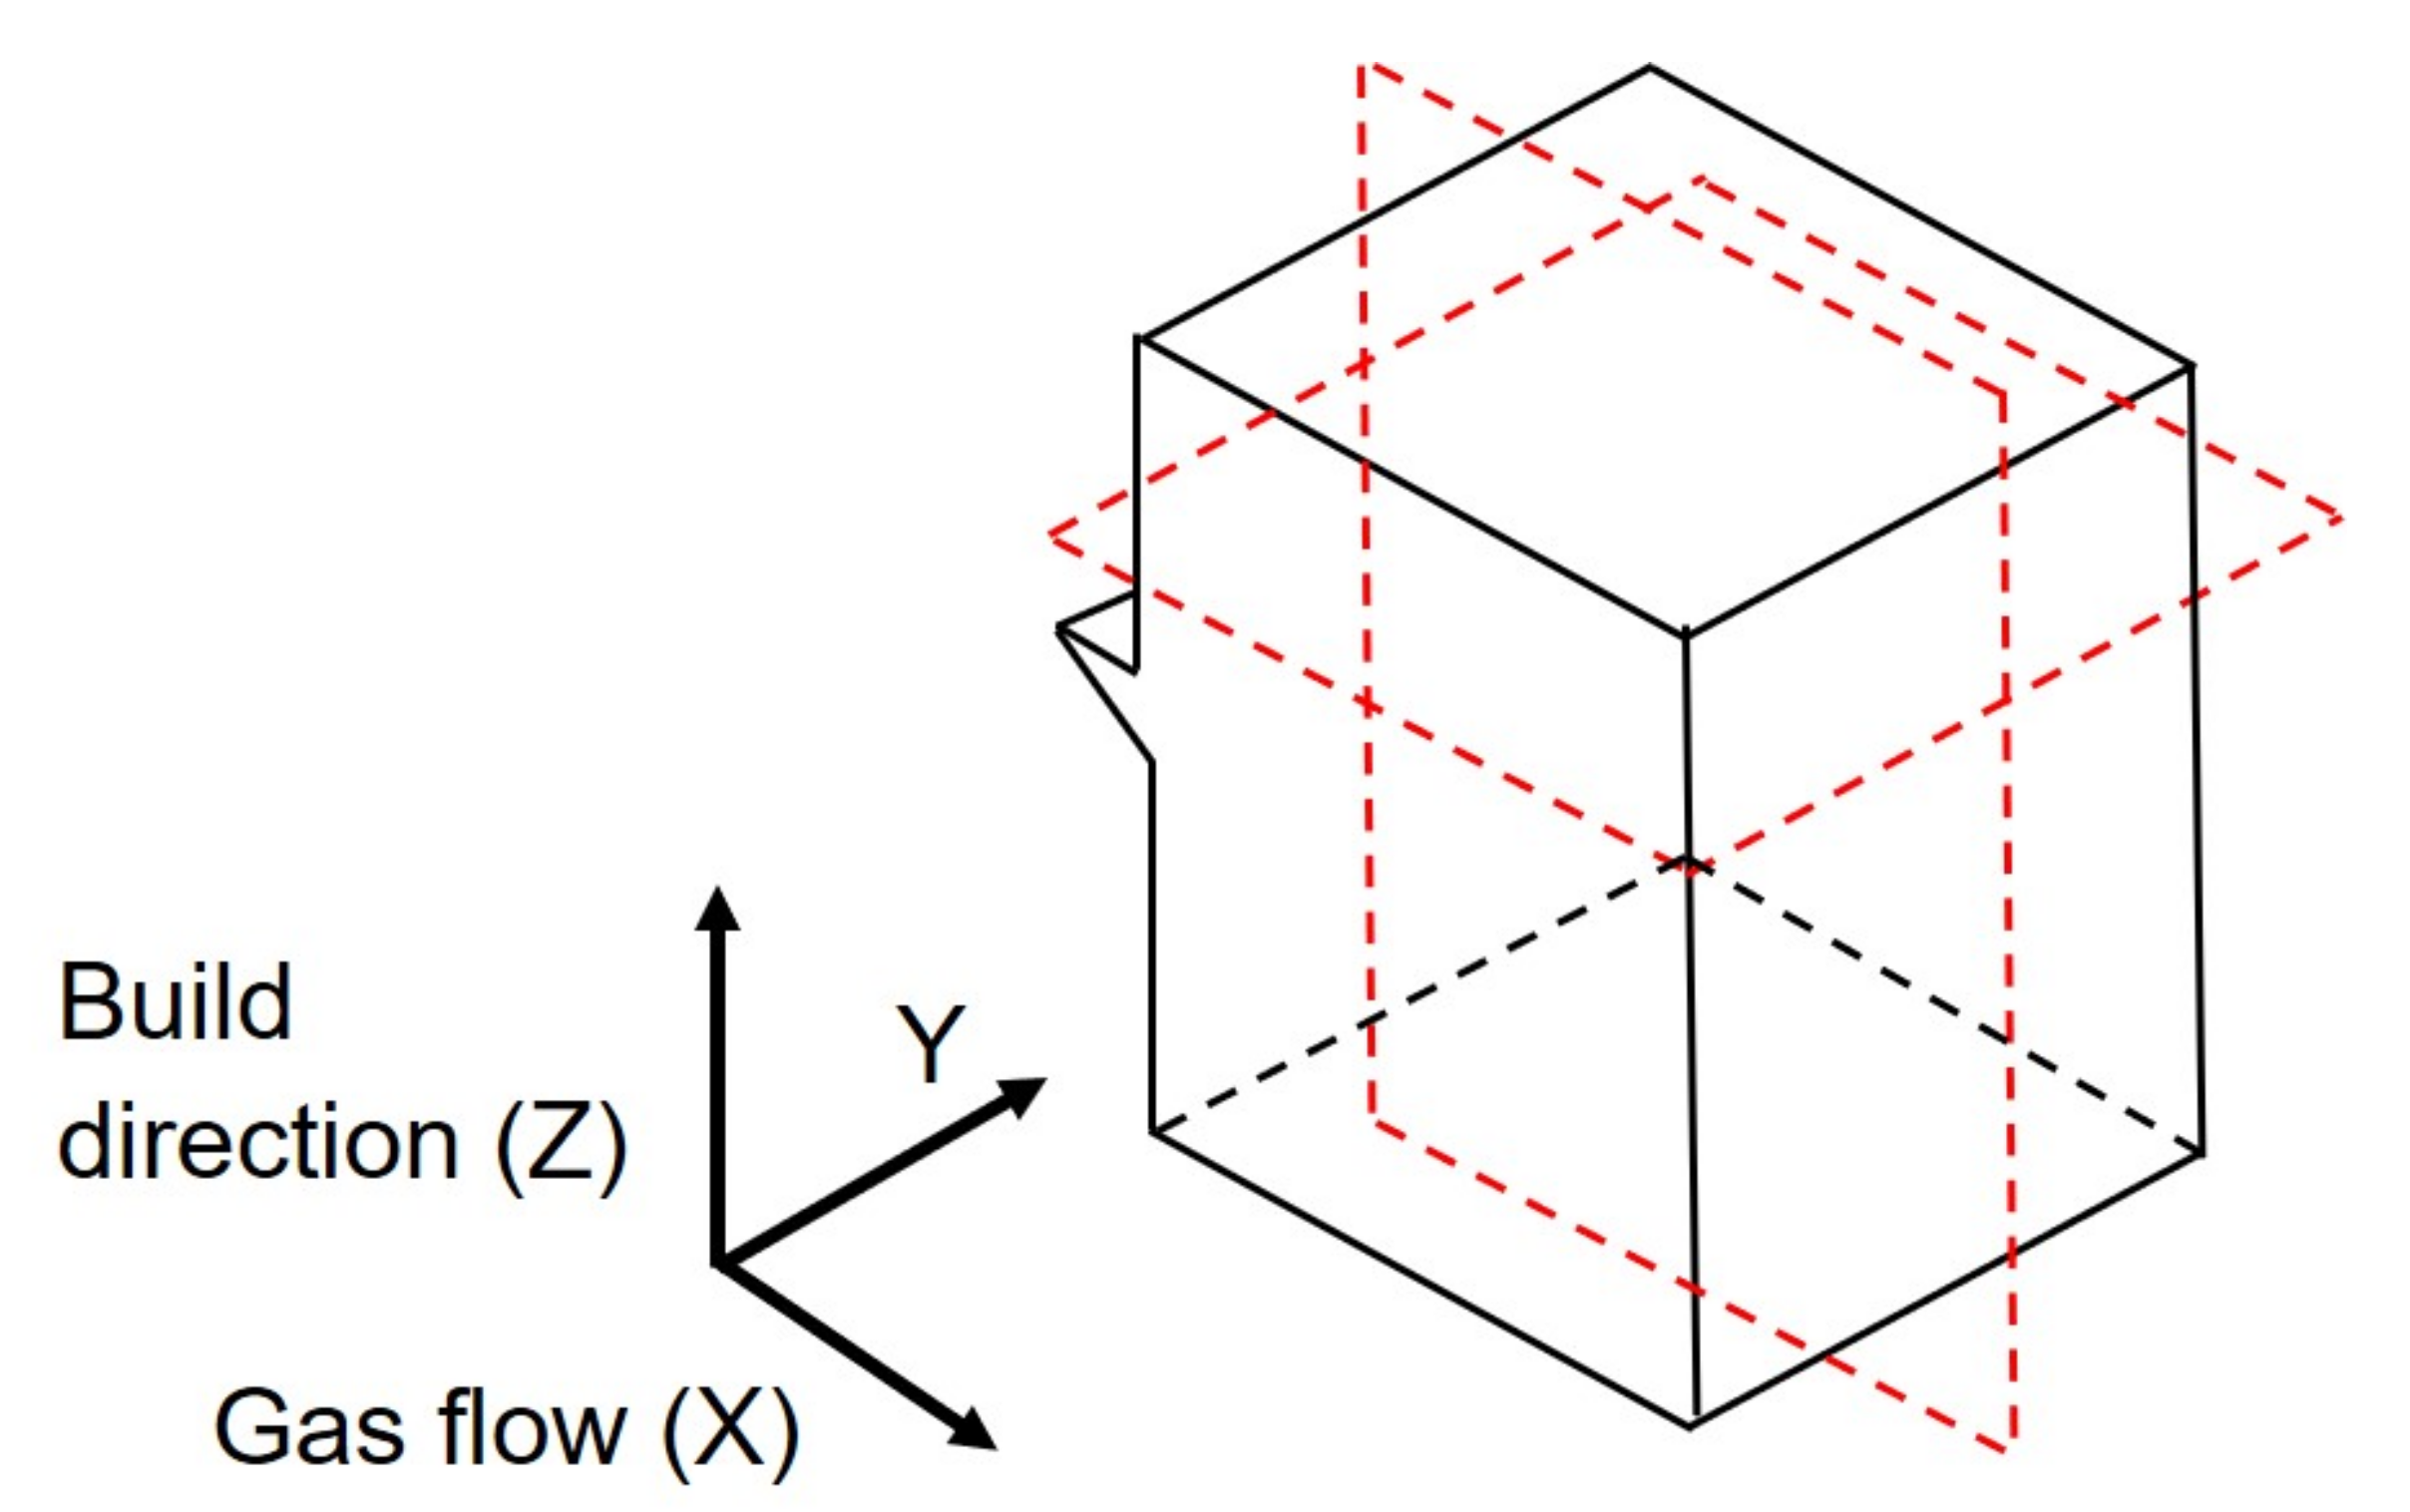
2.2. LB-PBF Processing and Establishing Full Density

The atomised powder was printed using an EOS M100 LB-PBF machine from EOS GmbH, Germany with a Yb-fibre laser having a spot size of 40 µm and peak power of 200 W (170 W nominal). The samples were printed keeping 170 W power and 0.03 mm layer thickness as fixed processing input with standard scan rotation of 67 . The processability of the alloy was then explored by varying the hatch distance and laser speed to identify settings leading to high relative density (>99.5%). The samples were printed as 10 mm × 10 mm × 10 mm cubes and their relative density was measured by observing cross sections of the samples along the build direction and transverse to build direction (XZ and XY) as shown in Figure 2. The relative density of the samples was determined from stitched optical microscopy images of cross sections in as-polished condition along the XZ and XY planes and analysed using ImageJ software.

2.3. Microstructure Evaluation, Thermal Treatment and Mechanical Testing

2.3.1. Microstructure Evaluation

For microstructure evaluation and microscopy, the samples were cut along XZ and XY planes, as described in Figure 2. After cutting of samples, they were mounted on Polyfast resin (from Streurs, Denmark). Then, the samples were ground on SiC foils of 240, 500, 1200, 2000 and 4000, followed by polishing with a 1 µm diamond-based polish and a final step with OP-S suspension from Streurs. All the grinding and polishing steps were conducted on a Streurs TegraPol31 machine. Some of the samples were etched using standard Keller’s reagent for optical microscopy. Light optical microscopy was conducted on a ZEISS Axioscope 7 instrument with an automated scale, which could stitch images with larger cross sections (order of 100 mm 2 ). The microstructure evaluation was performed on polished samples on a Zeiss Gemini SEM 450 scanning electron microscope (SEM) with a field emission gun source. The microscope was fitted with a Bruker Quantax FlatQuad energy dispersive X-ray spectroscopy (EDS) detector, which enabled elemental mapping of microstructure at sub-micron resolutions.

2.3.2. Thermal Treatment

The high-temperature heat treatment (>573 K) of the samples was conducted in a pre-heated resistance furnace with a secondary thermocouple located close to the sample to verify temperature control within ± 2 C. The low-temperature heat treatments (423–523 K) were conducted in a HERATHERM convective oven by Thermo Scientific. The temperature close to the samples was used for calibrating the machine within ± 2 C.

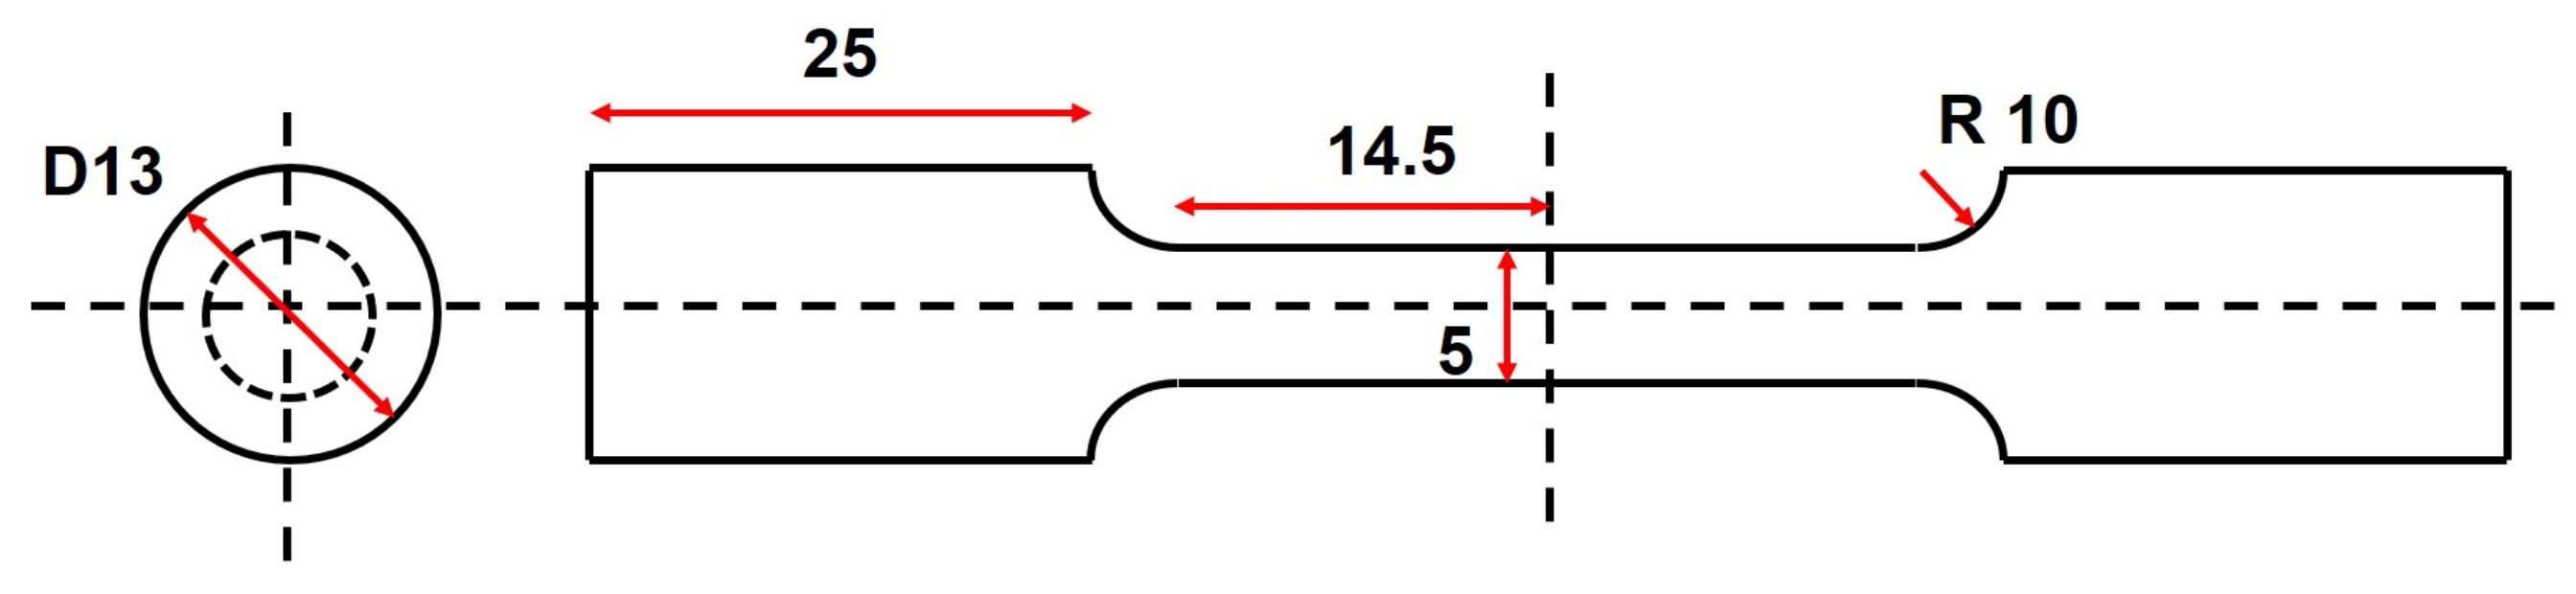
2.3.3. Mechanical Testing

Vickers hardness testing was performed as per ASTM standard E92, E384 on the as-printed and heat-treated samples using a Qness Q10A+ automatic indentation machine with a load of 0.3 kg, hold time of 10 s and spacing of at least five times the indentation dimensions. For each sample, 16 points (4 × 4 grid) were tested along both XZ and XY planes to obtain a range of hardness value. The tensile testing specimens were printed horizontally along the build plate surface in the EOS M100 printer due to constraints with the printable height. Samples of 92 mm × 18 mm × 10 mm were then printed with a building direction along the 18 mm side. They were later machined as per the ISO 6892-1:2019 standard to make circular specimens with specifications shown in Figure 3. The test section was 5 mm diameter and 25 mm gauge length. The samples were tested on a Zwick/Roell 2100 machine at Höganäs AB with a crosshead speed of 0.6 mm/min until failure, thus following the ISO 6892-1:2019 standard. Three samples each for as-printed and peak-aged conditions (598 K, 4 h) were tested.

3. Results

3.1. Printability of Alloy

Although Al-Mg-Sc-Zr (Scalmalloy®) has been shown to be printable by several authors [5,7], the printability for different LB-PBF machines differs due to different processing routes employed by these machines. The machines could have differences in laser spot sizes and differences in powder handling systems or recoating mechanisms, which make it complicated to directly use the same processing parameters as established in the literature and apply them to any suitable machine. For the case in question, these alloys have been shown to be printable in an EOS M100 machine. Although the machine is equipped with a laser of 200 W, the spot size of 40 µm makes it have a focused beam with higher energy density. Thus, experiments were conducted by printing cubes of 10 mm × 10 mm × 10 mm with varying laser speed and hatch distance, to establish a new processing window with relatively high density (>99.5% density). The processing parameters are mentioned in Table 3.
After printing the specimens, they were cut as shown by the red lines in Figure 2 along the XZ and XY directions. The porosity levels were then measured using ImageJ software after acquiring section images at 5X optical zoom for the whole cross section. The cross sections studied were at least 40–50 mm 2 to ensure that a decent amount of porosity was captured. Figure 4 shows the summary of density results as a surface plot, thus showing a possible processing parameter window for such alloys. Thus, areas with >99.5% relative density were acquired.

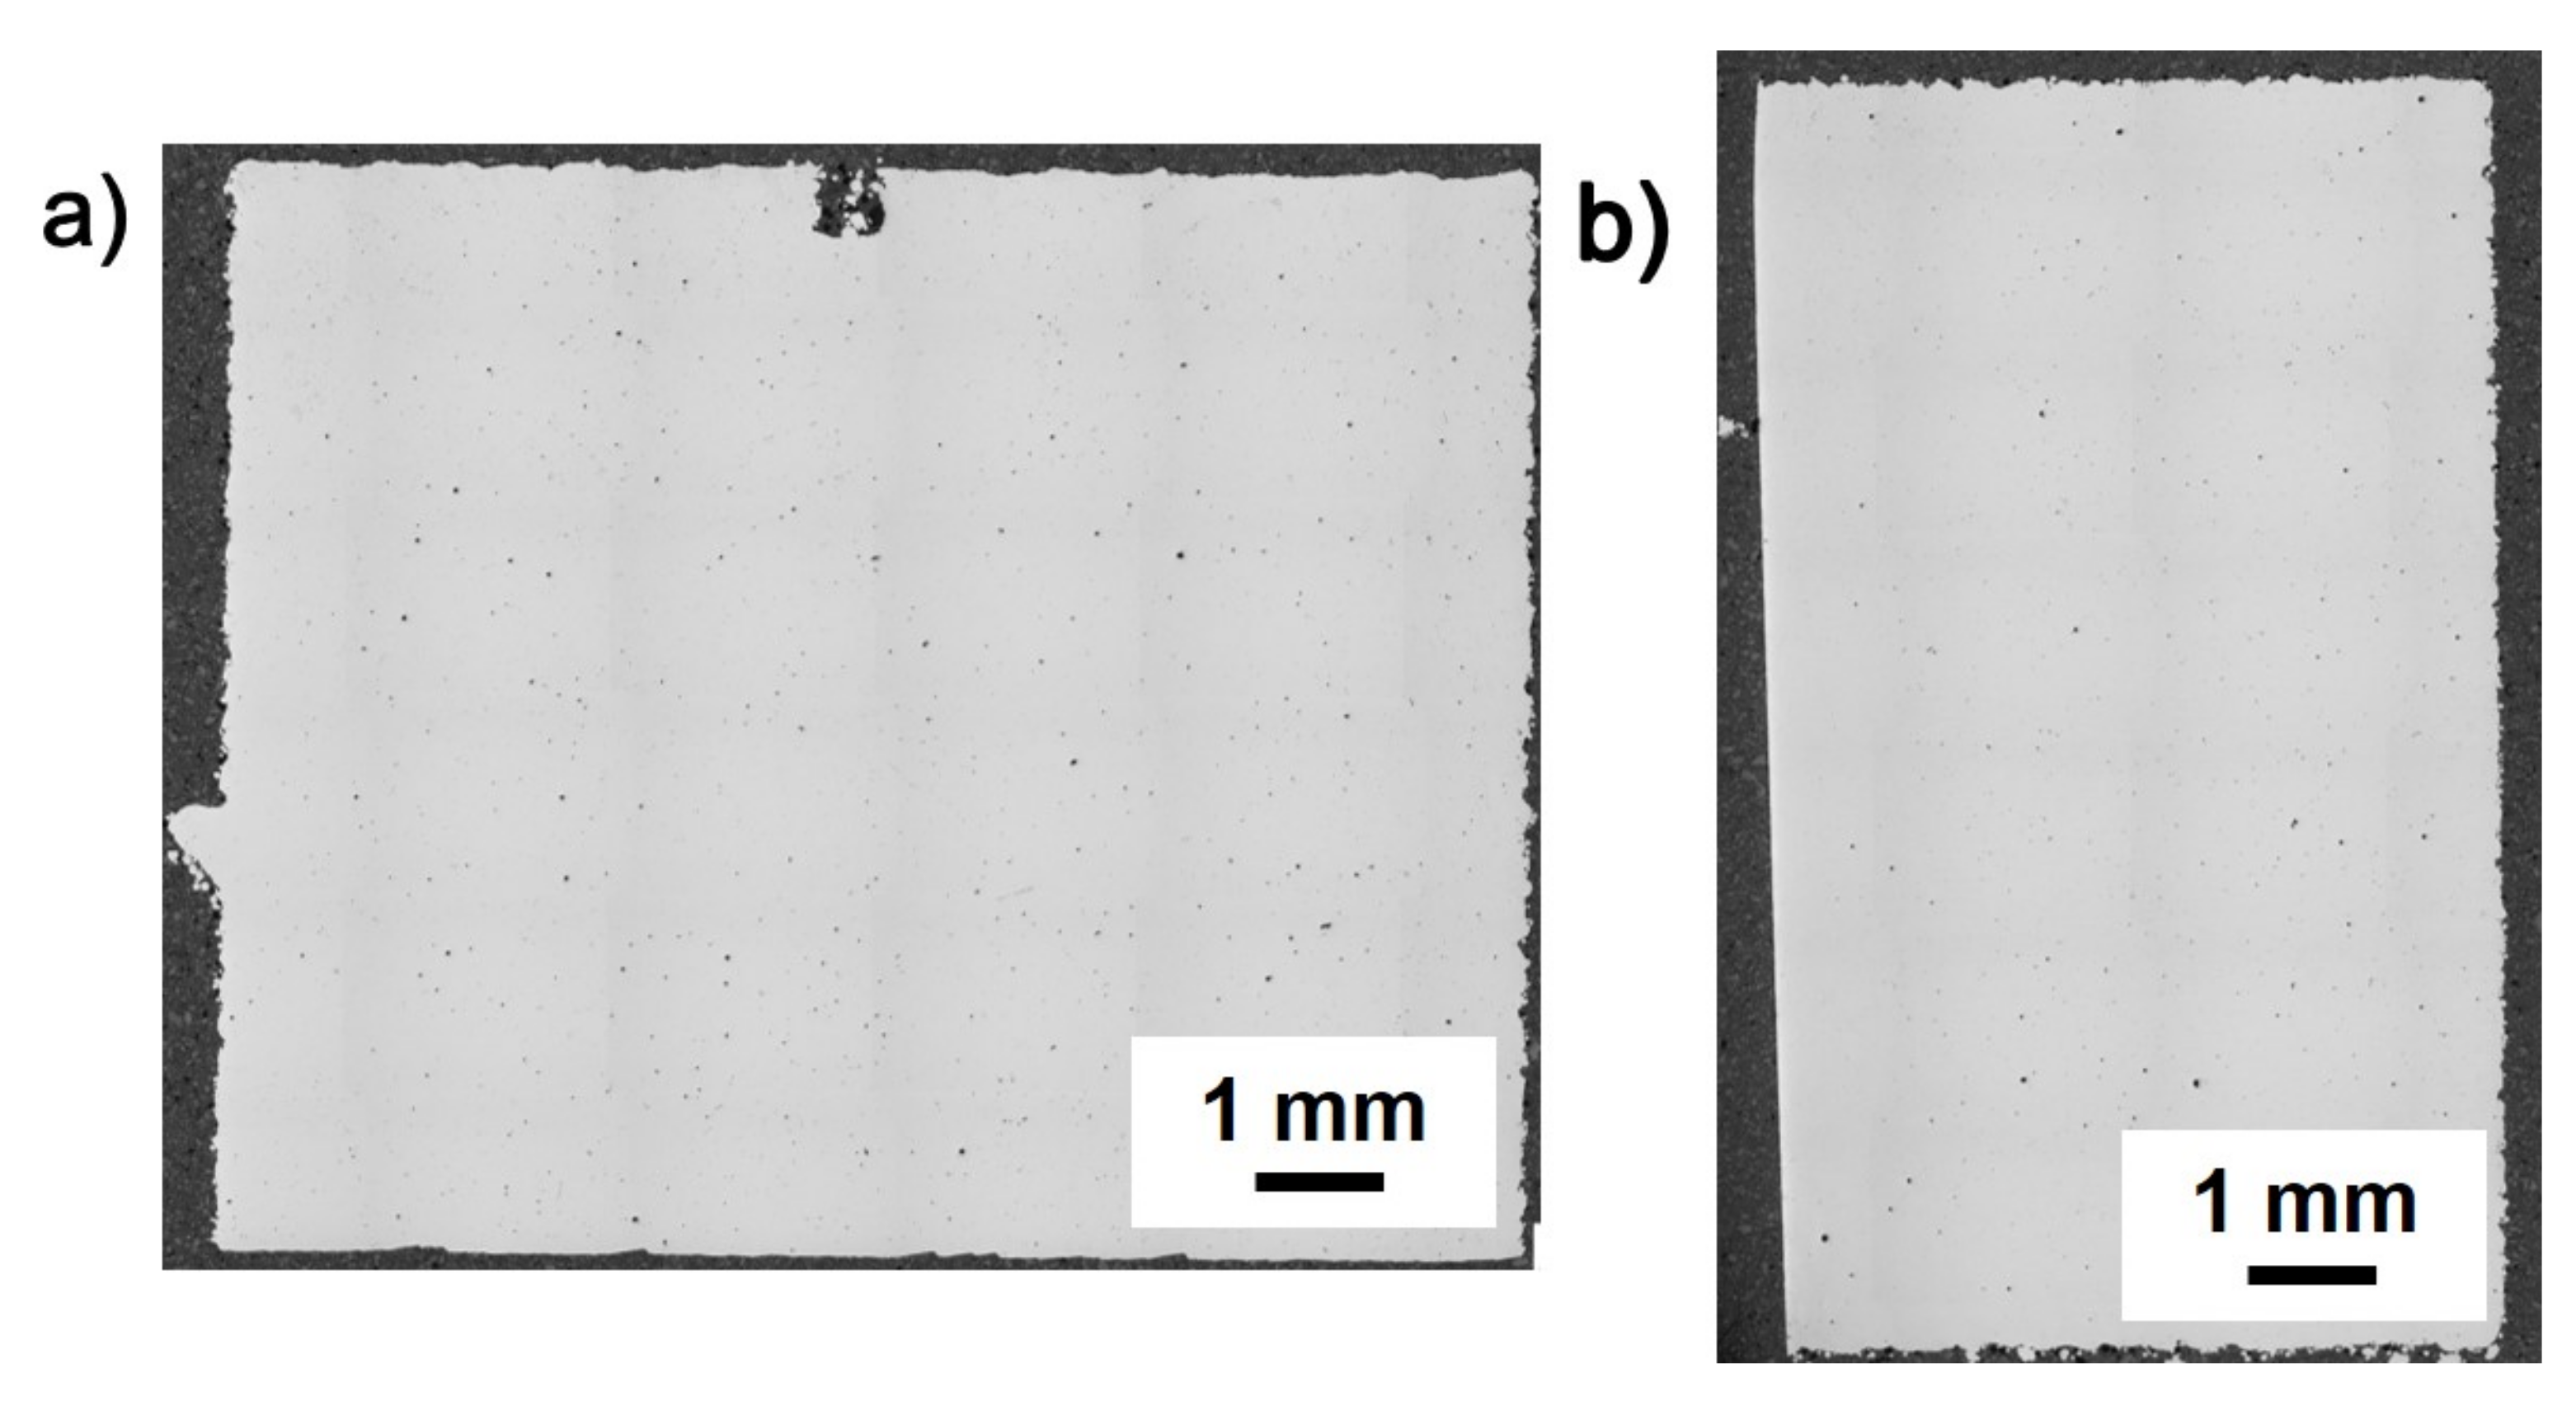
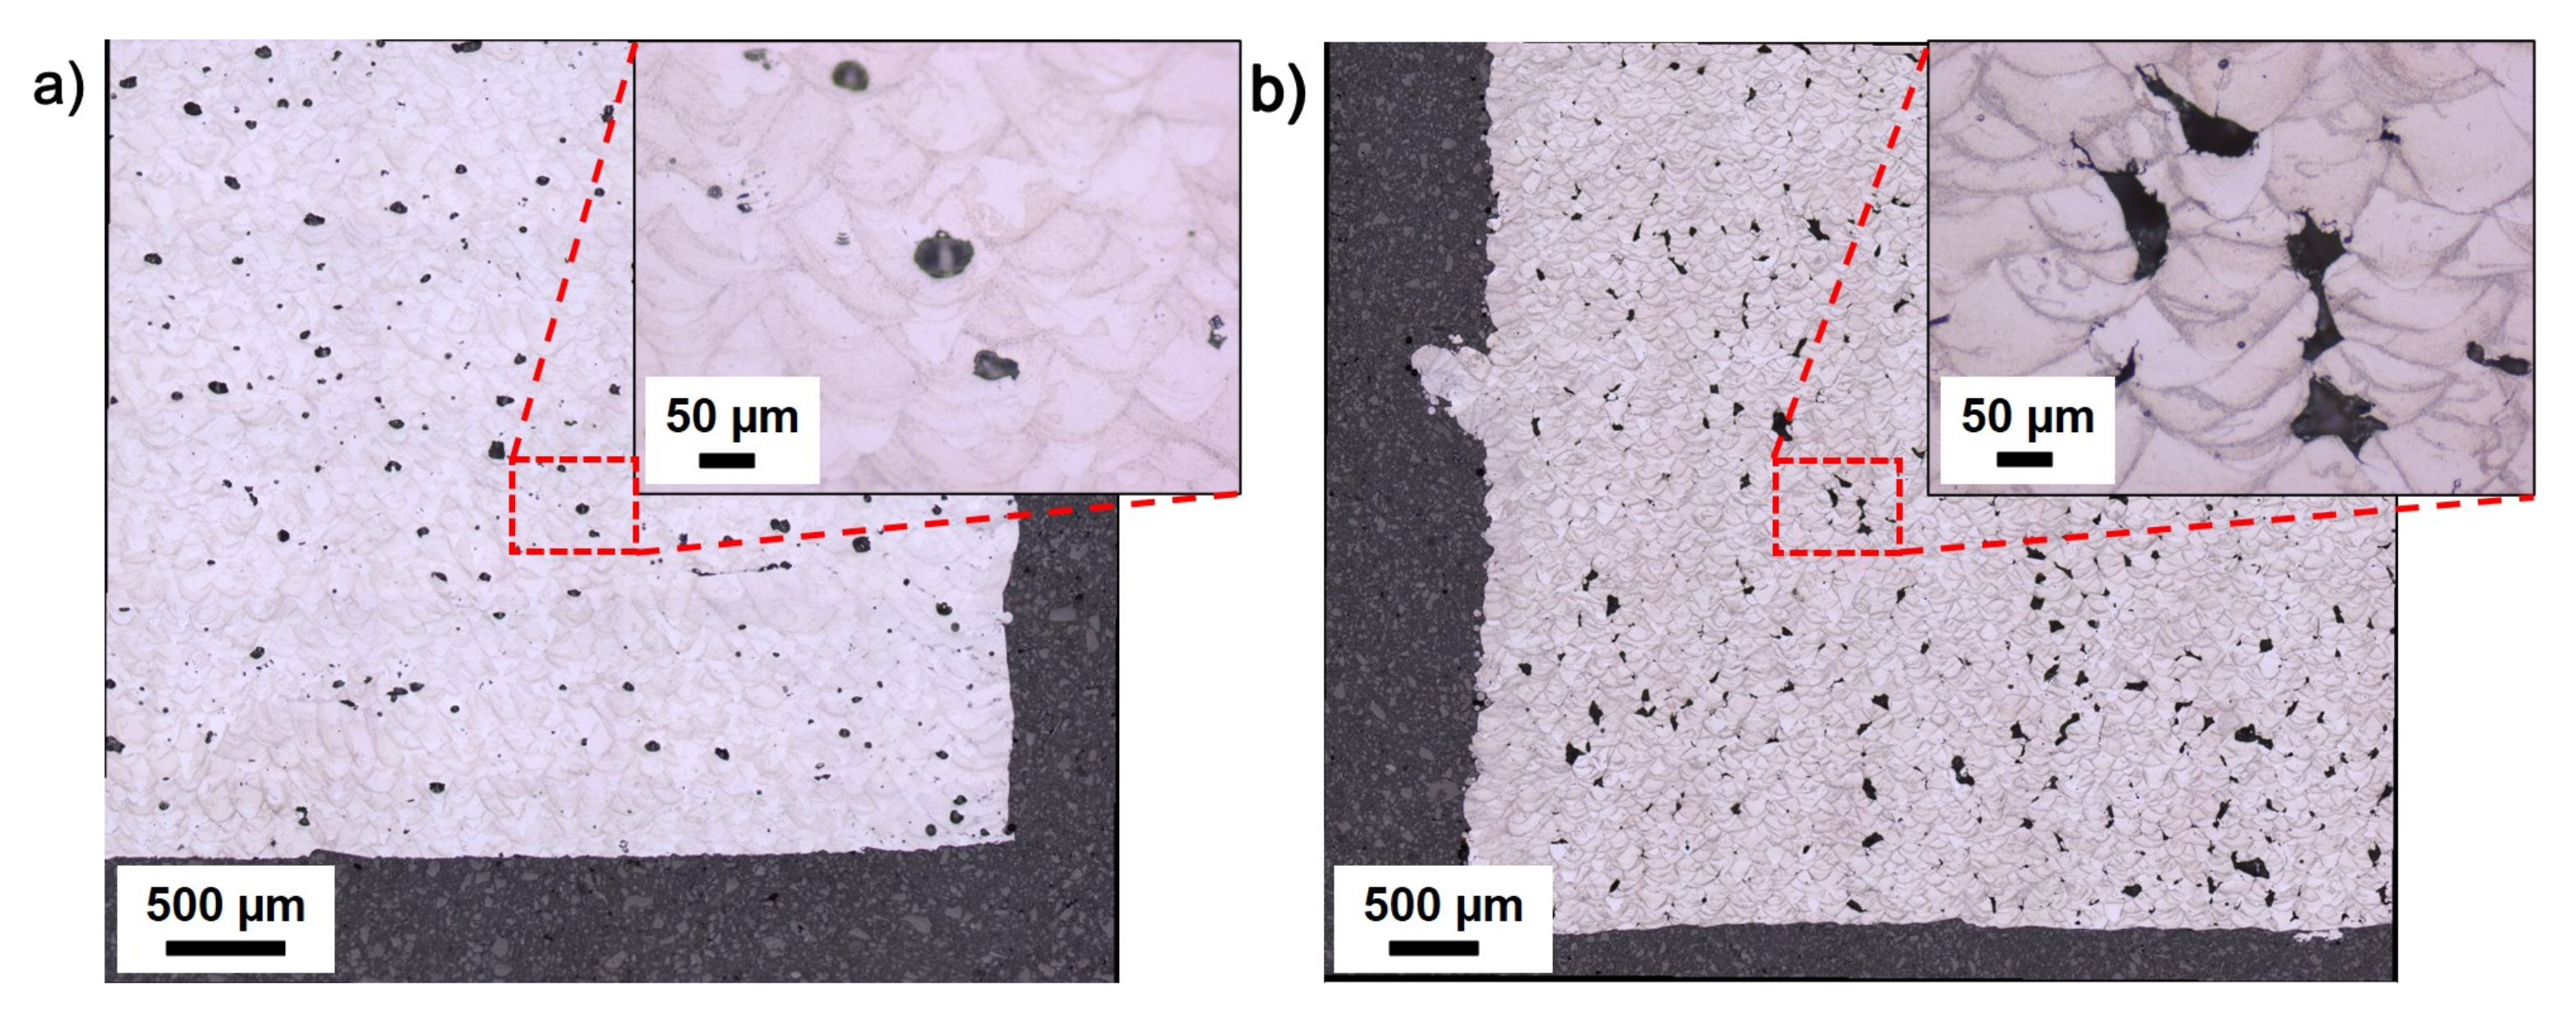
3.2. Optical Microscopy

Optical microscopy images taken at 5X optical zoom and stitched over long areas are shown in Figure 5, which depicts the fully dense microstructure obtained for the alloy. There were no issues related to solidification cracking or other processing-related defects seen in this sample. Optical microscopy was also conducted specifically for the worst samples from the design of experiments to study the types of defects generated during the LB-PBF processing. The defects that were studied are illustrated in Figure 6. Two extreme samples were chosen based on understanding of the laser melting process and etched with Keller’s reagent to reveal melt pool boundaries. One of the samples was printed with high energy density coming from constant high power combined with low hatch distance and low laser speed. Here, the concentrated energy leads to evaporation of elements and high gas pressure causing gas porosity as shown clearly in the inset image of Figure 6a. The other sample was printed with low energy density coming from constant high power combined with high hatch distance and high laser speed. This leads to inadequate energy available to melt the metal particles together, thus forming lack of fusion pores that demarcate the lack of bonding between meltpools as shown clearly in the inset image of Figure 6b.

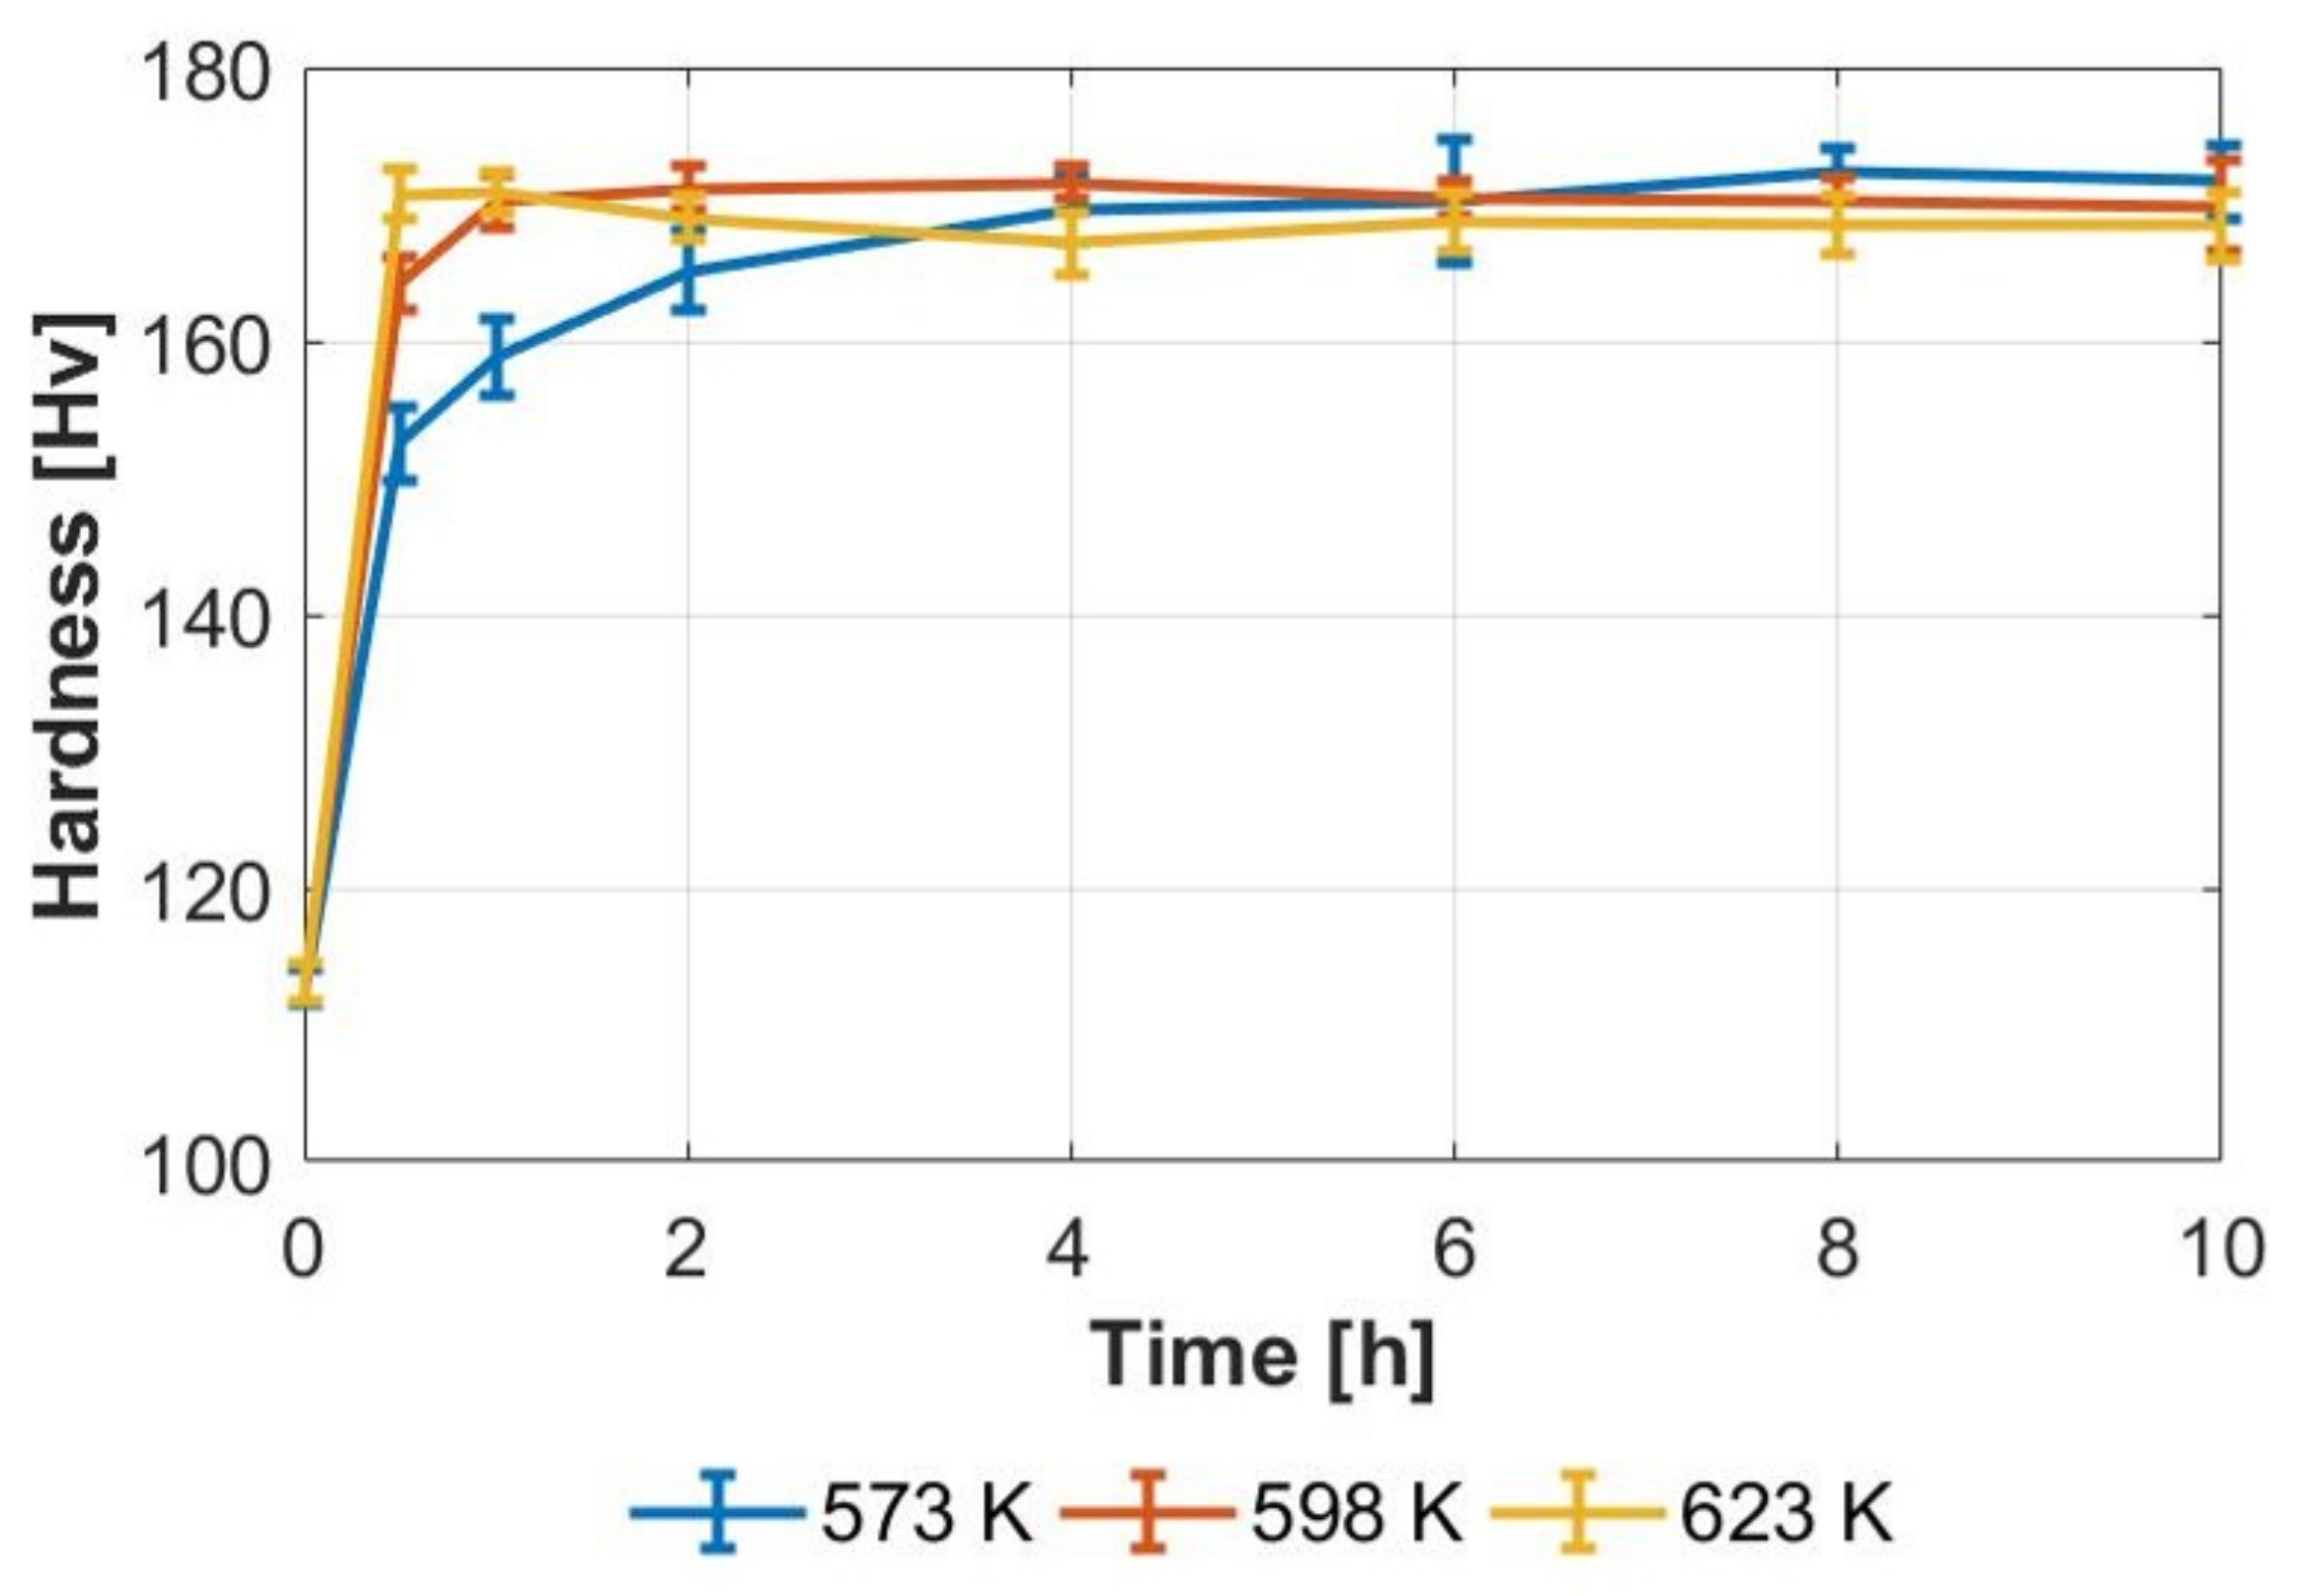
3.3. Microhardness Testing for Identifying Peak Hardness

After ensuring satisfactory relative densities, peak hardness was sought by ageing the samples at 573 K, 598 K and 623 K for up to 10 h. Figure 7 shows the obtained hardness values as a function of ageing time for the 3 different temperatures. A peak ageing treatment was found after holding the material at 598 K for 4 h, which generated a hardness value of 172 HV0.3, averaged over cross sections XY and XZ.

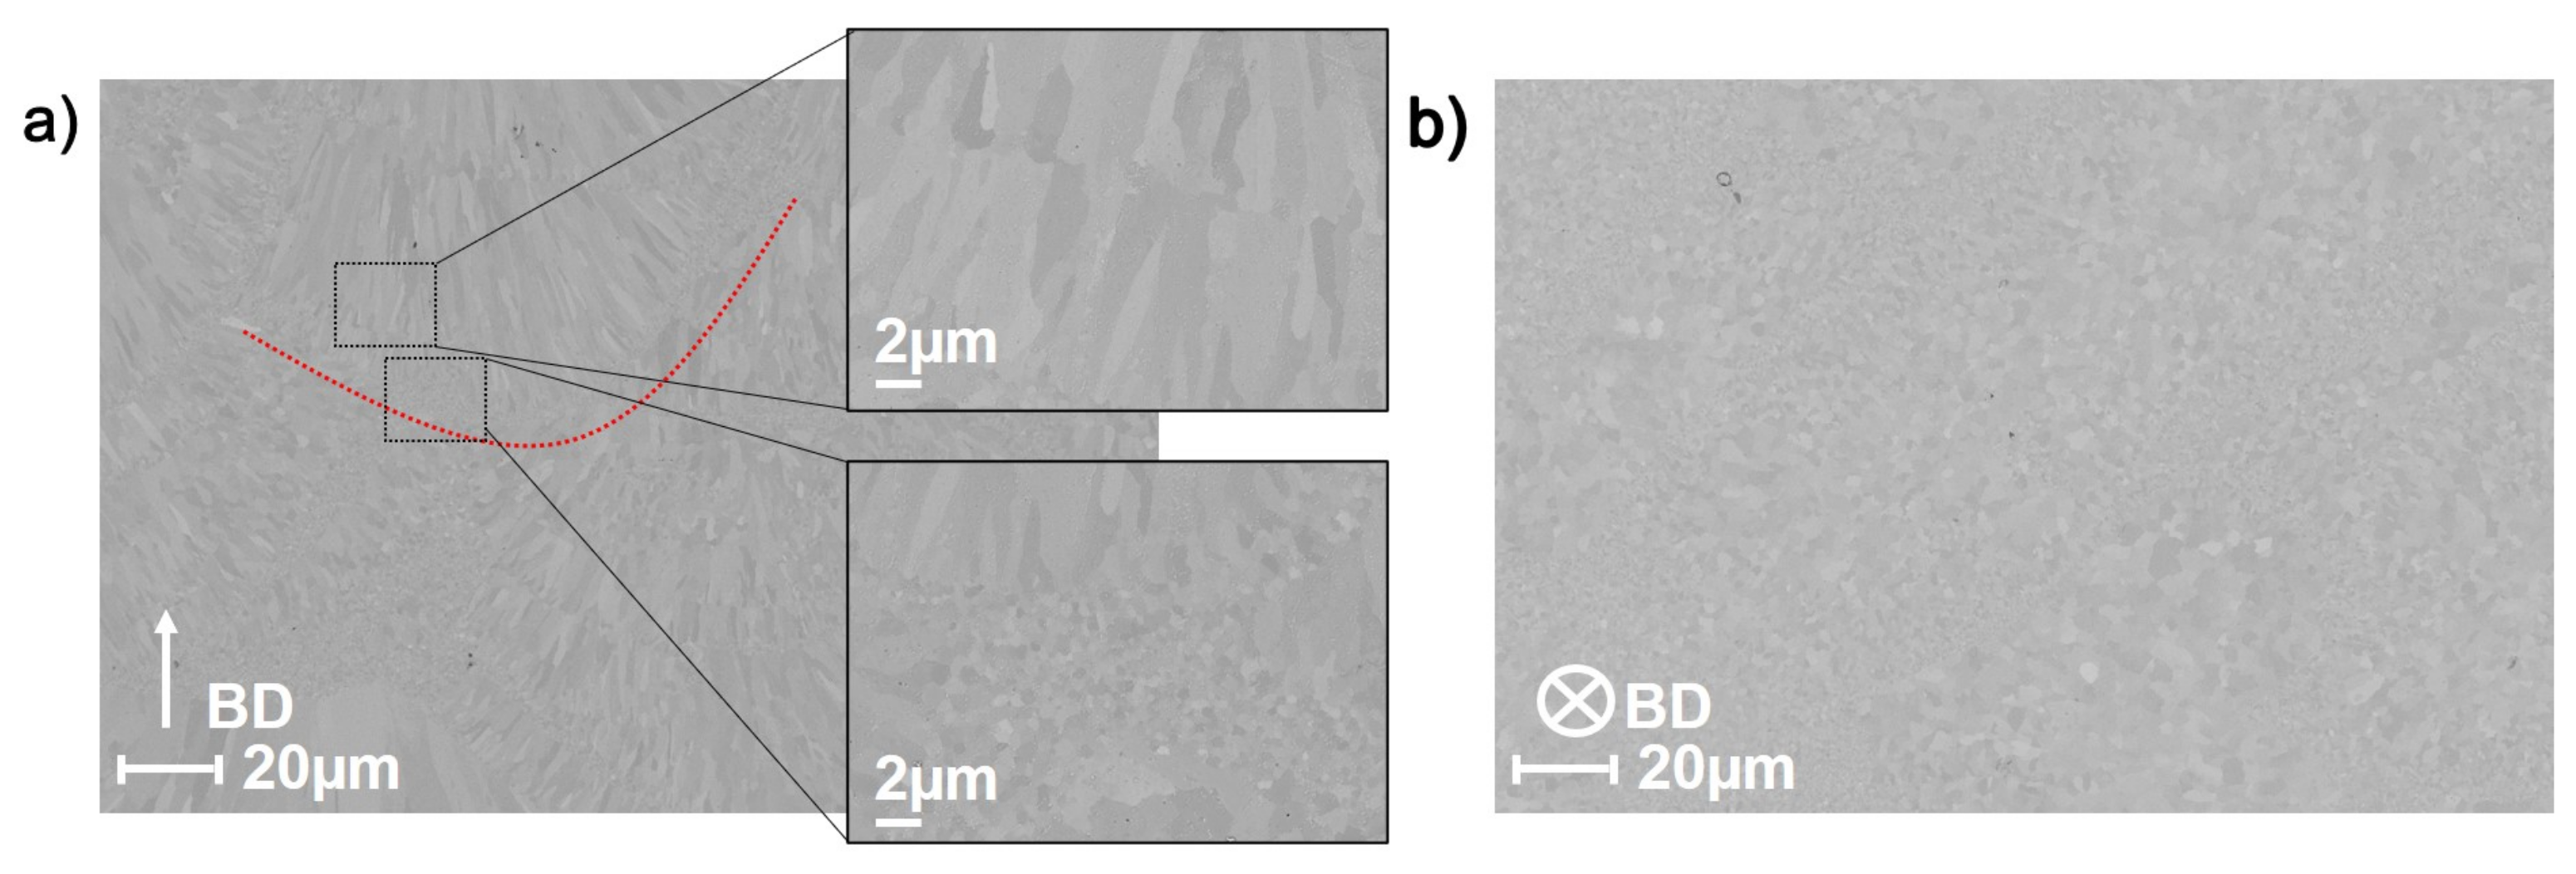
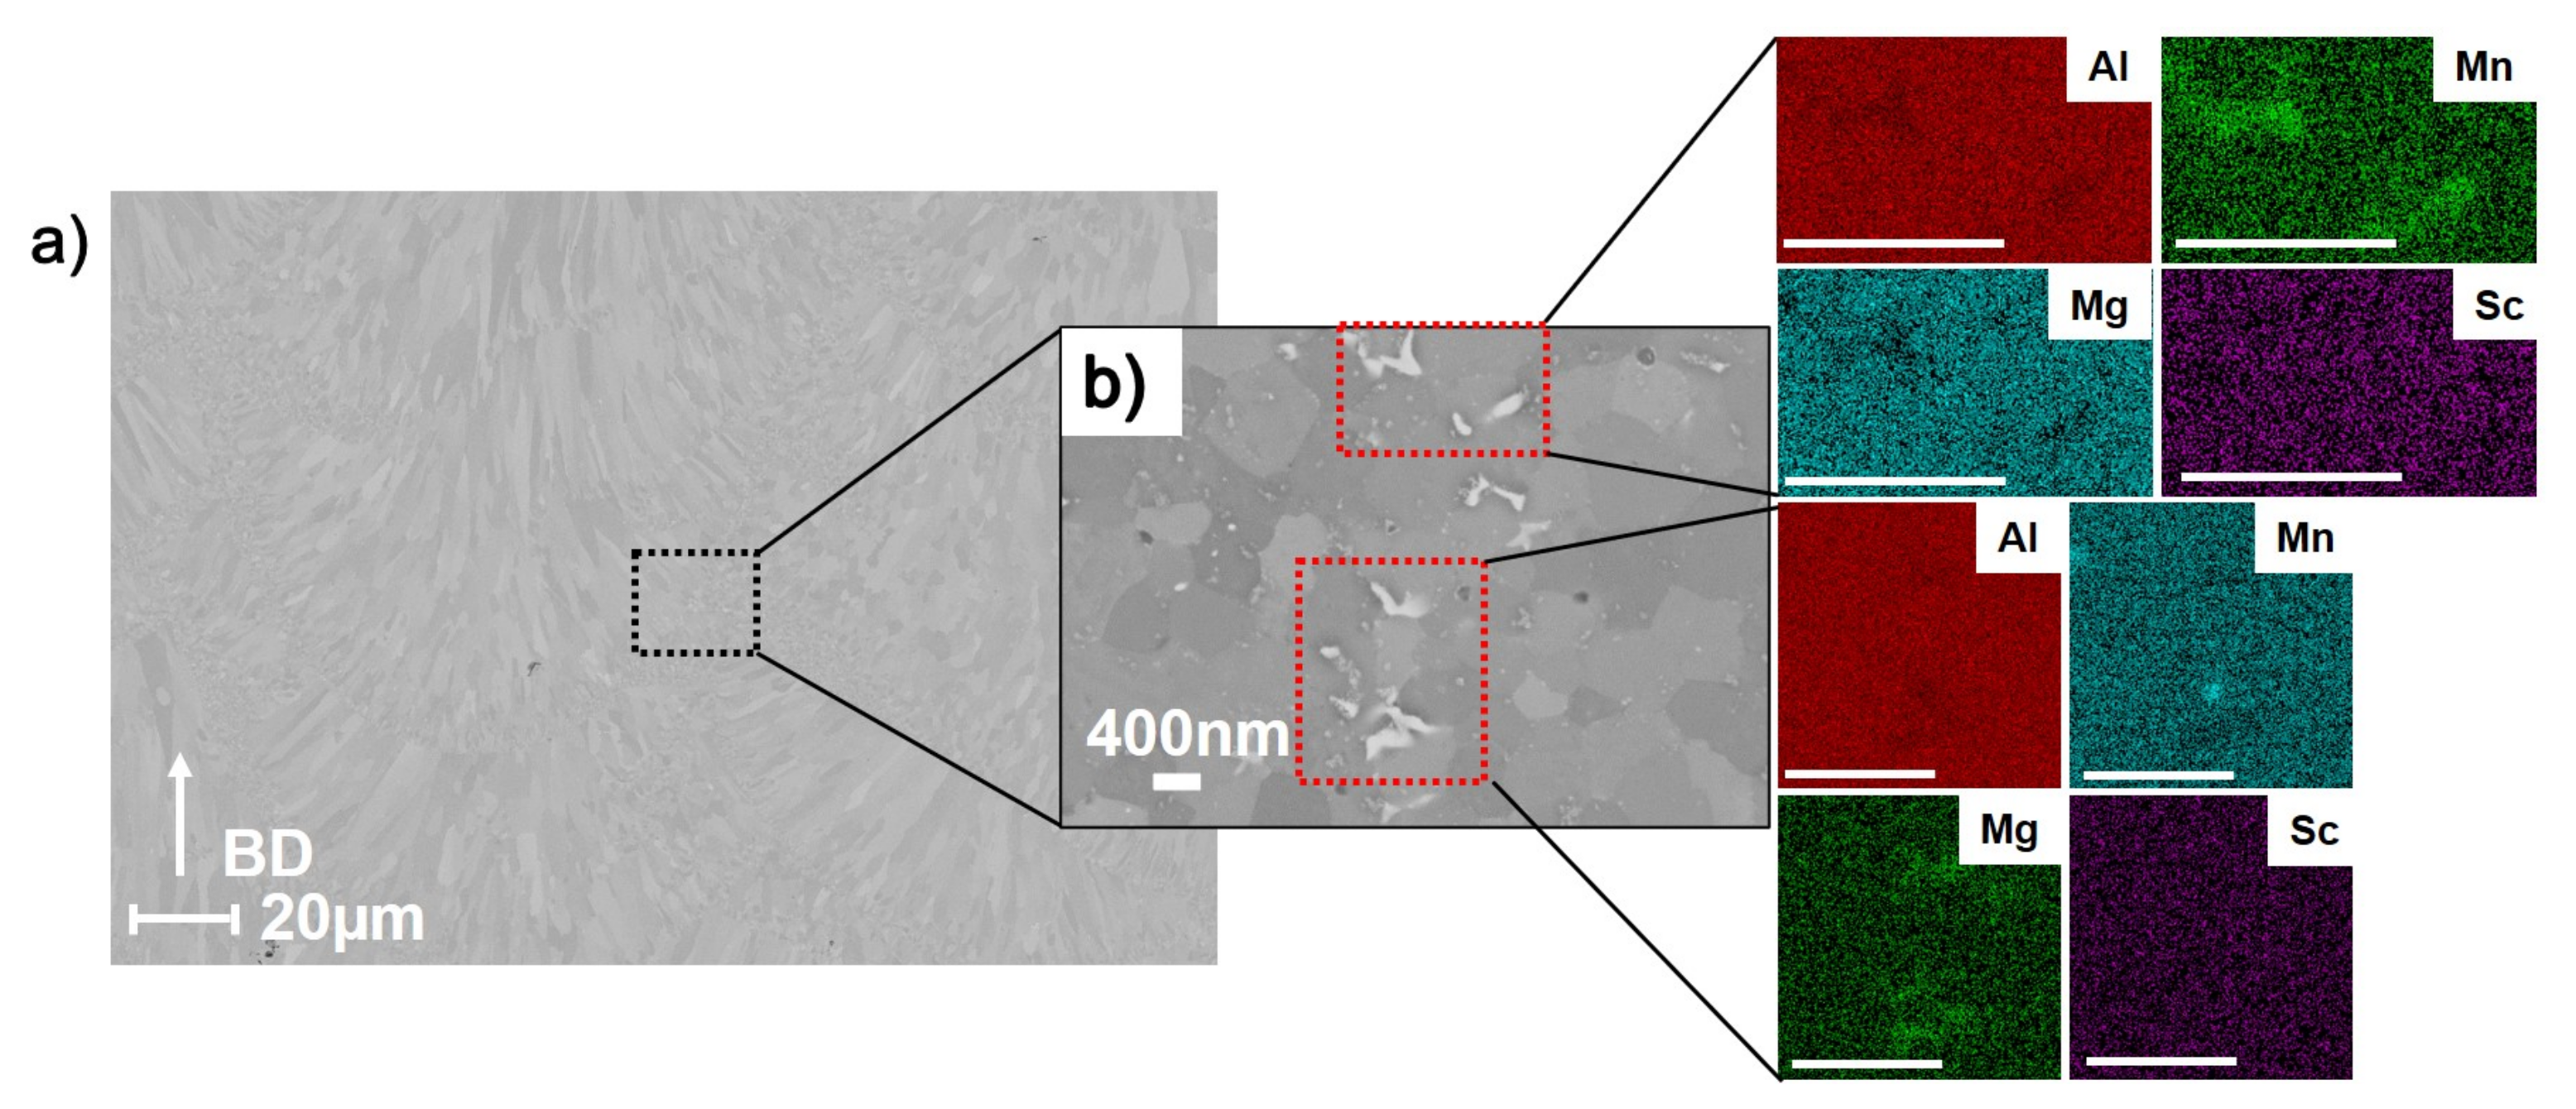
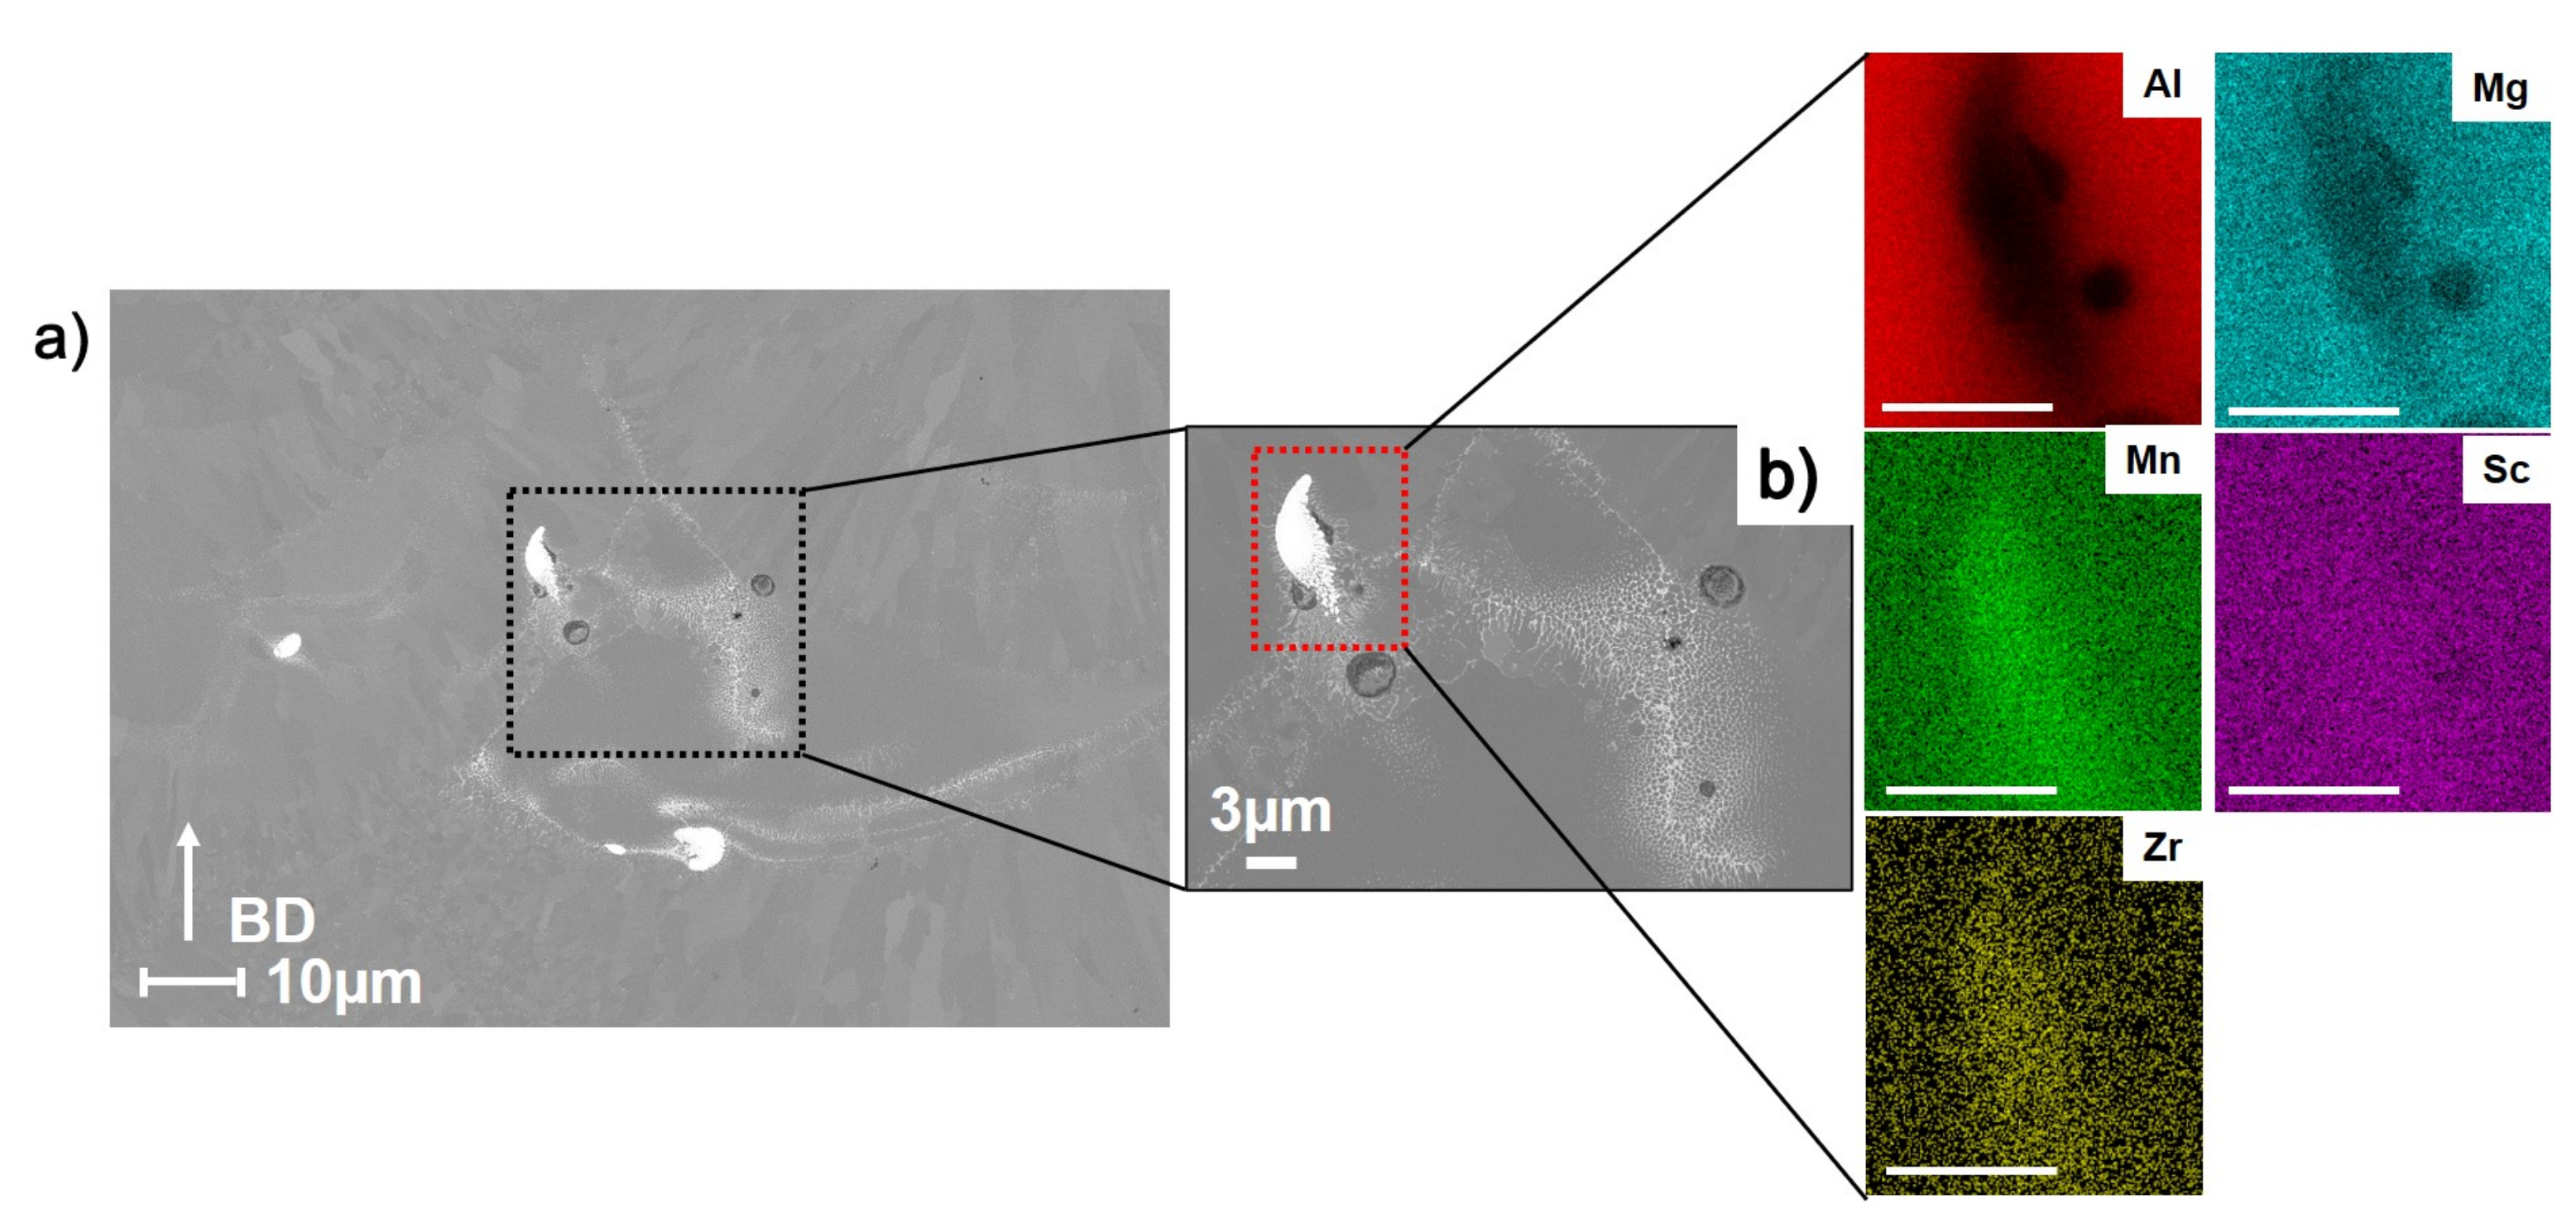
3.4. Microstructure in As-Printed and Peak-Aged Condition

Freshly polished samples were introduced in as-printed and peak-aged conditions (598 K for 4 h) in the scanning electron microscope and the microstructural features were studied under back-scattered mode to detect grain boundary contrast and precipitate contrast. Figure 8 shows the electron microscopy images with two cross sections in as-printed conditions. The microstructure exhibits refined grains, which are sub-micron size at melt pool boundaries and columnar grains at the centre of the melt pool, as seen in the inset image of Figure 8a.
After peak hardening the alloy, some microstructural changes were observed. The grain size and refined grain structure seemed to be intact after this treatment, as can be seen in Figure 9. This meant that recrystallisation of Al-grains did not take place or was relatively insignificant. Secondly, there was some precipitation observed at grain boundaries, which were seen to be rich mostly in Mn, as seen from the two high-resolution EDS maps seen in Figure 9. In some cases, certain enrichment of Mg was also seen in a few precipitates, which could be due to formation of M g 2 S i precipitates during heat treatment. Additionally, Figure 10 refers to another type of precipitate. It was seen that one such category of precipitate, seen to be several µm in size, was enriched in Mn and Zr. This could be A l 3 Z r particles formed during laser processing in the as-printed conditions. It is well known that Zr forms primary precipitates from Al-melt at very high temperatures (around 1000–1100 K depending on composition) and there are thermally stable precipitates after ageing at temperatures as high as 600 K [18].

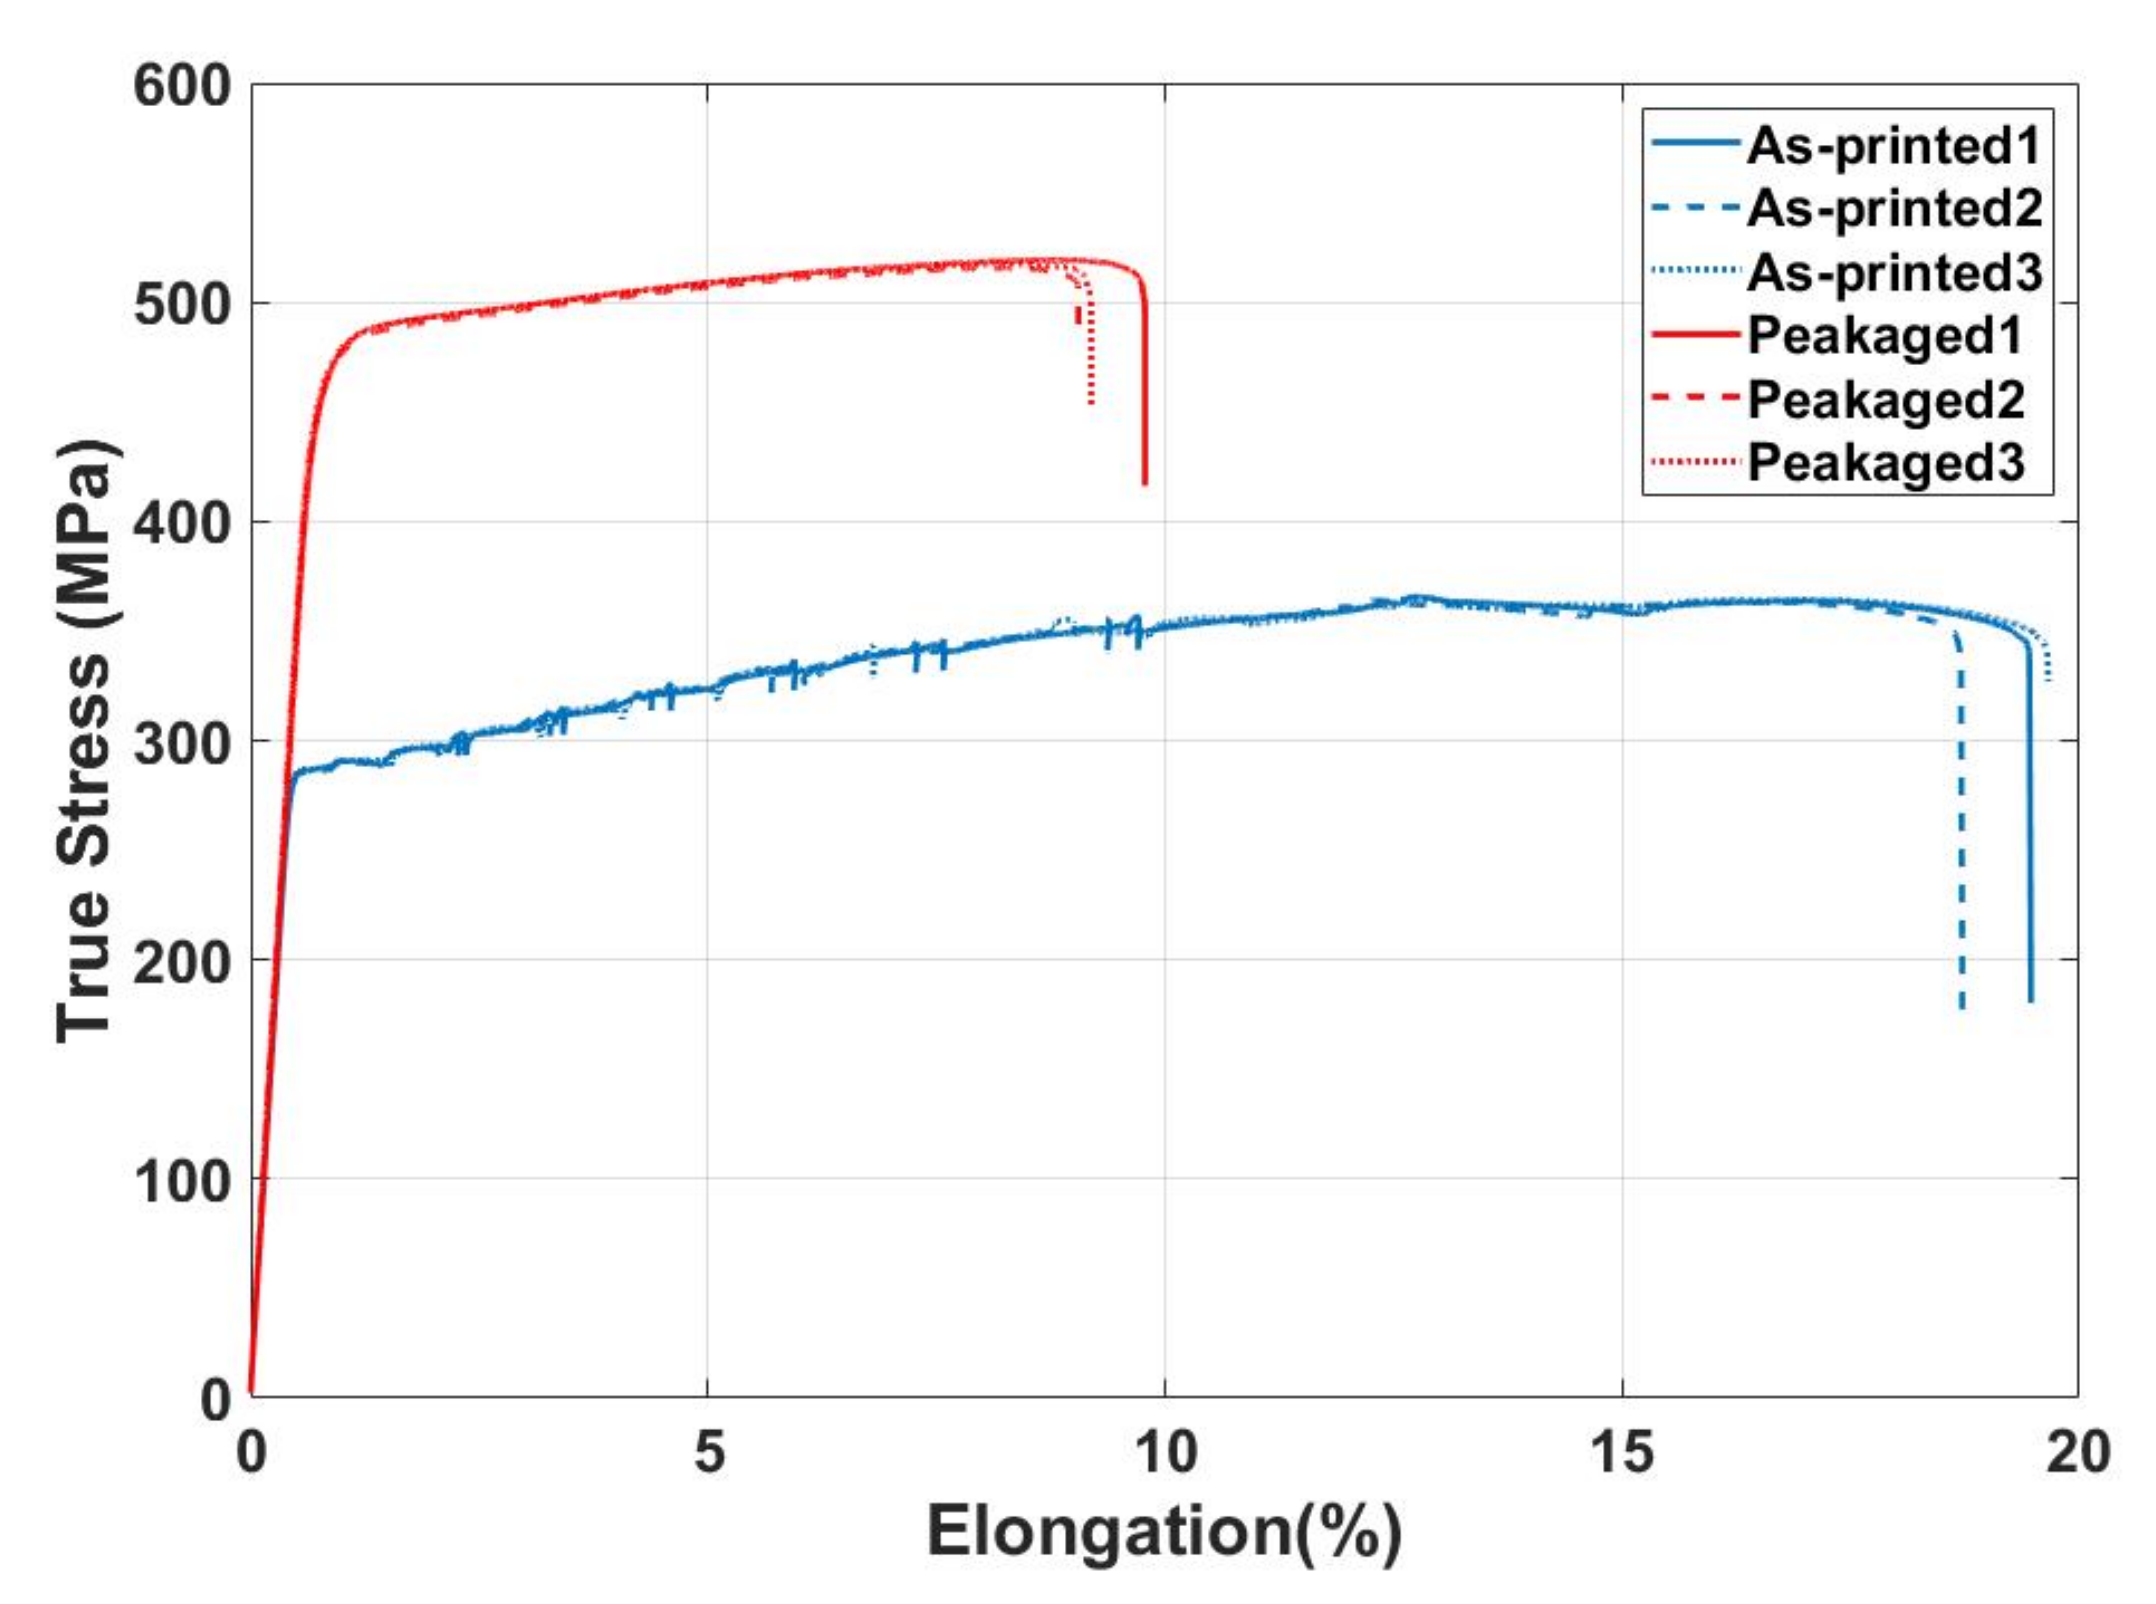
3.5. Tensile Testing

The tensile testing was conducted for as-printed and peak-aged conditions along the X-direction after printing the samples horizontally. All six samples were tested at 0.6 mm/min until failure. The results are shown in the stress-elongation curve in Figure 11 and the summary of mechanical properties in Table 4. The standard deviation for both yield strength and tensile strength were <2 MPa and <0.5%; thus, despite the limited amount of samples (3 each condition), this rendered the results to be good with little variation.

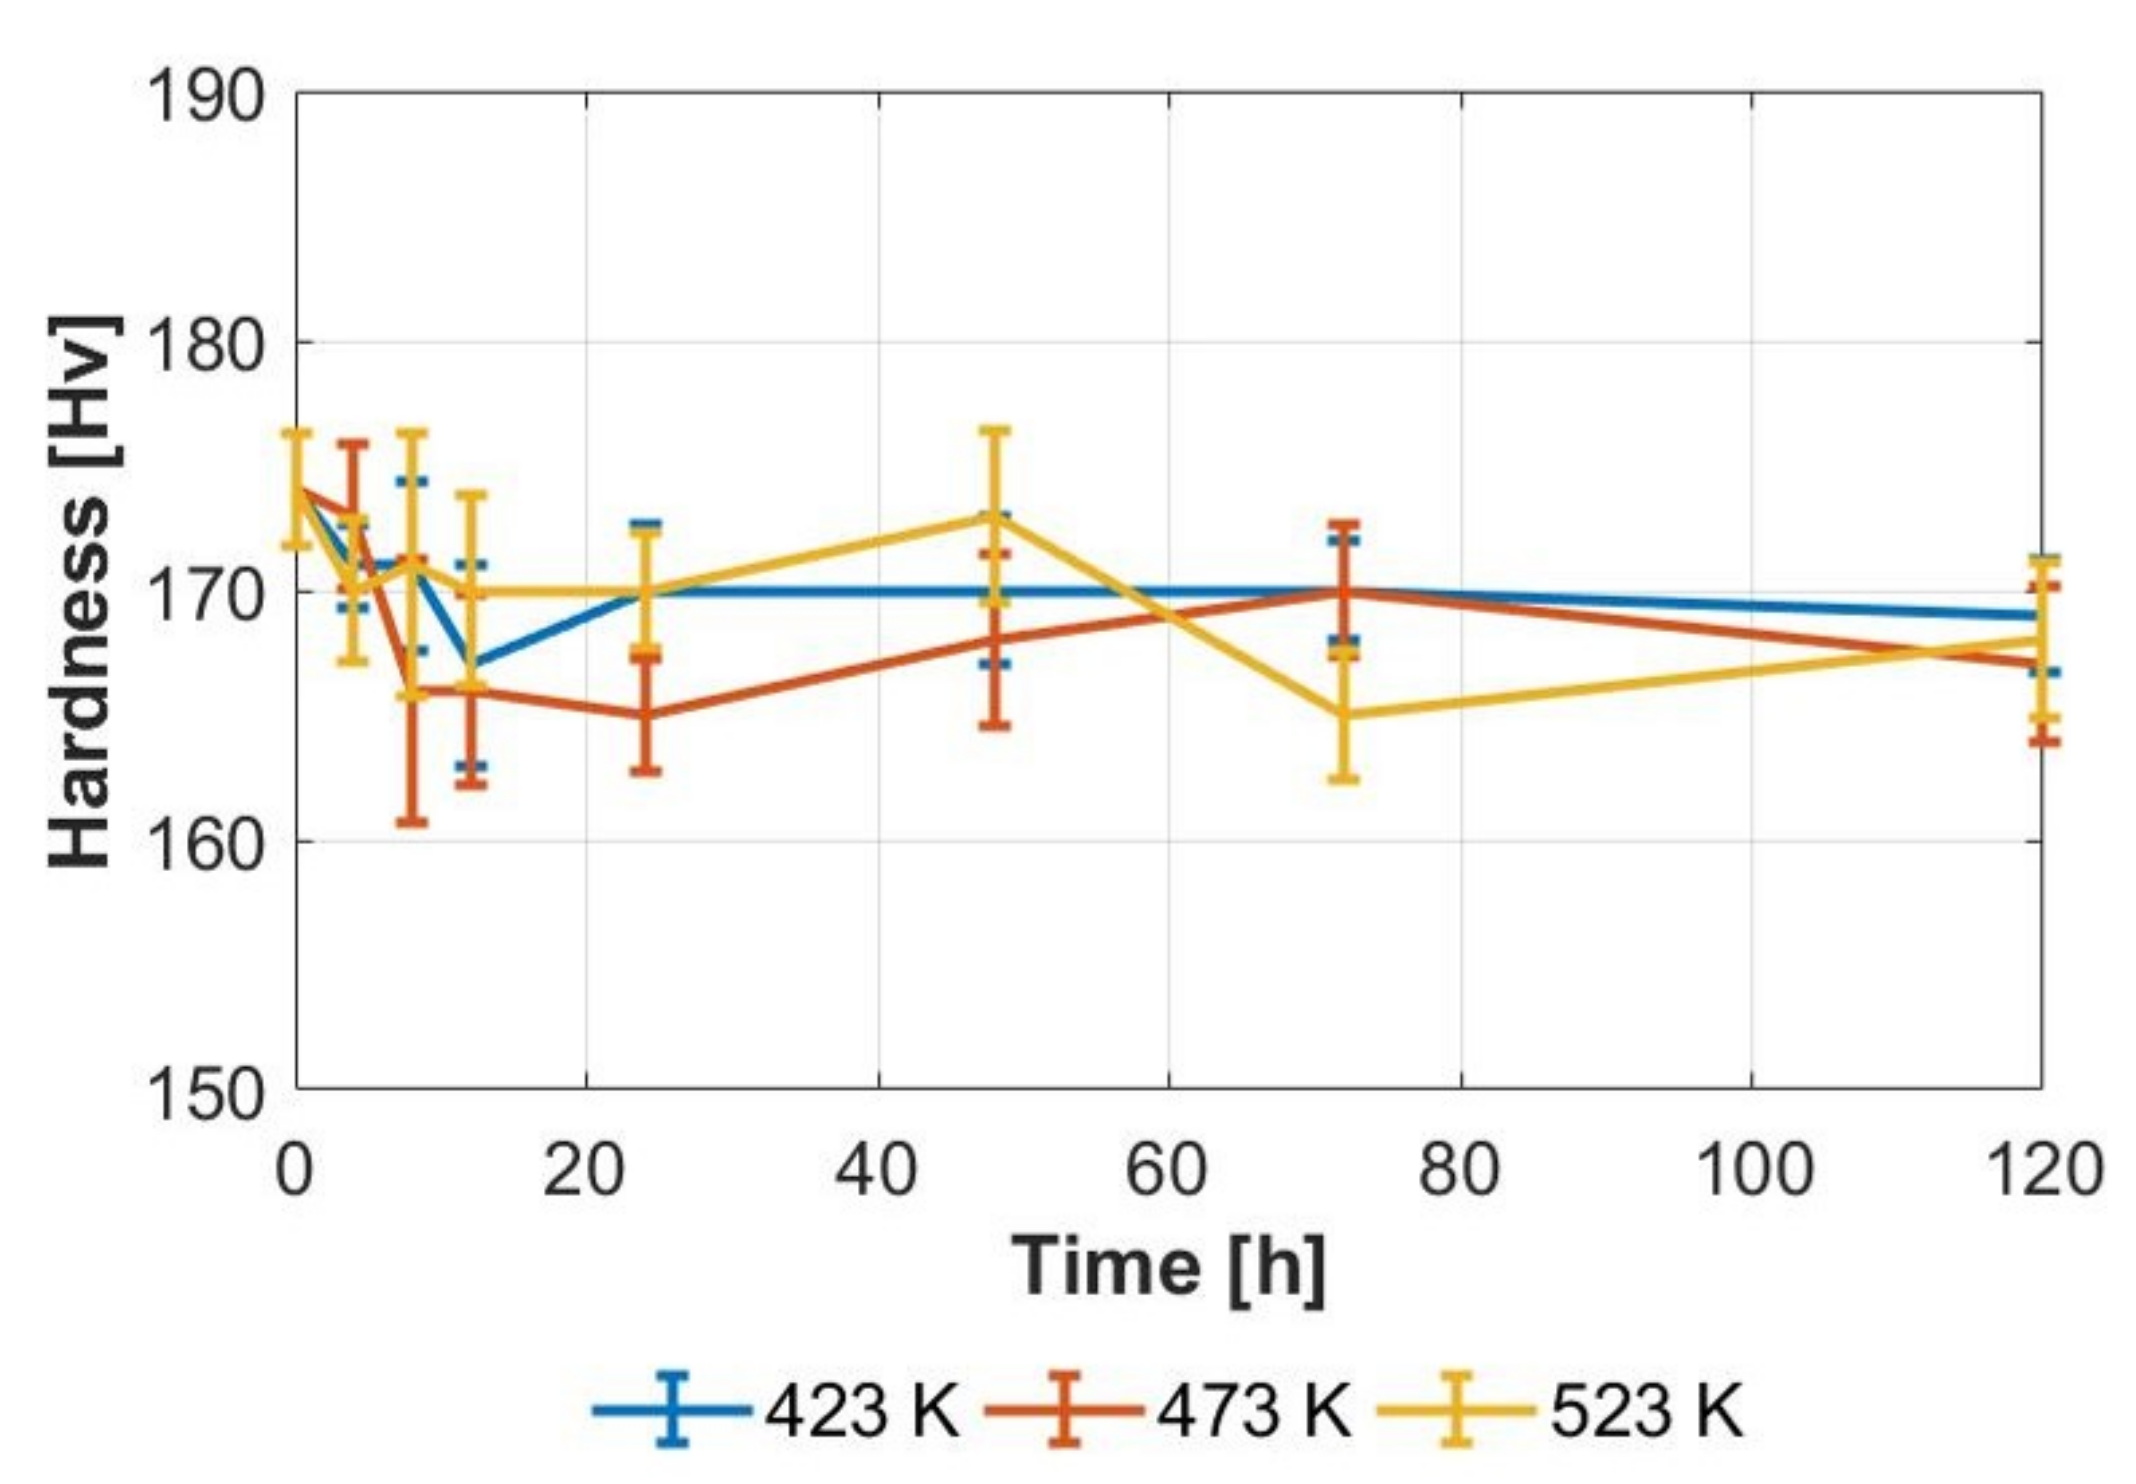
3.6. Microhardness Testing for Secondary Heat Treatments

A secondary heat treatment series was conducted to gauge how the hardness is affected by prolonged exposure at elevated temperatures, to emulate “in-service” conditions for such alloys. Hardness values as a function of ageing time for three different holding temperatures are provided in Figure 12. Based on the previously documented degradation of mechanical properties that Scalmalloy® suffers from through exposure to elevated temperatures, surprisingly no significant decline was highlighted by this experiment. A decline of hardness was measured; however, it is noted that the decreases in hardness for the longer exposure times are within the respective standard deviations of previous measurements leading up to 120 h.

4. Discussion

Al-Mg-Sc-Zr alloy (Scalmalloy®) is a great example of an Al alloy tailored for LB-PBF processing. Although Al-Mg alloys are susceptible to solidification cracking due to segregation of Mg during solidification [24,25], this has been shown to be treated efficiently with A l 3 ( S c , Z r ) cubic particles formed during solidification, which act as nucleants and thus help in refining Al grains and avoiding solidification cracking [7,26]. This method not only creates a printable alloy, it also provides for isotropic properties along both X- and Z-loading directions of printing. In this study, it has been shown that a rapid and systematic design of the experimental approach for achieving full density could be beneficial while identifying good density (>99.5%) and thus consistent mechanical properties. Upon checking the defects with an optical microscope, a generic lack of fusion or gas pores was observed, which has been shown in the literature for the LB-PBF process [2,27]. The microhardness testing was conducted to establish a peak hardness condition in the first heat treatment and it was summarised that 598 K for 4 h was chosen as the peak hardness value based on results and supported by the literature [5,26]. The electron microscopy results were consistent with as-printed microstructure showing bi-modal grain structure, having equiaxed refined grains at melt pool boundaries and longer grains in the centre of melt pools, as shown in Figure 8. In the peak-aged condition, grain boundary precipitates mostly containing Mn were observed. Another interesting observation was the presence of Zr- and Mn-containing precipitates in the peak-aged condition. It is suggested that these might be Zr containing A l 3 Z r primary particles forming from the molten Al during the printing process. Figure 13 shows that primary A l 3 Z r particles (called Al3X or Al3ZR_D023) start to form around approximately 1080 K during equilibrium solidification. Although LB-PBF processing is a non-equilibrium process, such solidification simulations are good indicators to explain the formation of certain equilibrium particles. These A l 3 Z r particles are usually quite resistant to coarsening in their stable form and thus, they can stay in the alloy even after direct ageing, which could explain the reason for finding them in SEM imaging. Similar precipitation was not observed in the as-printed sample.
The tensile testing results were also consistent with the literature values. The as-printed specimen showed dynamic strain ageing, which is suggested to come from the Portevin–Le Chatelier effect [28,29]. It is explained when solute atoms diffuse around dislocations and slow down dislocation motion, leading to negative strain-rate sensitivity (nSRS) as seen in Figure 11. This effect can lead to material instabilities. The effect was observed in all the as-printed specimens whereas it was not observed in the heat-treated specimens. The heat-treated specimens showed high strength along with good ductility. A summary shown in Table 5 discusses the variation in properties of the same alloy, resulting from the use of different processing parameters. This highlights the need for such a consistent strategy while qualifying materials for different LB-PBF systems. It is seen that different systems could mean that laser energy density between 38 J/mm 3 to 267 J/mm 3 could be needed to achieve fully dense samples. However, the peak hardened samples perform similarly. Secondly, when comparing the peak hardening response from this study to [26], it is seen that some difference is observed in heat-treated properties. It is seen that whereas the peak hardening response in [26] was recommended at 598 K or 623 K for 4 h, this study recommends 573 K 8 h, 598 K 4 h. Other authors have recommended different ageing times for peak hardness in Al-Mg-Sc based alloys; [8] recommends between 573 K and 623 K for 4 to 12 h, while [30] recommends a two-step ageing treatment of 573 K 3 h + 633 K 4 h for peak hardening. As seen in Figure 7, at 623 K the onset of hardening was quick and peak hardness was achieved within 30 min, and then the properties started to deteriorate after further ageing.
The secondary heat treatments conducted on these samples were performed on the presumption that the A l 3 ( S c , Z r ) precipitates mostly responsible for hardening in the alloys are not resistant to coarsening at temperatures as high as 523 K. As reported by [19], all the mechanical properties for Scalmalloy® fall sharply after 373 K. Hence, secondary ageing tests were conducted at temperatures between 423 and 523 K for 0 to 120 h in order to record this drop. Due to the small cubes used for this treatment, microhardness testing was seen as a viable method to record the drop in mechanical properties instead of tensile results. This was then compared with a benchmark of conventional Al alloys and some LB-PBF Al alloys, as shown in Figure 14. It was seen that Scalmalloy® is expected to drop to 78 MPa at 523 K from 490 MPa at 297 K. This means that there is approximately an 86% drop in ultimate tensile strength. However, during the ageing performed up to 120 h, the hardness values went from 172 HV to 167 HV, which is a significantly lower drop than expected. It is thought that this could be happening due to the short ageing times used. It is possible that the tests mentioned are representative for several thousand hours before reporting these mechanical properties and thus, similar tests may need to be conducted to validate such values. Thus, it is suggested that at least 2000–3000 h of ageing would reveal actual high temperature properties, because that will lead to higher deterioration. Secondly, if the tensile tests are conducted at high temperature as well, then the tensile deformation would produce different results than hardness testing performed at room temperature on samples that were heat treated for the same duration before. This is due to the simple fact that high temperature activates diffusion of elements by several orders of magnitude [34], thus changing the mechanical properties significantly. Thus, it is suggested to use a longer curing cycle to see hardness deterioration combined with actual high temperature tensile testing to show high-temperature properties of these alloys.

5. Conclusions

In this study, it has been shown that Al-Mg-Sc-Zr (Scalmalloy®) is printable in an EOS M100 machine with high relative density (99.5% density). After conducting heat treatments to establish peak hardness, it was seen that the hardening behaviour was in agreement with the literature. The peak-hardened condition of 598 K for 4 h was chosen where average hardness of 172 HV0.3 was observed. Tensile samples and electron microscopy revealed similar results as reported in the literature, thus verifying the performance of the alloy using this particular AM machine. Yield and tensile strength of 468 MPa and 517 MPa, respectively, were reported in peak-hardened condition. This approach of following a design of experiments for obtaining full density, combined with a systematic approach to develop heat treated properties, is deemed good when qualifying new alloys for LB-PBF systems where the processing parameters or regions of high density may be unknown. Additionally, thermal stability results of the alloy after peak hardening were explored where the results were seen to be inconclusive. The reason for the same was attributed to the lower amount of ageing time that was used (120 h) and different mechanical responses with in-situ or ex-situ testing of mechanical properties. The authors suggest performing at least 2000–3000 h of ageing at low temperatures (423–523 K) along with high-temperature tensile testing in order to establish these properties close to ASM standards.

Author Contributions

Conceptualisation, B.M. and A.S.; introduction and background study, A.S.; methodology and sample preparation, B.M. and A.S.; formal analysis, B.M. and A.S.; supervision B.M. and L.N.; funding acquisition, L.N. All authors have read and agreed to the published version of the manuscript.

Funding

The work was conducted in the framework of the Centre for Additive Manufacturing—Metal (CAM2) and project ALL-Light (part of the LIGHTer Innovation Programme), supported by the Swedish Governmental Agency of Innovation Systems (VINNOVA). The authors also acknowledge Chalmers Production Area of Advance for their support.

Acknowledgments

The study has been performed in close collaboration with Höganäs AB, Sweden. The authors would like to acknowledge Sven Bengtsson at Höganäs AB for conducting the tensile tests and Tea Bertilsson and Dmitri Riabov for conducting ICP-AES tests. Ola Lyckfeldt from RISE, Mölndal, is acknowledged for conducting laser diffraction for powder size distribution analysis.

Conflicts of Interest

The authors declare no conflict of interest.

References

  1. Gibson, I.; Rosen, D.; Stucker, B.; Khorasani, M. Additive Manufacturing Technologies; Springer Nature: Basingstoke, UK, 2021. [Google Scholar]
  2. Aboulkhair, N.T.; Simonelli, M.; Parry, L.; Ashcroft, I.; Tuck, C.; Hague, R. 3D printing of Aluminium alloys: Additive Manufacturing of Aluminium alloys using selective laser melting. Prog. Mater. Sci. 2019, 106, 100578. [Google Scholar] [CrossRef]
  3. Zhang, J.; Song, B.; Wei, Q.; Bourell, D.; Shi, Y. A review of selective laser melting of aluminum alloys: Processing, microstructure, property and developing trends. J. Mater. Sci. Technol. 2019, 35, 270–284. [Google Scholar] [CrossRef]
  4. Olakanmi, E.O.; Cochrane, R.F.; Dalgarno, K.W. A review on selective laser sintering/melting (SLS/SLM) of aluminium alloy powders: Processing, microstructure, and properties. Prog. Mater. Sci. 2015, 74, 401–477. [Google Scholar] [CrossRef]
  5. Schmidtke, K.; Palm, F.; Hawkins, A.; Emmelmann, C. Process and mechanical properties: Applicability of a scandium modified Al-alloy for laser additive manufacturing. Phys. Procedia 2011, 12, 369–374. [Google Scholar] [CrossRef] [Green Version]
  6. Spierings, A.B.; Dawson, K.; Heeling, T.; Uggowitzer, P.J.; Schäublin, R.; Palm, F.; Wegener, K. Microstructural features of Sc- and Zr-modified Al-Mg alloys processed by selective laser melting. Mater. Des. 2017, 115, 52–63. [Google Scholar] [CrossRef]
  7. Spierings, A.B.; Dawson, K.; Voegtlin, M.; Palm, F.; Uggowitzer, P.J. Microstructure and mechanical properties of as-processed scandium-modified aluminium using selective laser melting. CIRP Ann. 2016, 65, 213–216. [Google Scholar] [CrossRef]
  8. Li, R.; Chen, H.; Zhu, H.; Wang, M.; Chen, C.; Yuan, T. Effect of aging treatment on the microstructure and mechanical properties of Al-3.02Mg-0.2Sc-0.1Zr alloy printed by selective laser melting. Mater. Des. 2019, 168, 107668. [Google Scholar] [CrossRef]
  9. Knipling, K.E.; Karnesky, R.A.; Lee, C.P.; Dunand, D.C.; Seidman, D.N. Precipitation evolution in Al–0.1Sc, Al–0.1Zr and Al–0.1Sc–0.1Zr (at.%) alloys during isochronal aging. Acta Mater. 2010, 58, 5184–5195. [Google Scholar] [CrossRef]
  10. Marquis, E.A.; Seidman, D.N. Nanoscale structural evolution of Al3Sc precipitates in Al(Sc) alloys. Acta Mater. 2001, 49, 1909–1919. [Google Scholar] [CrossRef] [Green Version]
  11. Fuller, C.B.; Murray, J.L.; Seidman, D.N. Temporal evolution of the nanostructure of Al(Sc,Zr) alloys: Part I—Chemical compositions of Al3(Sc1–xZrx) precipitates. Acta Mater. 2005, 53, 5401–5413. [Google Scholar] [CrossRef]
  12. Jia, Q.; Rometsch, P.; Kürnsteiner, P.; Chao, Q.; Huang, A.; Weyland, M.; Bourgeois, L.; Wu, X. Selective laser melting of a high strength AlMnSc alloy: Alloy design and strengthening mechanisms. Acta Mater. 2019, 171, 108–118. [Google Scholar] [CrossRef]
  13. Schimbäck, D.; Mair, P.; Bärtl, M.; Palm, F.; Leichtfried, G.; Mayer, S.; Uggowitzer, P.J.; Pogatscher, S. Alloy design strategy for microstructural-tailored scandium-modified aluminium alloys for additive manufacturing. Scr. Mater. 2022, 207, 114277. [Google Scholar] [CrossRef]
  14. Thapliyal, S.; Komarasamy, M.; Shukla, S.; Zhou, L.; Hyer, H.; Park, S.; Sohn, Y.; Mishra, R.S. An integrated computational materials engineering-anchored closed-loop method for design of aluminum alloys for additive manufacturing. Materialia 2020, 9, 100574. [Google Scholar] [CrossRef]
  15. Zhou, L.; Pan, H.; Hyer, H.; Park, S.; Bai, Y.; McWilliams, B.; Cho, K.; Sohn, Y. Microstructure and tensile property of a novel AlZnMgScZr alloy additively manufactured by gas atomization and laser powder bed fusion. Scr. Mater. 2019, 158, 24–28. [Google Scholar] [CrossRef]
  16. Li, R.; Wang, M.; Yuan, T.; Song, B.; Chen, C.; Zhou, K.; Cao, P. Selective laser melting of a novel Sc and Zr modified Al-6.2Mg alloy: Processing, microstructure, and properties. Powder Technol. 2017, 319, 117–128. [Google Scholar] [CrossRef]
  17. Bi, J.; Lei, Z.; Chen, Y.; Chen, X.; Tian, Z.; Qin, X.; Liang, J.; Zhang, X. Effect of Al3(Sc, Zr) and Mg2Si precipitates on microstructure and tensile properties of selective laser melted Al-14.1Mg-0.47Si-0.31Sc-0.17Zr alloy. Intermetallics 2020, 123, 106822. [Google Scholar] [CrossRef]
  18. Croteau, J.R.; Griffiths, S.; Rossell, M.D.; Leinenbach, C.; Kenel, C.; Jansen, V.; Seidman, D.N.; Dunand, D.C.; Vo, N.Q. Microstructure and mechanical properties of Al-Mg-Zr alloys processed by selective laser melting. Acta Mater. 2018, 153, 35–44. [Google Scholar] [CrossRef]
  19. Plotkowski, A.; Sisco, K.; Bahl, S.; Shyam, A.; Yang, Y.; Allard, L.; Nandwana, P.; Marquez Rossy, A.; Dehoff, R.R. Microstructure and properties of a high temperature Al–Ce–Mn alloy produced by additive manufacturing. Acta Mater. 2020, 196, 595–608. [Google Scholar] [CrossRef]
  20. Leicht, A.; Klement, U.; Hryha, E. Effect of build geometry on the microstructural development of 316L parts produced by additive manufacturing. Mater. Charact. 2018, 143, 137–143. [Google Scholar] [CrossRef]
  21. Jia, Q.; Gu, D. Selective laser melting additive manufacturing of Inconel 718 superalloy parts: Densification, microstructure and properties. J. Alloys Compd. 2014, 585, 713–721. [Google Scholar] [CrossRef]
  22. Thijs, L.; Verhaeghe, F.; Craeghs, T.; Van Humbeeck, J.; Kruth, J.P. A study of the microstructural evolution during selective laser melting of Ti–6Al–4V. Acta Mater. 2010, 58, 3303–3312. [Google Scholar] [CrossRef]
  23. Diegel, O.; Nordin, A.; Motte, D. A Practical Guide to Design for Additive Manufacturing; Springer: Singapore, 2020. [Google Scholar]
  24. Kou, S. A criterion for cracking during solidification. Acta Mater. 2015, 88, 366–374. [Google Scholar] [CrossRef]
  25. Yoon, J.W. Effect of Mg content on solidification cracking susceptibility of the Al-Mg laser welds. Int. J. KWS 2001, 1, 63–70. [Google Scholar]
  26. Spierings, A.B.; Dawson, K.; Kern, K.; Palm, F.; Wegener, K. SLM-processed Sc- and Zr- modified Al-Mg alloy: Mechanical properties and microstructural effects of heat treatment. Mater. Sci. Eng. A 2017, 701, 264–273. [Google Scholar] [CrossRef]
  27. DebRoy, T.; Wei, H.L.; Zuback, J.S.; Mukherjee, T.; Elmer, J.W.; Milewski, J.O.; Beese, A.M.; Wilson-Heid, A.; De, A.; Zhang, W. Additive manufacturing of metallic components–Process, structure and properties. Prog. Mater. Sci. 2018, 92, 112–224. [Google Scholar] [CrossRef]
  28. Curtin, W.A.; Olmsted, D.L.; Hector, L.G. A predictive mechanism for dynamic strain ageing in aluminium-magnesium alloys. Nat. Mater. 2006, 5, 875–880. [Google Scholar] [CrossRef]
  29. Matsuura, K.; Nishiyama, T.; Koda, S. Portevin-Le Chatlier Effect in Aluminium-Magnesium Alloys. Trans. Jpn. Inst. Met. 1969, 10, 429–436. [Google Scholar] [CrossRef] [Green Version]
  30. Churyumov, A.Y.; Pozdniakov, A.V.; Prosviryakov, A.S.; Loginova, I.S.; Daubarayte, D.K.; Ryabov, D.K.; Korolev, V.A.; Solonin, A.N.; Pavlov, M.D.; Valchuk, S.V. Microstructure and mechanical properties of a novel selective laser melted Al–Mg alloy with low Sc content. Mater. Res. Express 2019, 6, 126595. [Google Scholar] [CrossRef]
  31. Spierings, A.B.; Dawson, K.; Uggowitzer, P.J.; Wegener, K. Influence of SLM scan-speed on microstructure, precipitation of Al3Sc particles and mechanical properties in Sc- and Zr-modified Al-Mg alloys. Mater. Des. 2018, 140, 134–143. [Google Scholar] [CrossRef]
  32. Kuo, C.N.; Peng, P.C.; Liu, D.H.; Chao, C.Y. Microstructure Evolution and Mechanical Property Response of 3D-Printed Scalmalloy with Different Heat-Treatment Times at 325C. Metals 2021, 11, 555. [Google Scholar] [CrossRef]
  33. Additive Manufacturing Service Provider|APWORKS|Germany. Available online: https://www.apworks.de/ (accessed on 12 October 2021).
  34. Du, Y.; Chang, Y.A.; Huang, B.; Gong, W.; Jin, Z.; Xu, H.; Xie, F.Y. Diffusion coefficients of some solutes in fcc and liquid Al: Critical evaluation and correlation. Mater. Sci. Eng. A 2003, 363, 104–151. [Google Scholar] [CrossRef]
  35. ASM International. Wrought Products. In Aluminum and Aluminum Alloys; Davis, J.R., Ed.; ASM International: Materials Park, OH, USA, 1993; pp. 76–78. [Google Scholar]
  36. Uzan, N.E.; Shneck, R.; Yeheskel, O.; Frage, N. High-temperature mechanical properties of AlSi10Mg specimens fabricated by additive manufacturing using selective laser melting technologies. Addit. Manuf. 2018, 24, 257–263. [Google Scholar] [CrossRef]
Figure 1. Powder size distribution of Al-Mg-Sc-Zr powder.
Metals 12 00057 g001
Figure 2. Cube design showing the build direction and gas flow direction. The red dotted lines indicate the cutting planes used for sample preparation.
Metals 12 00057 g002
Figure 3. Sketch for final tensile specimen designed as per ISO 6892-1:2019 (all dimensions in mm).
Metals 12 00057 g003
Figure 4. Surface plot showing density as a function of varying laser speed (mm/s) and hatch distance (mm).
Metals 12 00057 g004
Figure 5. Image showing (a) XZ and (b) XY cross sections for full density samples. The average relative density for these samples was recorded to be 99.8%.
Metals 12 00057 g005
Figure 6. Optical microscopy images showing (a) etched sample printed with high energy (low laser speed) with gas pores causing defects, (b) etched sample printed with low energy (high laser speed) with lack of fusion causing defects. Note that the inset images focus on such defects.
Metals 12 00057 g006
Figure 7. Hardness as a function of ageing time for 3 temperatures: 573 K (blue), 598 K (red) and 623 K (yellow) averaged along XY and XZ directions. Error bars show one unit of standard deviation.
Metals 12 00057 g007
Figure 8. Electron microscopy images showing (a) XZ section and (b) XY section of as-printed sample in back-scattered mode. Notice the inset images in (a), which show clear grain refinement at melt pool boundaries.
Metals 12 00057 g008
Figure 9. (a) Electron microscopy images for peak-aged condition (598 K for 4 h). (b) Inset image shows a magnified section where EDX maps were taken and grain boundary precipitation can be observed. The EDX maps show Al, Mn, Mg and Sc as identified elements. It is seen that Mn-enriched precipitates are found at grain boundaries, with some of them possibly rich in Mg. The scale bar for EDS images represents 1 µm length.
Metals 12 00057 g009
Figure 10. (a) Electron microscopy images for peak-aged condition (598 K for 4 h). Very few such precipitates are seen in the sample (b) Inset image shows a magnified section where such precipitate is shown. The EDX maps at the region show Al, Mg, Mn, and Zr as identified elements. It is seen that these precipitates contain Mn and Zr. These could have formed from LB-PBF processing as primary precipitates from melt and may also be present in as-printed samples. The scale bar for EDX images represents 5 µm length.
Metals 12 00057 g010
Figure 11. Tensile testing curve for as-printed (blue) and peak-aged (red) conditions for Al-Mg-Sc-Zr alloy. The curve is represented as an elongation (%) vs. true stress (in MPa) curve.
Metals 12 00057 g011
Figure 12. Hardness as a function of prolonged ageing times for three temperatures: 423 K (blue), 473 K (red) and 523 K (yellow). Error bars show one unit of standard deviation.
Metals 12 00057 g012
Figure 13. (a) One-axis equilibrium for Al-Mg-Sc-Zr alloys indicating the formation of different phases during solidification. (b) Zoomed-in image at low amount of phases to show that A l 3 Z r (named Al3X or A l 3 Z r _ D 023 ) particles are formed as primary particles before all the liquid Al has solidified. Simulation was performed using ThermoCalc2021a with TCAL7 and MOBAL5 databases.
Metals 12 00057 g013
Figure 14. Deterioration of ultimate tensile strength of different conventional Al alloys as compared to AlSi10Mg, Scalmalloy® [19,35,36].
Metals 12 00057 g014
Table 1. Powder size distribution for Scalmalloy® powder used (averaged over five measurements).
D10 (in µm)D50 (in µm)D90 (in µm)
34.148.668.9
Table 2. Chemical composition for Al-Mg-Sc-Zr (Scalmalloy®) alloy in as-received powder form and as-printed condition.
Condition (in wt%)AlMgScZrMnFeSi
As atomisedRem.4.70.70.270.480.120.06
As printedRem.4.30.70.270.480.130.06
Table 3. Processing parameters used for printability study of Al-Mg-Sc-Zr alloy.
Laser PowerLayer ThicknessHatch DistanceLaser Speed
170 W0.03 mm0.1–0.15 mm500–1500 mm/s
Table 4. Summary of tensile properties for Al-Mg-Sc-Zr alloy in as-printed and peak-aged conditions. Values are averaged over three test samples. σ 0.2 and σ U T S represent the yield strength and ultimate tensile strength, respectively. Standard deviation for σ 0.2 = 1.2 MPa, σ U T S = 1.0 MPa and area reduction = 0.23%.
Condition σ 0.2 (MPa) σ UTS (MPa)Reduction in Area (%)
As printed28736418.8
Peak aged4685178.5
Table 5. Summary of tensile properties of Scalmalloy® comparing yield strength (Rp 0.2 ), ultimate tensile strength (R m ) and reduction in area in as-printed and peak-aged conditions.
Rp 0.2 , R m (MPa), Reduction of Area (%) As-PrintedRp 0.2 , R m (MPa), Reduction of Area (%) Peak-AgedProcessing ConditionsReference
280, 415, 15.8453, 530, 10.3Concept Laser M2 machine, optimal energy density 125–150 J/mm 3 , optimum heat treatment at 598 K 4 h or 623 K 4 h[7,26,31]
-520, 530, 20EOS M270 machine, optimum heat treatment 598 K 4 h[5]
286.9, - , 18.4455.8, - , 10.3Renishaw AM400 machine, optimal energy density 266.7 J/mm 3 , optimum heat treatment 598 K 4 h[32]
-480, 520, 13-[33]
287, 364, 18.8468, 517, 8.5EOS M100 machine, optimal energy density 37.8 J/mm 3 , optimum heat treatment 598 K 4 hThis work
Publisher’s Note: MDPI stays neutral with regard to jurisdictional claims in published maps and institutional affiliations.

