Abstract
The current paper aimed to study the impact properties of additively manufactured maraging steel (1.2709) using laser powder bed fusion (PBF-L) processing. The specimens were fabricated using 3D Systems ProX 300 equipment under constant specific power input, or Andrew number. The interactions between the build strategy and parameters such as hatch spacing and scan speed was, and the impact strength and fracture were investigated. The impact energy anisotropy was also investigated in parallel and perpendicular to the build direction. Instrumented impact testing was performed, and the fractography supported that the fusion zone geometry dictated the fracture behavior. The influence from gaseous elements such as nitrogen, oxygen, and hydrogen was found insignificant at the levels found in the printed material.
1. Introduction
1.1. Additive Manufacturing Thermal Processing
Additive manufacturing (AM) is capable of manufacturing parts, products, and assemblies with complex geometries and a great degree of design freedom [1]. Maraging steels are commonly used in aerospace and tooling industries due to the mechanical properties and the AM process offers suitable capabilities for the limited series size and necessary geometry capability [2]
AM processed materials may display greater strength, but this may be associated with a reduction of ductility and toughness [3]. AM processing such as selective laser melting (SLM) of maraging steels results in a martensitic matrix [2]. In SLM processing, the metal powder is spread in a layer with a certain thickness or build-height, typically 30–50 μm. The layer thickness significantly impacts porosity and toughness. [4]. Oxidation of the material during SLM processing is managed by allowing an inert gas to flow over the powder bed such as argon and nitrogen [5]. The ability to form a dense material has been studied by, for instance, Ciurana et al. [6] and De Souza et al. [7], where the definition of volumetric specific energy or Andrew number, was used. A minimum value of the Andrew number is required to generate a dense material depending on the alloy composition.
The Andrew number combines laser power, P, scan speed, v, hatch spacing, h, and build height, into a characteristic measure, as:
1.2. Scan Strategies
The Andrew number and the associated process parameters are necessary parameters to generate an internally sound product, but do not constitute a sufficient condition due to the laser material interactions as well as a strong influence from the thermal history of the previously built layers [8] and interlayer bonding [9]. The selection of beam paths or scan strategy controls the quality of the part, influences the tensile properties, surface finish, and microstructure [10]. There are many different strategies possible and relevant to the current study, which include:
- Chessboard scan strategy: The print area is divided into smaller square regions, scanned in a sequence with a “white square” scanned first, followed by ”black squares” (Figure 1a) [11]. This is similar to the island strategy, but results in a more homogeneous bed heating [10].
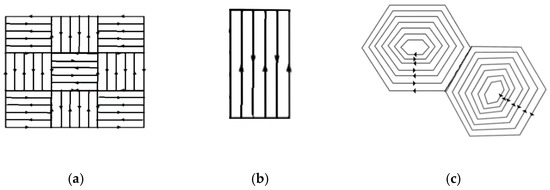 Figure 1. Scan strategies with (a) chessboard scanning strategy, (b) stripes scanning strategy, and (c) hexagonal scanning strategy.
 - Stripes scan strategy: The scan pattern consists of a “band” of scan lines with the freedom of an interlayer rotation of 67 or 90 degrees (Figure 1b). Residual stress is commonly lower in the chessboard strategy compared to the stripes scanning strategy, but results in a higher density for higher hatch distance and higher degree interlayer rotation, but may result in higher surface roughness compared to the chessboard scan strategy, but lesser than the hexagonal scan strategy [10].
- Hexagonal scan strategy: Hexagonal scan has the option of scanning inside-out or outside-in (Figure 1c). The hexagonal scan strategy typically results in a higher porosity compared to the stripes and chessboard scan strategy [10].
1.3. Impurities in Additive Manufacturing
Maraging steel 1.2709 has a low tendency of quench cracking and typically displays excellent toughness [12]. The matrix lath martensite also increases the sensitivity to the hydrogen embrittlement [13]. The management of hydrogen and oxygen in the AM-process has not been primary development targets, and the powder handling in SLM processing may result in relatively high levels of impurities. Similarly, the protective atmosphere is often nitrogen for SLM processing, and the nitrogen content has been given little focus.
In steel research, there has been a strong research activity bringing down the oxygen content, both dissolved and in the form of non-metallic inclusions, combined with inclusion morphology management [14]. Oxygen is also highly detrimental to toughness and impact strength in welded steel [15] and oxygen levels below 400 ppm are generally required for high strength steel [16]. It should be noted that for low strength steel, a low oxygen content does not necessarily result in high toughness, partially due to the martensite transformation and interactions with the oxygen, especially in welded materials [16]. In the case of maraging steel, a reduction of nitrogen and oxygen dissolved with 40% reduces the number of inclusions by 30%. The reduction in the inclusions and dissolved oxygen and nitrogen increased both ductility and impact energy with up to 40% for levels well below 200 ppm [17].
1.4. Fracture Strengths
Fracture of AM materials is often strongly influenced by pre-existing defects such as unmelted powder particles, splats from spatter, and cavities originating from a lack of fusion between build layers and tracks [4]. These defects commonly occur in the fusion zones between adjacent melt track and between subsequent built layers. In the current paper, the term fusion zone will depict the bonding zone between individual tracks.
The force-displacement behavior during impact testing has a generic appearance, as shown in Figure 2. The curve displays some specific features with the characteristic points identified as [18].
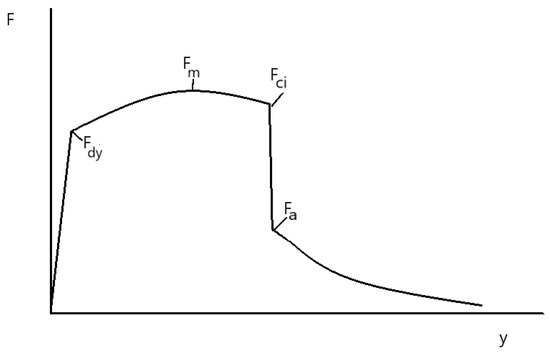
Figure 2.
Schematic illustration of the characteristics of the force–displacement curve for an instrumented Charpy-V tests freely after [18].
- Fdy = dynamic yield force
- Fm = maximum force
- Fci = crack initiation force
- Fa = crack arrest force
The events during the impact test start with an elastic response until the dynamic yield force, Fdy, is reached. Once the material yields, it will begin to harden until the maximum force is reached, Fm. The next event will be a crack initiation. Crack initiation is sometimes preceded by dynamic softening. As such, the crack initiation force, Fci, is the same or lower than the maximum force, Fm. After crack initiation, a crack will form and propagate under stable conditions as the force is reduced from Fci down to Fa, which is the crack arrest point [18].
The gap in knowledge regarding build strategy and its influence on impurities, oxygen, nitrogen, and hydrogen was targeted in the current paper. Impact fracture characteristics are sensitive to defects and impurities. The present study aimed to investigate the impact fracture strength and crack propagation characteristics of maraging steel 1.2709 as well as to establish the level of oxygen, hydrogen, and nitrogen content in this material. It was also investigated as to the influence of the scan pattern on fracture strength and performance as well as if there was any relation to the content of hydrogen, nitrogen, and oxygen.
2. Materials and Methods
2.1. Materials Processing
The studied material, maraging steel 1.2709, Table 1, was printed using the SLM system ProX 300 (3D Systems Corporation, 333 Three D Systems Circle Rock Hill, SC 29730, USA) by 3D Systems. The printing parameter variation was made in such a way that the known conditions for a full density material, based on an optimization exercise, were taken with a specific energy density or Andrew number of 89 J/mm3. The standard build height of 40 µm was also used. The influence of laser fluence was unchanged as a constant laser power of 159 W was used. The variation in the current study was the laser scan speed and the hatch spacing, which were varied in such a way as to keep the Andrew number constant. The scan strategy in the form of a stripe, chessboard, and hexagonal scanning pattern, together with a variation of the interlayer scanning rotation was used as variables with the settings collated in Table 1. The atmosphere used was N2 with an O2 set-point of 100 ppm. The printed shape was a near-net-shape rectangular standard Charpy-V bar (10 mm × 10 mm × 55 mm). The notch was machined.

Table 1.
Material supplier specification and process parameter setting for the experiments made.
2.2. Oxygen and Nitrogen Measurement
Oxygen, nitrogen, and hydrogen content in the printed state was measured using an ELTRA ONH-200 (ELTRA GmbH, Haan, Germany) using nitrogen or helium as the carrier gas depending on the species being analyzed.
2.3. Instrumented Charpy-V Testing
The impact strength properties of the printed samples were characterized. In each family, samples were tested with the impact direction parallel and perpendicular to the build direction to detect any anisotropy.
The V-shaped notch was machined from the printed square bars. The face selected for the notch was based on the build direction (e.g., a surface with its standard parallel or perpendicular to the build direction). For the test in the parallel direction, the impact was made on the side from which the support structure had been removed as tensile stress would develop on the opposite face, which was then in the as-printed state.
The instrumentation consisted of accelerometers and an angular attitude meter. The total energy was established through the angular rotation, and the accelerometer data were normalized against this total energy to provide force–displacement data using a dedicated MATLAB code.
2.4. Fractography
A selection of the fractured samples was studied under a JEOL JSM7001F scanning electron microscope (SEM, JEOL Ltd 3-1-2 Musashino, Akishima, Tokyo, Japan) to investigate the nature of the fracture surfaces.
3. Results and Discussion
3.1. Oxygen and Nitrogen Measurement
The gas content was analyzed from one sample from a processing family and a total of nine different samples were tested. Since all samples were printed simultaneously, the only cause of a variation would be the print strategy and process settings (hatch spacing and scan speed), Table 2.
Table 2.
Process parameter and gas content.
The first observation was that hydrogen appeared not to be an issue as the hydrogen content was below the detection limit of the instrument, and no meaningful results could be obtained.
Oxygen and nitrogen, on the other hand, were possible to measure and showed significant amounts in the printed state (Table 2). Analysis of Variance (ANOVA) analysis was made to identify any statistically significant relationship between build strategy and process parameters. To create a statistically significant model was not possible, and under the current conditions, thus the gas content was deemed independent on build strategy and process parameters. From Table 2, it can, however, be observed that there appears to be a tendency for both the oxygen and nitrogen content to be lower than for the chessboard strategy than for the other two strategies.
3.2. Instrumented Charpy-V Testing
The results from the instrumented Charpy-V testing are collated in Table 3. Figure 3 shows an example of a force–displacement curve. The data were used unfiltered, and the determination was made manually. The idealized force-displacement behavior (Figure 2), was different from the currently studied material. The tested material was relatively brittle and determination of the three first points Fdy, Fm, and Fci, was difficult and uncertain. The crack arrest force, Fa, on the other hand, was more easily determined.
Table 3.
Process parameter setting for the experiments made.
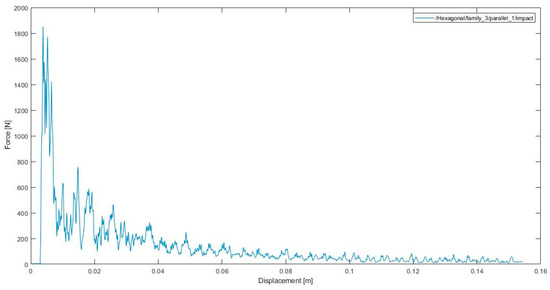
Figure 3.
Force versus displacement for hexagonal family 3 with an impact direction parallel to the build direction.
The chessboard pattern, row 14 (laser power 596.85 mm/s, hatch spacing 0.075 mm, and degree of interlayer rotation 45) in the parallel direction of the impact parallel to the build direction showed the highest impact strength. The maximum force was 15,000 N, which was very different from the other samples. Otherwise, the average impact strength for the stripe strategy was 20 J, and for the chessboard family, it was 29 J. The hexagonal strategy gave an average of 21 J with the settings used. The chessboard strategy thus produced a material with the highest toughness on average.
All the other built strategy samples showed similar behavior for their impact strength of the material. Therefore, the displacement vs. time graph of the highest and lowest impact strength of each built strategy family is shown below, where the maximum load point can be evaluated.
3.3. ANOVA Analysis of the Instrumented Charpy-V Testing
3.3.1. Impact Energy
A regression analysis, together with ANOVA analysis, allowed for a model to be built, as shown in Table 4a. The model was a so-called 2FI model with a linear dependence of the variables and the first-order interaction as a possibility. The Model F-value of 12.88 implied that the model was significant as there was only a 0.01% chance that an F-value this large could occur due to noise. The p-values showed the influence of the individual influence from the parameters. A p-value of less than 0.0500 indicated that the model terms were significant, in this case, A-Hatch spacing, B-Inter layer rotation, C-Build strategy, and E-Direction of impact. In addition to this AB, the interaction between hatch spacing and interlayer rotation was significant.
The Lack of Fit F-value of 4.09 implied that there was a 6.69% chance that a Lack of Fit F-value this large could occur due to noise. This relatively low probability (as values typically greater than 10% would be discriminating for the model) is troubling.
The regression model displayed a quantitative capability as the signal-to-noise ratio, or Adeq Precision was 15.042, which is greater than the critical value of 4, which indicates an adequate signal, even though the R2 was only 0.8111 (Table 4b).
The dataset and the model were also analyzed for Gaussian distribution of the residual around the model, which was also the case. The magnitude of the residuals was also independent of the predicted value. The lack of outliers was established using the Cooke’s distance method. In the process of developing the model, it was also discovered that the best fit was to use the inverse square root transform of the model using the Box–Cox plot method [19].
The resulting model was:
where A: Hatch spacing (mm); B: interlayer rotation (°); C: scan strategy (C(1) = Stripes, (C(2) = Chessboard, C(3) = Hexagonal), E, Impact direction (°); AB is the interaction between A and B (Hatch spacing (mm) and interlayer rotation (°)).
The resulting model showed that the influence of the parameters was similar for the three different scanning strategies. Still, the actual magnitude was shifted with the average impact energy of 20.0 J for the stripes strategy; 28.8 J for the chessboard strategy; and 20.7 J for the hexagonal strategy. Increased hatch spacing improved the impact strength for all cases, and a smaller interlayer rotation was preferred (Figure 4a–c). It should be noted that these experiments were done under a constant Andrew number, meaning that increasing hatch spacing also implies decreasing scan speed under the condition with continuous total heat input. It will, however, affect the heat distribution and thus also alter the martensite transformation as well as the melt boundaries or fusion lines in the build material.
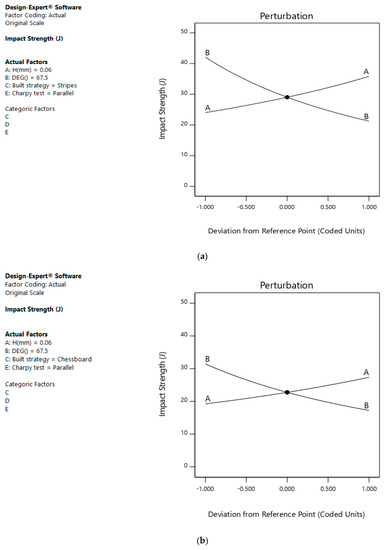
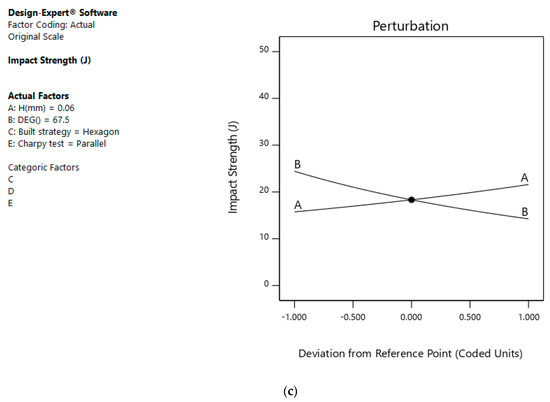
Figure 4.
The influence of the process parameter for the (a) stripes scanning strategy, (b) chessboard strategy, and (c) hexagonal scanning strategy.
The effect of the testing direction revealed that the direction of impact was parallel to the build direction and that the impact energy was slightly higher than when it was perpendicular using the average of overall build strategies (Figure 5). AM results in a layered structure. Impact in the build direction will result in the layer being stretched and a propagating crack will propagate through a layer and then across the fusion line again and again in a series-coupled chain of events. In the case of a perpendicular impact, the crack propagation should propagate simultaneously in the build layer and the fusion zone, especially the more or less continuous path of consecutive zones created by successive fusion zones between each build layer. Assuming that the fusion zone has lower strength than the inside of the weld, which is tougher than the parallel impact, should result in a tougher material with a higher impact strength, which was also the case in the current study. The fusion zone path created between each of the consecutive build layers was thus concluded as the origin of the differences in impact strength.
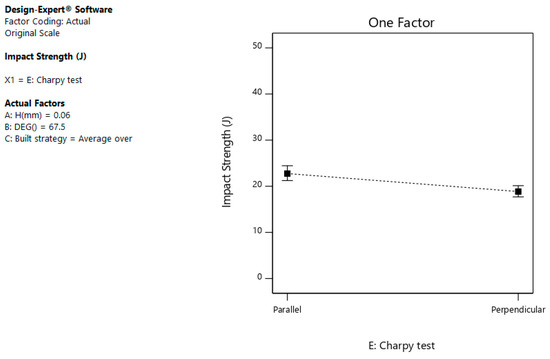
Figure 5.
Variation of impact strength with the direction of impact relative to the build direction.
3.3.2. Forces
The limited number of experiments and the relatively high level of noise made the model building for the different forces on the impact curve difficult. Significant models for the dynamic yield point, maximum force, and crack opening forces could not be generated. However, it was possible to create a model for the crack arrest force (Table 5a,b). The model F-value of 5.89 implied that the model was significant as there was only a 0.49% chance that an F-value this large could occur due to noise. The p-values showed the influence of the individual influence from the parameters. Again, a p-value of less than 0.0500 indicated that the model terms were significant; hence B-Inter layer rotation and C-Build strategy were significant. In addition to this AB, the interaction between hatch spacing and interlayer rotation was near significant, and thus A-Hatch spacing was kept to maintain the model hierarchy.
The Lack of Fit F-value of 1.29 implied that there was a 41.34% chance that a Lack of Fit F-value this large could occur due to noise. The Lack of Fit value was not a low value, but it still validated the Lack of Fit as non-significant, which is a requirement.
The regression model displayed a quantitative capability as the signal-to-noise ratio, or Adeq Precision was 9.2890, which was greater than the critical value of 4, which indicates an adequate signal. A quantitative description was thus achieved, although R2 was only 0.5956. It should also be noted that the predicted R² of 0.3403 was in reasonable agreement with the adjusted R² of 0.4945 (i.e., the difference was less than 0.2), as seen in Table 5b.
The dataset and the model was also analyzed for Gaussian distribution of the residual around the model, which was also the case. The magnitude of the residuals was also independent of the predicted value. The lack of the existence of outliers was established using Cooke’s distance method. In the process of developing the model, it was also discovered that the best fit was to use the inverse square root transform of the model using the Box–Cox plot method, which was the same as for the impact energy [19].
The resulting regression model was
It should be noted that the values were in coded mode for this case where the variables went from −1 to 1 in the investigated range, defined as the coded value = 2 (Actual value—mid-range value)/(range). The average crack arrest force for the different strategies was 854 N for the stripes strategy, 1405 N for the chessboard strategy, and 473 N for the hexagonal strategy.
The stripes build strategy showed a strong dependence on the process parameter A- Hatch spacing and B-Interlayer rotation. It should be noted that A was kept due to hierarchy as the interaction AB was significant. The interlayer rotation effect is illustrated in Figure 6a for the stripes strategy. Here, a 90° interlayer rotation resulted in no dependence on the A-Hatch spacing. With a 45° interlayer rotation, this, on the other hand, resulted in a strong dependence (Figure 6a). The interlayer rotation effect was physically significant for the stripes build strategy (Figure 6b), whereas the effect for the chessboard strategy (Figure 6c) and hexagonal strategy (Figure 6d) was less evident. It is important to note here that the qualitative dependence of the crack arrest force on the process parameters were the same as for that of the impact energy. The analysis of the impact energy suggests that the impact energy was strongly dependent on the geometry of the fusion zone and the crack arrest forces suggest a similar dependence, supporting that the fusion zone is dominant, especially in the regions between each consecutively built layer. Further support for the fact that the fusion zone geometry was dominant was that no such relationship was found for neither hydrogen nor oxygen. Both hydrogen and oxygen are otherwise often regarded as common causes of embrittlement.
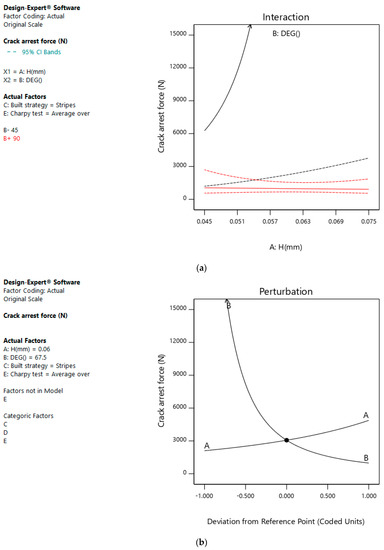
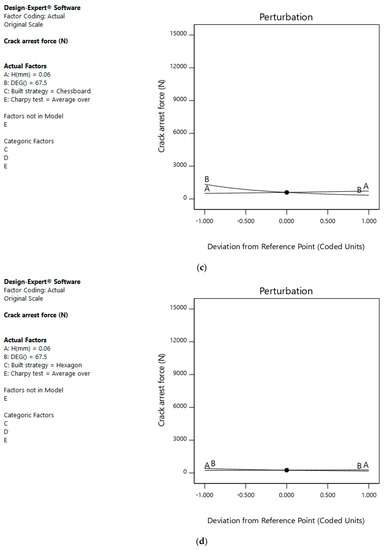
Figure 6.
Process parameters on the crack arrest force. (a) The interaction between A-Hatch spacing and B-Interlayer rotation for the stripes strategy, (b) perturbation plot for the stripes build strategy, (c) perturbation plot for the chessboard strategy, and (d) perturbation plot for the hexagonal scanning strategy.
3.4. Fractography
The differences in crack propagation between the different build strategies were investigated through fractography. It should here be noted that all fractures were macroscopically brittle, which can also be seen in the energy level as most of the tests resulted in being under 27 J. Figure 7a–c shows the fractured surface of a chessboard family 1. This fracture surface shows a mixed-mode fracture on the microscopic level.
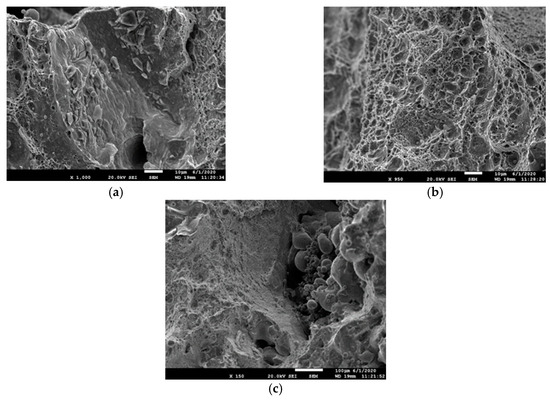
Figure 7.
The fractured surface of the chessboard family 1 (samples 10–12) with (a) oxide impurities, (b) ductile dimples, and (c) unmelted particles, suggesting a lack of fusion.
In Figure 7a, the main feature is a smooth featured surface that is an oxidized surface surrounded by ductile features with ductile ridges and dimples. Dimples are also shown in Figure 7b, displaying an apparent ductile fracture in the matrix. The geometry and attributes correspond to typical defects related to defects in the fusion zone, suggesting a lack of fusion or severe oxidation as a base mechanism. In the fracture, unmelted particles could also be found, supporting the fact that the lack of fusion is the driving element for the crack propagation (Figure 7c).
Figure 8a–c shows the chessboard family 2 displaying a predominantly ductile behavior with dimples (Figure 8a). In the dimples, spherical non-metallic inclusions could be found (Figure 8b) as well as regions with residual oxide scales (Figure 8c).
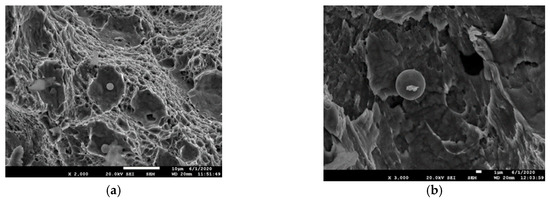
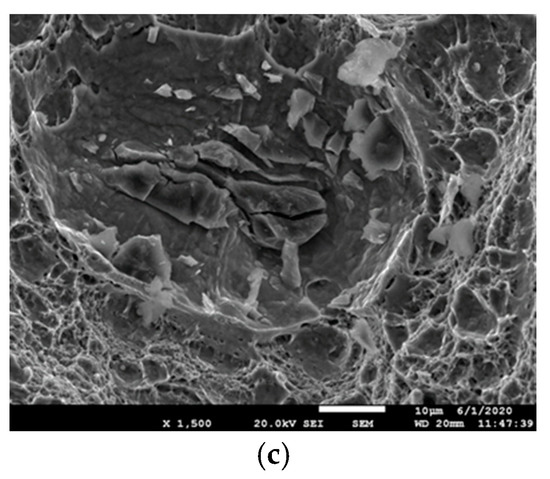
Figure 8.
Fractured surface images of the chessboard family 2 (Samples 13–15) with (a) ductile dimples, (b) oxide inclusions and unmelted particles in a large dimple, and (c) oxide inclusions.
Fracture surfaces from the hexagonal family 1 are shown in Figure 9a–c. The layered structure in Figure 9a shows how the crack propagated along the fusion zone path in between each built layer, (flat regions and then works itself across the printed layer); Figure 9b shows a flat surface with easy crack propagation along the fusion zone; and Figure 9c illustrates the ductile surface at the step where the crack propagates across the built layer. It is important to note here that this type of step is not as exact nor as visible using the chessboard strategy, suggesting that the fusion lines were less continuous and possibly exhibited a more significant tortuosity than for the hexagonal printing strategy. It should also be noted that unmelted particles could also be found in the hexagonal printing strategy.
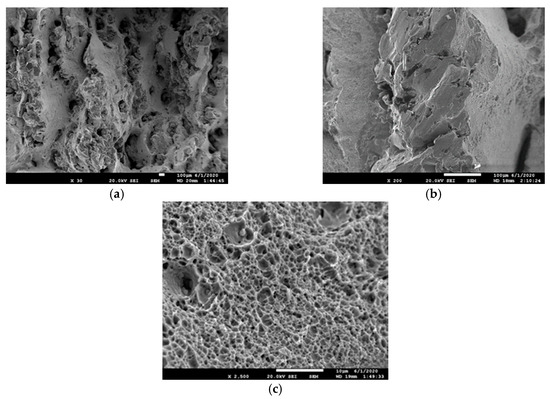
Figure 9.
The fractured surface of the hexagonal family 1 (samples 19–21) with (a) step-like structure with fracture in the fusion zones between different build layers, (b) brittle propagation region along a step, and (c) ductile fracture in the build layer.
Figure 10a–c shows the fracture surfaces for Hexagonal family 2. In Figure 10a, a mixed-mode fracture surface is seen where the brittle region appears similar to a fusion zone failure between each build layer. In Figure 10a, a spherical non-metallic inclusion is also seen. In addition to the ductile ridges in the fusion-zone dimples are visible outside the fusion zone. In the ductile areas with dimples, pore-like features are seen with non-metallic residues; Figure 10b suggests that these were not shrinkage porosity, but rather a hole after a spherical particle had been torn out. No unmelted particles could be seen in this sample, and ductile ridges and dimples with an appearance in Figure 10c dominated the fracture surface.
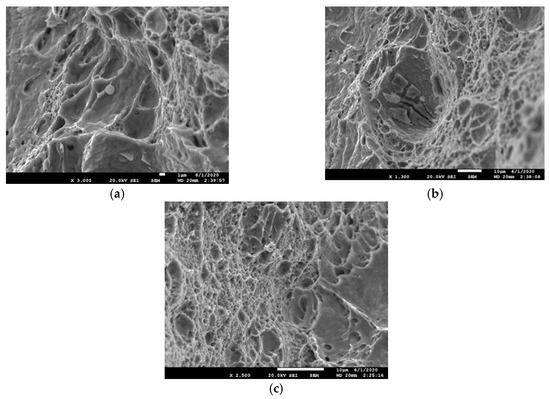
Figure 10.
The fractured surface of the hexagonal family 2 (samples 22–24) with (a) mixed-mode brittle and ductile fracture, (b) oxide residues, and (c) ductile ridges and dimples.
Figure 11a–c shows the fracture surface of the hexagonal family 3, where unmelted particles were found (Figure 11a). Aside from finding the layered fracture (Figure 11b), step-like features were also found, but were not as well-developed in the samples in hexagonal family 1, which had a smaller hatch spacing, but a higher scan speed. In Figure 11b, there was a large secondary crack visible in the center of the picture that could have developed into a step, exposing the fusion zone between layers. The secondary crack did, however, not develop and generate a crack along the fusion zone path. A possible explanation for this is shown in Figure 11c where a bare fusion zone is shown with an appearance resembling dimples. This sample had the lowest scan speed, suggesting that low scan speed promotes bonding in the fusion zone.
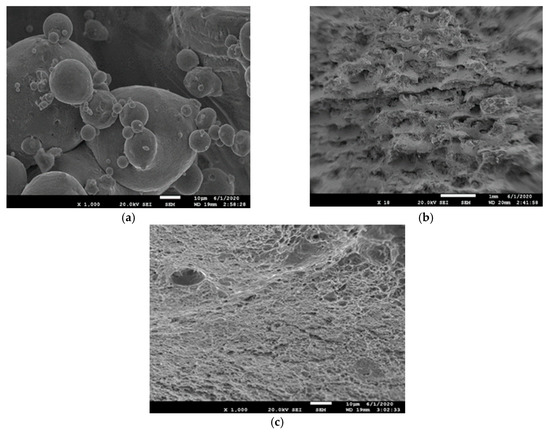
Figure 11.
The fractured surface of the hexagonal family 3 (samples 25–27) with (a) unmelted particles, (b) step-like features with propagation along the fusion zones between each build layer, and (c) dimple like features in the region between fusion zones.
Figure 12a shows the fracture surface of stripes family 3. In Figure 10a, a similar behavior, as above-mentioned, of material processing conditions with unmelted particles, porosity, combined with ductile features such as dimples and ductile ridges was found. Oxide scale could also be detected, as seen in Figure 12b. Furthermore, fusion zone-driven features could be seen, but were not as straightforward as that for the chessboard and the hexagonal scanning strategies families (Figure 12c). The tortuosity of the fusion zone appeared higher visually and may be affected by the interlayer rotation choice made.
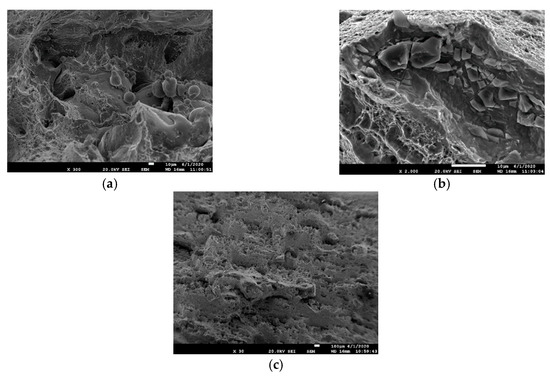
Figure 12.
Stripes family 3 (samples 7–9) with (a) mixed-mode brittle and ductile fracture, (b) oxide scales, and (c) propagation along the fusion zones between each build layer, but with an increased degree of tortuosity and reduced length of propagation along each layer.
In Figure 13a–c, the fractured surface stripes family 2 is shown. In the absence of continuous fusion zones (Figure 13a), larger dimples and well-developed ductile ridges were found (Figure 13b) and the dominating defect appeared as oxides (Figure 13c). There was also a ductile fracture, void nucleation, and some dimples.
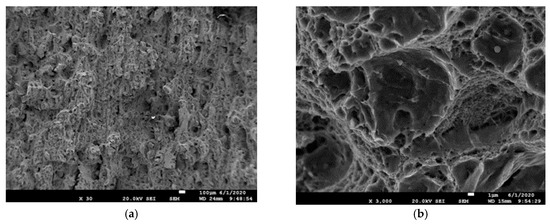
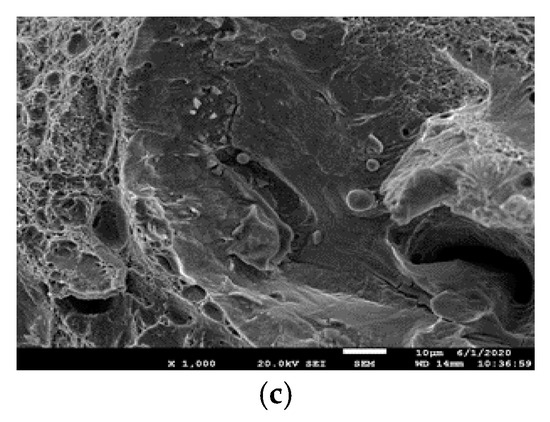
Figure 13.
Stripes family 2 (samples 4–6) with (a) illustrating the absence of continuous propagation along fusion zones, (b) larger dimples and ductile ridges, and (c) oxide inclusions.
A comparison between all these fractures and all the printed materials showed a microscopically ductile behavior. Family 2, for all scanning features with intermediate scan speed and hatch spacing combination, appeared to be more ductile. In terms of failure, it seems as if it was dominated by the geometry of the fusion zone where a more complex or tortuous shape reduced the scale and the possible fracture length of the more brittle elements in the fusion zones. The chessboard offered more fusion-zones as there will be more in-layer fusion zones between the chessboard squares. Similar features also existed in the other families, but it was only in the chessboard family where a significant change in the printing orientation existed as both the stripes family and the hexagonal families provided parallel tracks in the fusion zones between the inlayer regions.
4. Conclusions
In the current study, the impact fracture strength and crack propagation characteristics of maraging steel 1.2709 were investigated.
Gaseous species such as oxygen, hydrogen, and nitrogen were studied. The hydrogen levels were below the detection limits of the equipment and as such, were concluded to be non-significant. Nitrogen levels varied between the different printing strategies and process setting, but no correlation could be established with statistical significance and as such, deemed independent on build strategy. The results for oxygen were similar, but here the chessboard pattern appeared to have slightly lower oxygen content. Still, it was not possible to describe this quantitatively using the process parameters and build strategy.
In terms of impact strength, the three different printing strategies performed differently with the average impact strength for the chessboard strategy being superior to the other strategies. Fractography of the chessboard fracture was different as continuous crack propagation along fusion zones were absent. For both the stripes and the hexagonal strategies, a step-like structure was found, supporting the presence of a more continuous crack path. These steps following the path created by the fusion zone between each built layer. Furthermore, the crack arrest force for the different strategies where the chessboard strategy average crack arrest forces were higher than for the stripes and hexagonal strategies, provides further evidence. These three observations suggest that the chessboard strategy resulted in a more tortuous fusion zone, reducing the mean free path for cracks growing in the fusion zone between the built layers, being the preferred path of crack propagation. For all strategies, the influence of the process parameters was similar where a larger hatch spacing promoted impact strength, and a larger interlayer rotation decreased the impact strength. The fact that all printing strategies showed similar behavior with respect to the process parameters indirectly supports the conclusion that it was the actual printing pattern that was the origin of the superior properties for the chessboard strategy. Based on the fractography, it changed the path of cracking, making the crack path between the build layers less favorable.
Author Contributions
Conceptualization, A.E.W.J.; Methodology, A.C.G.H.S. and H.K.Y.; Printing software and handling; R.S., Equipment instrumentation J.S., Fractography, N.-E.A.; Supervision, A.E.W.J.; Project administration, A.E.W.J. and R.S.; Funding acquisition, R.S. and A.E.W.J. All authors have read and agreed to the published version of the manuscript.
Funding
This work was done under funding from the Knowledge Foundation under the Tool Addict project contract number 20160327 and teaching funding at Jönköping University.
Institutional Review Board Statement
No ethics approval was bnecessary for this study therefor no Institutional Review Board Statement was given nor needed.
Informed Consent Statement
No human subjects were included in the current study.
Data Availability Statement
All data generated are included in the current paper in the tables.
Acknowledgments
The authors are indebted to Höganäs AB for the supply of the maraging steel powder for printing under the framework of the Swedish Arena for Additive Manufacturing.
Conflicts of Interest
The authors declare no conflict of interest.
References
- Box, G.E.P.; Hunter, J.S.; Hunter, W.G. Statistics for Experimenters: Design, Innovation, and Discovery, 2nd ed.; John Wiley and Sons Inc.: Hoboken, NJ, USA, 2005. [Google Scholar]
- Carter, L.N.; Martin, C.; Withers, P.J.; Attallah, M.M. The influence of the laser scan strategy on grain structure and cracking behaviour in SLM powder-bed fabricated nickel superalloy. J. Alloy. Compd. 2014, 615, 338–347. [Google Scholar] [CrossRef]
- Casati, R.; Lemke, J.; Masneri, C.; Vedani, M. Influence of heat treatment condition on properties of 1.2709 maraging steel fabricated by selective laser melting. In European Congress and Exhibition on Powder Metallurgy. European PM Conference Proceedings; The European Powder Metallurgy Association: Shrewsbury, UK, 2016; pp. 1–6. [Google Scholar]
- Ciurana, J.; Hernandez, L.; Delgado, J. Energy density analysis on single tracks formed by selective laser melting with CoCrMo powder material. Int. J. Adv. Manuf. Technol. 2013, 68, 1103–1110. [Google Scholar] [CrossRef]
- Conde, F.F.; Escobar, J.D.; Oliveira, J.P.; Jardini, A.L.; Bose Filho, W.W.; Avila, J.A. Austenite reversion kinetics and stability during tempering of an additively manufactured maraging 300 steel. Addit. Manuf. 2019, 29, 100804. [Google Scholar] [CrossRef]
- Da Costa, E.; Silva, A.L.V. Non-metallic inclusions in steels—Origin and control. J. Mater. Res. Technol. 2018, 7, 283–299. [Google Scholar] [CrossRef]
- De Souza, A.F.; Al-Rubaie, K.S.; Marques, S.; Zluhan, B.; Santos, E.C. Effect of laser speed, layer thickness, and part position on the mechanical properties of maraging 300 parts manufactured by selective laser melting. Mater. Sci. Eng. A 2019, 767, 138425. [Google Scholar] [CrossRef]
- Elmi Hoseini, S.R.; Arabi, H.; Razavizadeh, H. Improvement in mechanical properties of C300 maraging steel by application of VAR process. Vacuum 2008, 82, 521–528. [Google Scholar] [CrossRef]
- Jägle, E.A.; Choi, P.-P.P.; Van Humbeeck, J.; Raabe, D. Precipitation and austenite reversion behavior of a maraging steel produced by selective laser melting. J. Mater. Res. 2014, 29, 2072–2079. [Google Scholar] [CrossRef]
- Jhabvala, J.; Boillat, E.; Antignac, T.; Glardon, R. On the effect of scanning strategies in the selective laser melting process. Virtual Phys. Prototyp. 2010, 5, 99–109. [Google Scholar] [CrossRef]
- Kučerová, L.; Zetková, I.; Jandová, A.; Bystrianský, M. Microstructural characterisation and in-situ straining of additive-manufactured X3NiCoMoTi 18-9-5 maraging steel. Mater. Sci. Eng. A 2019, 750, 70–80. [Google Scholar] [CrossRef]
- Monkova, K.; Zetkova, I.; Kučerová, L.; Zetek, M.; Monka, P.; Daňa, M. Study of 3D printing direction and effects of heat treatment on mechanical properties of MS1 maraging steel. Arch. Appl. Mech. 2019, 89, 791–804. [Google Scholar] [CrossRef]
- Rivalta, F. Effect of the Scanning Strategy on the SLM Produced 18Ni300 Maraging Steel; University of Bologna: Bologna, Italy, 2019. [Google Scholar]
- Sreenivasan, P.R. Instrumented impact testing—Accuracy, reliability and predictability of data. Trans. Indian Inst. Met. 1996, 49, 677–696. [Google Scholar]
- Surian, E.; Trotti, J.; Boniszewski, T. Effect of oxygen content on charpy V-notch toughness in 3% Ni steel SMA weld metal. Weld. J. 1992, 71, 263. [Google Scholar]
- Takata, N.; Nishida, R.; Suzuki, A.; Kobashi, M.; Kato, M. Crystallographic features of microstructure in maraging steel fabricated by selective laser melting. Metals 2018, 8, 440. [Google Scholar] [CrossRef]
- Terashima, S.; Bhadeshia, H.K.D.H. Changes in toughness at low oxygen concentrations in steel weld metals. Sci. Technol. Weld. Join. 2006, 11, 509–516. [Google Scholar] [CrossRef]
- Valente, E.H.; Gundlach, C.; Christiansen, T.L.; Somers, M.A.J. Effect of scanning strategy during selective laser melting on surface topography, porosity, and microstructure of additively manufactured Ti-6Al-4V. Appl. Sci. 2019, 9, 5554. [Google Scholar] [CrossRef]
- Viswanathan, U.K.; Dey, G.K.; Sethumadhavan, V. Effects of austenite reversion during overageing on the mechanical properties of 18 Ni (350) maraging steel. Mater. Sci. Eng. A 2005, 398, 367–372. [Google Scholar] [CrossRef]
Publisher’s Note: MDPI stays neutral with regard to jurisdictional claims in published maps and institutional affiliations. |
© 2020 by the authors. Licensee MDPI, Basel, Switzerland. This article is an open access article distributed under the terms and conditions of the Creative Commons Attribution (CC BY) license (http://creativecommons.org/licenses/by/4.0/).