
Performance Level Affects Full Body Kinematics and Spatiotemporal Parameters in Trail Running—A Field Study


Abstract
:1. Introduction
2. Materials and Methods
2.1. Participants and Experimental Design
- were between 18 and 50 years old,
- had at least 1 year experience in trail running,
- had a minimum training frequency of 2 times per week,
- ran a minimum weekly training volume of 30 km,
- had sustained no injuries in the previous 3 months prior to the study.
2.2. Materials
2.3. Data Analysis
2.4. Statistics
3. Results
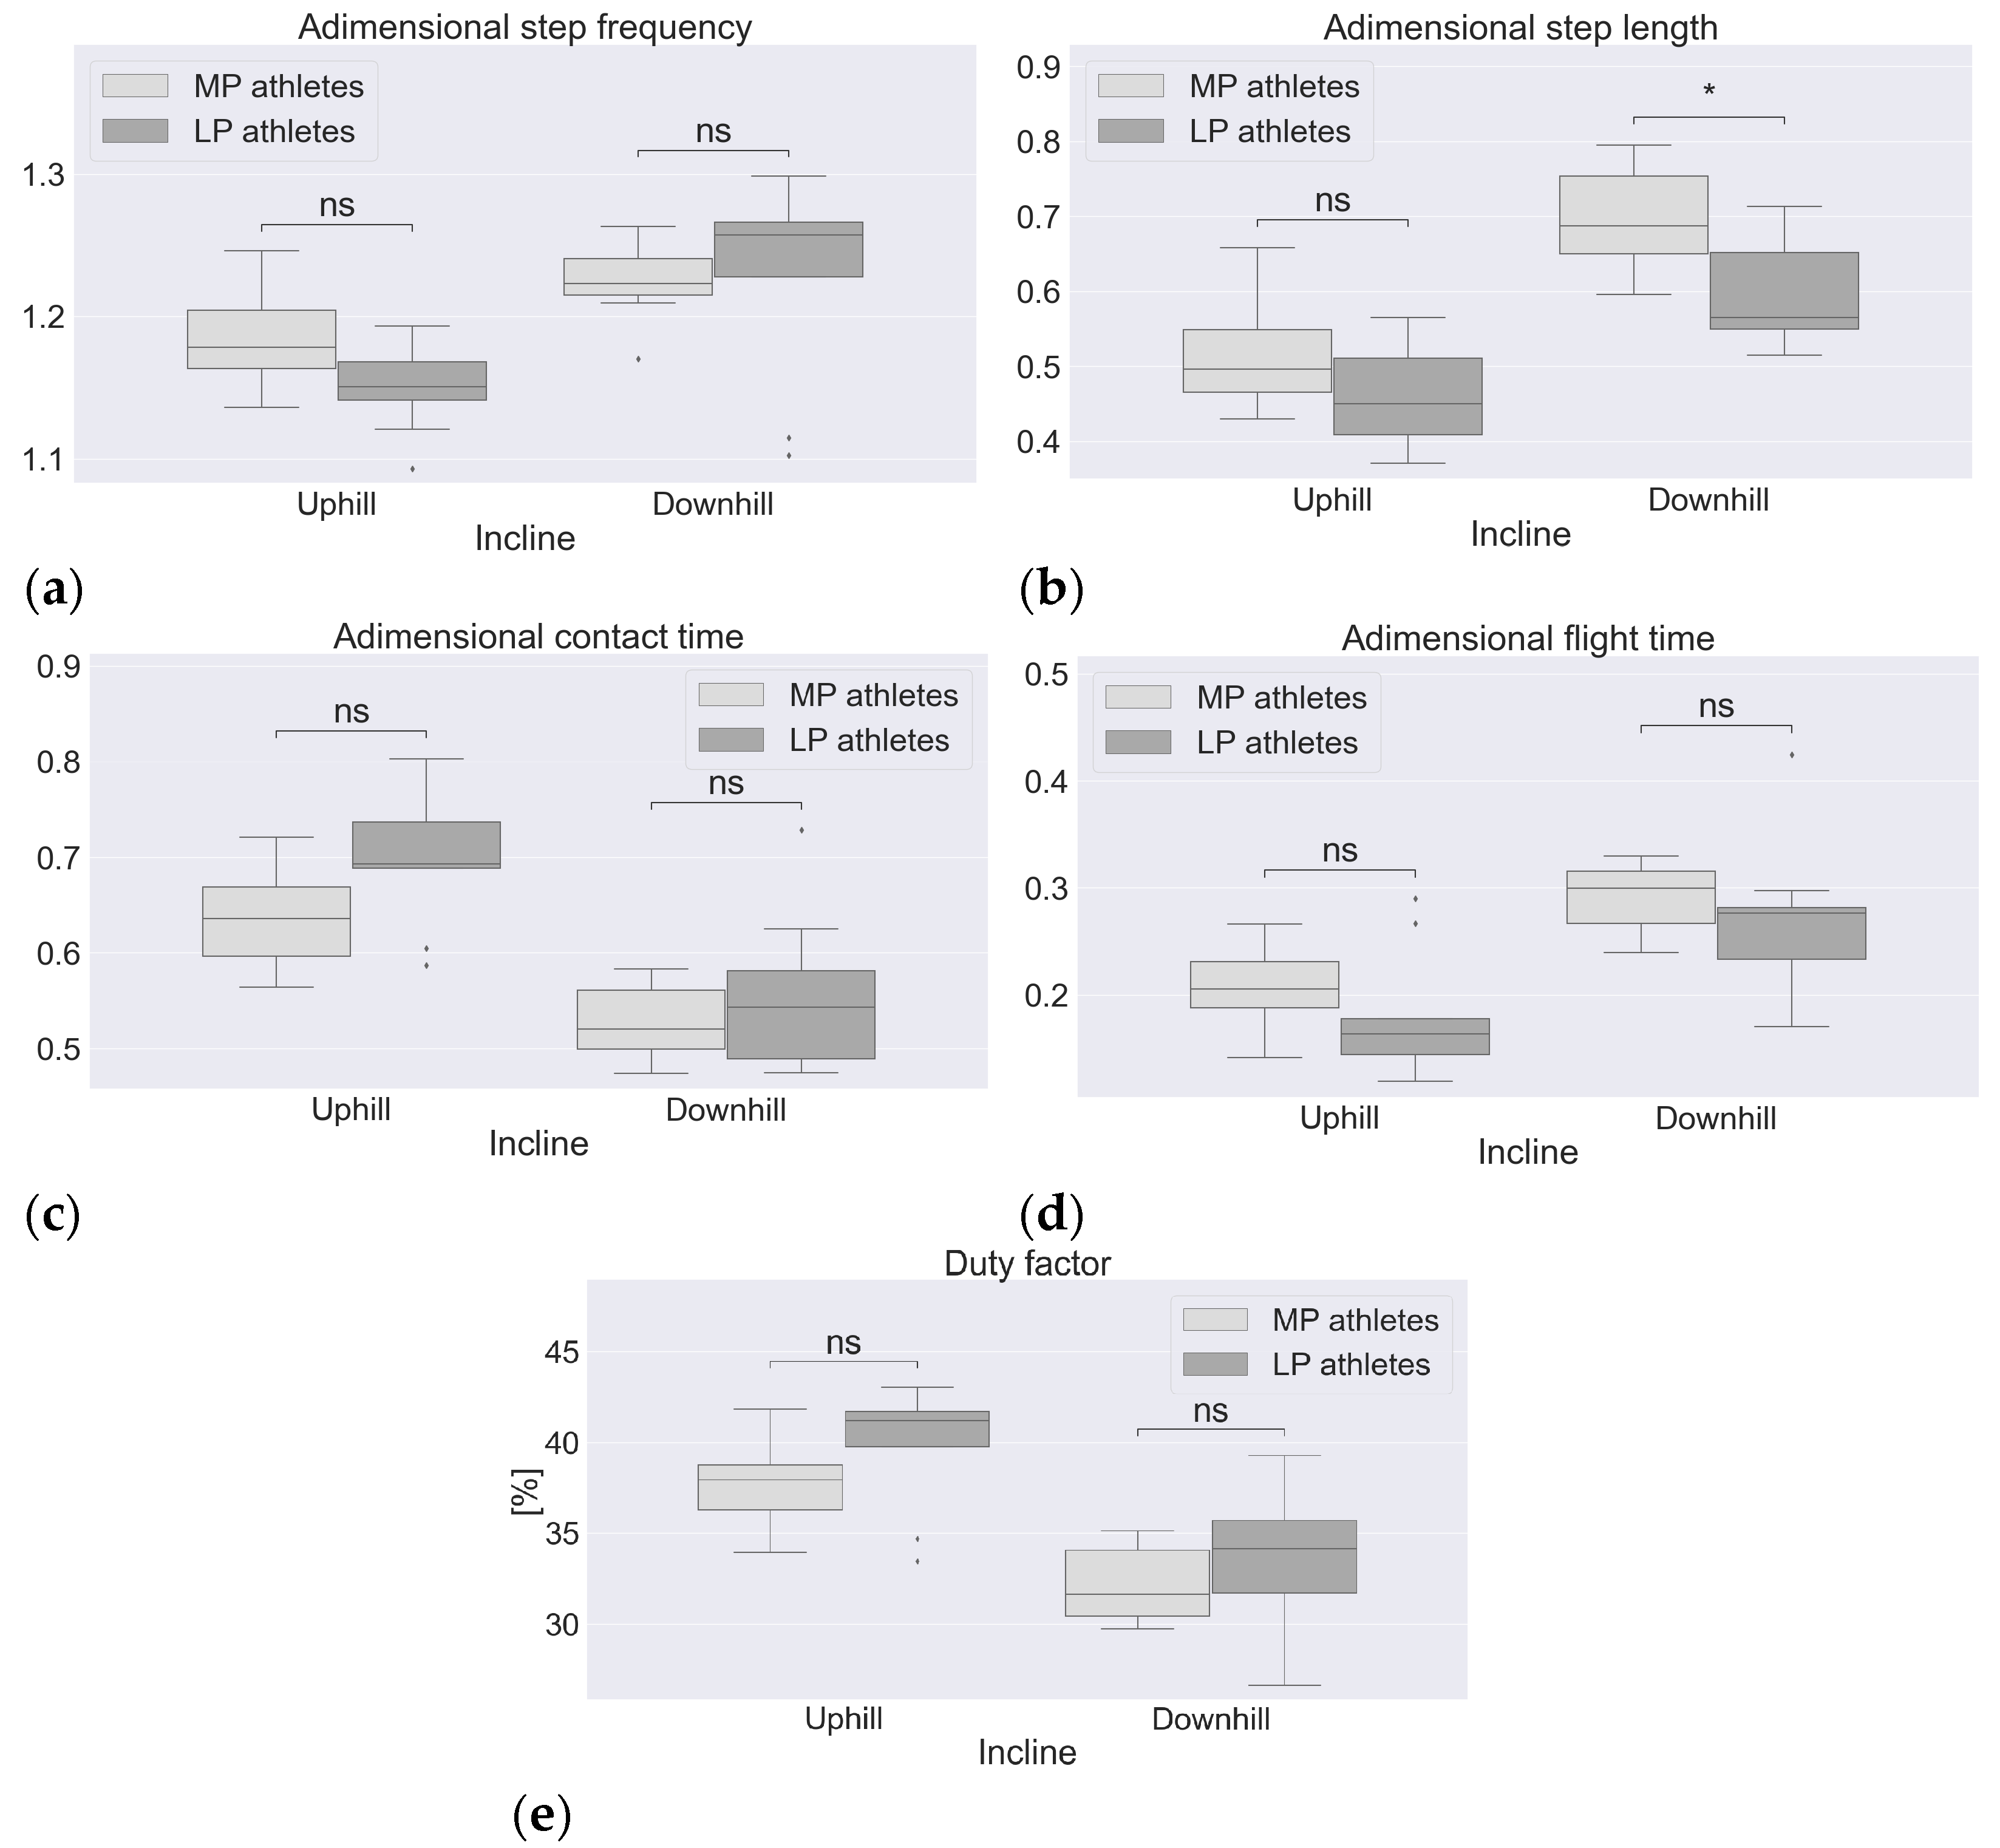
3.1. Spatiotemporal Parameters
3.2. Kinematics
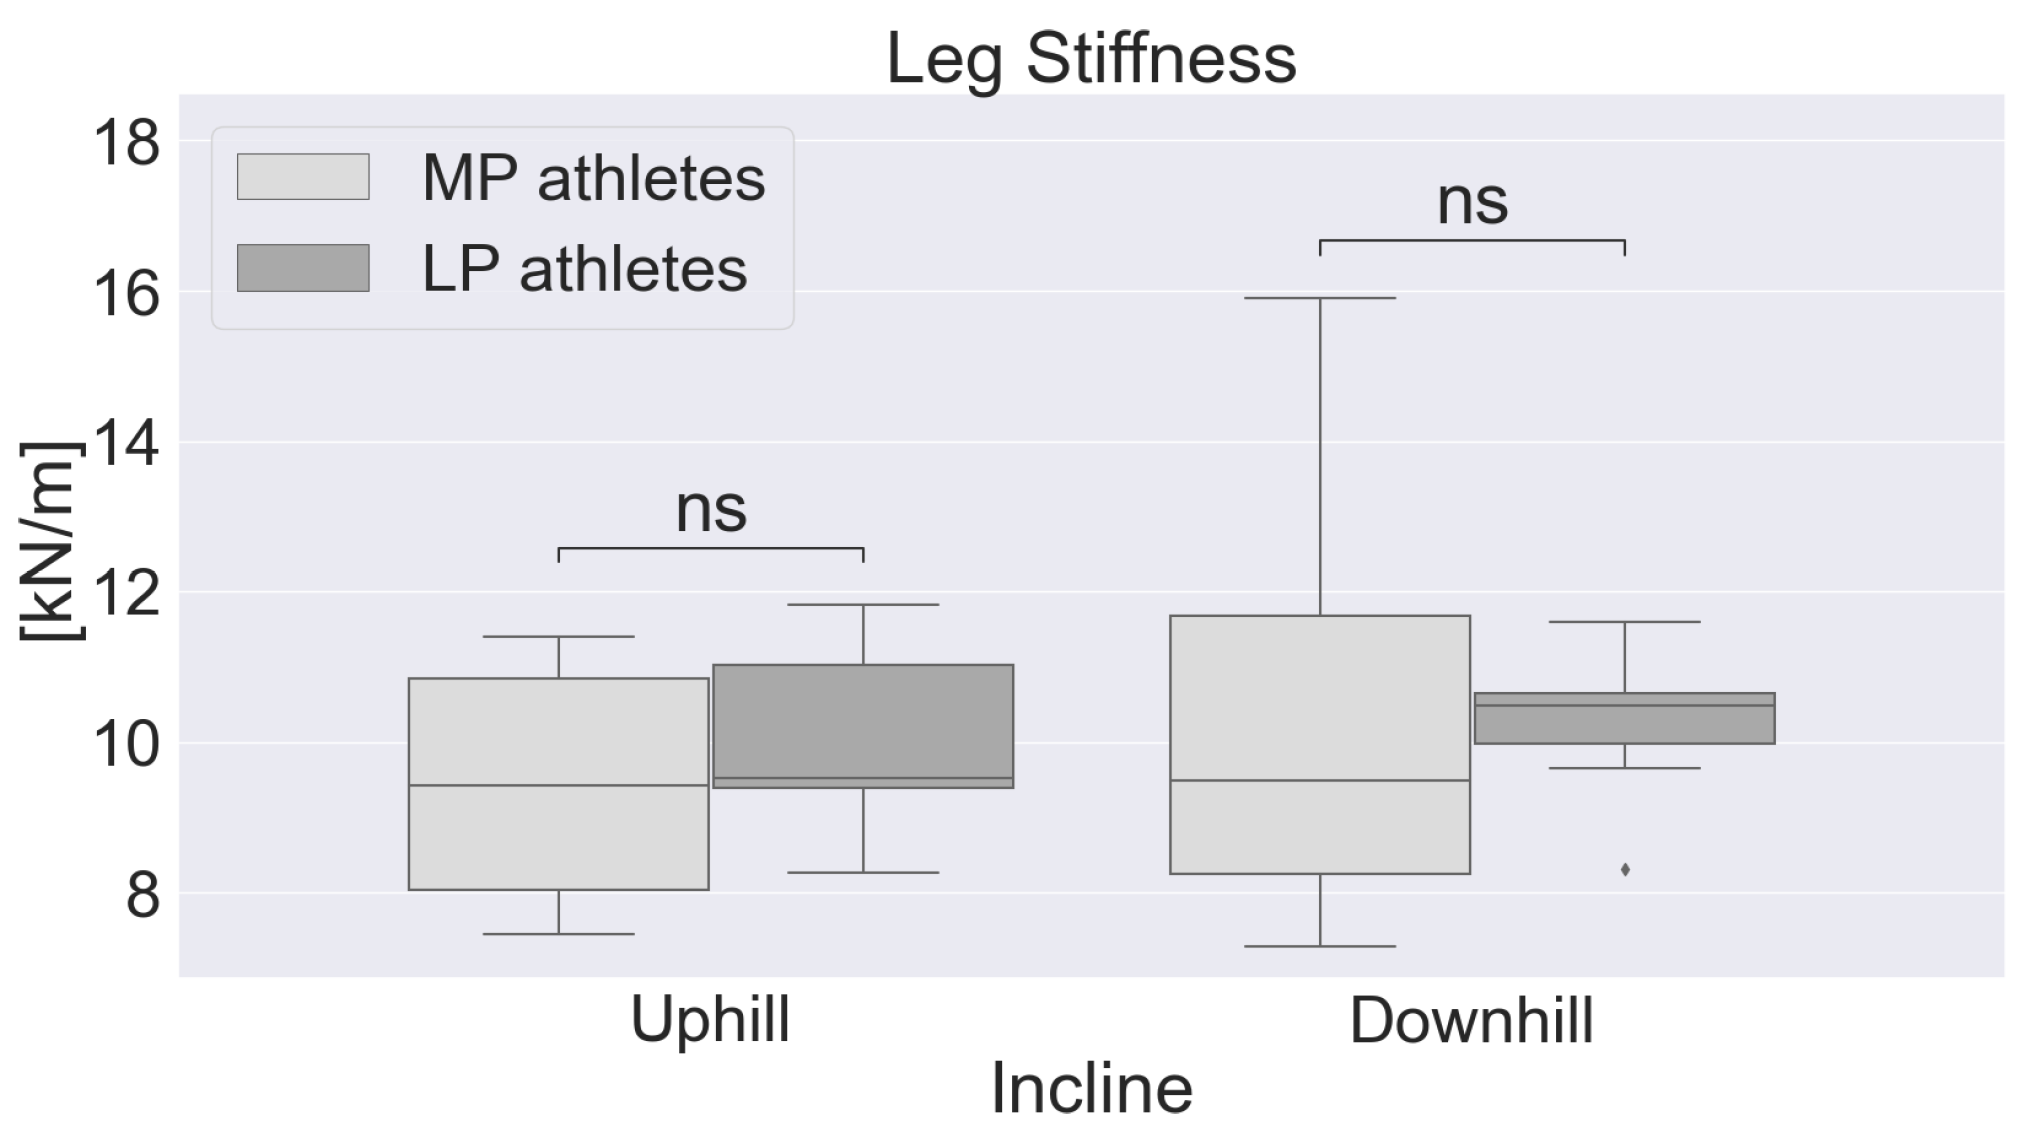
3.3. Leg Stiffness
4. Discussion
5. Conclusions
Author Contributions
Funding
Institutional Review Board Statement
Informed Consent Statement
Data Availability Statement
Conflicts of Interest
References
- Stöhr, A.; Nikolaidis, P.T.; Villiger, E.; Sousa, C.V.; Scheer, V.; Hill, L.; Knechtle, B. An analysis of participation and performance of 2067 100-km ultra-marathons worldwide. Int. J. Environ. Res. Public Health 2021, 18, 362. [Google Scholar] [CrossRef] [PubMed]
- Scheer, V.; Basset, P.; Giovanelli, N.; Vernillo, G.; Millet, G.P.; Costa, R.J. Defining off-road running: A position statement from the ultra sports science foundation. Int. J. Sports Med. 2020, 41, 275–284. [Google Scholar] [CrossRef] [PubMed]
- Gottschall, J.S.; Kram, R. Ground reaction forces during downhill and uphill running. J. Biomech. 2005, 38, 445–452. [Google Scholar] [CrossRef]
- Roberts, T.J.; Kram, R.; Weyand, P.G.; Taylor, C.R. Energetics of bipedal running. I. Metabolic cost of generating force. J. Exp. Biol. 1998, 201, 2745–2751. [Google Scholar] [CrossRef] [PubMed]
- Morin, J.; Tomazin, K.; Edouard, P.; Millet, G. Changes in running mechanics and spring–mass behavior induced by a mountain ultra-marathon race. J. Biomech. 2011, 44, 1104–1107. [Google Scholar] [CrossRef] [PubMed]
- Vernillo, G.; Savoldelli, A.; Zignoli, A.; Trabucchi, P.; Pellegrini, B.; Millet, G.P.; Schena, F. Influence of the world’s most challenging mountain ultra-marathon on energy cost and running mechanics. Eur. J. Appl. Physiol. 2014, 114, 929–939. [Google Scholar] [CrossRef]
- Vernillo, G.; Giandolini, M.; Edwards, W.B.; Morin, J.B.; Samozino, P.; Horvais, N.; Millet, G.Y. Biomechanics and physiology of uphill and downhill running. Sports Med. 2017, 47, 615–629. [Google Scholar] [CrossRef]
- Defer, T.; Juillaguet, R.; Giandolini, M.; Pavailler, S.; Horvais, N.; Cassirame, J.; Doucende, G. Does shoe heel-to-toe drop have an influence on performance in downhill trail running? Comput. Methods Biomech. Biomed. Eng. 2019, 22, S238–S239. [Google Scholar] [CrossRef]
- Giandolini, M.; Horvais, N.; Rossi, J.; Millet, G.; Morin, J.B.; Samozino, P. Acute and delayed peripheral and central neuromuscular alterations induced by a short and intense downhill trail run. Scand. J. Med. Sci. Sports 2016, 26, 1321–1333. [Google Scholar] [CrossRef]
- Björklund, G.; Swarén, M.; Born, D.P.; Stöggl, T. Biomechanical adaptations and performance indicators in short trail running. Front. Physiol. 2019, 10, 506. [Google Scholar] [CrossRef]
- Born, D.P.; Stöggl, T.; Swarén, M.; Björklund, G. Near-infrared spectroscopy: More accurate than heart rate for monitoring intensity in running in hilly terrain. Int. J. Sports Physiol. Perform. 2017, 12, 440–447. [Google Scholar] [CrossRef] [PubMed]
- Townshend, A.; Worringham, C.; Stewart, I. Spontaneous pacing during overground hill running. Med. Sci. Sports Exerc. 2010, 42, 160–169. [Google Scholar] [CrossRef] [PubMed]
- Besson, T.; Sabater Pastor, F.; Varesco, G.; Berthet, M.; Kennouche, D.; Dandrieux, P.E.; Rossi, J.; Millet, G.Y. Elite vs. Experienced Male and Female Trail Runners: Comparing Running Economy, Biomechanics, Strength, and Power. J. Strength Cond. Res 2023, 37, 1470–1478. [Google Scholar] [CrossRef] [PubMed]
- Genitrini, M.; Fritz, J.; Zimmermann, G.; Schwameder, H. Downhill Sections Are Crucial for Performance in Trail Running Ultramarathons—A Pacing Strategy Analysis. J. Funct. Morphol. Kinesiol. 2022, 7, 103. [Google Scholar] [CrossRef]
- Hof, A.L. Scaling gait data to body size. Gait Posture 1996, 3, 222–223. [Google Scholar] [CrossRef]
- Schepers, M.; Giuberti, M.; Bellusci, G. Xsens MVN: Consistent tracking of human motion using inertial sensing. Xsens Technol. 2018, 1, 1–8. [Google Scholar]
- Krüger, A.; Edelmann-Nusser, J. Application of a full body inertial measurement system in alpine skiing: A comparison with an optical video based system. J. Appl. Biomech. 2010, 26, 516–521. [Google Scholar] [CrossRef] [PubMed]
- Imbach, F.; Candau, R.; Chailan, R.; Perrey, S. Validity of the Stryd power meter in measuring running parameters at submaximal speeds. Sports 2020, 8, 103. [Google Scholar] [CrossRef] [PubMed]
- Benson, L.C.; Clermont, C.A.; Watari, R.; Exley, T.; Ferber, R. Automated accelerometer-based gait event detection during multiple running conditions. Sensors 2019, 19, 1483. [Google Scholar] [CrossRef]
- Pataky, T.C. One-dimensional statistical parametric mapping in Python. Comput. Methods Biomech. Biomed. Eng. 2012, 15, 295–301. [Google Scholar] [CrossRef]
- Preece, S.J.; Bramah, C.; Mason, D. The biomechanical characteristics of high-performance endurance running. Eur. J. Sport Sci. 2019, 19, 784–792. [Google Scholar] [CrossRef]
- Padulo, J.; Annino, G.; Migliaccio, G.M.; D’Ottavio, S.; Tihanyi, J. Kinematics of running at different slopes and speeds. J. Strength Cond. Res. 2012, 26, 1331–1339. [Google Scholar] [CrossRef]
- García-Pinillos, F.; Latorre-Román, P.Á.; Ramírez-Campillo, R.; Párraga-Montilla, J.A.; Roche-Seruendo, L.E. How does the slope gradient affect spatiotemporal parameters during running? Influence of athletic level and vertical and leg stiffness. Gait Posture 2019, 68, 72–77. [Google Scholar] [CrossRef]
- Khassetarash, A.; Vernillo, G.; Martinez, A.; Baggaley, M.; Giandolini, M.; Horvais, N.; Millet, G.Y.; Edwards, W.B. Biomechanics of graded running: Part II—Joint kinematics and kinetics. Scand. J. Med. Sci. Sports 2020, 30, 1642–1654. [Google Scholar] [CrossRef] [PubMed]
- Padulo, J.; Powell, D.; Milia, R.; Ardigò, L.P. A paradigm of uphill running. PLoS ONE 2013, 8, e69006. [Google Scholar] [CrossRef] [PubMed]
- Genitrini, M.; Fritz, J.; Schwameder, H. Coordination and coordination variability in trail running. ISBS Proc. Arch. 2023, 41, 40. [Google Scholar]
- Soltani, M.; Fatahi, A.; Yousefian Molla, R. The effect of increasing running speed on three-dimensional changes of lower limb joint angles in open motor chain and swing phase. J. Sport Biomech. 2022, 8, 232–246. [Google Scholar]
- Rottier, T.D.; Allen, S.J. The influence of swing leg technique on maximum running speed. J. Biomech. 2021, 126, 110640. [Google Scholar] [CrossRef]
- Nilsson, J.; Thorstensson, A.; Halbertsma, J. Changes in leg movements and muscle activity with speed of locomotion and mode of progression in humans. Acta Physiol. Scand. 1985, 123, 457–475. [Google Scholar] [CrossRef]
- Hamner, S.R.; Delp, S.L. Muscle contributions to fore-aft and vertical body mass center accelerations over a range of running speeds. J. Biomech. 2013, 46, 780–787. [Google Scholar] [CrossRef]
- Van Oeveren, B.T.; de Ruiter, C.J.; Beek, P.J.; van Dieën, J.H. The biomechanics of running and running styles: A synthesis. Sports Biomech. 2021, 1–39. [Google Scholar] [CrossRef] [PubMed]
- Fornasiero, A.; Savoldelli, A.; Fruet, D.; Boccia, G.; Pellegrini, B.; Schena, F. Physiological intensity profile, exercise load and performance predictors of a 65-km mountain ultra-marathon. J. Sports Sci. 2018, 36, 1287–1295. [Google Scholar] [CrossRef] [PubMed]
- Balducci, P.; Clémençon, M.; Trama, R.; Blache, Y.; Hautier, C. Performance factors in a mountain ultramarathon. Int. J. Sports Med. 2017, 38, 819–826. [Google Scholar] [CrossRef] [PubMed]


| MP Athletes | LP Athletes | Significance | |
|---|---|---|---|
| Height [cm] | 170.7 ± 9.1 | 173.6 ± 7.7 | ns |
| Body mass [kg] | 63.3± 6.7 | 71.1 ± 7.9 | * |
| Age [years] | 32.9 ± 8.0 | 33.3 ± 8.4 | ns |
| Experience [years] | 4.0 ± 1.4 | 3.3 ± 1.3 | ns |
| MP Athletes | LP Athletes | Significance | |
|---|---|---|---|
| Finish time [min] | 51.1 ± 6.3 | 60.0 ± 5.5 | * |
| DH sections [s] | 36.0 ± 5.0 | 42.0 ± 3.3 | ** |
| UH sections [s] | 29.8 ± 4.4 | 33.3 ± 3.8 | ns |
Disclaimer/Publisher’s Note: The statements, opinions and data contained in all publications are solely those of the individual author(s) and contributor(s) and not of MDPI and/or the editor(s). MDPI and/or the editor(s) disclaim responsibility for any injury to people or property resulting from any ideas, methods, instructions or products referred to in the content. |
© 2023 by the authors. Licensee MDPI, Basel, Switzerland. This article is an open access article distributed under the terms and conditions of the Creative Commons Attribution (CC BY) license (https://creativecommons.org/licenses/by/4.0/).
Share and Cite
Genitrini, M.; Fritz, J.; Stöggl, T.; Schwameder, H. Performance Level Affects Full Body Kinematics and Spatiotemporal Parameters in Trail Running—A Field Study. Sports 2023, 11, 188. https://doi.org/10.3390/sports11100188
Genitrini M, Fritz J, Stöggl T, Schwameder H. Performance Level Affects Full Body Kinematics and Spatiotemporal Parameters in Trail Running—A Field Study. Sports. 2023; 11(10):188. https://doi.org/10.3390/sports11100188
Chicago/Turabian StyleGenitrini, Matteo, Julian Fritz, Thomas Stöggl, and Hermann Schwameder. 2023. "Performance Level Affects Full Body Kinematics and Spatiotemporal Parameters in Trail Running—A Field Study" Sports 11, no. 10: 188. https://doi.org/10.3390/sports11100188
APA StyleGenitrini, M., Fritz, J., Stöggl, T., & Schwameder, H. (2023). Performance Level Affects Full Body Kinematics and Spatiotemporal Parameters in Trail Running—A Field Study. Sports, 11(10), 188. https://doi.org/10.3390/sports11100188