Abstract
The investigation about cosmic-ray sources through the study of the arrival direction of the particles is completely dependent on primary mass compositions. This is due to heavier particles having an average larger deflection during propagation in galactic and extragalactic magnetic fields. Recent result from the Auger Collaboration made it possible to obtain information on the chemical composition of the cosmic rays on an event-by-event basis in addition to data from the surface detector. Here, we have investigated the gain in detection efficiency of standard cross-correlation using the Landy–Szalay estimator. Our sample contained only events with the highest values (corresponding to the lightest charged particles, for which the deflections in magnetic fields are smaller on average). We obtained results showing that that gain depends on the proton fraction ranging from a factor of ∼2 to ∼4.
1. Introduction
Ultra-high energy cosmic rays (UHECRs), particles with energies above eV (1 EeV = eV), are messengers of astrophysical sources carrying fundamental information about the universe. Although these high energy particles have been detected since the 1960s, their sources, chemical composition, mechanism of acceleration at the sources, and how they propagate to Earth are still open questions [1,2,3,4,5,6]. The study of anisotropies through the cross-correlation between the arrival directions of ultra high energy cosmic rays (UHECRs) and the positions of astrophysical objects is an important ingredient to determine the sources of these cosmic particles [7].
Since most cosmic rays are charged particles, they are deflected along their path through the Galactic and extragalactic magnetic fields. The limited knowledge of the magnitude of these fields and the chemical composition of cosmic rays makes the identification of the sources of the ultra-energetic cosmic rays a very difficult task. Part of this difficulty arises from the fact that information about the chemical composition of the primary cosmic rays is obtained statistically from the distribution of the atmospheric depth at which the maximum deposition of energy by the extensive air shower, , occurs [4]. At the Pierre Auger Observatory, this information is measured by fluorescence telescopes, which operate only on clear nights, without moonlight, corresponding to ∼13% of the operating time of the experiment. The Pierre Auger Collaboration has recently shown that it is possible to obtain the same information in an event-by-event basis by using deep neural networks and data from the surface detectors (which operate almost of the time) of the Pierre Auger Observatory; see [8] for details. This opens a very interesting window for anisotropy studies. The main goal of the present paper is to investigate the gain in detection power of the Landy–Szalay anisotropy cross-correlation estimator [9] when we select samples of the highest values, corresponding to the lightest elements. Since the magnetic deflection in the cosmic-ray trajectory is proportional to their electrical charge, the selection of such samples, consisting of lighter nuclei, must have a higher correlation with the direction of the sources that produced them, which is quite promising for detecting anisotropies in the cosmic-ray arrival directions and, possibly, unveil their origins. The article is organized as follows. We begin in Section 2 with an overview of the Landy–Szalay cross-correlation estimator method. In Section 3, we describe detection sensitivity, and the article concludes with some conclusions in Section 4.
2. Landy–Szalay Cross-Correlation Estimator
The two-point cross-correlation function is a method designed to measure the degree of similarities between the distributions in the sky of two sets of astrophysical objects. The Landy–Szalay [9] cross-correlation method is based on the estimator:
where denotes the data set of interest (the arrival directions measured by the Pierre Auger Observatory, in our case), is a reference catalog of possible astrophysical sources, and and are isotropic simulated sky maps with the same exposures of and , respectively. Notation indicates the number of pairs between the two samples, and , as a function of angular distance . For the simplicity of notation, we will refer to only by .
It is interesting to note that this estimator fluctuates around zero if the data set or the catalog is isotropic. In this case, (or ) by definition, and Equation (1) is
For better comprehension, the distributions of the number of pairs obtained from one specific simulation of an isotropic cosmic-ray sky contained 1000 events () generated by taking into account the exposure of the Pierre Auger Observatory. To test the cross-correlation, we used the positions of starburst galaxies (SBG) () [1]. The isotropic mock samples ( and ) were generated as explained above with 10,000 directions sampled for each one. Figure 1 shows the resulting obtained for this specific simulation. We can see that it fluctuates around zero as expected.
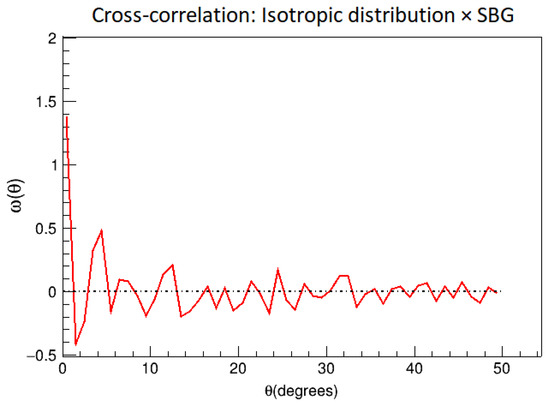
Figure 1.
Example of Landy–Szalay cross-correlation estimator between a simulated isotropic dataset and positions of starburst galaxies. The red line is the value of estimator as a function of angular scale obtained for the data. The black dotted line shows the expected value in the isotropic case.
A possible choice of a global estimator for the cross-correlation between samples and that takes into account the statistical penalization for searches in different angular scales is provided by a reduced as follows:
where and are the expected value and standard deviation of obtained from isotropic skies. is the number of bins for searches in different angular scales . For simplicity, from now on, we will only refer to as .
The statistical test was performed by comparing the obtained for a given data set with , defined as = 0.99, where is the reduced probability density function. If obtained from the data is greater than , the isotropy hypothesis is rejected.
3. Detection Sensitivity
The goal of this section is to compute the gain in detection power when it is possible to use a subsample of events, selected by the highest values and corresponding to the lightest nuclei. Since the magnetic deflection of the cosmic-ray trajectory is proportional to its electrical charge, we expect that such a selection presents a higher correlation with the direction of the sources that produced them in comparison with the cross-correlation considering the entire sample.
Our toy model consists of a mix of events coming from the SBG listed in [1] and contains the positions of the 23 starburst galaxies in Galactic coordinates and from the background. It has been pointed out that the diffusive shock acceleration inside superwinds of starbursts can accelerate cosmic rays to the maximum energies observed [10,11]. The events injected at the SBG are protons while the background is composed of an equal mix of nitrogen (N) and iron (Fe) nuclei. Particles are simulated with energies above 40 EeV following an energy spectrum , with , in accordance with Auger the energy spectrum [5,12] in the considered energy range. Energy losses are neglected during the proton’s propagation because the SBGs are very close to our Galaxy [1]. In addition, a smearing in the arrival direction of protons is performed by using a von Mises–Fischer distribution with an angular radius corresponding to , according to [1]. Nitrogen and iron nuclei directions are isotropically distributed in the sky. The entire sample is generated by taking into account the exposure of the Pierre Auger Observatory, and the depth of shower maximum for each particle is generated according to Gumbel parameterizations by considering the EPOS-LHC model [13].
Each simulated cosmic-ray sky is composed of 1000 events, a fraction f of which consists of protons coming from SBG and the remaining, , of nitrogen and iron isotropically distributed. The sensitivity of the cross-correlation estimator will be studied as a function of the fraction of protons and the fraction of selected events corresponding to the highest values. For each case, we performed 1000 cosmic-ray sky simulations. The detection power, P, is computed by the fraction of skies that have a larger that :
where is the number of cosmic-ray skies with larger that and is the total number of simulated skies for a given scenario.
In Figure 2, we show the resulting detection power as a function of the proton fraction for different fractions of selected events . The net gain when we use a small subset containing the highest depends of the proton fraction, ranging from a factor of ∼2 to ∼4.
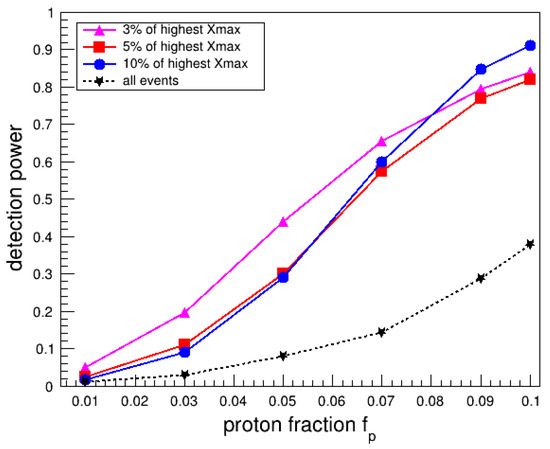
Figure 2.
Detection power as a function of the proton fraction for different fractions of selected events . The lines indicate the different values of the highest considered.
4. Summary
The approach presented here shows us the increase in detection power of the Landy–Szalay cross-correlation estimator when using a small subset of data containing the highest events. The gain depends on the proton fraction ranging from a factor of ∼2 to ∼4. Anisotropy studies in combination with measurements will continue to be explored in future works. This analysis opens an interesting window for future applications with respect to real data.
Author Contributions
Writing-Original draft preparation, C.V.V. and R.M.d.A.; writing-review and editing, C.V.V., R.M.d.A., R.C.D.A. and J.G.C. All authors have read and agreed to the published version of the manuscript.
Funding
The research of R.C.D.A. is supported by Conselho Nacional de Desenvolvimento Científico e Tecnológico (CNPq), grant number 310448/2021-2, and Serrapilheira Institute grant number Serra-1708-15022. She also thanks for the support of L’Oreal Brazil, with the partnership of ABC and UNESCO in Brazil. R.M.d.A. is partially supported by the Conselho Nacional de Desenvolvimento Cientifico e Tecnológico (CNPq) and by the Fundação Carlos Chagas Filho de Amparo à Pesquisa do Estado do Rio de Janeiro (FAPERJ). J.G.C. is grateful for the support of CNPq (311758/2021-5), FAPESP (2021/01089-1). C.V.V., J.G.C. and R.C.D.A. acknowledge the financial support of “Fenômenos Extremos do Universo” of Fundação Araucária.
Institutional Review Board Statement
Not applicable.
Informed Consent Statement
Not applicable.
Conflicts of Interest
The authors declare no conflict of interest.
References
- Aab, A.; Abreu, P.; Aglietta, M.; Albuquerque, I.F.M.; Allekotte, I.; Almela, A.; Castillo, J.A.; Alvarez-Muñiz, J.; Anastasi, G.A.; Anchordoqui, L.; et al. An Indication of anisotropy in arrival directions of ultra-high-energy cosmic rays through comparison to the flux pattern of extragalactic gamma-ray sources. Astrophys. J. Lett. 2018, 853, 29. [Google Scholar] [CrossRef]
- The Pierre Auger Collaboration; Aab, A.; Abreu, P.; Aglietta, M.; Al Samarai, I.; Albuquerque, I.F.M.; Allekotte, I.; Almela, A.; Alvarez Castillo, J.; Alvarez-Muñiz, J.; et al. Observation of a Large-scale Anisotropy in the Arrival Directions of Cosmic Rays above 8 × 10¹⁸ eV. Science 2017, 357, 6537. [Google Scholar]
- Almeida, R.M.; Alves Batista, R.; Canfora, F.; de Jong, S.J.; De Mauro, G.; Falcke, H.; Timmermans, C. Large-scale and multipolar anisotropies of cosmic rays detected at the Pierre Auger Observatory with energies above 4 EeV. In Proceedings of the 37th International Cosmic Ray Conference, Berlin, Germany, 12–13 July 2021; Volume 37. [Google Scholar]
- Yushkov, A. Mass composition of cosmic rays with energies above 1017.2 eV from the hybrid data of the Pierre Auger Observatory. In Proceedings of the 36th International Cosmic Ray Conference, Madison, WI, USA, 24 July–1 August 2019; Volume 36. [Google Scholar]
- Aab, A.; Abreu, P.; Aglietta, M.; Albury, J.M.; Allekotte, I.; Almela, A.; Hahn, S. Features of the Energy Spectrum of Cosmic Rays above 2.5 × 10¹⁸ eV using the Pierre Auger Observatory. Phys. Rev. Lett. 2020, 125, 121106. [Google Scholar] [CrossRef] [PubMed]
- Aab, A.; Abreu, P.; Aglietta, M.A.R.C.O.; Al Samarai, I.; Albuquerque, I.F.M.; Allekotte, I.; Holt, E. Combined fit of spectrum and composition data as measured by the Pierre Auger Observatory. J. Cosmol. Astropart. Phys. 2017, 1704, 038. [Google Scholar] [CrossRef]
- Aab, A.; Abreu, P.; Aglietta, M.A.R.C.O.; Ahn, E.J.; Al Samarai, I.; Albuquerque, I.F.M.; Giller, M. Searches for Anisotropies in the Arrival Directions of the Highest Energy Cosmic Rays Detected by the Pierre Auger Observatory. Astrophys. J. 2015, 804, 15. [Google Scholar] [CrossRef]
- Buitink, S.; Huege, T.; Mulrey, K.; Scholten, O.; Winchen, T.; Pierre Auger Collaboration. Deep-learning based reconstruction of the shower maximum Xmax using the water-Cherenkov detectors of the Pierre Auger Observatory. J. Instrum. 2021, 16, P07019. [Google Scholar]
- Landy, S.; Szalay, A. Bias and variance of angular correlation functions. Astrophys. J. 1993, 412, 64–71. [Google Scholar] [CrossRef]
- Dos Anjos, R.C.; Soriano, J.F.; Anchordoqui, L.A.; Paul, T.C.; Torres, D.F.; Krizmanic, J.F.; Olinto, A.V. Ultrahigh-energy cosmic ray composition from the distribution of arrival directions. Phys. Rev. D 2018, 98, 123018. [Google Scholar] [CrossRef] [Green Version]
- Anchordoqui, L.A. Acceleration of ultrahigh-energy cosmic rays in starburst superwinds. Phys. Rev. D 2018, 97, 063010. [Google Scholar] [CrossRef] [Green Version]
- Aab, A.; Abreu, P.; Aglietta, M.; Albury, J.M.; Allekotte, I.; Almela, A.; Hahn, S. Measurement of the cosmic ray energy spectrum above 2.5 × 10¹⁸ eV using the Pierre Auger Observatory. Phys. Rev. D 2020, 102, 062005. [Google Scholar] [CrossRef]
- Pierog, T.; Karpenko, I.; Katzy, J.M.; Yatsenko, E.; Werner, K. EPOS LHC: Test of collective hadronization with data measured at the CERN Large Hadron Collider. Phys. Rev. 2015, C92, 034906. [Google Scholar] [CrossRef] [Green Version]
Publisher’s Note: MDPI stays neutral with regard to jurisdictional claims in published maps and institutional affiliations. |
© 2022 by the authors. Licensee MDPI, Basel, Switzerland. This article is an open access article distributed under the terms and conditions of the Creative Commons Attribution (CC BY) license (https://creativecommons.org/licenses/by/4.0/).