
Metabolic Differences in 24-Hour Urine Parameters Between Calcium Oxalate Monohydrate and Dihydrate Kidney Stones: A Clinical Study


Abstract
1. Introduction
2. Materials and Methods
- Main specific urinary conditions were defined as follows:
Statistical Analysis
3. Results
4. Discussion
5. Conclusions
Author Contributions
Funding
Institutional Review Board Statement
Informed Consent Statement
Data Availability Statement
Acknowledgments
Conflicts of Interest
References
- Sorokin, I.; Mamoulakis, C.; Miyazawa, K.; Rodgers, A.; Talati, J.; Lotan, Y. Epidemiology of stone disease across the world. World J. Urol. 2017, 35, 1301–1320. [Google Scholar] [CrossRef] [PubMed]
- Gillams, K.; Juliebø-Jones, P.; Juliebø, S.Ø.; Somani, B.K. Gender Differences in Kidney Stone Disease (KSD): Findings from a Systematic Review. Curr. Urol. Rep. 2021, 22, 50. [Google Scholar] [CrossRef] [PubMed]
- Pozdzik, A.; Grillo, V.; Sakhaee, K. Gaps in Kidney Stone Disease Management: From Clinical Theory to Patient Reality. Urolithiasis 2024, 52, 61. [Google Scholar] [CrossRef] [PubMed]
- Mandel, N.; Mandel, I.; Fryjoff, K.; Rejniak, T.; Mandel, G. Conversion of Calcium Oxalate to Calcium Phosphate with Recurrent Stone Episodes. J. Urol. 2003, 169, 2026–2029. [Google Scholar] [CrossRef]
- Curhan, G.C.; Taylor, E.N. 24-h Uric Acid Excretion and the Risk of Kidney Stones. Kidney Int. 2008, 73, 489–496. [Google Scholar] [CrossRef]
- Kourambas, J.; Aslan, P.; Teh, C.L.; Mathias, B.J.; Preminger, G.M. Role of Stone Analysis in Metabolic Evaluation and Medical Treatment of Nephrolithiasis. J. Endourol. 2001, 15, 181–186. [Google Scholar] [CrossRef]
- Skolarikos, A.; Somani, B.; Neisius, A.; Jung, H.; Petřík, A.; Tailly, T.; Davis, N.; Tzelves, L.; Geraghty, R.; Lombardo, R.; et al. Metabolic Evaluation and Recurrence Prevention for Urinary Stone Patients: An EAU Guidelines Update. Eur. Urol. 2024, 86, 343–363. [Google Scholar] [CrossRef]
- Skolarikos, A.; Jung, H.A.; Neisius, A.; Petřík, A.; Somani, B.; Tailly, T.; Gambaro, G.; Davis, N.F.; Geraghty, R.; Lombardo, R.; et al. EAU Guidelines. Edn. Presented at the EAU Annual Congress Paris. 2024; ISBN 978-94-92671-23-3. Available online: https://uroweb.org/guidelines (accessed on 4 February 2025).
- Daudon, M.; Bader, C.A.; Jungers, P. Urinary Calculi: Review of Classification Methods and Correlations with Etiology. Scanning Microsc. 1993, 7, 32. [Google Scholar] [PubMed]
- Castiglione, V.; Jouret, F.; Bruyère, O.; Dubois, B.; Thomas, A.; Waltregny, D.; Bekaert, A.-C.; Cavalier, É.; Gadisseur, R. Epidemiology of Urolithiasis in Belgium on the Basis of a Morpho-Constitutional Classification. Nephrol. Ther. 2015, 11, 42–49. [Google Scholar] [CrossRef]
- Aiumtrakul, N.; Thongprayoon, C.; Suppadungsuk, S.; Krisanapan, P.; Pinthusopon, P.; Mao, M.A.; Arayangkool, C.; Vo, K.B.; Wannaphut, C.; Miao, J.; et al. Global Trends in Kidney Stone Awareness: A Time Series Analysis from 2004–2023. Clin. Pract. 2024, 14, 915–927. [Google Scholar] [CrossRef]
- Corrales, M.; Doizi, S.; Barghouthy, Y.; Traxer, O.; Daudon, M. Classification of Stones according to Michel Daudon: A Narrative Review. Eur. Urol. Focus 2021, 7, 13–21. [Google Scholar] [CrossRef] [PubMed]
- Stamatelou, K.; Goldfarb, D.S. Epidemiology of Kidney Stones. Healthcare 2023, 11, 424. [Google Scholar] [CrossRef]
- Tzelves, L.; Berdempes, M.; Mourmouris, P.; Mitsogiannis, I.; Skolarikos, A. Optimal Delivery of Follow-up Care for the Prevention of Stone Recurrence in Urolithiasis Patients: Improving Outcomes. Res. Rep. Urol. 2022, 14, 141–148. [Google Scholar] [CrossRef] [PubMed]
- Tiselius, H.-G.; Daudon, M.; Thomas, K.; Seitz, C. Metabolic Work-up of Patients with Urolithiasis: Indications and Diagnostic Algorithm. Eur. Urol. Focus 2017, 3, 62–71. [Google Scholar] [CrossRef]
- Wang, K.; Ge, J.; Han, W.; Wang, D.; Zhao, Y.; Shen, Y.; Chen, J.; Chen, D.; Wu, J.; Shen, N.; et al. Risk Factors for Kidney Stone Disease Recurrence: A Comprehensive Meta-Analysis. BMC Urol. 2022, 22, 62. [Google Scholar] [CrossRef]
- Milose, J.C.; Kaufman, S.R.; Hollenbeck, B.K.; Wolf, J.S.; Hollingsworth, J.M. Prevalence of 24-Hour Urine Collection in High Risk Stone Formers. J. Urol. 2014, 191, 376–380. [Google Scholar] [CrossRef]
- Dauw, C.A.; Alruwaily, A.F.; Bierlein, M.J.; Asplin, J.R.; Ghani, K.R.; Wolf, J.S.; Hollingsworth, J.M. Provider Variation in the Quality of Metabolic Stone Management. J. Urol. 2015, 193, 885–890. [Google Scholar] [CrossRef] [PubMed]
- Cloutier, J.; Villa, L.; Traxer, O.; Daudon, M. Kidney Stone Analysis: “Give Me Your Stone, I Will Tell You Who You Are!”. World J. Urol. 2014, 33, 157–169. [Google Scholar] [CrossRef]
- Wu, W.; Yang, D.; Tiselius, H.G.; Ou, L.; Liang, Y.; Zhu, H.; Li, S.; Zeng, G. The Characteristics of the Stone and Urine Composition in Chinese Stone Formers: Primary Report of a Single-Center Results. Urology 2014, 83, 732–737. [Google Scholar] [CrossRef]
- Pak, C.Y.C.; Poindexter, J.R.; Adams-Huet, B.; Pearle, M.S. Predictive Value of Kidney Stone Composition in the Detection of Metabolic Abnormalities. Am. J. Med. 2003, 115, 26–32. [Google Scholar] [CrossRef]
- Kustov, A.V.; Strelnikov, A.I. Quantitative Mineralogical Composition of Calculi and Urine Abnormalities for Calcium Oxalate Stone Formers: A Single-Center Results. Urol. J. 2018, 15, 87–91. [Google Scholar] [PubMed]
- Trinchieri, A.; Castelnuovo, C.; Lizzano, R.; Zanetti, G. Calcium Stone Disease: A Multiform Reality. Urol. Res. 2005, 33, 194–198. [Google Scholar] [CrossRef]
- Pawan, K.V. Current Test Overview; 24. Litholink 24 Hour Urine Patient Results Report. Adult Normals Research. 2023. Available online: https://litholink.labcorp.com/sites/default/files/2023-06/Sample%20Report%20910235%20-%20FINAL.pdf (accessed on 4 February 2025).
- Rifai, N. Tietz Textbook of Laboratory Medicine; Saunders: Philadephia, PA, USA, 2022; ISBN 9780323775724. [Google Scholar]
- Ha, Y.-S.; Tchey, D.-U.; Kang, H.W.; Kim, Y.-J.; Yun, S.-J.; Lee, S.-C.; Kim, W.-J. Phosphaturia as a Promising Predictor of Recurrent Stone Formation in Patients with Urolithiasis. Korean J. Urol. 2010, 51, 54. [Google Scholar] [CrossRef] [PubMed]
- Levi, M.; Breusegem, S. Renal Phosphate–Transporter Regulatory Proteins and Nephrolithiasis. N. Engl. J. Med. 2008, 359, 1171–1173. [Google Scholar] [CrossRef] [PubMed]
- Tozuka, K.; Konjiki, T.; Sudo, T. Study of Passed Stones by Means of X-Rays, Infrared and Thermal Analyses. J. Urol. 1983, 130, 1119–1122. [Google Scholar] [CrossRef]
- Brinkman, E.; Large, T.; Williams, J.; Krambeck, A.E. Trends in 24-hour Urine Parameters Based on Calcium Oxalate Monohydrate versus Calcium Oxalate Dihydrate State. Clin. Res. Urol. 2020, 3, 1–6. [Google Scholar] [CrossRef]
- Asplin, J.R.; Lingeman, J.E.; Kahnoski, R.; Mardis, H.; Parks, J.H.; Coe, F.L. Metabolic urinary correlates of calcium oxalate dihydrate in renal stones. J. Urol. 1998, 159, 664–668. [Google Scholar] [CrossRef] [PubMed]
- Omar, M.; Tarplin, S.; El Mahdy, A.E.D.; Monga, M. Does 24-Hour Urine Supersaturation Predict Stone Composition? World J. Nephrol. Urol. 2015, 4, 169–172. [Google Scholar] [CrossRef]

| Parameters | Me [LQ; UQ] (N = 69) COM | Me [LQ; UQ] (N = 29) COD | p-Value | Reference Range |
|---|---|---|---|---|
| Age | 44.00 [37.00; 56.00] | 36.00 [31.00; 47.00] | <0.0001 | |
| Male, n (%) | 48 (69.6) | 22 (75.9) | 0.6283 | |
| Female, n (%) | 21 (30.4) | 7 (24.1) | ||
| Diuresis, L | 2.00 [1.50; 2.50] | 1.60 [1.20; 2.00] | 0.0606 | >2.0 |
| pH level | 6.00 [6.00; 6.50] | 6.50 [6.00; 6.50] | 0.2619 | 5.0–7.0 |
| Ammonium | 27.48 [19.20; 34.56] | 23.13 [16.96; 30.40] | 0.0704 | 15.0–60.0 mmol/d |
| Sodium | 168.15 [116.81; 250.05] | 120.96 [92.64; 190.19] | 0.1510 | 50.0–150.0 mmol/d |
| Potassium | 44.60 [35.38; 60.90] | 48.18 [36.57; 61.45] | 0.9876 | 20.0–100.0 mmol/d |
| Magnesium | 4.25 [2.80; 6.06] | 3.30 [2.70; 4.75] | 0.1566 | 1.25–5.0 mmol/d |
| Calcium | 5.71 [3.80; 8.40] | 6.00 [4.54; 9.44] | 0.5033 | male < 5.0; female < 6.25 |
| Chloride | 141.28 [87.88; 182.85] | 119.50 [87.62; 195.93] | 0.7526 | 70.0–250.0 mmol/d |
| Nitrate | 0.80 [0.42; 1.43] | 0.81 [0.53; 1.62] | 0.5489 | 0.1–3.3 mmol/d |
| Sulfate | 17.83 [15.08; 24.59] | 17.55 [14.06; 26.88] | 0.6047 | 14.0–35.0 mmol/d |
| Fluoride | 0.66 [0.32; 1.50] | 0.68 [0.44; 1.41] | 0.8154 | 0.2–5.5 mmol/d |
| Phosphate | 25.80 [21.42; 31.75] | 25.75 [23.21; 31.64] | 0.8824 | 19.0–39.0 mmol/d |
| Citrate | 2.14 [1.26; 2.98] | 1.99 [1.39; 2.85] | 0.8886 | male > 2.4; female > 2.9 |
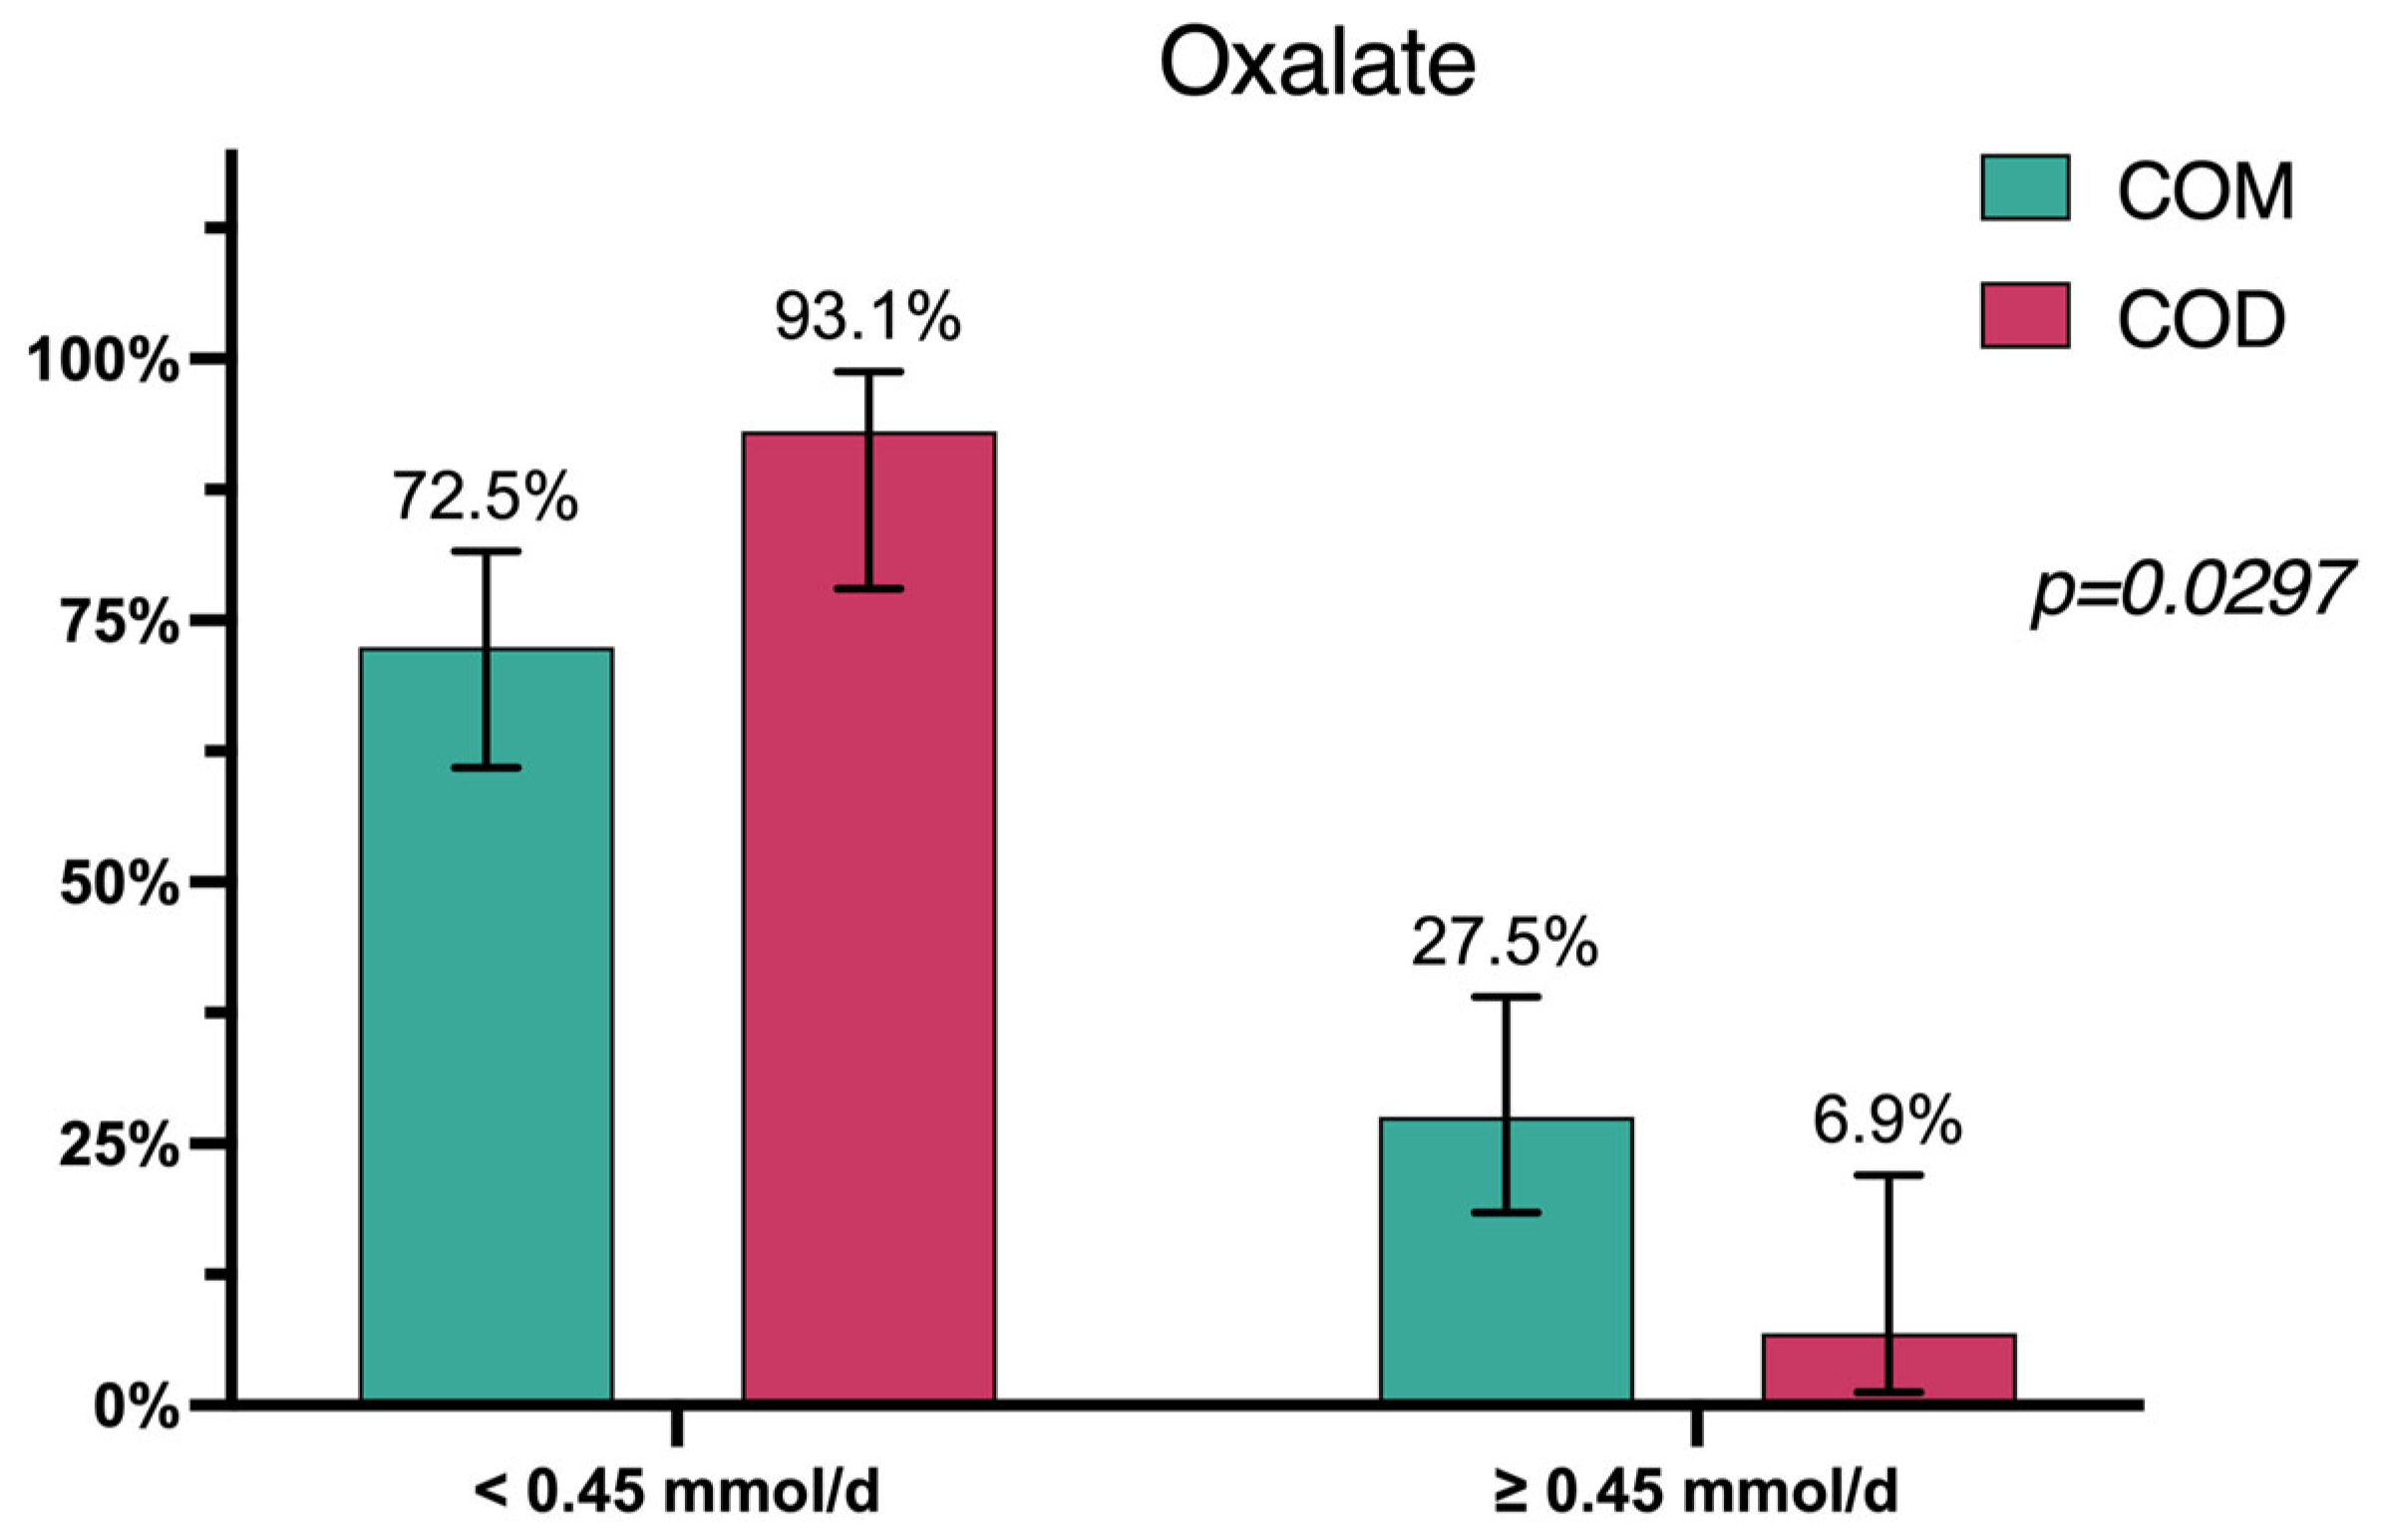
| Oxalate | 0.28 [0.18; 0.45] | 0.28 [0.24; 0.33] | 0.4314 | <0.45 mmol/d |
| Uric acid | 3.57 [2.18; 4.80] | 3.15 [2.59; 4.99] | 0.6266 | male < 4.8; female > 4.2 |
| Creatinine | 13.20 [9.60; 15.40] | 14.70 [11.10; 16.40] | 0.2813 | male13.0–18.0; female 7.0–13.0 |
| Variable | OR * (95% CI) | p-Value | OR ** (95% CI) | p-Value |
|---|---|---|---|---|
| Age | 1.06 (1.02–1.11) | 0.0070 | - | - |
| Diuresis | 1.95 (0.95–4.01) | 0.0695 | - | - |
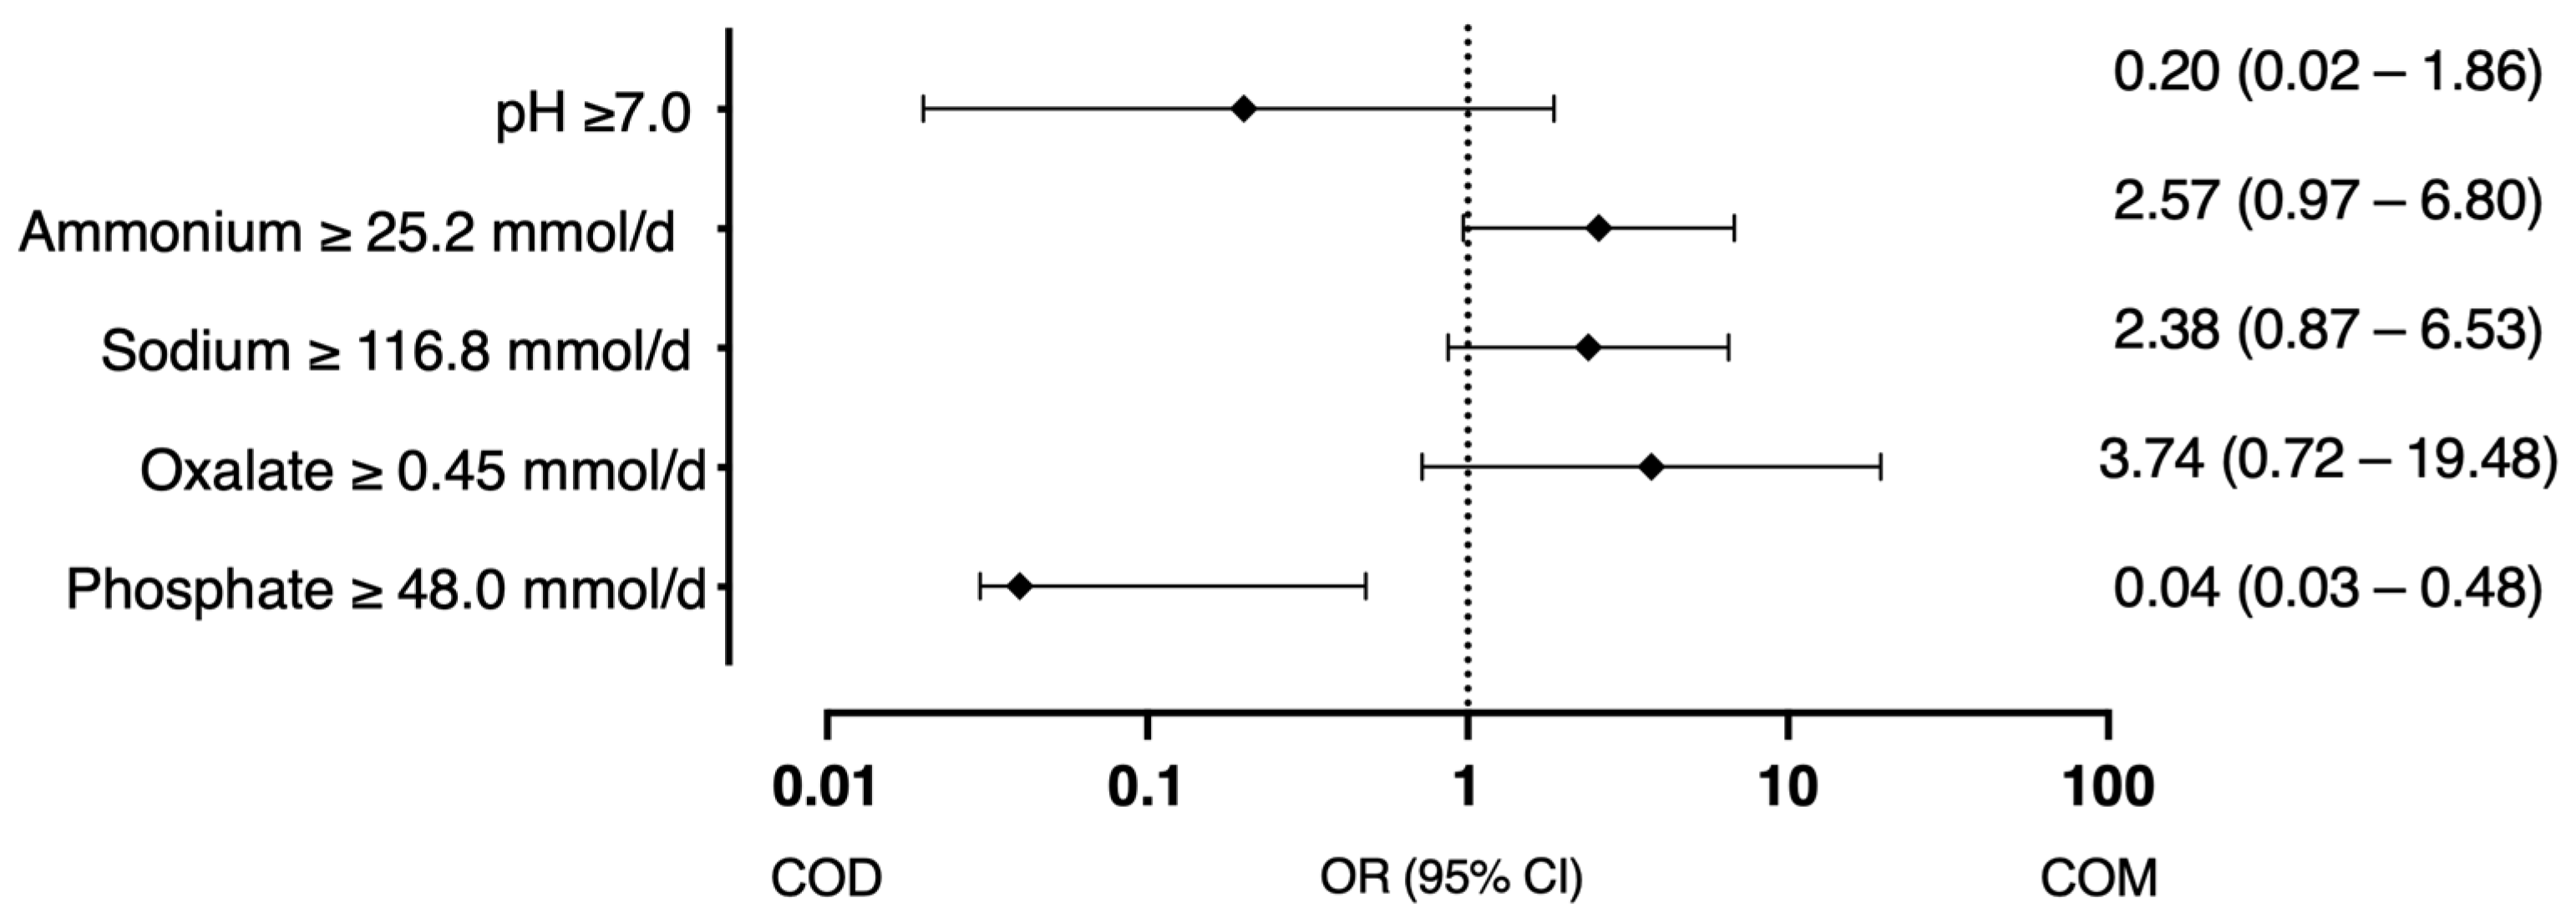
| Ammonium ≥ 25 mmol/d | 2.78 (1.13–6.87) | 0.0265 | 2.57 (0.97–6.80) | 0.0566 |
| Sodium ≥ 116.8 mmol/d | 2.85 (1.15–7.10) | 0.0240 | 2.38 (0.87–6.53) | 0.0925 |
| Oxalate ≥ 0.45 mmol/d | 3.06 (0.82–11.34) | 0.0945 | 3.74 (0.72–19.48) | 0.1175 |
| pH ≥ 7.0 | 0.11 (0.01–0.95) | 0.0450 | 0.20 (0.02–1.86) | 0.1583 |
| Phosphate ≥ 48.0 mmol/d | 0.17 (0.02–1.15) | 0.0692 | 0.04 (0.03–0.48) | 0.012 |
| Stone Composition | Cluster 1, (N = 41) | Cluster 2, (N = 51) | Cluster 3, (N = 6) | p-Level, (df = 2) |
|---|---|---|---|---|
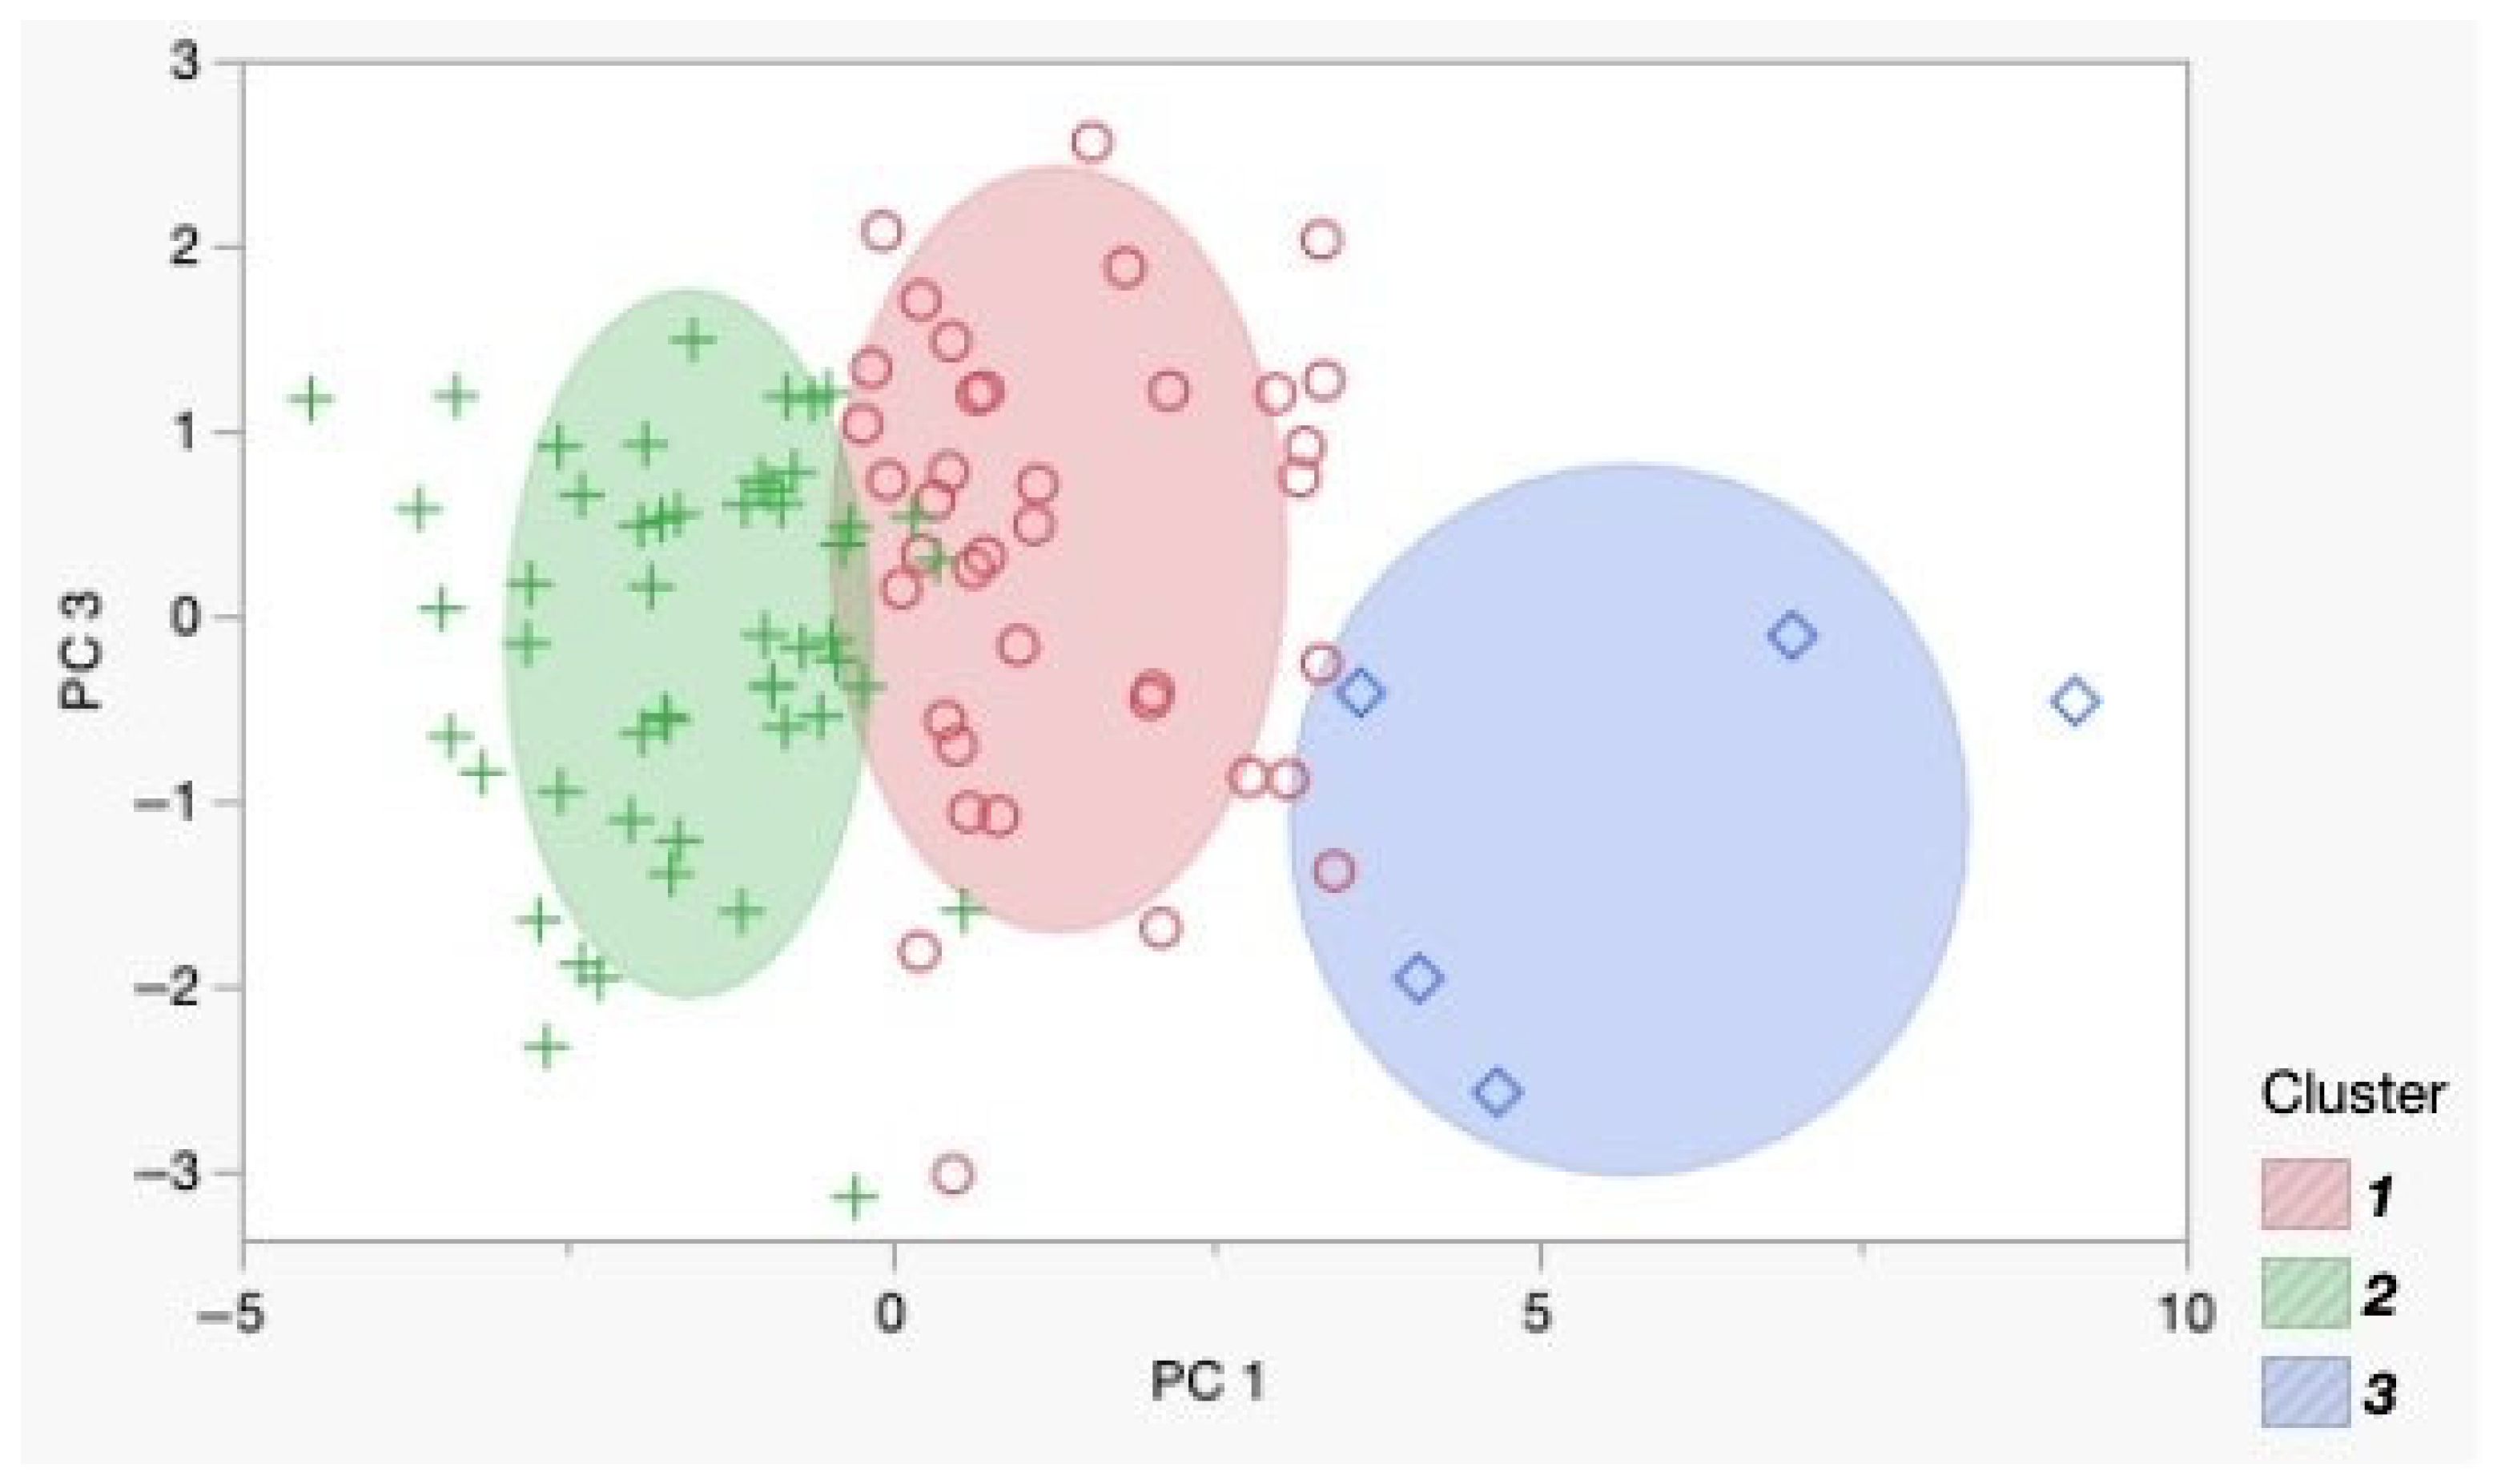
| COM | 33 (80.5%) | 34 (66.7%) | 2 (33.3%) | 0.0428 |
| COD | 8 (19.5%) | 17 (33.3%) | 4 (66.7%) |
| Variable | Me [LQ; UQ] (N = 41) 1 | Me [LQ; UQ] (N = 51) 2 | p-Level |
|---|---|---|---|
| PH Urine | 6.00 [6.00; 6.50] | 6.00 [6.00; 6.50] | 0.6294 |
| Ammonium mmol/d | 32.64 [25.46; 39.33] | 21.85 [14.78; 26.94] | <0.0001 |
| Sodium mmol/d | 237.44 [176.12; 278.95] | 103.50 [86.77; 128.49] | <0.0001 |
| Potassium mmol/d | 53.10 [40.92; 68.08] | 41.86 [33.74; 54.15] | 0.0063 |
| Magnesium mmol/d | 5.04 [3.70; 6.45] | 3.00 [2.33; 3.64] | <0.0001 |
| Calcium mmol/d | 6.97 [5.08; 9.24] | 4.63 [3.38; 6.92] | 0.0010 |
| Chloride mmol/d | 177.60 [151.68; 219.00] | 87.88 [71.68; 103.18] | <0.0001 |
| Nitrate mmol/d | 0.91 [0.44; 1.80] | 0.72 [0.44; 1.07] | 0.1275 |
| Sulfate mmol/d | 23.69 [18.20; 27.47] | 15.08 [11.29; 17.47] | <0.0001 |
| Fluoride mmol/d | 0.68 [0.54; 1.50] | 0.56 [0.27; 1.07] | 0.1778 |
| Phosphate mmol/d | 28.80 [25.47; 34.01] | 23.21 [17.62; 28.04] | <0.0001 |
| Citrate mmol/d | 1.90 [1.35; 2.80] | 2.08 [1.18; 3.07] | 0.7474 |
| Oxalate mmol/d | 0.40 [0.26; 0.56] | 0.25 [0.20; 0.33] | 0.0010 |
| Uric acid mmol/d | 3.82 [2.51; 5.33] | 2.94 [2.18; 3.66] | 0.0128 |
| Creatinine mmol/d | 15.10 [13.90; 17.95] | 11.00 [8.60; 12.60] | <0.0001 |
| Ox/Cr ratio | 0.02 [0.02; 0.03] | 0.02 [0.02; 0.03] | 0.9687 |
| Ph/Cr ratio | 1.85 [1.69; 2.40] | 2.09 [1.65; 2.69] | 0.2646 |
| LabCorp, mmol/24 h | EAU Guidelines, mmol/24 h | Tietz Textbook, mmol/24 h | |
|---|---|---|---|
| Calcium | male < 6.25/female < 5 | <5.0 | 0.1 mmol·kg |
| Oxalate | 0.2–0.45 | <0.5 | 0.2–0.4 |
| Citrate | male > 2.4/female > 2.9 | male > 1.7/female > 1.9 | male 0.6–4.8/female 1.3–6.0 |
| Uric Acid | male < 4.8/female < 4.2 | male < 5/female < 4 | 1.48–4.43 |
| Phosphorus | 20–40 | <35 | <32.3 |
Disclaimer/Publisher’s Note: The statements, opinions and data contained in all publications are solely those of the individual author(s) and contributor(s) and not of MDPI and/or the editor(s). MDPI and/or the editor(s) disclaim responsibility for any injury to people or property resulting from any ideas, methods, instructions or products referred to in the content. |
© 2025 by the authors. Licensee MDPI, Basel, Switzerland. This article is an open access article distributed under the terms and conditions of the Creative Commons Attribution (CC BY) license (https://creativecommons.org/licenses/by/4.0/).
Share and Cite
Gadzhiev, N.; Gelig, V.; Rodionov, G.; Gauhar, V.; Zeng, G. Metabolic Differences in 24-Hour Urine Parameters Between Calcium Oxalate Monohydrate and Dihydrate Kidney Stones: A Clinical Study. Diagnostics 2025, 15, 994. https://doi.org/10.3390/diagnostics15080994
Gadzhiev N, Gelig V, Rodionov G, Gauhar V, Zeng G. Metabolic Differences in 24-Hour Urine Parameters Between Calcium Oxalate Monohydrate and Dihydrate Kidney Stones: A Clinical Study. Diagnostics. 2025; 15(8):994. https://doi.org/10.3390/diagnostics15080994
Chicago/Turabian StyleGadzhiev, Nariman, Vitaliy Gelig, Gennadii Rodionov, Vineet Gauhar, and Guohua Zeng. 2025. "Metabolic Differences in 24-Hour Urine Parameters Between Calcium Oxalate Monohydrate and Dihydrate Kidney Stones: A Clinical Study" Diagnostics 15, no. 8: 994. https://doi.org/10.3390/diagnostics15080994
APA StyleGadzhiev, N., Gelig, V., Rodionov, G., Gauhar, V., & Zeng, G. (2025). Metabolic Differences in 24-Hour Urine Parameters Between Calcium Oxalate Monohydrate and Dihydrate Kidney Stones: A Clinical Study. Diagnostics, 15(8), 994. https://doi.org/10.3390/diagnostics15080994