Abstract
Background: Coronary angiography alone is insufficient to identify lesions associated with myocardial ischemia that may benefit from revascularization. Coronary physiology parameters may improve clinical decision making in addition to coronary angiography, but the association between 2D and 3D qualitative coronary angiography (QCA) and invasive pressure and flow measurements is yet to be elucidated. Methods: We associated invasive fractional flow reserve (FFR), coronary flow reserve (CFR) and coronary flow capacity (CFC) with 2D- and 3D-QCA in 430 intermediate lesions of 366 patients. Results: Overall, 2D-QCA analysis resulted in less severe stenosis severity compared with 3D-QCA analysis. FFR+/CFR− lesions had similar 3D-QCA characteristics as FFR+/CFR+ lesions. In contrast, vessels with FFR−/CFR+ discordance had 3D-QCA characteristics similar to those of vessels with concordant FFR−/CFR−. Contrarily, FFR+/CFR− lesions had CFC similar to that of as FFR-/CFR- lesions. Conclusions: Non-flow-limiting lesions (FFR+/CFR−) have 3D-QCA characteristics similar to those of FFR+/CFR+, but the majority are not associated with inducible myocardial ischemia as determined by invasive CFC. FFR−/CFR+ lesions have 3D-QCA characteristics similar to those of FFR−/CFR− lesions but are more frequently associated with a moderately to severely reduced CFC, illustrating the angiographic–functional mismatch in discordant lesions.
1. Introduction
Coronary angiography (CAG) has been well-documented to provide limited accuracy in identifying hemodynamically significant coronary stenosis [1,2,3,4,5]. For this purpose, contemporary clinical practice guidelines recommend invasive physiology assessment to identify functional stenosis severity using fractional flow reserve (FFR) or instantaneous wave-free ratio (iFR) when non-invasive evidence of ischemia is not available [6]. However, invasive assessment of FFR and iFR requires instrumentation of the coronary artery with sensor-equipped guide wires and is, therefore, more time-consuming and costly than sole angiographic assessment. Consequently, decision-making on coronary revascularization remains dominantly guided by visual estimation of stenosis severity by coronary angiography. Despite the well-documented mismatch between visual angiographic stenosis appearance and FFR values [7], two aspects deserve further evaluation. First, contemporary quantitative angiography analysis (QCA) allows 3-dimensional vessel reconstruction to provide more detail regarding anatomical stenosis severity, which may provide a better estimation of functional stenosis severity [8]. Second, FFR is known to be influenced by microvascular resistance, where, for a given stenosis, FFR increases with increasing microvascular resistance [9,10]. Therefore, a comparison with FFR alone may lead to erroneous conclusions regarding the ability of angiography to define functional stenosis severity. The combined assessment of coronary pressure and flow allows calculation of both FFR and coronary flow velocity reserve (CFR), which together provide more insight into the functional relevance of coronary artery disease. Moreover, these measurements allow the calculation of stenosis resistance indices and coronary flow capacity as robust markers of functional stenosis severity and vessel flow characteristics, respectively. Therefore, we sought to define the association of 3D-QCA angiographic stenosis characteristics and comprehensive invasive physiology using FFR/CFR agreement, as well as stenosis resistance and CFC.
2. Methods
2.1. Patient Population
Between June 2015 and November 2017, 456 patients were enrolled in the DEFINE-FLOW (Distal Evaluation of Functional performance with Intravascular sensors to assess the Narrowing Effect–combined pressure and Doppler Flow velocity measurements) study. For this sub analysis, 430 intermediate lesions of 366 patients with measurements with sufficient quality, as evaluated by an independent core lab, were analysed. This prospective, non-blinded, non-randomized, multi-centre trial enrolled subjects with at least one coronary lesion undergoing physiologic evaluation as per routine clinical practice. Rationale and design have been published elsewhere [11]. Briefly, subjects had to be 18 years or older at time of inclusion, with at least one epicardial stenosis of ≥50% diameter (by visual or quantitative assessment), in a native coronary artery, ≥2.5 mm reference diameter and supplying sufficiently viable myocardium. Important exclusion criteria were recent (within 3 weeks prior to cardiac catheterization) ST-segment elevation myocardial infarction (STEMI), a chronic total occlusion, prior coronary artery bypass grafting (CABG), left main coronary artery disease requiring revascularization, extremely tortuous or calcified coronary arteries, known severe left ventricle hypertrophy and planned need for cardiac surgery. A total of 12 centres in Europe and Japan with ample experience as proven by previously conducted Doppler flow studies in intracoronary Doppler flow velocity measurements recruited subjects. The trial was conducted in accordance with the Declaration of Helsinki and all applicable local regulations. Every subject gave written informed consent prior to enrolment.
2.2. Cardiac Catheterization and Physiological Assessment
Intracoronary 100 to 300 µg nitroglycerin was administered at the beginning of the procedure, repeated every 30 min if indicated, to avoid catheter or wire induced coronary spasm and minimize flow-mediated dilation. After diagnostic angiography, a 0.014′′ dual pressure and Doppler flow velocity sensor guidewire (ComboWire XT; Philips Volcano, San Diego, CA, USA) was zeroed at atmospheric pressure and calibrated to aortic pressure at the ostium of the guiding catheter. Subsequently, the guidewire was positioned at least five vessel diameters distal to the lesion. Before inducing hyperemia, a stable flow signal was obtained and the position of the guidewire was documented fluoroscopically. Hyperemia was induced by an intracoronary bolus of 100 µg adenosine for both left and right coronary arteries, followed by a flush of saline [12,13]. Measurements were repeated at least once using the same dose of adenosine. An independent corelab assessed the quality of pressure and flow, and solely corelab approved measurements were used in the present sub study. At the end of the procedure, the guidewire was returned to the guiding catheter to assess pressure drift, where Pd/Pa ± 0.02 triggered re-assessment. FFR was calculated as the mean distal (Pd) to aortic pressure (Pa) during hyperemia, and CFR was calculated as the ratio of hyperemic average peak flow velocity (APV) by baseline APV. FFR ≤ 0.8 and CFR < 2.0 were considered abnormal (Table 1). Normal CFC was defined as a CFR ≥ 2.8 and hAPV of ≥49.0 cm/s. Mildly reduced CFC was defined as a CFR < 2.8 but > 2.1 and hAPV of <49.0 but >33.0 cm/s. Moderately reduced CFC was defined as CFR ≤ 2.1 and > 1.7, and hAPV ≤ 33.0 and > 26.0 cm/s. Finally, severely reduced CFC was defined as a CFR ≤ 1.7, and hAPV ≤ 26.0 cm/s [14]. Normal to mildly reduced CFC was considered normal, whereas moderately and severely reduced CFC were considered abnormal.

Table 1.
Abbreviations of different subgroups determined by FFR and CFR.
2.3. Quantitative Coronary Angiography
Three-dimensional quantitative coronary angiography (3D-QCA) was performed by three blinded physicians (JW, MSH and HMR) at the Interventional Coronary Imaging Core Laboratory; Aarhus University Hospital, Skejby, Aarhus, Denmark and Hospital Clinico San Carlos, Madrid, Spain using QAngio XA (Medis Medical Imaging Systems bv., Leiden, The Netherlands). If 3D-QCA was not feasible, 2D-QCA was used. 3D-QCA analysis was performed based on automated calibration using two images ≥ 25° separated. 2D-QCA was performed based on catheter calibration using the angiographic view with best exposure of the lesion severity. The same algorithms were used for vessel edge detection. Lesions were stratified according to the SYNTAX classification: right coronary artery (RCA–segments 1, 2, 3), left anterior descending artery (LAD–segments 6, 7 and 8) and the left circumflex artery (LCX–segments 11, 12 and 13). Angiographic diameter stenosis (DS), minimal lumen diameter (MLD), area stenosis (AS), lesion length and reference diameter were reported.
2.4. Statistical Analysis
All analyses were performed on the lesion level, except for baseline patient characteristics. Normality of the data was tested using the Shapiro–Wilk test. Continuous variables are presented as median (Q1, Q3) or frequency (percentage), where appropriate. Categorical variables are presented as proportions and were analysed with a chi-square test. Angiographic lesion severity per category and the respective FFR and CFR value of each specific lesion were plotted in a box-and-whisker plot to show the degree of dispersion and skewness in the data and to identify potential outliers. The box-and-whisker plots were created with GraphPad Prism version 8.3.0 (GraphPad Software Inc., La Jolla, CA, USA). A Kruskal–Wallis test with pairwise post hoc Bonferroni correction for multiple comparisons was performed to identify baseline and QCA differences between groups. QCA-derived DS was compared to per-procedural visual estimated DS. An independent samples T-test was used to compare 2D- with 3D-QCA analysis within the four groups based on FFR and CFR. A p value < 0.05 was considered statistically significant. All statistical analyses were performed in STATA version 15.1 (StataCorp, College Station, TX, USA).
3. Results
3.1. Patient and Lesion Characteristics
Baseline patient characteristics (n = 366) are shown in Table 2. The mean age was 67 ± 10.1 years, 74% were male, and the majority of interrogated vessels comprised the LAD (66%). Overall mean FFR was 0.82 ± 0.1, and overall mean CFR was 2.3 ± 0.7. There was no significant difference in proximal, mid or distal lesions between FFR/CFR groups (p > 0.05). Patients with FFR+/CFR− were significantly younger compared with patients with FFR−/CFR+: mean age 64.8 ± 10.6 versus 68.8 ± 10.8 years (p = 0.021).
Table 2.
Baseline clinical characteristics.
3.2. Percentage Diameter Stenosis by Visual Estimation
For a total of 381 lesions, angiographic visually estimated DS was available: 62% (n = 238) were categorized 40–70% DS, 30% (n = 113) were categorized 70–90% DS, and 8% (n = 30) were categorized ≥ 90% DS. Figure 1 shows the dispersion of FFR and CFR values in the three DS categories as visually estimated during CAG.
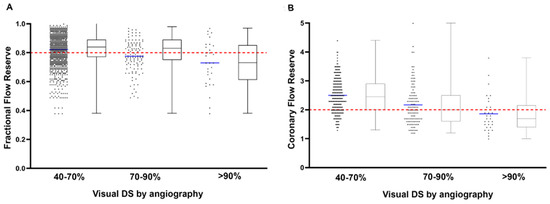
Figure 1.
Box-and-whisker and scatter plots showing the FFR (A) and CFR (B) values of all lesions in the category of DS 50–70%, DS 70–90% and DS > 90% as determined by visual estimation during coronary angiography. The red dashed horizontal lines represent clinical cut-off values of FFR (≤0.80) and CFR (<2.0).
3.3. Comparison of 2D- versus 3D-QCA Analysis
Table 3 details clinical and angiographic characteristics for all four FFR/CFR groups. Overall, 2D-QCA resulted in lower stenosis severity as determined by DS%, lesion length, MLD and mean RLD compared with 3D-QCA. FFR+/CFR+ lesions were more severely narrowed as determined by DS%, MLD and area stenosis compared with the other groups, both for 2D- and 3D-QCA analysis (mean 3D QCA-DS 54 ± 7.3% versus 59 ± 9.5%, median MLD 0.8 mm (0.6, 1.1) and median area stenosis 82% (70.8, 85.3)). Lesion length was not different between groups for both 2D-QCA and 3D-QCA analysis (p = 0.27, and p = 0.30, respectively), but within each group lesion length was significantly longer for 3D-QCA versus 2D-QCA analysis (p < 0.005 for all FFR/CFR groups).
Table 3.
Clinical and angiographic parameters in 430 intermediate coronary lesions.
3.4. 3D-QCA versus Functional Stenosis Characteristics across FFR/CFR Groups
3D-QCA analysis revealed that vessels with FFR+/CFR− discordance had 3D-QCA characteristics similar to those of vessels with concordant FFR+/CFR+: mean 3D-QCA DS% 61 ± 11.1% versus 53 ± 11.6% and median 3D-QCA AS% 73.3% (60.6, 81.2) versus 82% (70.8, 85.3) (p > 0.05 for all), with the exception of 3D-QCA MLD (0.8 (0.6, 1.1) versus 1.2 mm (0.9, 1.5)) (p < 0.05). Vessels with FFR−/CFR+ discordance had 3D-QCA characteristics similar to those of vessels with concordant FFR−/CFR−: mean 3D-QCA DS% 44 ± 10.3% versus 43 ± 13.1%, median 3D-QCA MLD 1.4 mm (1.2, 1.7) and 1.5 mm (1.2, 1.8) and median 3D-QCA AS% 62.9% (53, 71.3) versus 61.9% (50.3, 72.3) (p > 0.05 for all) (Table 2). Of note, FFR+/CFR− had the longest 3D-QCA lesion length (p < 0.001): median 23.4 mm (13.3, 29.6), similar to FFR+/CFR+ lesions: median 17.9 mm (13.7, 26.7), whereas FFR−/CFR+ lesions had the shortest lesion length, similar to FFR−/CFR− lesions: median 13.4 mm (9.2, 20.6) versus 16.3 mm (10.4, 23) (p > 0.05 for all). Overall, only FFR+/CFR+ lesions had significantly lower 3D-QCA mean RLD compared with FFR−/CFR− lesions (p = 0.001). Compared with the other groups, 3D-QCA mean RLD was higher for FFR−/CFR+ and FFR−/CFR− lesions (median 2.7 mm (2.3, 3) versus 2.7 mm (2.4, 3.2), p = 0.081) compared with FFR+/CFR+ and FFR+/CFR+ lesions (median 2.5 mm (2.3, 2.7) versus 2.3 mm (2.1, 2.6), p = 0.092).
3.5. Association of FFR, CFR and CFC
Figure 2 shows the distribution of CFC categories across the FFR/CFR groups. FFR+/CFR− lesions had normal to mildly reduced CFC similar to that of FFR−/CFR− lesions: 95% (n = 77) versus 94% (n = 202) (p > 0.05). Despite the lower stenosis severity as assessed by 3D-QCA, FFR−/CFR+ lesions more frequently were associated with a moderately to severely reduced CFC compared with FFR+/CFR− lesions: 56% (n = 34) versus 5% (n = 4) (p < 0.001). The majority of FFR+/CFR+ lesions (77%, n = 55) had a moderately to severely reduced CFC, but still 23% (n = 16) of lesions were associated with a normal to mildly reduced CFC.
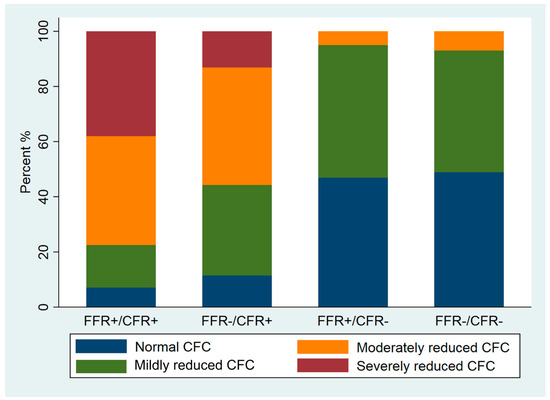
Figure 2.
Stack bar graph of CFC frequency in all four FFR/CFR groups.
4. Discussion
This prospective cohort study is one of the first assessing the difference between 2D- and 3D-QCA analysis in angiographic intermediate lesions with combined pressure and flow measurements. Non-flow-limiting lesions (FFR+/CFR−) had 3D-QCA characteristics similar to those of FFR+/CFR+, but the majority were not associated with inducible myocardial ischemia as determined by invasive CFC. FFR−/CFR+ lesions had 3D-QCA characteristics similar to those of FFR−/CFR− lesions, but were more frequently associated with a moderately to severely reduced CFC, illustrating the angiographic–functional mismatch in discordant lesions.
4.1. Association of 3D-QCA and FFR/CFR Discordance
The visual–functional mismatch between coronary angiography and FFR has been acknowledged in previous studies, showing a large dispersion of FFR values, especially in angiographic intermediate lesions [15,16,17]. This was confirmed by the present study for both FFR and CFR, as there was a poor correlation between visual DS and invasively assessed FFR and CFR values (Figure 1). Despite the limitations of coronary angiography in assessing lesion severity [18], angiography still remains the cornerstone of decision-making in revascularization, as adoption of coronary physiology parameters in clinical practice is low [19,20].
Aside from lesion-specific characteristics such as QCA DS%, MLD and mean RLD, several clinical factors, such as age and sex, and physiological factors are known to contribute to the visual–functional mismatch [17,21,22]. Yonetsu et al. assessed the visual–functional mismatch between 2D-QCA, FFR, CFR and the index of microcirculatory resistance in 849 lesions of 532 patients and found LAD lesions, greater QCA DS%, lower QCA mean RLD, lower CFR and lower index of microcirculatory resistance as predictors of mismatch (DS > 50% and FFR > 0.80), and lower QCA-DS, shorter QCA lesion length, greater QCA mean RLD, higher CFR and higher index of microcirculatory resistance as predictors of reverse mismatch (DS ≤ 50% and FFR ≤ 0.80). In the present study, the main QCA-derived characteristics of FFR+/CFR− or non-flow-limiting lesions were higher 3D-QCA DS%, greater MLD and longer lesion length versus FFR−/CFR+ or “flow limiting” lesions (FFR+/CFR+), which were associated with a lower 3D-QCA DS%, lower AS and shorter lesion length. We did not find a significant difference in the number of LAD lesions across the FFR/CFR groups, although other studies report the highest percentage of mismatch in LAD lesions, potentially since LAD lesions supply the largest myocardial perfusion area compared with the other vessels [23]. Nonetheless, the study by Yonetsu et al. identified the impact of CFR both on mismatch and reverse mismatch. The present study confirms but also strengthens the important role of CFR in the visual–functional mismatch between FFR, angiography and inducible myocardial ischemia: despite the 3D-QCA characteristics associated with greater stenosis severity, non-flow-limiting FFR+/CFR− lesions in the present study had preserved coronary flow as determined by CFR values above the clinical cut-off value of ≥2.0. Since coronary flow is a critical determinant of myocardial ischemia [24], non-flow-limiting lesions have a benign long-term prognosis, whereas flow-limiting lesions are associated with a higher risk of MACE [25]. Although the benefit of FFR-guided PCI over angiography-guided PCI has been established for alleviation of angina and improvement in quality of life [26], non-flow-limiting FFR+/CFR− lesions in the present study were not associated with flow abnormalities despite their angiographic severity. This may explain why in large FFR-guided clinical studies, such as the DEFER and FAME studies, a significant proportion of patients with FFR > 0.80 required revascularization within 5 years of follow-up, and 70% of patients with FFR ≤ 0.80 did suffer from MACE and 50% required repeated revascularization [27,28]. These findings suggest that combined pressure and flow measurement can more accurately identify lesions associated with impaired coronary flow compared with angiography and pressure assessment alone. Novel developments in stenosis severity assessment, such as quantitative flow ratio (QFR) using FFR as the reference standard [29], should be evaluated in this light to accurately identify their diagnostic characteristics versus comprehensive physiological assessment.
4.2. Association of CFC with FFR/CFR Discordance
CFC constitutes a relatively novel physiological parameter based on hyperemic flow and CFR, which has important diagnostic and prognostic value [14,30,31]. Moreover, CFC was found to be a better predictor of MACE than CFR, and the risk of MACE decreases significantly after revascularization of lesions associated with a severely reduced CFC [31]. Despite the similar 3D-QCA angiographic characteristics in this study of non-flow-limiting FFR+/CFR− and FFR+/CFR− lesions, invasive flow assessment revealed that the majority of non-flow-limiting lesions have a normal to mildly reduced CFC comparable with FFR−/CFR− lesions. Hence, the majority of FFR+/CFR− lesions may be deemed severe by angiographic parameters, but are not associated with abnormal coronary flow characteristics as determined by CFC [32].
Contrarily, lesions with FFR−/CFR+ show CFC with a higher incidence of moderate to severe CFC that is line with earlier observations that these lesions are more likely to benefit from intervention. Finally, the highest incidence of moderate to severe CFC occurs in FFR+/CFR+ lesions, illustrating the usefulness of CFC for clinical decision making.
4.3. Clinical Implications
Although the poor correlation between quantitative angiography and invasive coronary physiology has been well-documented [33,34], the clinical adoption of coronary physiological parameters worldwide is still relatively low. The present study shows that there are differences between 2D-QCA and 3D-QCA. Coronary lesion severity is less by 2D-QCA analysis as compared to 3D-QCA analysis. The lowest MLD by 3D-QCA analysis is in the group with FFR+/CFR+, which may indicate that MLD can be used as a parameter of ischemia as determined by CFC. However, Figure 2 illustrates that the MLD in the other lesion groups does not reflect functional lesion severity as determined by CFC. For example, the majority of FFR+/CFR− lesions, angiographically apparently severe lesions by 3D-QCA, are associated with a normal or mildly reduced CFC that illustrates the angiographic and functional mismatch, also by using 3D-QCA analysis. Coronary physiology measurements, and CFR in particular, have important additional value in guiding clinical decision making in addition to quantitative coronary angiography alone.
4.4. Limitations
First, this prospective non-randomized cohort study was not powered for the present analysis, but is the largest analysis of the visual–functional mismatch in FFR and CFR to date. Randomized clinical trials are needed to confirm the findings of the present study. Second, solely corelab approved measurements with sufficient pressure and flow quality signals were included in this analysis, since reliable FFR and CFR values were important for correct classification in the different groups.
5. Conclusions
Non-flow-limiting lesions with FFR+/CFR− have 3D-QCA characteristics similar to those of FFR+/CFR+ lesions, but the majority are not associated with reversible ischemia as determined by invasive CFC. Contrarily, FFR−/CFR+ lesions have 3D-QCA characteristics similar to those of FFR−/CFR− lesions, but are more frequently associated with reversible ischemia as determined by CFC.
Author Contributions
All authors contributed significantly to the manuscript: V.S., J.W., C.B., M.S.-H., A.E., H.M.-R., M.C.-M., N.V.R., H.M., M.N., M.S., E.C., T.V.d.H. and J.P. were involved in conception and design or analysis and interpretation of data, or both, and in drafting of the manuscript or revising it critically for important intellectual content. V.S., J.W., C.B., T.V.d.H. and J.P. were involved in drafting of the manuscript or revising it critically for important intellectual content. All authors have read and agreed to the published version of the manuscript.
Funding
DEFINE-FLOW is an investigator-initiated trial funded by an unrestricted grant from Philips Volcano with additional funding from the Weatherhead PET Imaging Center at the University of Texas Health Science Center in Houston.
Institutional Review Board Statement
18 December 2014; METC AMC; ClinicalTrials.gov NCT02328820.
Informed Consent Statement
Every subject gave written informed consent prior to enrolment.
Acknowledgments
We gratefully acknowledge the staff of the participating centers for their efforts.
Conflicts of Interest
J.J.P. received significant institutional research support from Philips Volcano Corporation for this study. T.P.H. and J.J.P. report consultancy fees from Philips-Volcano. M.S. received institutional research support from the University of Texas Health Science Center in Houston (for the DEFINE-FLOW study). V.E.S., M.C.M.: declaration of interest: none.
References
- De Bruyne, B.; Fearon, W.F.; Pijls, N.H.; Barbato, E.; Tonino, P.; Piroth, Z.; Jagic, N.; Mobius-Winckler, S.; Rioufol, G.; Witt, N.; et al. Fractional Flow Reserve—Guided PCI for Stable Coronary Artery Disease. N. Engl. J. Med. 2014, 371, 1208–1217. [Google Scholar] [CrossRef] [PubMed] [Green Version]
- Pijls, N.H.; de Bruyne, B.; Peels, K.; van der Voort, P.H.; Bonnier, H.J.; Bartunek, J.; Koolen, J.J. Measurement of fractional flow reserve to assess the functional severity of coronary-artery stenoses. N. Engl. J. Med. 1996, 334, 1703–1708. [Google Scholar] [CrossRef] [PubMed]
- Pijls, N.H.; Van Gelder, B.; Van der Voort, P.; Peels, K.; Bracke, F.A.; Bonnier, H.J.; El Gamal, M.I. Fractional flow reserve: A useful index to evaluate the influence of an epicardial coronary stenosis on myocardial blood flow. Circulation 1995, 92, 3183–3193. [Google Scholar] [CrossRef] [PubMed]
- Shaw, L.J.B.D.; Maron, D.J.; Mancini, G.B.; Hayes, S.W.; Hartigan, P.M.; Weintraub, W.S.; O’Rourke, R.A.; Dada, M.; Spertus, J.A.; COURAGE Investigators; et al. Optimal medical therapy with or without percutaneous coronary intervention to reduce ischemic burden: Results from the Clinical Outcomes Utilizing Revascularization and Aggressive Drug Evaluation (COURAGE) trial nuclear substudy. Circulation 2008, 10, 1283–1291. [Google Scholar] [CrossRef] [PubMed] [Green Version]
- Tonino, P.A.L.; De Bruyne, B.; Pijls, N.H.J.; Siebert, U.; Ikeno, F.; van’t Veer, M.; Klauss, V.; Manoharan, G.; Engstrøm, T.; Oldroyd, K.G.; et al. Fractional flow reserve versus angiography for guiding percutaneous coronary intervention. N. Engl. J. Med. 2009, 360, 213–224. [Google Scholar] [CrossRef] [PubMed] [Green Version]
- Neumann, F.J.; Sousa-Uva, M.; Ahlsson, A.; Alfonso, F.; Banning, A.P.; Benedetto, U.; Byrne, R.A.; Collet, J.P.; Falk, V. 2018 ESC/EACTS Guidelines on myocardial revascularization. Eur. Heart J. 2019, 55, 84–90. [Google Scholar]
- Nijjer, S.S.; de Waard, G.A.; Sen, S.; van de Hoef, T.P.; Petraco, R.; Echavarría-Pinto, M.; van Lavieren, M.A.; Meuwissen, M.; Danad, I.; Knaapen, P.; et al. Coronary pressure and flow relationships in humans: Phasic analysis of normal and pathological vessels and the implications for stenosis assessment: A report from the Iberian-Dutch-English (IDEAL) collaborators. Eur Heart J. 2016, 37, 2069–2080. [Google Scholar] [CrossRef] [Green Version]
- Tu, S.; Huang, Z.; Koning, G.; Cui, K.; Reiber, J.H.C. A novel three-dimensional quantitative coronary angiography system: In vivo comparison with intravascular ultrasound for assessing arterial segment length. Catheter. Cardiovasc. Interv. 2010, 76, 291–298. [Google Scholar] [CrossRef]
- Meuwissen, M.; Chamuleau, S.A.; Siebes, M.; Schotborgh, C.E.; Koch, K.T.; de Winter, R.J.; Bax, M.; de Jong, A.; Spaan, J.A.; Piek, J.J. Role of variability in microvascular resistance on fractional flow reserve and coronary blood flow velocity reserve in intermediate coronary lesions. Circulation 2001, 103, 184–187. [Google Scholar] [CrossRef] [Green Version]
- Verhoeff, B.J.; van de Hoef, T.P.; Spaan, J.A.; Piek, J.J.; Siebes, M. Minimal effect of collateral flow on coronary microvascular resistance in the presence of intermediate and noncritical coronary stenoses. Am. J. Physiol. Heart Circ. Physiol. 2012, 303, 422–428. [Google Scholar] [CrossRef] [PubMed] [Green Version]
- Stegehuis, V.E.; Wijntjens, G.W.; van de Hoef, T.P.; Casadonte, L.; Kirkeeide, R.L.; Siebes, M.; Spaan, J.A.; Gould, K.L.; Johnson, N.P.; Piek, J. Distal Evaluation of Functional performance with Intravascular sensors to assess the Narrowing Effect—Combined pressure and Doppler FLOW velocity measurements (DEFINE-FLOW) trial: Rationale and trial design. Am. Heart J. 2019, 222, 139–146. [Google Scholar] [CrossRef] [PubMed]
- Adjedj, J.; Toth, G.G.; Johnson, N.P.; Pellicano, M.; Ferrara, A.; Floré, V.; Di-Gioia, G.; Barbato, E.; Muller, O.; De Bruyne, B. TCT-293 Intracoronary Adenosine: Dose-Response Relationship with Hyperemia. J. Am. Coll. Cardiol. 2015, 66, B115–B116. [Google Scholar] [CrossRef]
- Toth, G.G.; Johnson, N.P.; Jeremias, A.; Pellicano, M.; Vranckx, P.; Fearon, W.F.; Barbato, E.; Kern, M.J.; Pijls, N.H.J.; de Bruyne, B. Standardization of Fractional Flow Reserve Measurements. J. Am. Coll. Cardiol. 2016, 68, 742–753. [Google Scholar] [CrossRef] [PubMed]
- van de Hoef, T.P.; Echavarría-Pinto, M.; van Lavieren, M.A.; Meuwissen, M.; Serruys, P.W.J.C.; Tijssen, J.P.; Pocock, S.J.; Escaned, J.; Piek, J.J. Diagnostic and Prognostic Implications of Coronary Flow Capacity: A Comprehensive Cross-Modality Physiological Concept in Ischemic Heart Disease. JACC Cardiovasc. Interv. 2015, 8, 1670–1680. [Google Scholar] [CrossRef] [PubMed]
- Tonino, P.A.; Fearon, W.F.; De Bruyne, B.; Oldroyd, K.G.; Leesar, M.A.; Lee, P.N.V.; MacCarthy, P.A.; Veer, M.V.; Pijls, N.H. Angiographic Versus Functional Severity of Coronary Artery Stenoses in the FAME Study: Fractional Flow Reserve Versus Angiography in Multivessel Evaluation. J. Am. Coll. Cardiol. 2010, 55, 2816–2821. [Google Scholar] [CrossRef] [PubMed] [Green Version]
- Toth, G.; Hamilos, M.; Pyxaras, S.; Mangiacapra, F.; Nelis, O.; De Vroey, F.; Di Serafino, L.; Muller, O.; Van Mieghem, C.; Wyffels, E.; et al. Evolving concepts of angiogram: Fractional flow reserve discordances in 4000 coronary stenoses. Eur. Heart J. 2014, 35, 2831–2838. [Google Scholar] [CrossRef] [Green Version]
- Watanabe, H.; Onishi, K.; Kakehi, K.; Takase, T.; Yamaji, K.; Ueno, M.; Kobuke, K.; Miyazaki, S.; Iwanaga, Y. Clinical and angiographic factors predicting fractional flow reserve and explaining the visual–functional mismatch in patients with intermediate coronary artery stenosis. Coron. Artery Dis. 2020, 31, 73–80. [Google Scholar] [CrossRef]
- Patel, M.R.; Peterson, E.D.; Dai, D.; Brennan, J.M.; Redberg, R.F.; Anderson, H.V. Low diagnostic yield of elective coronary angiography. N. Engl. J. Med. 2010, 362, 886–895. [Google Scholar] [CrossRef] [Green Version]
- Levine, G.N.; Bates, E.R.; Blankenship, J.C.; Bailey, S.R.; Bittl, J.A.; Cercek, B.; Chambers, C.E.; Ellis, S.G.; Guyton, R.A.; Hollenberg, S.M. 2011 ACCF/AHA/SCAI Guideline for Percutaneous Coronary Intervention: Executive summary: A report of the American College of Cardiology Foundation/American Heart Association Task Force on Practice Guidelines and the Society for Cardiovascular Angiography and Interventions. Circulation 2011, 124, 2574–2609. [Google Scholar]
- Pothineni, N.V.; Shah, N.N.; Rochlani, Y.; Nairooz, R.; Raina, S.; Leesar, M.A.; Uretsky, B.F.; Hakeem, A.U.S. Trends in Inpatient Utilization of Fractional Flow Reserve and Percutaneous Coronary Intervention. J. Am. Coll. Cardiol. 2016, 67, 732–733. [Google Scholar] [CrossRef]
- Park, S.J.; Kang, S.J.; Ahn, J.M.; Shim, E.B.; Kim, Y.T.; Yun, S.C.; Song, H.; Lee, J.; Kim, W.; Park, D.; et al. Visual-Functional Mismatch Between Coronary Angiography and Fractional Flow Reserve. JACC Cardiovasc. Interv. 2012, 5, 1029–1036. [Google Scholar] [CrossRef] [PubMed] [Green Version]
- Yonetsu, T.; Murai, T.; Kanaji, Y.; Lee, T.; Matsuda, J.; Usui, E.; Hoshino, M.; Araki, M.; Niida, T.; Hada, M.; et al. Significance of Microvascular Function in Visual—Functional Mismatch Between Invasive Coronary Angiography and Fractional Flow Reserve. J. Am. Heart Assoc. 2017, 6, e005916. [Google Scholar] [CrossRef] [PubMed]
- Echavarria-Pinto, M.; van de Hoef, T.P.; Nijjer, S.; Gonzalo, N.; Nombela-Franco, L.; Ibañez, B.; Sen, S.; Petraco, R.; Jimenez-Quevedo, P.; Nuñez-Gil, I.J.; et al. Influence of the amount of myocardium subtended to a coronary stenosis on the index of microcirculatory resistance. Implications for the invasive assessment of microcirculatory function in ischaemic heart disease. EuroInterv. J. Eur. Collab. Work. Group Interv. Cardiol. Eur. Soc. Cardiol. 2017, 13, 944–952. [Google Scholar] [CrossRef] [PubMed]
- Heusch, G. Myocardial ischemia: Lack of coronary blood flow, myocardial oxygen supply-demand imbalance, or what? Am. J. Physiol. Heart Circ. Physiol. 2019, 316, H1439–H1446. [Google Scholar] [CrossRef] [PubMed]
- van de Hoef, T.P.; van Lavieren, M.A.; Damman, P.; Delewi, R.; Piek, M.A.; Chamuleau, S.A. Physiological basis and long-term clinical outcome of discordance between fractional flow reserve and coronary flow velocity reserve in coronary stenoses of intermediate severity. Circ. Cardio-Vasc. Interv. 2014, 7, 301–311. [Google Scholar] [CrossRef] [PubMed] [Green Version]
- Nishi, T.; Piroth, Z.; De Bruyne, B.; Jagic, N.; Möbius-Winkler, S.; Kobayashi, Y.; Derimay, F.; Fournier, S.; Barbato, E.; Tonino, P.; et al. Fractional Flow Reserve and Quality-of-Life Improvement After Percutaneous Coronary Intervention in Patients With Stable Coronary Artery Disease. Circulation 2018, 138, 1797–1804. [Google Scholar] [CrossRef]
- Pijls, N.H.; van Schaardenburgh, P.; Manoharan, G.; Boersma, E.; Bech, J.W.; van’t Veer, M.; Bär, F.; Hoorntje, J.; Koolen, J.; Wijns, W.; et al. Percutaneous coronary intervention of functionally nonsignificant stenosis: 5-year follow-up of the DEFER Study. J. Am. Coll. Cardiol. 2007, 49, 2105–2111. [Google Scholar] [CrossRef] [Green Version]
- Xaplanteris, P.; Fournier, S.; Pijls, N.H.; Fearon, W.F.; Barbato, E.; Tonino, P.A.; Engstrøm, T.; Kääb, S.; Dambrink, J.-H.; Rioufol, G.; et al. Five-Year Outcomes with PCI Guided by Fractional Flow Reserve. N. Engl. J. Med. 2018, 379, 250–259. [Google Scholar] [CrossRef]
- Xu, B.; Tu, S.; Qiao, S.; Qu, X.; Chen, Y.; Yang, J.; Guo, L.; Sun, Z.; Tian, F.; Fang, W.; et al. Diagnostic Accuracy of Angiography-Based Quantitative Flow Ratio Measurements for Online As-sessment of Coronary Stenosis. J. Am. Coll. Cardiol. 2017, 70, 3077–3087. [Google Scholar] [CrossRef]
- Gould, K.L.; Johnson, N.P.; Roby, A.E.; Nguyen, T.T.; Kirkeeide, R.L.; Haynie, M.; Lai, D.; Zhu, H.; Patel, M.B.; Smalling, R.W.; et al. Regional, Artery-Specific Thresholds of Quantitative Myocardial Perfusion by PET Associated with Reduced Myocardial Infarction and Death After Revascularization in Stable Coronary Artery Disease. J. Nucl. Med. 2018, 60, 410–417. [Google Scholar] [CrossRef]
- Gould, K.L.; Kitkungvan, D.; Johnson, N.P.; Nguyen, T.; Kirkeeide, R.; Bui, L.; Patel, M.B.; Roby, A.E.; Madjid, M.; Zhu, H.; et al. Mortality Prediction by Quantitative PET Perfusion Expressed as Coronary Flow Capacity With and Without Revascularization. JACC Cardiovasc. Imaging 2020, 14, 1020–1034. [Google Scholar] [CrossRef] [PubMed]
- Gould, K.L.; Johnson, N.P.; Bateman, T.M.; Beanlands, R.S.; Bengel, F.M.; Bober, R.; Camici, P.G.; Cerqueira, M.D.; Chow, B.J.W.; di Carli, M.F.; et al. Anatomic versus physiologic assessment of coronary artery disease. Role of coronary flow reserve, fractional flow reserve, and positron emission tomography imaging in revascularization decision-making. J. Am. Coll. Cardiol. 2013, 62, 1639–1653. [Google Scholar] [CrossRef] [PubMed] [Green Version]
- Piek, J.J.; Boersma, E.; di Mario, C.; Schroeder, E.; Vrints, C.; Probst, P.; Serruys, P.W. Angiographical and Doppler flow-derived parameters for assessment of coronary lesion severity and its relation to the result of exercise electrocardiography. Eur. Heart J. 2000, 21, 466–474. [Google Scholar] [CrossRef] [PubMed] [Green Version]
- Kern, M.J.; de Bruyne, B.; Pijls, N.H. From Research to Clinical Practice: Current Role of Intracoronary Physiologically Based Decision Making in the Cardiac Catheteriza-tion Laboratory. J. Am. Coll Cardiol. 1997, 30, 613–620. [Google Scholar] [CrossRef]
Publisher’s Note: MDPI stays neutral with regard to jurisdictional claims in published maps and institutional affiliations. |
© 2022 by the authors. Licensee MDPI, Basel, Switzerland. This article is an open access article distributed under the terms and conditions of the Creative Commons Attribution (CC BY) license (https://creativecommons.org/licenses/by/4.0/).