
Hypertriglyceridaemia-Induced Acute Pancreatitis: A Different Disease Phenotype


 ,
, 
Abstract
:1. Introduction
2. Materials and Methods
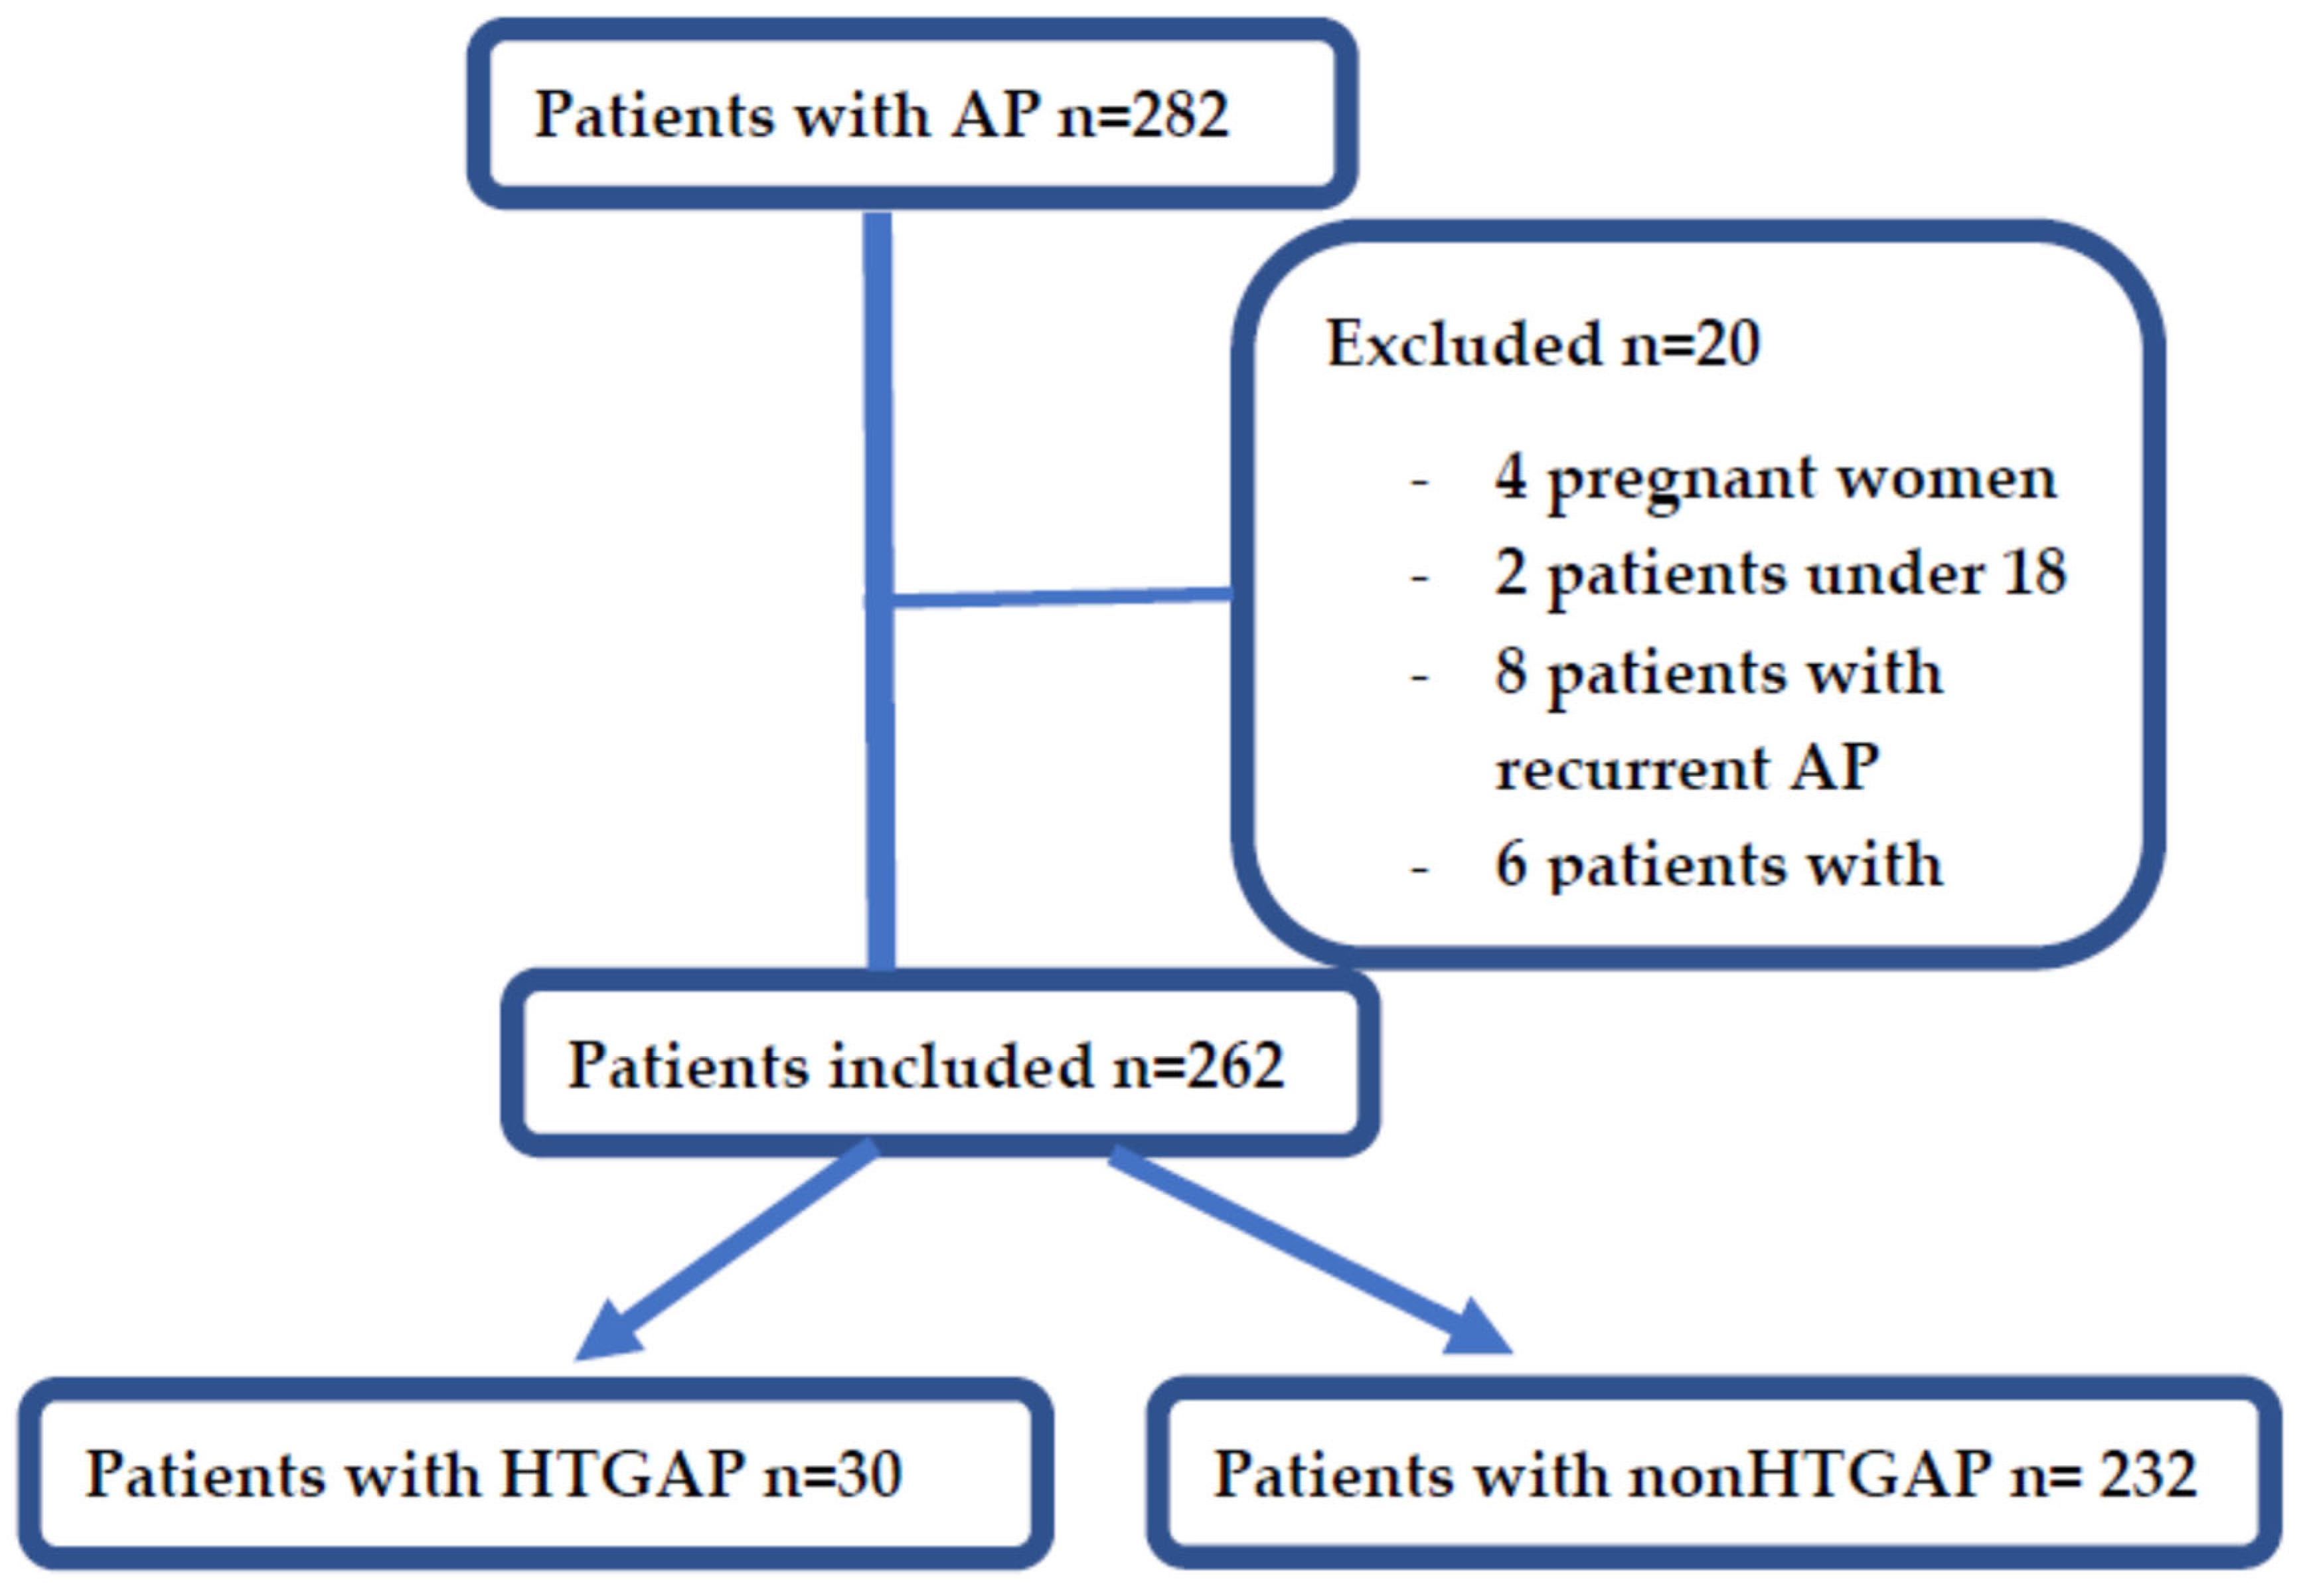
2.1. Patient Selection
2.2. Stratification Based on Severity
2.3. Patients Characteristics
2.4. Ethical Approval
2.5. Statistical Analysis
3. Results
3.1. Patients’ Characteristics
3.2. Severity Prediction
4. Discussion
5. Conclusions
Author Contributions
Funding
Institutional Review Board Statement
Informed Consent Statement
Data Availability Statement
Conflicts of Interest
References
- Yadav, D.; Lowenfels, A.B. Trends in the epidemiology of the first attack of acute pancreatitis: A systematic review. Pancreas 2006, 33, 323–330. [Google Scholar] [CrossRef]
- Carr, R.A.; Rejowski, B.J.; Cote, G.A.; Pitt, H.A.; Zyromski, N.J. Systematic review of hypertriglyceridemia-induced acute pancreatitis: A more virulent etiology? Pancreatology 2016, 16, 469–476. [Google Scholar] [CrossRef] [PubMed]
- Jeon, T.J.; Lee, K.J.; Woo, H.S.; Kim, E.J.; Kim, Y.S.; Park, J.Y.; Cho, J.H. Refeeding syndrome as a possible cause of very early mortality in acute pancreatitis. Gut Liver. 2019, 13, 576–581. [Google Scholar] [CrossRef] [PubMed]
- Krishna, S.G.; Kamboj, A.K.; Hart, P.A.; Hinton, A.; Conwell, D.L. The changing epidemiology of acute pancreatitis hospitalizations: A decade of trends and the impact of chronic pancreatitis. Pancreas 2017, 46, 482–488. [Google Scholar] [CrossRef]
- Zafrir, B.; Saliba, W.; Jubran, A.; Hijazi, R.; Shapira, C. Severe hypertriglyceridemia-related pancreatitis: Characteristics and predictors of recurrence. Pancreas 2019, 48, 182–186. [Google Scholar] [CrossRef] [PubMed]
- Chang, C.C.; Hsieh, Y.Y.; Tsai, H.D.; Yang, T.C.; Yeh, L.S.; Hsu, T.Y. Acute pancreatitis in pregnancy. Zhonghua Yi Xue Za Zhi 1998, 61, 85–92. [Google Scholar]
- Morkos, M.; Amblee, A.; Henriquez, A.; Basu, S.; Fogelfeld, L. External validation of a predictive model for acute pancreatitis risk in patients with severe hypertriglyceridemia. Endocr. Pract. 2019, 25, 817–823. [Google Scholar] [CrossRef]
- Whitcomb, D.C. Clinical practice. Acute pancreatitis. N. Engl. J. Med. 2006, 354, 2142–2150. [Google Scholar] [CrossRef]
- Valdivielso, P.; Ramírez-Bueno, A.; Ewald, N. Current knowledge of hypertriglyceridemic pancreatitis. Eur. J. Intern. Med. 2014, 25, 689–694. [Google Scholar] [CrossRef]
- Amblee, A.; Mohananey, D.; Morkos, M.; Basu, S.; Ganesh, M.; Bhalerao, N.; George, A.M.; Jain, M.; Fogelfeld, L. Acute pancreatitis in patients with severe hypertriglyceridemia in a multi-ethnic minority population. Endocr. Pract. 2018, 24, 429–436. [Google Scholar] [CrossRef]
- Adiamah, A.; Psaltis, E.; Crook, M.; Lobo, D.N. A systematic review of the epidemiology, pathophysiology and current management of hyperlipidaemic pancreatitis. Clin. Nutr. 2018, 37, 1810–1822. [Google Scholar] [CrossRef] [PubMed]
- Li, M.; Xing, X.K.; Lu, Z.H.; Guo, F.; Su, W.; Lin, Y.J.; Wang, D.H. Comparison of scoring systems in predicting severity and prognosis of hypertriglyceridemia-induced acute pancreatitis. Dig. Dis. Sci. 2020, 65, 1206–1211. [Google Scholar] [CrossRef] [PubMed]
- Tenner, S.; Baillie, J.; DeWitt, J.; Vege, S.S. American College of Gastroenterology guideline: Management of acute pancreatitis. Am. J. Gastroenterol. 2013, 108, 1400–1415. [Google Scholar] [CrossRef]
- Wu, Q.; Fu, M.; Zheng, K.; Bo, H.; Yang, H.; Zhong, X.; Liang, G.; Xu, Y.; Hao, B.; Hu, Z.; et al. Elevated triglycerides level in hospital stays as a risk factor of mortality in patients with severe acute pancreatitis. PLoS ONE 2018, 13, e0207875. [Google Scholar] [CrossRef] [PubMed]
- Gonzalez-Perez, A.; Schlienger, R.G.; Rodríguez, L.A. Acute pancreatitis in association with type 2 diabetes and antidiabetic drugs: A population-based cohort study. Diabetes Care 2010, 33, 2580–2585. [Google Scholar] [CrossRef] [Green Version]
- Li, Q.; Hou, C.; Peng, Y.; Zhu, X.; Shi, C.; Zhang, K.; Tu, M.; Gao, F.; Huang, D.; Miao, Y. Diabetes and younger age are vital and independent risk factors for acute pancreatitis in patients with severe hypertriglyceridemia. Biomed. Res. Int. 2019, 2019, 2620750. [Google Scholar] [CrossRef]
- Qiu, L.; Sun, R.Q.; Jia, R.R.; Ma, X.Y.; Cheng, L.; Tang, M.C.; Zhao, Y. Comparison of existing clinical scoring systems in predicting severity and prognoses of hyperlipidemic acute pancreatitis in Chinese patients: A retrospective study. Medicine 2015, 94, e957. [Google Scholar] [CrossRef]
- Park, H.S.; In, S.G.; Yoon, H.J.; Lee, W.J.; Woo, S.H.; Kim, D. Predictive values of neutrophil-lymphocyte ratio as an early indicator for severe acute pancreatitis in the emergency department patients. J. Lab. Physicians 2019, 11, 259–264. [Google Scholar] [CrossRef]
- Thong, V.D.; Mong Trinh, N.T.; Phat, H.T. Factors associated with the severity of hypertriglyceridemia induced acute pancreatitis. Medicine 2021, 100, e25983. [Google Scholar] [CrossRef]
- Wang, Y.; Fuentes, H.E.; Attar, B.M.; Jaiswal, P.; Demetria, M. Evaluation of the prognostic value of neutrophil to lymphocyte ratio in patients with hypertriglyceridemia-induced acute pancreatitis. Pancreatology 2017, 17, 893–897. [Google Scholar] [CrossRef]
- Banks, P.A.; Bollen, T.L.; Dervenis, C.; Gooszen, H.G.; Johnson, C.D.; Sarr, M.G.; Tsiotos, G.G.; Vege, S.S. Classification of acute pancreatitis—2012: Revision of the Atlanta classification and definitions by international consensus. Gut 2013, 62, 102–111. [Google Scholar] [CrossRef] [PubMed]
- Marshall, J.C.; Cook, D.J.; Christou, N.V.; Bernard, G.R.; Sprung, C.L.; Sibbald, W.J. Multiple organ dysfunction score: A reliable descriptor of a complex clinical outcome. Crit. Care Med. 1995, 23, 1638–1652. [Google Scholar] [CrossRef] [PubMed]
- Wu, B.U.; Johannes, R.S.; Sun, X.; Tabak, Y.; Conwell, D.L.; Banks, P.A. The early prediction of mortality in acute pancreatitis: A large population-based study. Gut 2008, 57, 1698–1703. [Google Scholar] [CrossRef] [PubMed] [Green Version]
- Beig, J.; Khanolkar, M.; Cundy, T. Type 2 diabetes in young adults in Central Auckland: Demography and complications. Intern. Med. J. 2018, 48, 67–73. [Google Scholar] [CrossRef] [PubMed]
- Athyros, V.G.; Doumas, M.; Imprialos, K.P.; Stavropoulos, K.; Georgianou, E.; Katsimardou, A.; Karagiannis, A. Diabetes and lipid metabolism. Hormones 2018, 17, 61–67. [Google Scholar] [CrossRef] [Green Version]
- Zhang, R.; Deng, L.; Jin, T.; Zhu, P.; Shi, N.; Jiang, K.; Li, L.; Yang, X.; Guo, J.; Yang, X.; et al. Hypertriglyceridaemia-associated acute pancreatitis: Diagnosis and impact on severity. HPB 2019, 21, 1240–1249. [Google Scholar] [CrossRef] [Green Version]
- Zhang, C.; Wang, K.; Yang, L.; Liu, R.; Chu, Y.; Qin, X.; Yang, P.; Yu, H. Lipid metabolism in inflammation-related diseases. Analyst 2018, 143, 4526–4536. [Google Scholar] [CrossRef]
- Jo, S.I.; Chang, J.H.; Kim, T.H.; Kim, C.W.; Kim, J.K.; Han, S.W. Subsets associated with developing acute pancreatitis in patients with severe hypertriglyceridemia and the severity of pancreatitis. Pancreatology 2019, 19, 795–800. [Google Scholar] [CrossRef]
- Yang, A.L.; McNabb-Baltar, J. Hypertriglyceridemia and acute pancreatitis. Pancreatology 2020, 20, 795–800. [Google Scholar] [CrossRef]
- Kuan, L.L.; Dennison, A.R.; Garcea, G. Association of visceral adipose tissue on the incidence and severity of acute pancreatitis: A systematic review. Pancreatology 2020, 20, 1056–1061. [Google Scholar] [CrossRef]
- Lloret Linares, C.; Pelletier, A.L.; Czernichow, S.; Vergnaud, A.C.; Bonnefont-Rousselot, D.; Levy, P.; Ruszniewski, P.; Bruckert, E. Acute pancreatitis in a cohort of 129 patients referred for severe hypertriglyceridemia. Pancreas 2008, 37, 13-2. [Google Scholar] [CrossRef] [PubMed]
- Suppiah, A.; Malde, D.; Arab, T.; Hamed, M.; Allgar, V.; Smith, A.M.; Morris-Stiff, G. The prognostic value of the neutrophil-lymphocyte ratio (NLR) in acute pancreatitis: Identification of an optimal NLR. J. Gastrointest. Surg. 2013, 17, 675–681. [Google Scholar] [CrossRef] [PubMed]
- Wu, B.U.; Bakker, O.J.; Papachristou, G.I.; Besselink, M.G.; Repas, K.; van Santvoort, H.C.; Muddana, V.; Singh, V.K.; Whitcomb, D.C.; Gooszen, H.G.; et al. Blood urea nitrogen in the early assessment of acute pancreatitis: An international validation study. Arch. Intern. Med. 2011, 171, 669–676. [Google Scholar] [CrossRef]
- Wu, B.U.; Johannes, R.S.; Conwell, D.L.; Banks, P.A. Early hemoconcentration predicts increased mortality only among transferred patients with acute pancreatitis. Pancreatology 2009, 9, 639–643. [Google Scholar] [CrossRef] [PubMed]


| Patients’ Characteristics | HTGAP | Non-HTGAP | |
|---|---|---|---|
| Mean age | 44.4 ± 9.2 | 58.2 ± 17.1 | p < 0.0001 |
| Male gender | 76% (23/30) | 54% (126/232) | p = 0.02 |
| Severity forms | |||
| MAP | 23% (7/30) | 57% (134/232) | p = 0.0005 |
| MSAP | 60% (18/30) | 30% (71/232) | p = 0.001 |
| SAP | 16% (5/30) | 11% (27/232) | p = 0.4 |
| Type of complications | |||
| Local complications | 60% (18/30) | 27% (64/232) | p = 0.0005 |
| Organ failure | 16% (5/30) | 14% (34/232) | p = 0.9 |
| Laboratory data | Median (range) | Median (range) | |
| Glucose level 0 h | 175 (87–540) | 131 (32–486) | p = 0.007 |
| ALT 0 h | 41 (10–315) | 98 (7–1963) | p = 0.0002 |
| AST 0 h | 30(11–657) | 104 (11–1747) | p = 0.0002 |
| TB 0 h | 0.8 (0.4–4.8) | 1.3 (0.2–15) | p = 0.002 |
| FAL 0 h | 76 (38–178) | 159 (33–781) | p = 0.0001 |
| GGT 0 h | 87 (23–1853) | 212 (19–4072) | p = 0.004 |
| Creatinine 0 h | 0.8 (0.4–4.6) | 1 (0.4–7.1) | p = 0.9 |
| Creatinine 48 h | 0.8 (0.3–7.4) | 0.8 (0.4–7.9) | p = 0.6 |
| Leucocyte 0 h | 12,950 (4200–24,300) | 11,300 (1300–29,630) | p = 0.5 |
| Thrombocyte 0 h | 210,000 (101,000–358,000) | 205,000 (43,000–555,000) | p = 0.6 |
| Lipase 0 h | 2490 (398–21,467) | 4816 (43–275,291) | p = 0.2 |
| Triglyceride 0 h | 1874 (512–21,110) | 187 (85–351) | p < 0.0001 |
| CRP 48 h | 243 (8–411) | 71 (1–606) | p < 0.0001 |
| NLR 0 h | 5.8 (2–13) | 8.1 (1–17) | p = 0.01 |
| NLR 48 h | 7.2 (0.9–13) | 5 (0.8–30) | p = 0.1 |
| PLR 0 h | 115 (64–279) | 186 (72–383) | p = 0.01 |
| PLR 48 h | 131 (58–346) | 169 (64–412) | p = 0.3 |
| HT 0 h | 43 (26–50) | 39 (13–55) | p = 0.04 |
| HT 48 h | 38 (27–46) | 36 (22–52) | p = 0.9 |
| BUN 0 h | 29 (9–123) | 50 (8–246) | p = 0.001 |
| BUN 48 h | 28 (6–189) | 40 (7–253) | p = 0.4 |
| BISAP 0 h | 2 (0–3) | 2 (0–5) | p = 0.3 |
| Comorbidities | |||
| Diabetes mellitus | 53% (16/30) | 18% (42/232) | p < 0.0001 |
| Arterial hypertension | 10% (3/30) | 16% (38/232) | p = 0.5 |
| Hepatic steatosis | 23% (7/30) | 20 (47/232) | p = 0.8 |
| Heart failure | 0% (0/30) | 3% (8/232) | p = 0.7 |
| Chronic kidney disease | 0% (0/30) | 4% (10/232) | p = 0.5 |
| BMI kg/m2 | Mean ± SD | Mean ± SD | |
| 28.8 ± 7.6 | 27.4 ± 8.4 | p = 0.8 | |
| Length of hospital stay | Median (range) | Median (range) | |
| Number of days | 7.5 (3–23) | 7.4 (2–42) | p = 0.7 |
| ICU admission | |||
| 9% (3/30) | 8% (20/232) | p = 0.8 | |
| Need for surgery | |||
| 6% (2/30) | 5% (13/232) | p = 0.8 | |
| Mortality | |||
| 3% (1/30) | 9% (22/232) | p = 0.2 |
| Parameter | Cut-Off Value | AUROC | 95% CI | SE | SP | +LR | −LR | |
|---|---|---|---|---|---|---|---|---|
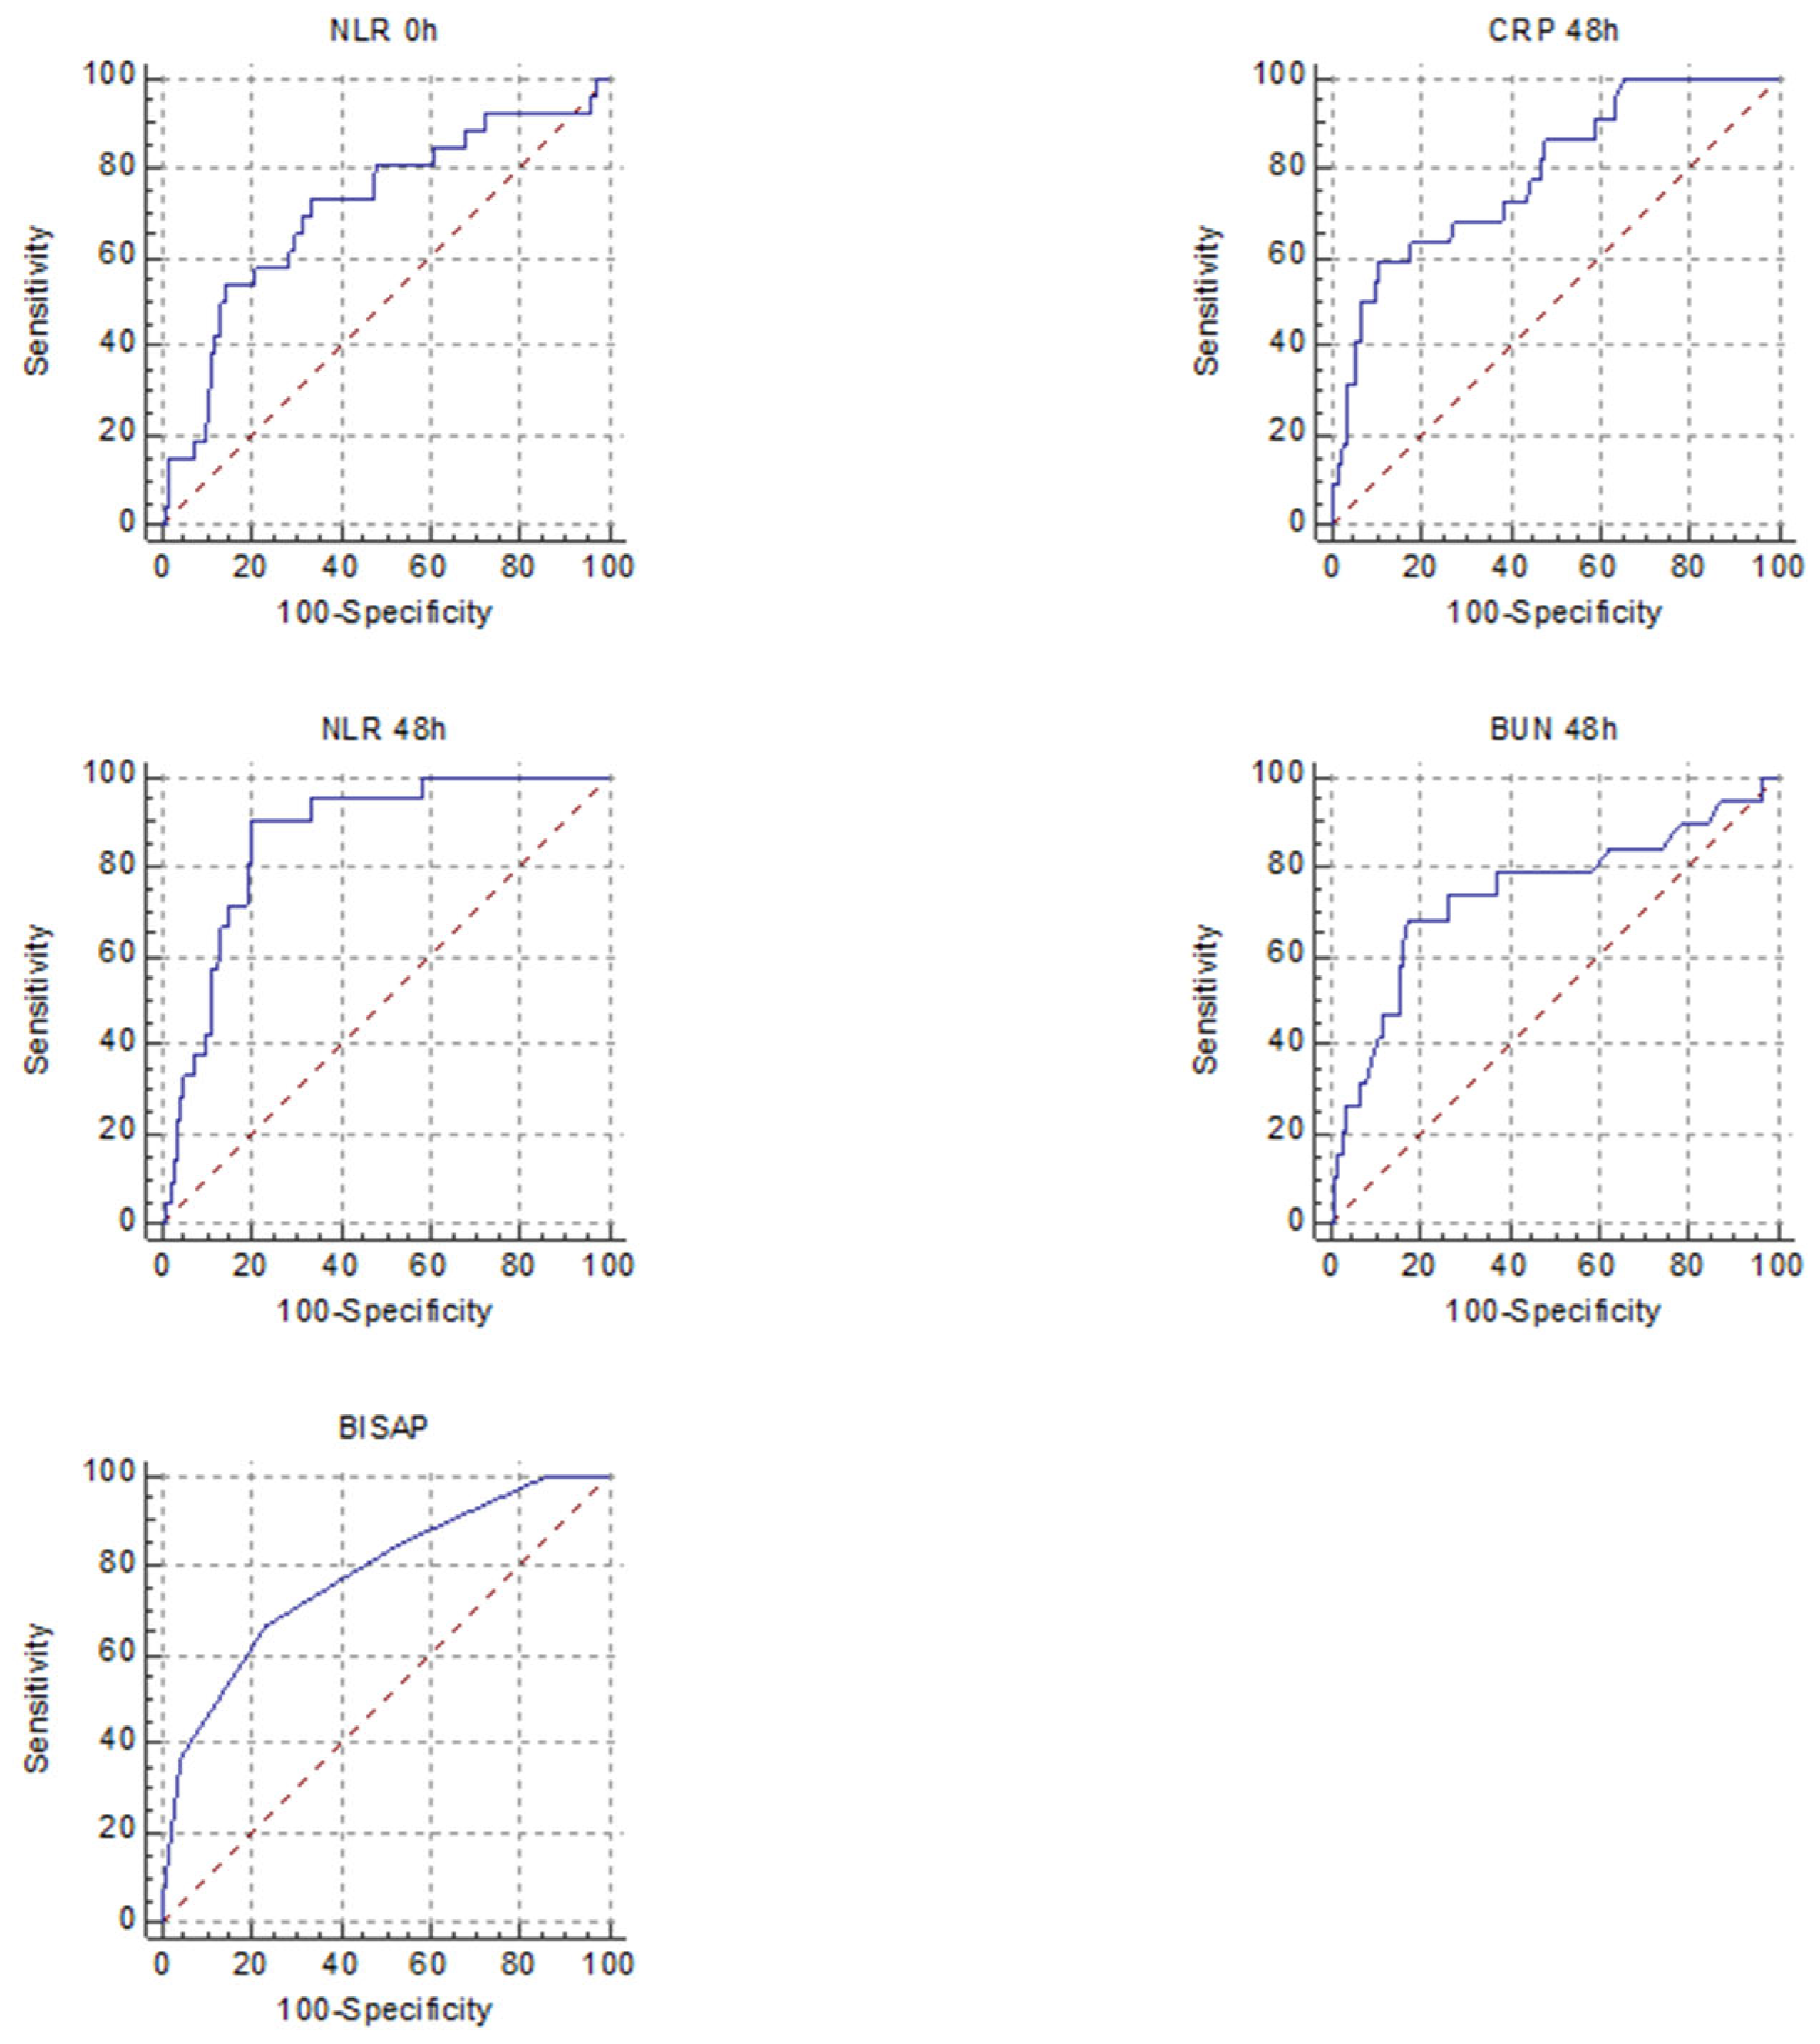
| CRP 48 h | >188 | 0.71 | 0.51 to 0.86 | 100% | 58% | 2.3 | 0 | p = 0.02 |
| NLR 0 h | >4.1 | 0.57 | 0.38 to 0.75 | 100% | 28% | 1.3 | 0 | p = 0.56 |
| NLR 48 h | >5.8 | 0.66 | 0.45 to 0.83 | 100% | 52% | 2 | 0 | p = 0.17 |
| PLR 0 h | >120 | 0.66 | 0.46 to 0.82 | 80% | 64% | 2.8 | 0.3 | p = 0.25 |
| PLR 48 h | >199 | 0.69 | 0.48 to 0.85 | 60% | 85% | 4 | 0.4 | p = 0.2 |
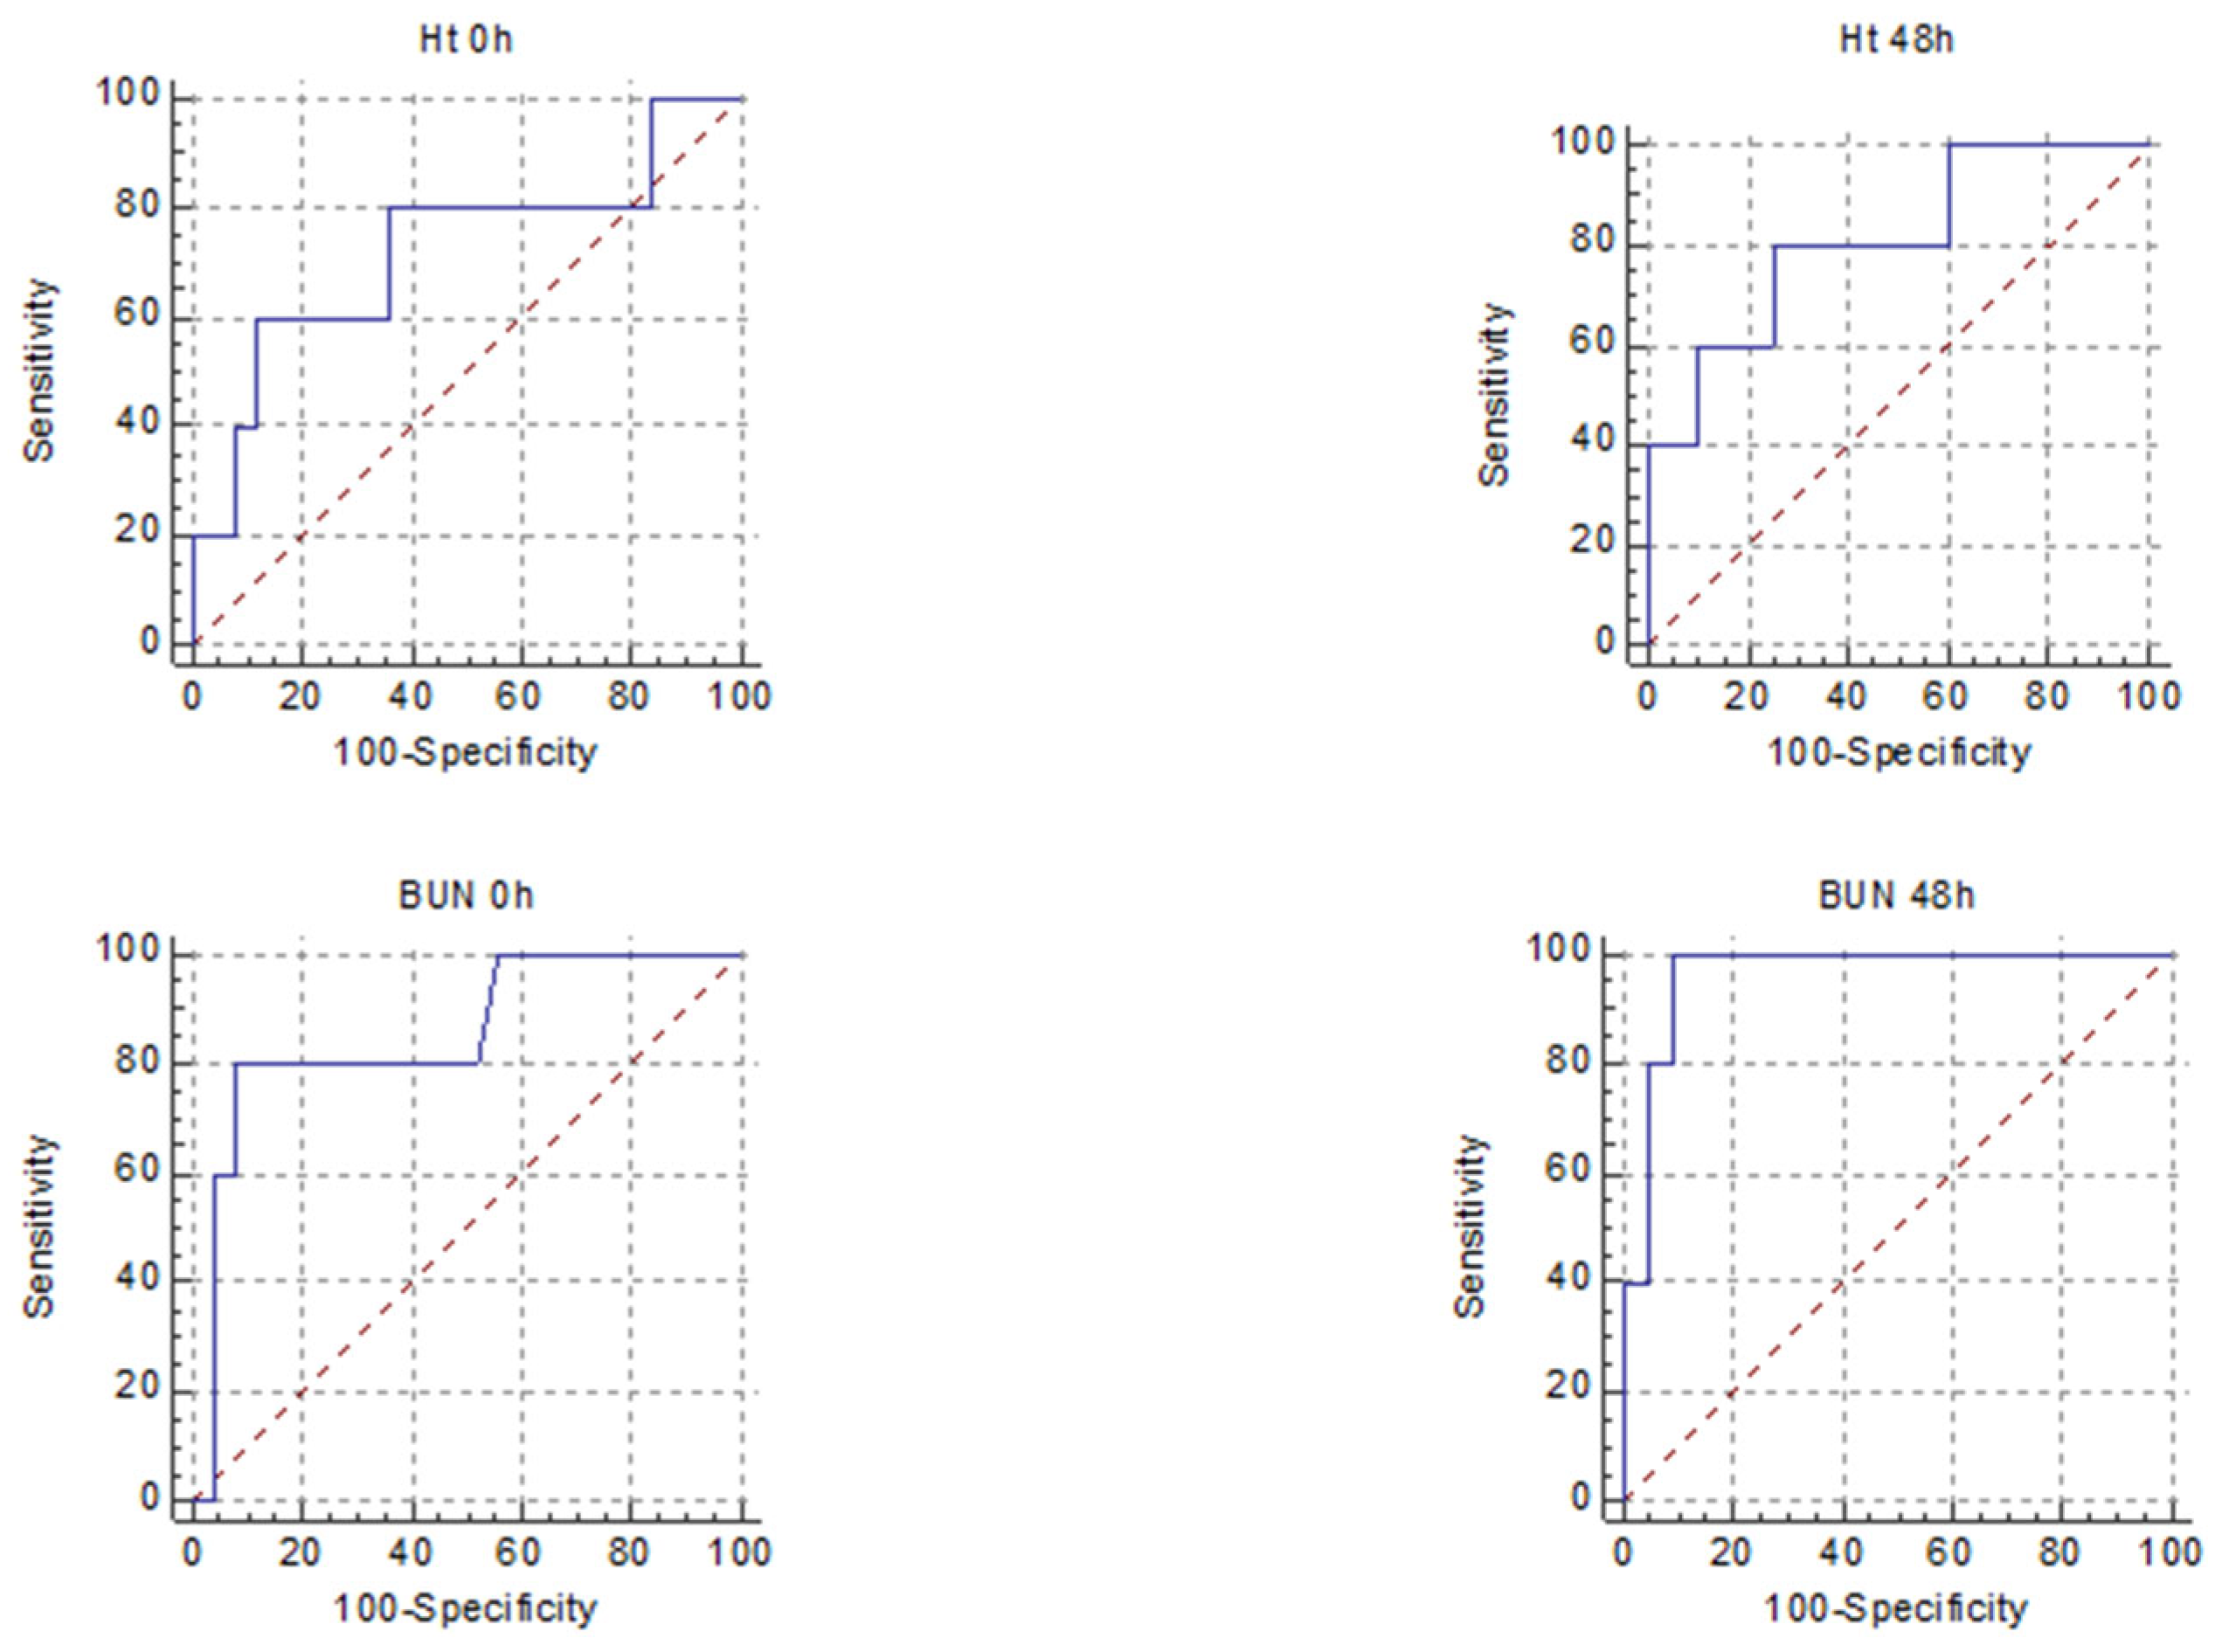
| HT 0 h | <36 | 0.72 | 0.52 to 0.86 | 60% | 88% | 5 | 0.4 | p = 0.16 |
| HT 48 h | <35.2 | 0.81 | 0.60 to 0.93 | 80% | 75% | 3.2 | 0.2 | p = 0.01 |
| BUN 0 h | >37 | 0.85 | 0.67 to 0.95 | 80% | 92% | 10 | 0.2 | p = 0.001 |
| BUN 48 h | >45 | 0.96 | 0.80 to 0.99 | 100% | 90% | 10 | 0 | p < 0.0001 |
| BISAP | >1 | 0.73 | 0.54 to 0.87 | 80% | 52% | 1.6 | 0.3 | p = 0.07 |
| Independent Variables | Coefficient | Std. Error | Rpartial | t | |
|---|---|---|---|---|---|
| (Constant) | −0.2992 | ||||
| BISAP | 0.1572 | 0.09695 | 0.3570 | 1.621 | p = 0.1 |
| BUN 48 h | 0.005976 | 0.002198 | 0.5396 | 2.719 | p = 0.01 |
| NLR 48 h | 0.02770 | 0.02261 | 0.2774 | 1.225 | p = 0.2 |
| NLR 0 h | −0.04694 | 0.02699 | −0.3792 | −1.739 | p = 0.09 |
| CRP 48 h | 0.0006369 | 0.0007024 | 0.2090 | 0.907 | p = 0.3 |
| Parameter | Cut-Off Value | AUROC | 95% CI | SE | SP | +LR | −LR | |
|---|---|---|---|---|---|---|---|---|
| CRP 48 h | >147 | 0.58 | 0.38 to 0.76 | 72% | 57% | 1.7 | 0.4 | p = 0.5 |
| NLR 0 h | >9.2 | 0.64 | 0.45 to 0.81 | 30% | 100% | 0 | 0.7 | p = 0.2 |
| NLR 48 h | >5.3 | 0.71 | 0.50 to 0.87 | 76% | 80% | 3.8 | 0.3 | p = 0.1 |
| PLR 0 h | >102 | 0.59 | 0.39 to 0.76 | 73% | 57% | 1.7 | 0.4 | p = 0.4 |
| PLR 48 h | >131 | 0.7 | 0.49 to 0.86 | 57% | 100% | 0 | 0.4 | p = 0.04 |
| HT 0 h | <43 | 0.76 | 0.57 to 0.89 | 65% | 85% | 4.5 | 0.4 | p = 0.005 |
| HT 48 h | <43 | 0.85 | 0.66 to 0.96 | 95% | 75% | 3.8 | 0.06 | p = 0.002 |
| BUN 0 h | >34 | 0.6 | 0.40 to 0.77 | 39% | 100% | 0 | 0.6 | p = 0.3 |
| BUN 48 h | >35 | 0.57 | 0.36 to 0.76 | 40% | 100% | 0 | 0.5 | p = 0.5 |
| BISAP | >1 | 0.74 | 0.55 to 0.88 | 60% | 71% | 2.1 | 0.5 | p = 0.02 |
| Parameter | Cut-Off Value | AUROC | 95% CI | SE | SP | LR+ | LR− | |
|---|---|---|---|---|---|---|---|---|
| CRP 48 h | >234 | 0.81 | 0.72 to 0.84 | 71% | 88% | 5.9 | 0.3 | p < 0.0001 |
| NLR 0 h | >9.6 | 0.72 | 0.64 to 0.76 | 73% | 66% | 2.9 | 0.4 | p = 0.0003 |
| NLR 48 h | >8.1 | 0.83 | 0.80 to 0.91 | 90% | 80% | 4.5 | 0.1 | p < 0.0001 |
| PLR 0 h | >179 | 0.64 | 0.54 to 0.67 | 65% | 62% | 1.7 | 0.5 | p = 0.08 |
| PLR 48 h | >163 | 0.62 | 0.58 to 0.73 | 57% | 70% | 1.9 | 0.6 | p = 0.009 |
| Ht 0 h | <34 | 0.55 | 0.45 to 0.58 | 22% | 81% | 2.3 | 0.8 | p = 0.7 |
| Ht 48 h | <35 | 0.68 | 0.52 to 0.68 | 59% | 74% | 2.2 | 0.6 | p = 0.1 |
| BUN 0 h | >56 | 0.68 | 0.63 to 0.75 | 51% | 86% | 3.9 | 0.5 | p = 0.001 |
| BUN 48 h | >60 | 0.74 | 0.65 to 0.81 | 68% | 82% | 3.9 | 0.3 | p = 0.001 |
| BISAP | >2 | 0.76 | 0.71 to 0.82 | 66% | 76% | 2.8 | 0.4 | p < 0.0001 |
| Parameter | Cut-Off Value | AUROC | 95% CI | SE | SP | +LR | −LR | |
|---|---|---|---|---|---|---|---|---|
| CRP 48 h | >93 | 0.7 | 0.71 to 0.82 | 67% | 75% | 2.7 | 0.4 | p < 0.0001 |
| NLR 0 h | >11.4 | 0.6 | 0.57 to 0.70 | 40% | 82% | 2.3 | 0.7 | p = 0.0002 |
| NLR 48 h | >6 | 0.7 | 0.68 to 0.82 | 71% | 76% | 3.9 | 0.3 | p < 0.0001 |
| PLR 0 h | >126 | 0.5 | 0.45 to 0.58 | 69% | 40% | 1.1 | 0.7 | p = 0.6 |
| PLR 48 h | >157 | 0.5 | 0.49 to 0.65 | 47% | 69% | 1.5 | 0.7 | p = 0.1 |
| HT 0 h | <44 | 0.5 | 0.45 to 0.58 | 36% | 70% | 1.2 | 0.8 | p = 0.06 |
| HT 48 h | <35 | 0.6 | 0.54 to 0.70 | 46% | 79% | 1.8 | 0.7 | p = 0.007 |
| BUN 0 h | >54 | 0.5 | 0.51 to 0.64 | 32% | 90% | 3.2 | 0.7 | p = 0.03 |
| BUN 48 h | >48 | 0.6 | 0.55 to 0.72 | 49% | 89% | 4.8 | 0.5 | p = 0.004 |
| BISAP | >2 | 0.7 | 0.64 to 0.76 | 50% | 81% | 3.9 | 0.5 | p < 0.0001 |
Publisher’s Note: MDPI stays neutral with regard to jurisdictional claims in published maps and institutional affiliations. |
© 2022 by the authors. Licensee MDPI, Basel, Switzerland. This article is an open access article distributed under the terms and conditions of the Creative Commons Attribution (CC BY) license (https://creativecommons.org/licenses/by/4.0/).
Share and Cite
Dancu, G.; Bende, F.; Danila, M.; Sirli, R.; Popescu, A.; Tarta, C. Hypertriglyceridaemia-Induced Acute Pancreatitis: A Different Disease Phenotype. Diagnostics 2022, 12, 868. https://doi.org/10.3390/diagnostics12040868
Dancu G, Bende F, Danila M, Sirli R, Popescu A, Tarta C. Hypertriglyceridaemia-Induced Acute Pancreatitis: A Different Disease Phenotype. Diagnostics. 2022; 12(4):868. https://doi.org/10.3390/diagnostics12040868
Chicago/Turabian StyleDancu, Greta, Felix Bende, Mirela Danila, Roxana Sirli, Alina Popescu, and Cristi Tarta. 2022. "Hypertriglyceridaemia-Induced Acute Pancreatitis: A Different Disease Phenotype" Diagnostics 12, no. 4: 868. https://doi.org/10.3390/diagnostics12040868
APA StyleDancu, G., Bende, F., Danila, M., Sirli, R., Popescu, A., & Tarta, C. (2022). Hypertriglyceridaemia-Induced Acute Pancreatitis: A Different Disease Phenotype. Diagnostics, 12(4), 868. https://doi.org/10.3390/diagnostics12040868