A Comparative Systematic Literature Review on Knee Bone Reports from MRI, X-Rays and CT Scans Using Deep Learning and Machine Learning Methodologies

 , , ,
, , ,  , , and
Abstract
1. Introduction
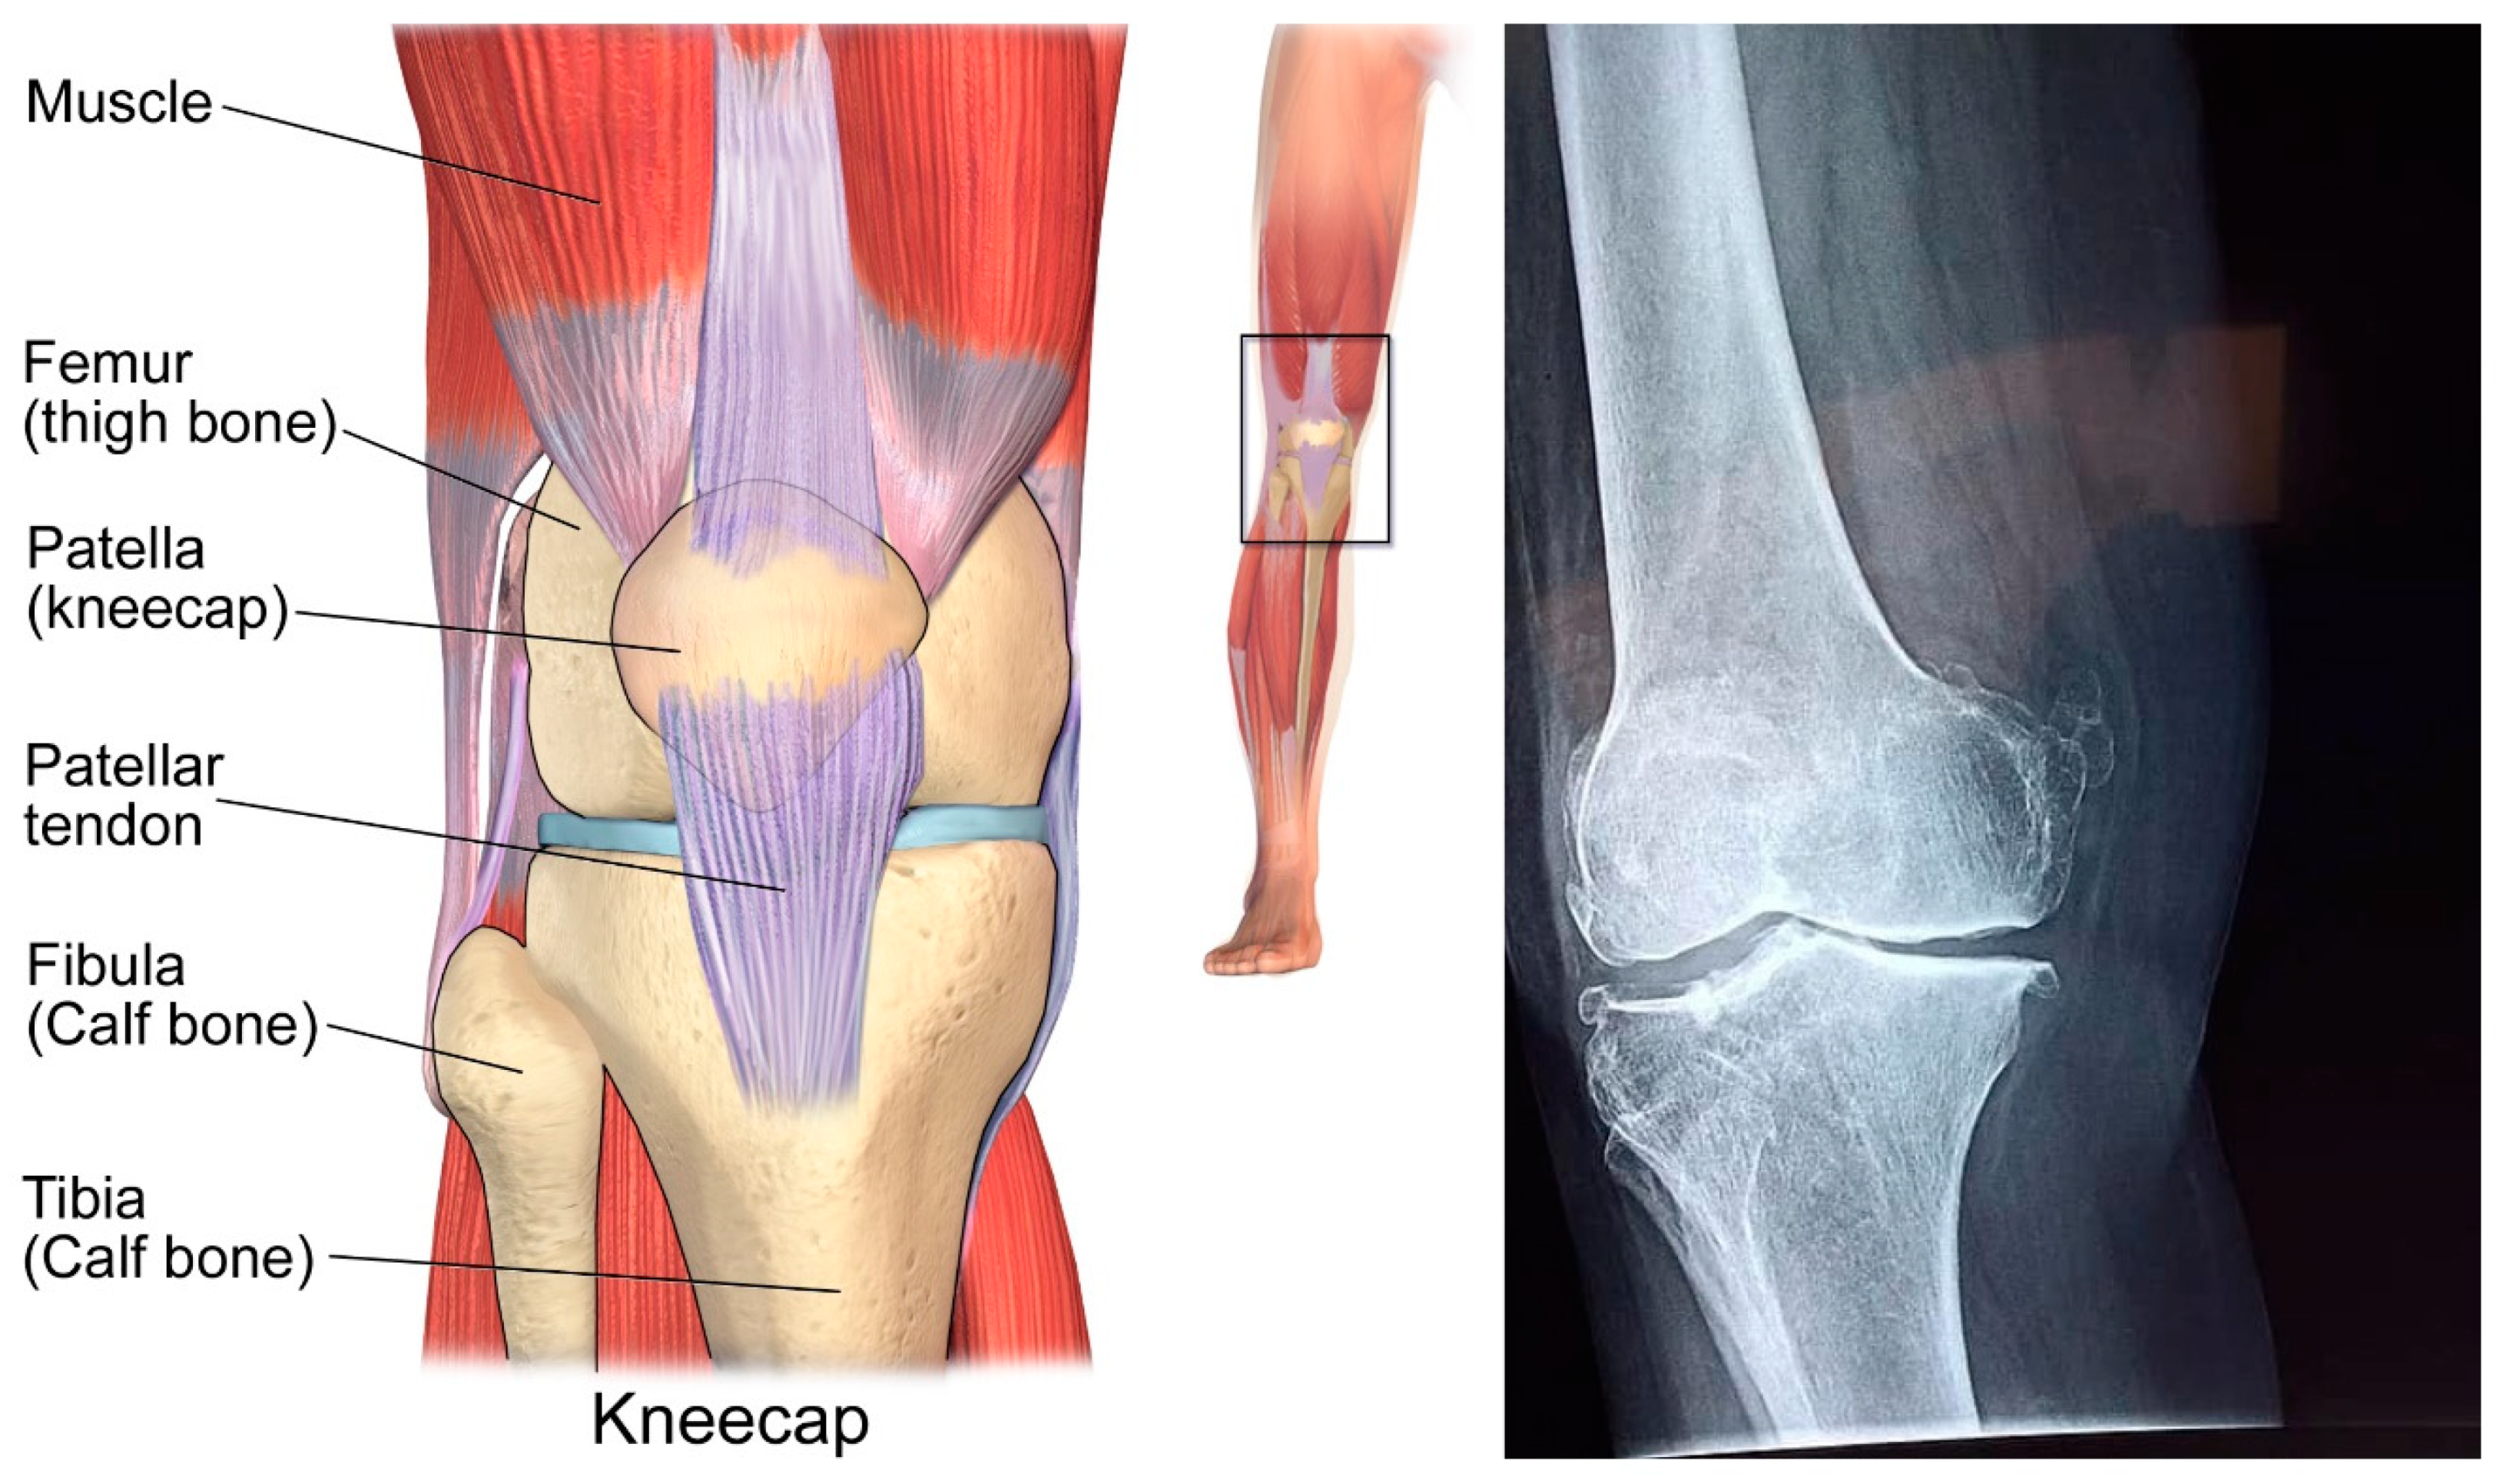
1.1. Structure of Human Knee
1.2. Osteoarthritis
1.3. Screening Techniques
1.3.1. Radiography (X-ray)
1.3.2. Magnetic Resonance Imaging (MRI)
1.3.3. Computed Tomography (CT scan)
1.4. Deep Learning in Medical Image Processing
1.5. Machine Learning in Medical Image Processing
1.6. Purpose of the Study
1.7. Reviews and Hypothesis
2. Related Work
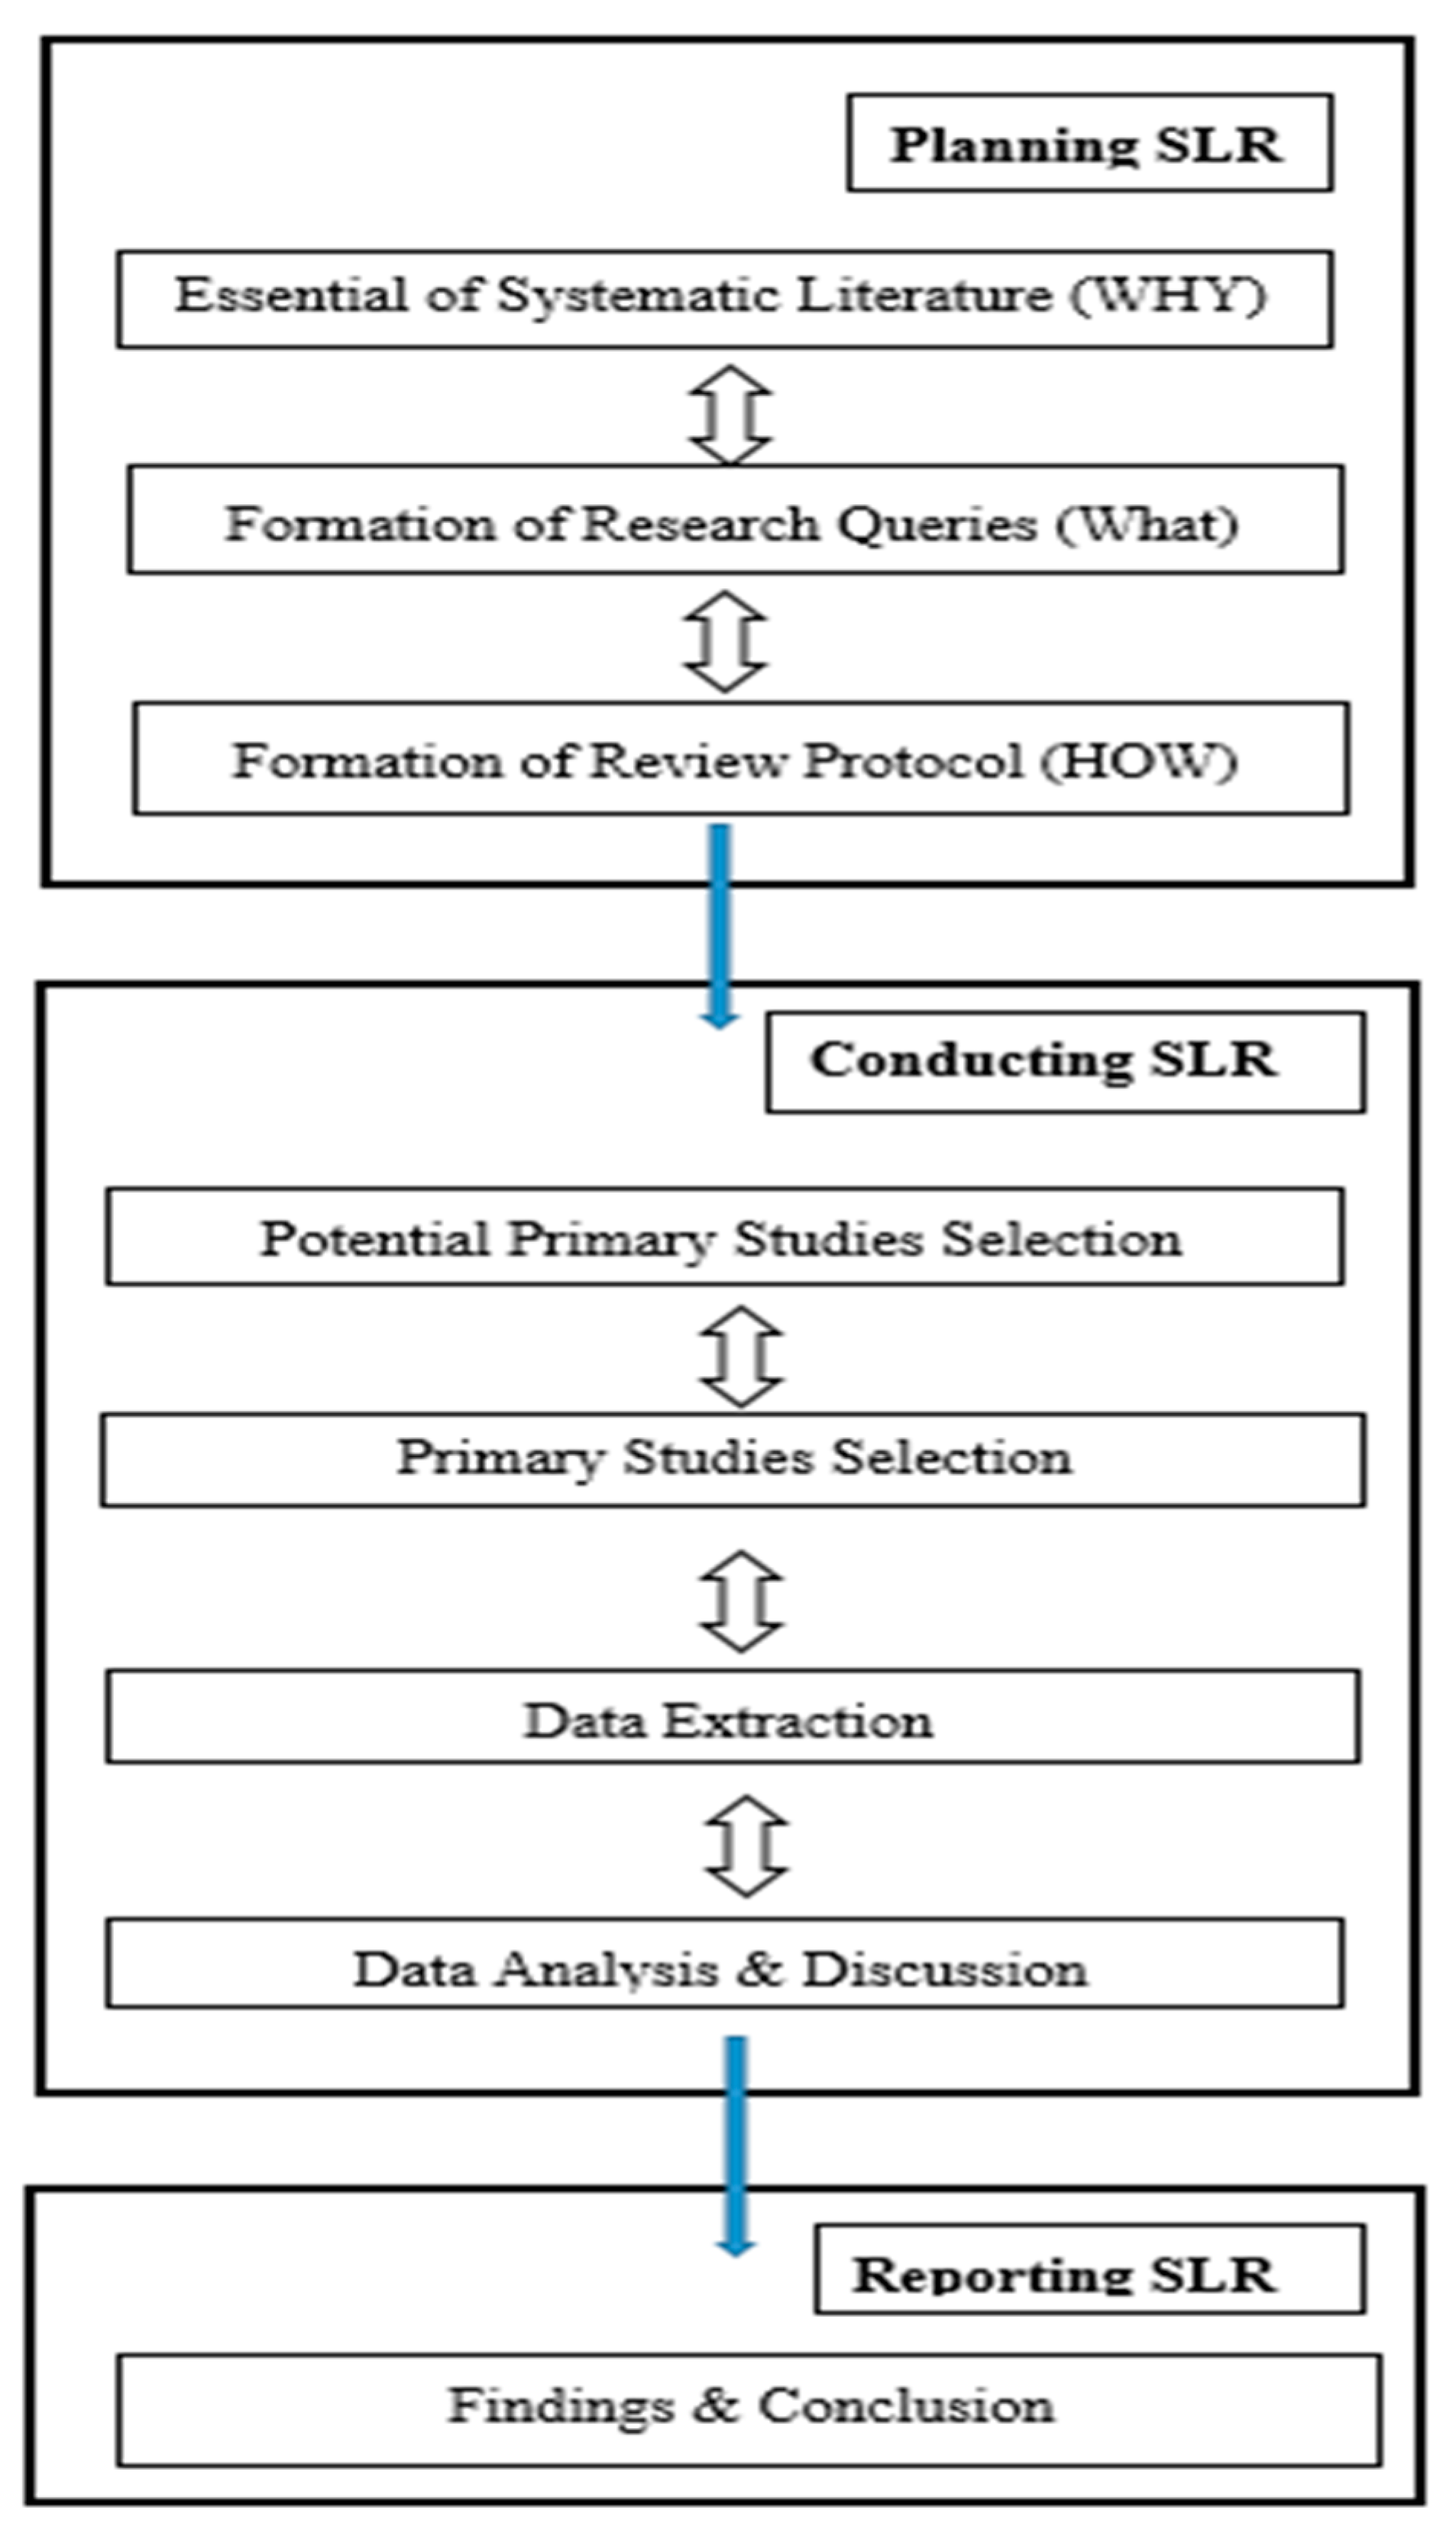
3. Systematic Literature Review
3.1. Planning SLR
3.1.1. Necessity of the SLR
3.1.2. Research Questions
3.1.3. Review Protocol
Search Process
Study Exclusion Criteria
Study Inclusion Criteria
Quality Criteria for Primary Studies
Data Extraction
4. SLR Conduct
4.1. Design
4.1.1. Research Queries
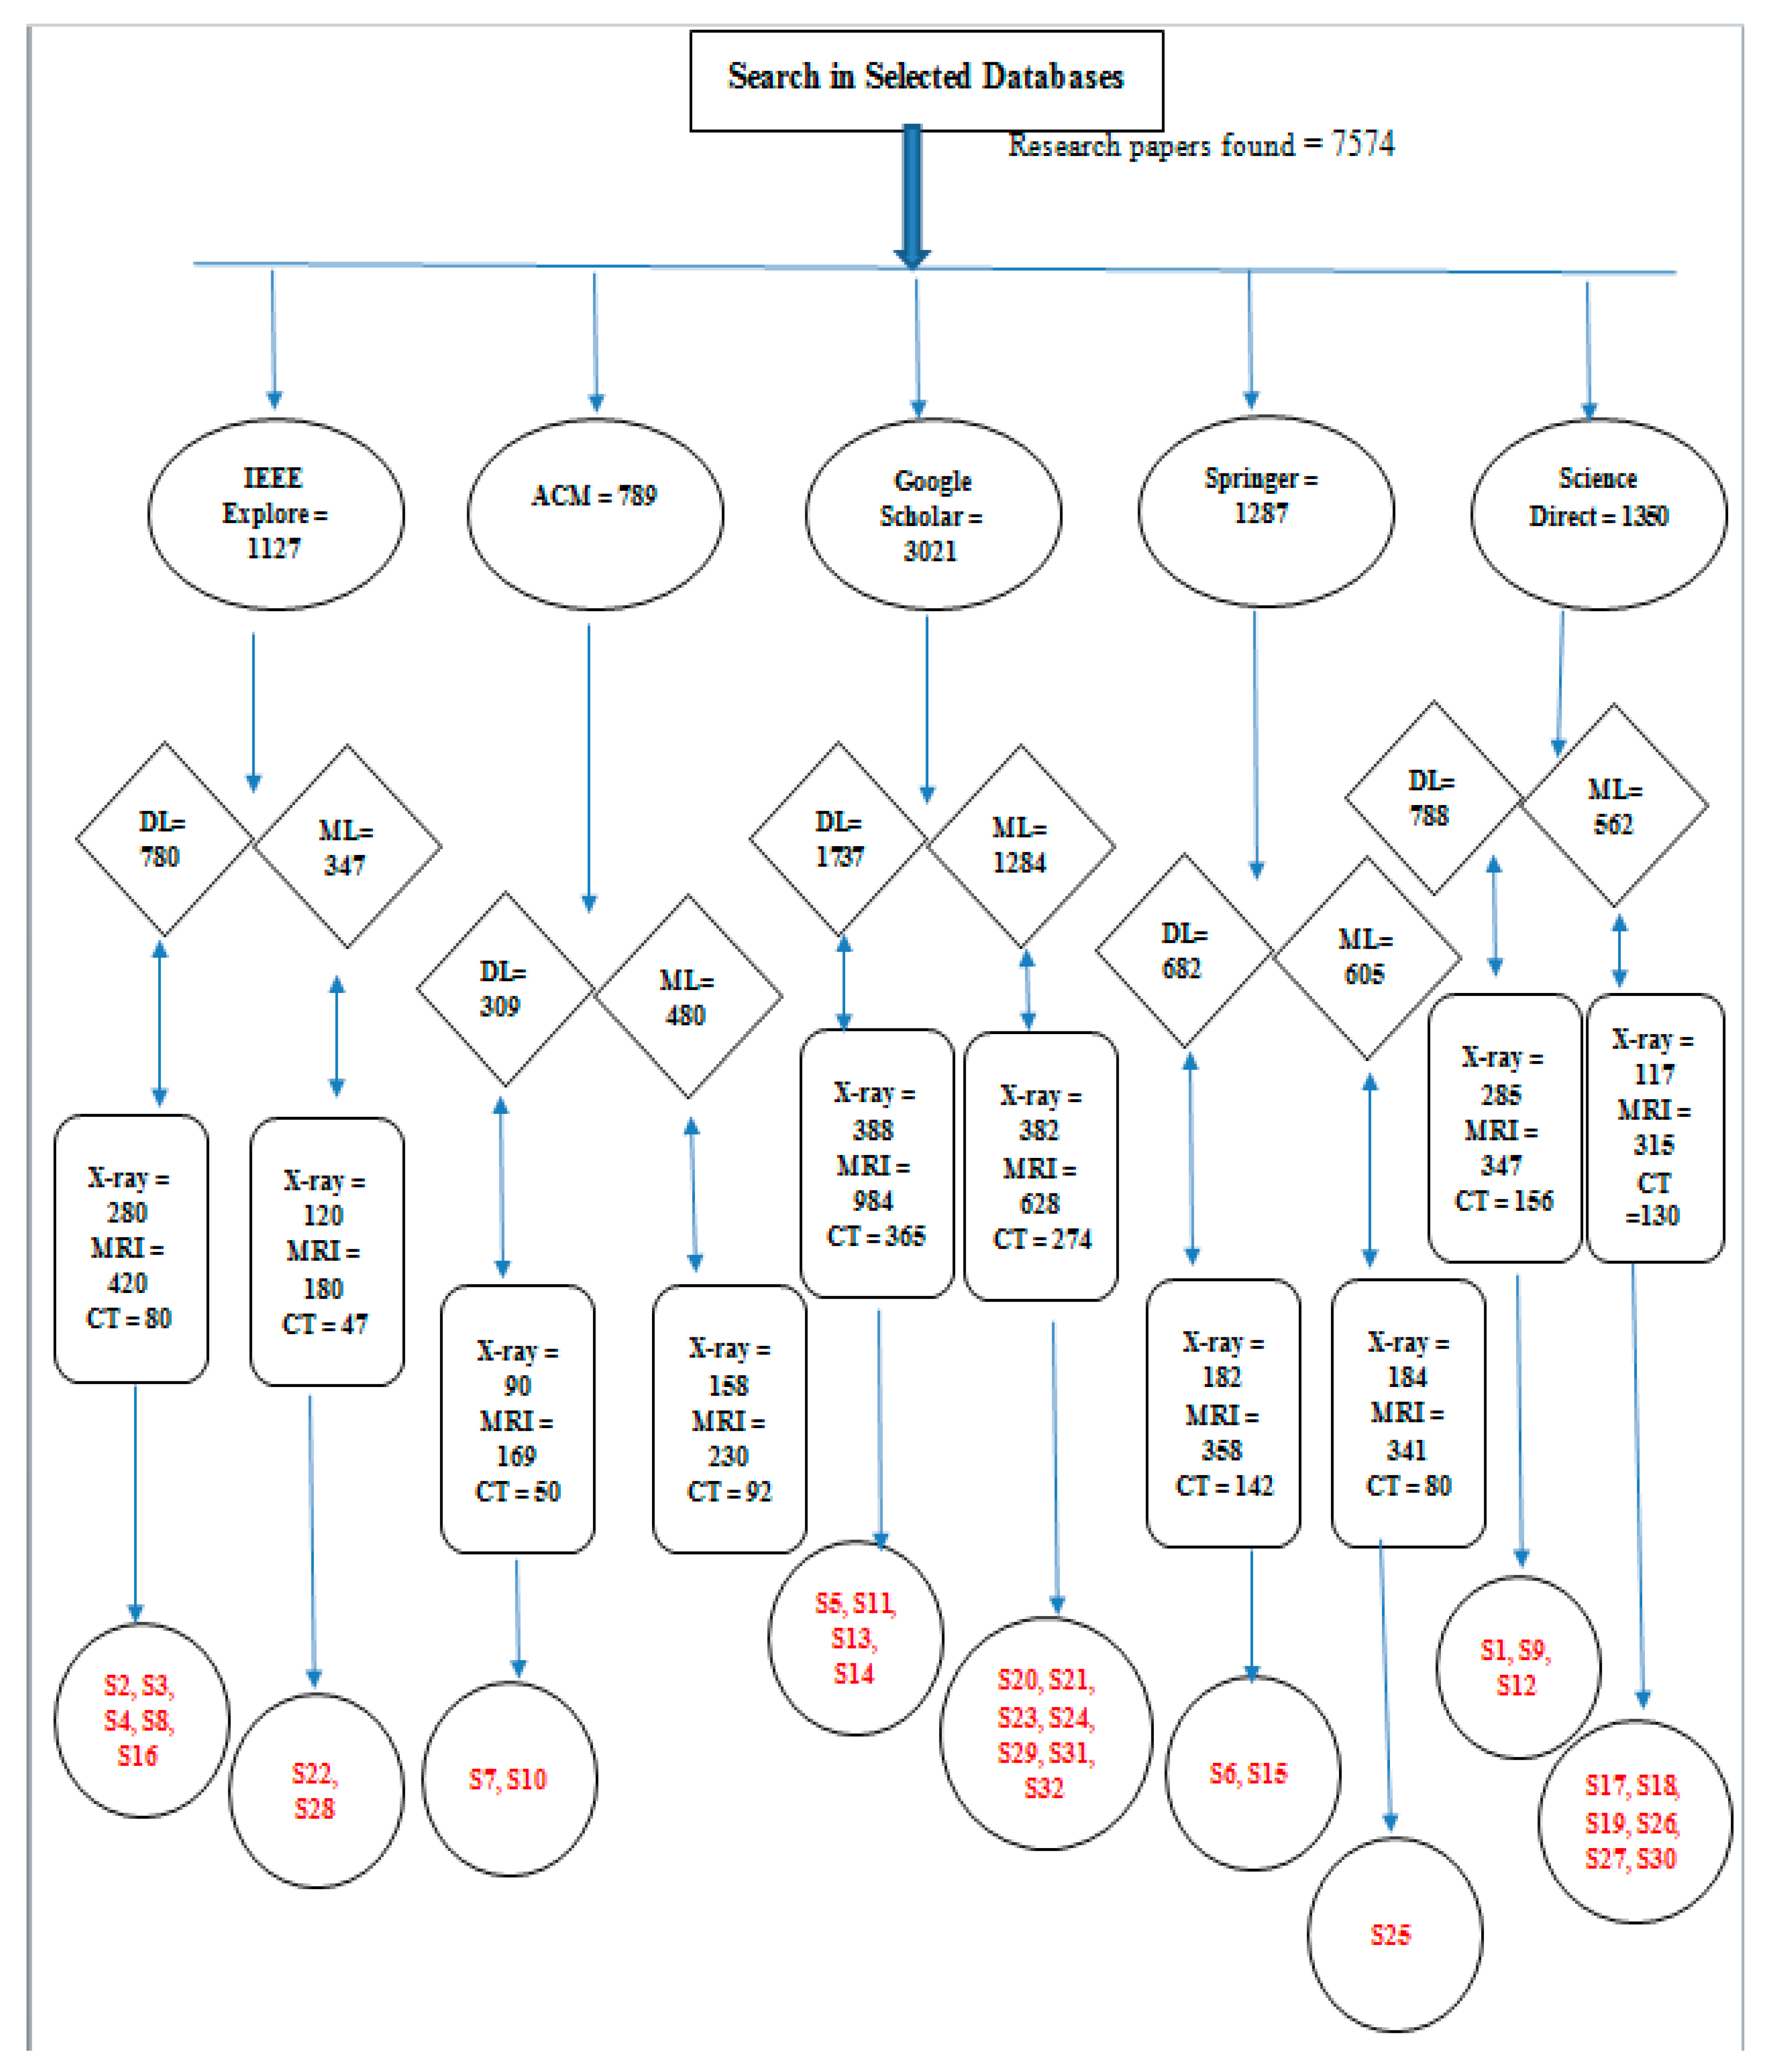
4.1.2. Search Procedure
4.2. Study Selection
- Discarding studies based on the avoidance criteria.
- Discarding insignificantly concentrated studies based on the investigation of their titles and edited compositions.
- Assessing the choice to concentrate, depending on a full content read.
- Assessment by an outer specialist.
- Re-examining the outcomes in irregular studies.
- Acquiring essential examinations.
4.3. Quality Evaluation
- Agree (A) = 1
- Some (S) = 0.5
- Disagree (D) = 0
- Do the selected papers refer to the required query?
- How are the function impediments archived?
- Were the detected research papers acceptable?
- Do the selected papers refer to the required query?
- How are the function impediments archived?
- Was the detected research paper acceptable?
4.4. Synthesis
4.5. Citation of Selected Papers
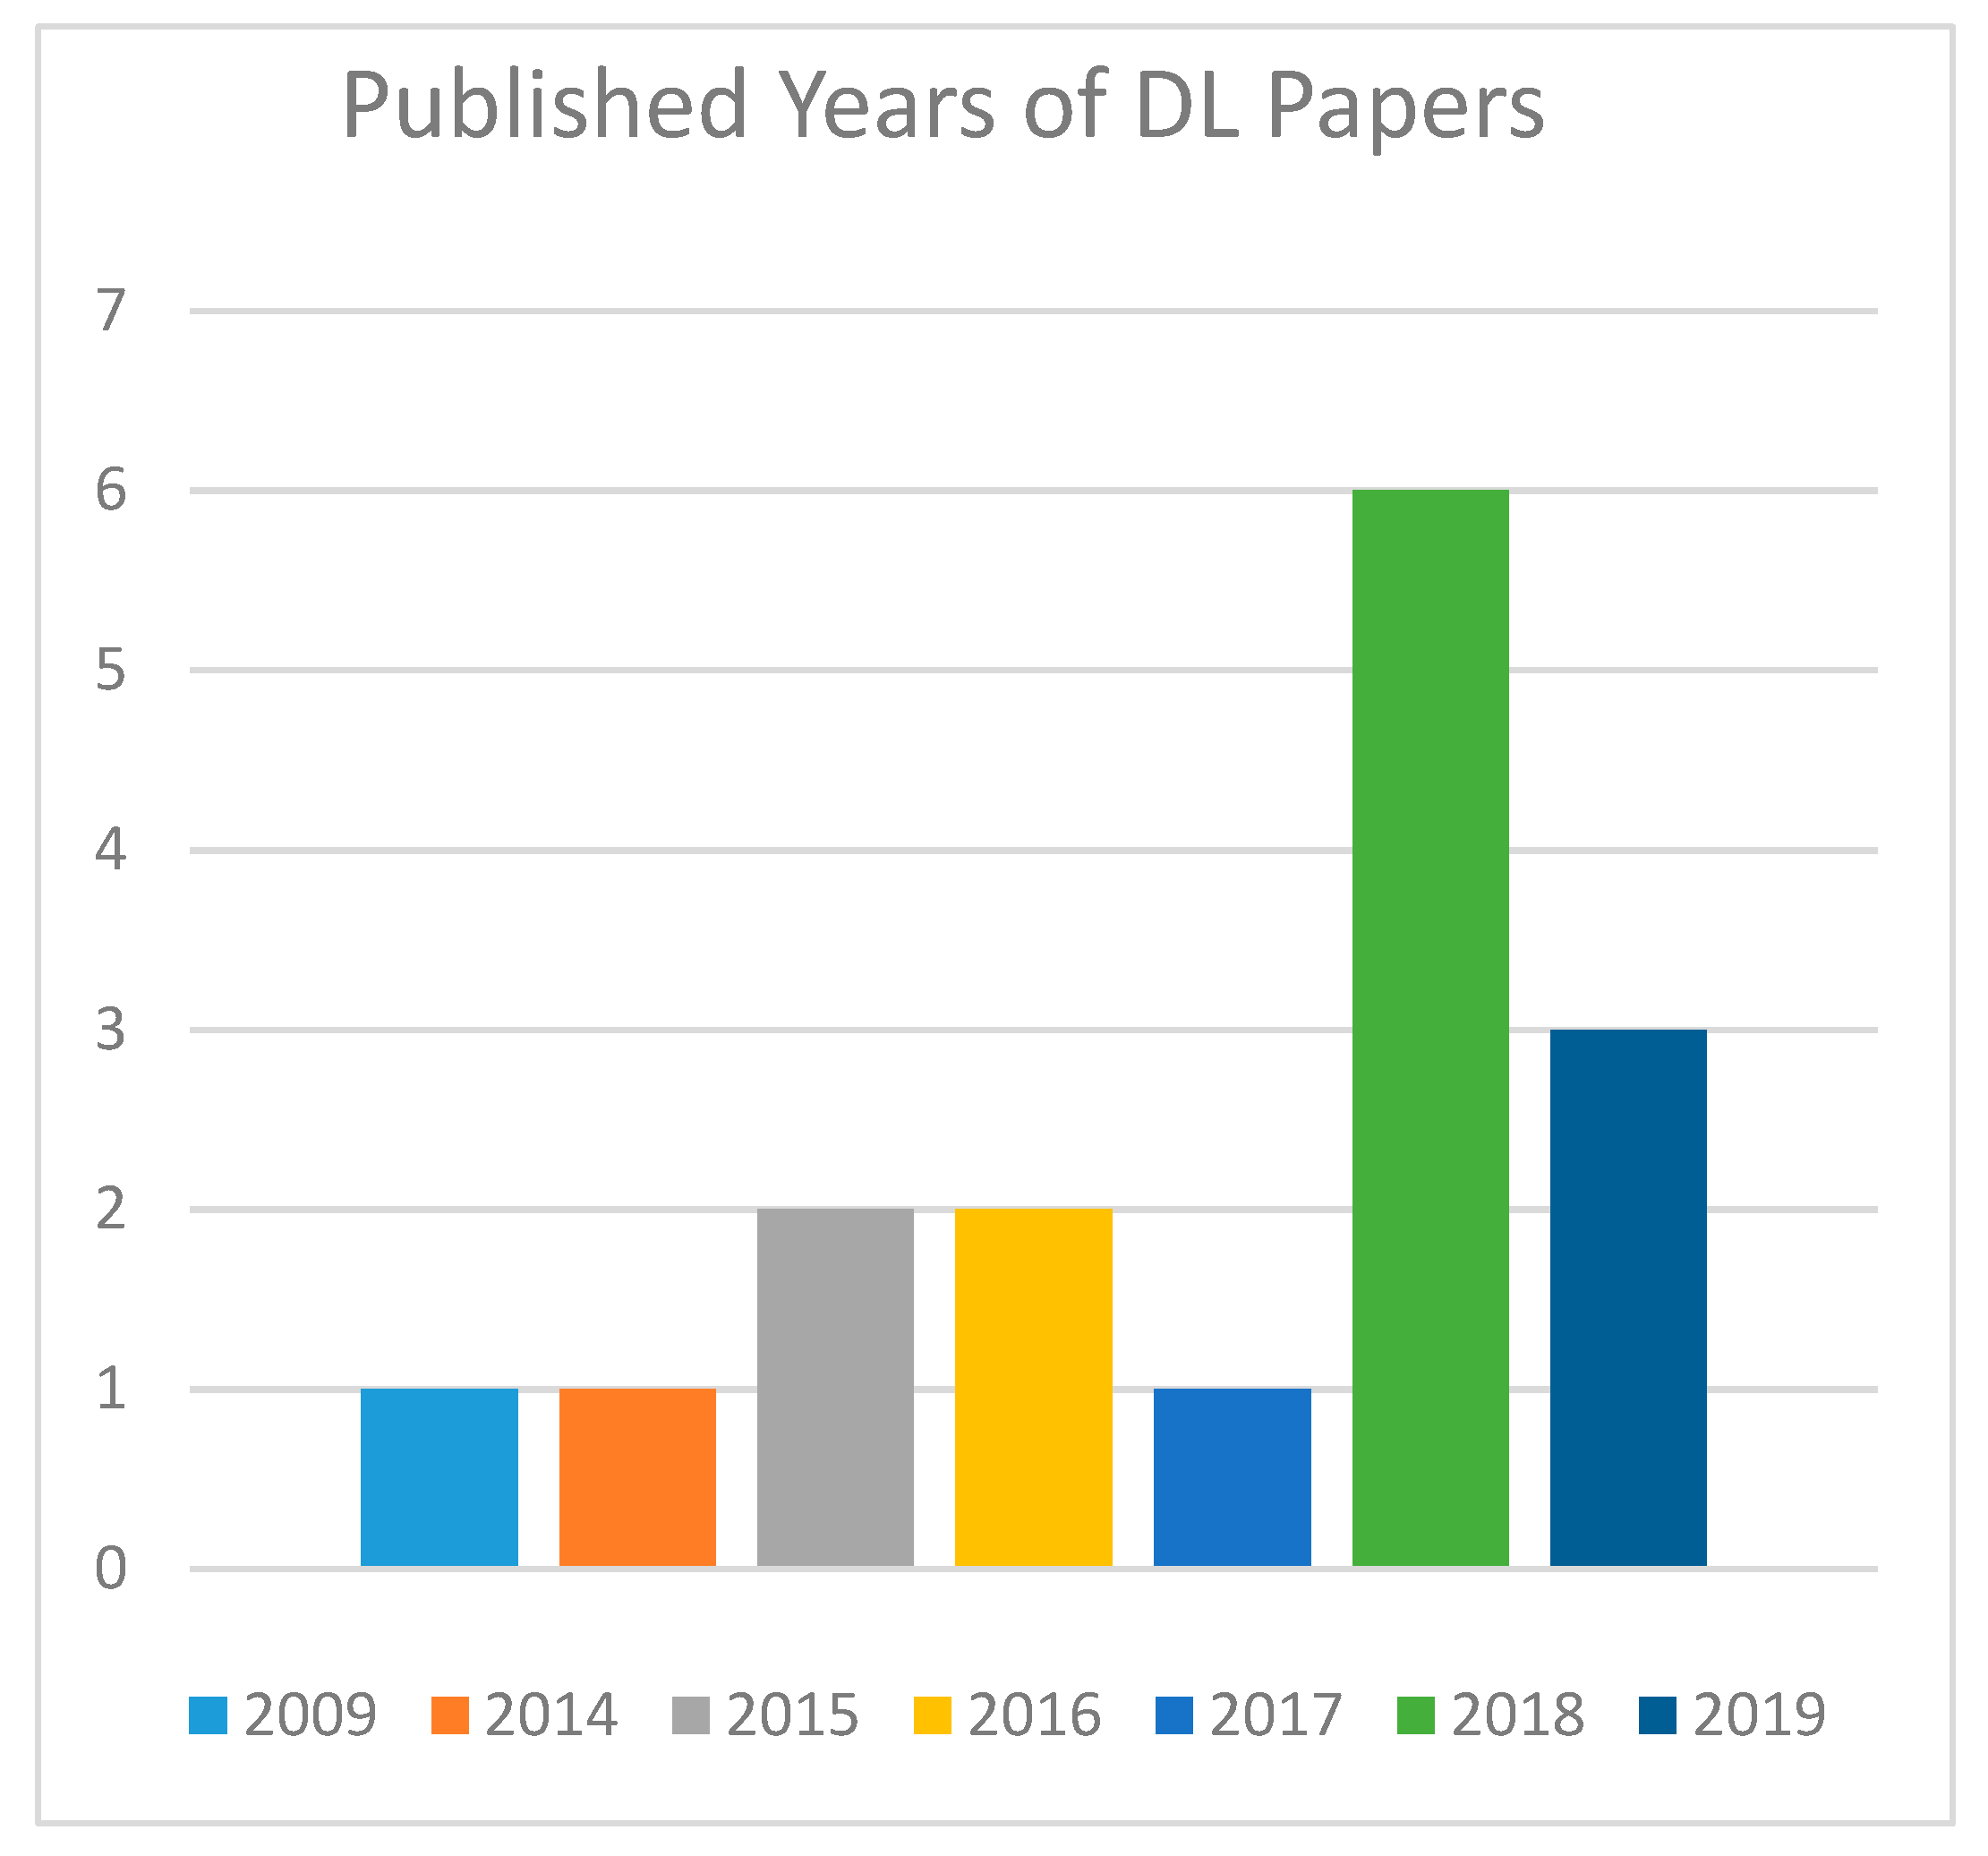
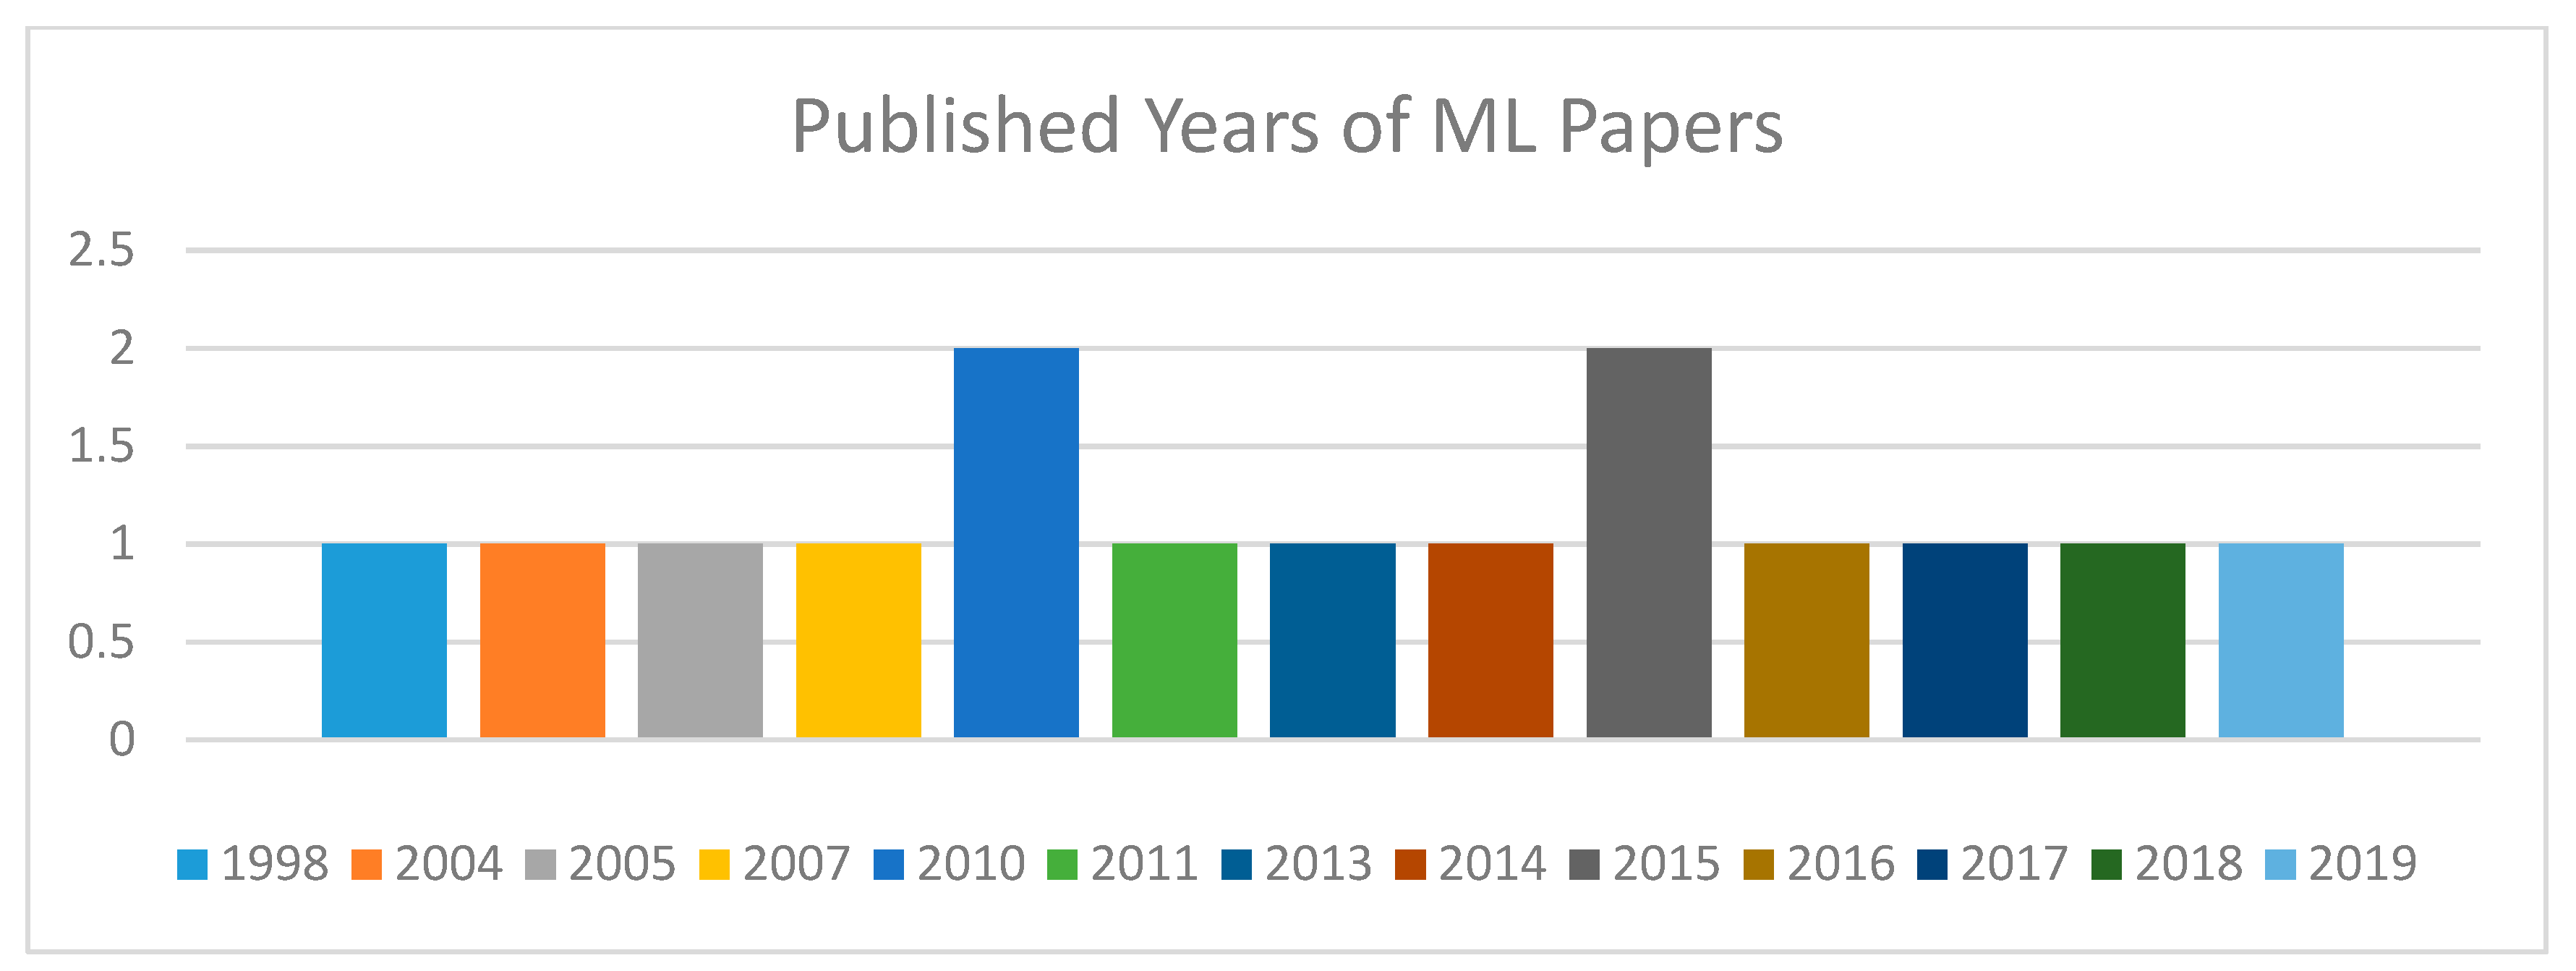
4.6. Years of Publication
4.7. Data Extraction
5. Discussion
5.1. Type of Knee Bone Images Used in SLR
5.2. Techniques or Methods Used
5.3. Failure or Success Ratio
5.4. Best Technique
6. Conclusions and Forthcoming Work
Funding
Conflicts of Interest
Appendix A

References
- Ryzhkov, M.D. Knee Cartilage Segmentation Algorithms: A Critical Literature Review. Master’s Thesis, Utrecht University, Utrecht, The Netherlands, 2015. [Google Scholar]
- Senaras, C.; Gurcan, M.N. Deep learning for medical image analysis. J. Pathol. Inform. 2018, 9, 25. [Google Scholar]
- Erickson, B.J.; Korfiatis, P.; Akkus, Z.; Kline, T.L. Machine Learning for Medical Imaging. Radiographics 2017, 37, 505–515. [Google Scholar] [CrossRef] [PubMed]
- Tiulpin, A.; Thevenot, J.; Rahtu, E.; Lehenkari, P.; Saarakkala, S. Automatic Knee Osteoarthritis Diagnosis from Plain Radiographs: A Deep Learning-Based Approach. Sci. Rep. 2018, 8, 1727. [Google Scholar] [CrossRef] [PubMed]
- Kim, D.; Lee, J.; Yoon, J.S.; Lee, K.J.; Won, K. Development of automated 3D knee bone segmentation with inhomogeneity correction for deformable approach in magnetic resonance imaging. In Proceedings of the 2018 Conference on Research in Adaptive and Convergent Systems, Honolulu, HI, USA, 9–12 October 2018; pp. 285–290. [Google Scholar]
- La Rosa, F. A Deep Learning Approach to Bone Segmentation in CT Scans. Ph.D. Thesis, The University of Bologna, Bologna, Italy, 2017. [Google Scholar]
- Bourgeat, P.; Fripp, J.; Stanwell, P.; Ramadan, S.; Ourselin, S. MR image segmentation of the knee bone using phase information. Med. Image Anal. 2007, 11, 325–335. [Google Scholar] [CrossRef]
- Rafique, I.; Fatima, K.; Dastagir, A.; Mahmood, S.; Hussain, M. Autism Identification and Learning Through Motor Gesture Patterns. In Proceedings of the 2019 International Conference on Innovative Computing (ICIC), Lahore, Pakistan, 1–2 November 2019; Available online: https://ieeexplore.ieee.org/abstract/document/8966740/ (accessed on 22 June 2020).
- Nadeem, M.W.; Hussain, M.; Khan, M.A.; Awan, S.M. Analysis of Smart Citizens: A Fuzzy Based Approach. Commun. Comput. Eng. 2019, 24–25. [Google Scholar] [CrossRef]
- Zainab, M.; Usmani, A.R.; Mehrban, S.; Hussain, M. FPGA Based Implementations of RNN and CNN: A Brief Analysis. In Proceedings of the 2019 International Conference on Innovative Computing (ICIC), Lahore, Pakistan, 1–2 November 2019; Available online: https://ieeexplore.ieee.org/abstract/document/8966676/ (accessed on 22 June 2020).
- Nadeem, M.W.; Al Ghamdi, M.A.; Hussain, M.; Khan, M.A.; Khan, K.M.; AlMotiri, S.H.; Butt, S.A. Brain Tumor Analysis Empowered with Deep Learning: A Review, Taxonomy, and Future Challenges. Brain Sci. 2020, 10, 118. [Google Scholar] [CrossRef]
- Khan, A.G.; Zahid, A.H.; Hussain, M.; Farooq, M.; Riaz, U.; Alam, T.M. A journey of WEB and Blockchain towards the Industry 4.0: An Overview. In Proceedings of the 2019 International Conference on Innovative Computing (ICIC), Lahore, Pakistan, 1–2 November 2019. [Google Scholar]
- Manzoor, A.; Hussain, M.; Mehrban, S. Performance Analysis and Route Optimization: Redistribution between EIGRP, OSPF & BGP Routing Protocols. Comput. Stand. Inter. 2020, 68, 103391. Available online: https://www.sciencedirect.com/science/article/pii/S0920548919300996 (accessed on 22 June 2020).
- Hassan, M.; Hussain, M.; Ayubi, S.-U.-D.; Irfan, M. A Policy Recommendations Framework To Resolve Global Software Development Issues. In Proceedings of the 2019 International Conference on Innovative Computing (ICIC), Lahore, Pakistan, 1–2 November 2019; Available online: https://ieeexplore.ieee.org/abstract/document/8966719/ (accessed on 22 June 2020).
- Hussain, M.; Al-Haiqi, A.; Zaidan, A.; Zaidan, B.; Kiah, M.; Iqbal, S.; Abdulnabi, M.; Iqbal, S. A security framework for mHealth apps on Android platform. Comput. Secur. 2018, 75, 191–217. Available online: https://www.sciencedirect.com/science/article/pii/S0167404818300798 (accessed on 22 June 2020). [CrossRef]
- Hordri, N.F.; Samar, A.; Yuhaniz, S.S.; Shamsuddin, S.M. A systematic literature review on features of deep learning in big data analytics. Int. J. Adv. Soft Comput. Appl. 2017, 9. Available online: http://home.ijasca.com/data/documents/Vol_9_1_ID-19_Pg32-49.pdf (accessed on 22 June 2020).
- Tahir, T.; Rasool, G.; Gencel, C. A systematic literature review on software measurement programs. Inf. Softw. Technol. 2016, 73, 101–121. [Google Scholar] [CrossRef]
- Rouhani, B.D.; Mahrin, M.N.; Nikpay, F.; Ahmad, R.B.; Nikfard, P. A systematic literature review on Enterprise Architecture Implementation Methodologies. Inf. Softw. Technol. 2015, 62, 1–20. [Google Scholar] [CrossRef]
- Ho, N.-H.; Yang, H.-J.; Kim, S.H.; Taek Jeong, S.; Joo, S.-D. Ene-to-end Knee Bone Tumor Classification from Radiographs Based on Semi-Supervised Ensemble Wnet; Korean Multimedia Society, Honam University Gwangsan: Gwangsan, Korea, 2018. [Google Scholar]
- Shamir, L.; Ling, S.M.; Scott, W.W.; Bos, A.; Orlov, N.; Macura, T.J.; Eckley, D.M.; Ferrucci, L.; Goldberg, I.G. Knee x-ray image analysis method for automated detection of osteoarthritis. IEEE Trans. Biomed. Eng. 2009, 56, 407–415. [Google Scholar] [CrossRef] [PubMed]
- Antony, J.; McGuinness, K.; O’Connor, N.E.; Moran, K. Quantifying radiographic knee osteoarthritis severity using deep convolutional neural networks. In Proceedings of the 2016 23rd International Conference on Pattern Recognition (ICPR), Cancun, Mexico, 4–8 December 2016; pp. 1195–1200. [Google Scholar]
- Gornale, S.S.; Patravali, P.U.; Manza, R.R. Detection of osteoarthritis using knee X-ray image analyses: A machine vision based approach. Int. J. Comput. Appl. 2016, 145, 20–26. [Google Scholar]
- Hegadi, R.S.; Chavan, U.P.; Navale, D.I. Identification of Knee Osteoarthritis Using Texture Analysis. In Data Analytics and Learning; Springer: Solapur, India, 2019; pp. 121–129. [Google Scholar]
- Mun, J.; Jang, Y.; Son, S.-H.; Yoon, H.J.; Kim, J. A SSLBP-based feature extraction framework to detect bones from knee MRI scans. In Proceedings of the 2018 Conference on Research in Adaptive and Convergent Systems, Honolulu, HI, USA, 9–12 October 2018; pp. 23–28. [Google Scholar]
- Raj, A.; Vishwanathan, S.; Ajani, B.; Krishnan, K.; Agarwal, H. Automatic knee cartilage segmentation using fully volumetric convolutional neural networks for evaluation of osteoarthritis. In Proceedings of the 2018 IEEE 15th International Symposium on Biomedical Imaging (ISBI 2018), Washington, DC, USA, 4–7 April 2018; pp. 851–854. [Google Scholar]
- Ambellan, F.; Tack, A.; Ehlke, M.; Zachow, S. Automated segmentation of knee bone and cartilage combining statistical shape knowledge and convolutional neural networks: Data from the Osteoarthritis Initiative. Med. Image Anal. 2019, 52, 109–118. [Google Scholar] [CrossRef]
- Liu, F.; Zhou, Z.; Samsonov, A.; Blankenbaker, D.; Larison, W.; Kanarek, A.; Lian, K.; Kambhampati, S.; Kijowski, R. Deep Learning Approach for Evaluating Knee MR Images: Achieving High Diagnostic Performance for Cartilage Lesion Detection. Radiology 2018, 289, 160–169. [Google Scholar] [CrossRef]
- Wu, X.-D.; Xiang, B.-Y.; Schotanus, M.G.; Liu, Z.-H.; Chen, Y.; Huang, W. CT-versus MRI-based patient-specific instrumentation for total knee arthroplasty: A systematic review and meta-analysis. Surgeon 2017, 15, 336–348. [Google Scholar] [CrossRef]
- Jang, S.-W.; Seo, Y.-J.; Yoo, Y.-S.; Kim, Y.S. Computed Tomographic Image Analysis Based on FEM Performance Comparison of Segmentation on Knee Joint Reconstruction. Sci. World J. 2014, 2014, 1–11. [Google Scholar] [CrossRef]
- Roth, H.R.; Yao, J.; Lu, L.; Stieger, J.; Burns, J.E.; Summers, R.M. Detection of Sclerotic Spine Metastases via Random Aggregation of Deep Convolutional Neural Network Classifications. In Recent Advances in Computational Methods and Clinical Applications for Spine Imaging; Springer: Cham, Switzerland, 2015; Volume 20, pp. 3–12. [Google Scholar]
- Yang, N.; Zhang, S.; Yan, Z.; Tan, C.; Li, K.; Metaxas, D. Automated anatomical landmark detection ondistal femur surface using convolutional neural network. In Proceedings of the 2015 IEEE 12th International Symposium on Biomedical Imaging (ISBI), New York, NY, USA, 16–19 April 2015; pp. 17–21. [Google Scholar] [CrossRef]
- Sharma, G.B.; Robertson, D.D.; Laney, D.A.; Gambello, M.J.; Terk, M. Machine learning based analytics of micro-MRI trabecular bone microarchitecture and texture in type 1 Gaucher disease. J. Biomech. 2016, 49, 1961–1968. [Google Scholar] [CrossRef]
- Ashinsky, B.G.; Coletta, C.E.; Bouhrara, M.; Lukas, V.A.; Boyle, J.; Reiter, D.A.; Neu, C.P.; Goldberg, I.G.; Spencer, R.G.S. Machine learning classification of OARSI-scored human articular cartilage using magnetic resonance imaging. Osteoarthr. Cartil. 2015, 23, 1704–1712. [Google Scholar] [CrossRef]
- Lin, P.-C.; Irrechukwu, O.; Roque, R.; Hancock, B.; Fishbein, K.W.; Spencer, R.G. Multivariate analysis of cartilage degradation using the support vector machine algorithm. Magn. Reson. Med. 2011, 67, 1815–1826. [Google Scholar] [CrossRef]
- Hassanpour, S.; Langlotz, C.; Amrhein, T.J.; Befera, N.; Lungren, M.P. Performance of a Machine Learning Classifier of Knee MRI Reports in Two Large Academic Radiology Practices: A Tool to Estimate Diagnostic Yield. Am. J. Roentgenol. 2017, 208, 750–753. [Google Scholar] [CrossRef] [PubMed]
- Zahurul, S.; Zahidul, S.; Jidin, R. An Adept Edge Detection Algorithm for Human Knee Osteoarthritis Images. In Proceedings of the 2010 International Conference on Signal Acquisition and Processing, Bangalore, India, 9–10 February 2010; pp. 375–379. [Google Scholar]
- Chen, H.-C.; Lin, C.-J.; Wu, C.-H.; Wang, C.-K.; Sun, Y.-N. Automatic Insall–Salvati ratio measurement on lateral knee x-ray images using model-guided landmark localization. Phys. Med. Boil. 2010, 55, 6785–6800. [Google Scholar] [CrossRef] [PubMed]
- Lim, S.E.; Xing, Y.; Chen, Y.; Leow, W.K.; Howe, T.S.; Png, M.A. Detection of Femur and Radius Fractures in X-ray Images. Available online: https://www.comp.nus.edu.sg/~leowwk/papers/medsip2004.pdf (accessed on 21 May 2020).
- Kruse, C.; Eiken, P.; Vestergaard, P. Machine Learning Principles Can Improve Hip Fracture Prediction. Calcif. Tissue Int. 2017, 100, 348–360. [Google Scholar] [CrossRef] [PubMed]
- Hoff, W.A.; Komistek, R.D.; Dennis, D.A.; Gabriel, S.M.; Walker, S.A. Three-dimensional determination of femoral-tibial contact positions under in vivo conditions using fluoroscopy. Clin. Biomech. 1998, 13, 455–472. [Google Scholar] [CrossRef]
- Brahim, A.; Jennane, R.; Riad, R.; Janvier, T.; Khedher, L.; Toumi, H.; Lespessailles, E. A decision support tool for early detection of knee OsteoArthritis using X-ray imaging and machine learning: Data from the OsteoArthritis Initiative. Comput. Med. Imaging Graph. 2019, 73, 11–18. [Google Scholar] [CrossRef]
- Demenegas, F.; Tassani, S.; Matsopoulos, G.K. Active segmentation of micro-CT trabecular bone images. In Proceedings of the 2011 10th International Workshop on Biomedical Engineering, Kos Island, Greece, 5–7 October 2011; pp. 1–4. [Google Scholar]
- Chen, C. Finite element modeling of trabecular bone from multi-row detector CT imaging. 2018. [Google Scholar] [CrossRef]
- Dennis, D.A.; Mahfouz, M.; Komistek, R.D.; Hoff, W. In vivo determination of normal and anterior cruciate ligament-deficient knee kinematics. J. Biomech. 2005, 38, 241–253. [Google Scholar] [CrossRef]
- Jin, O. Finite Element Analysis of Porcine Trabecular Bone Based on Micro-CT Images. 2015. Available online: http://hdl.handle.net/2142/78802 (accessed on 20 February 2020).
- Lee, W. Structure-Property Relations of Porcine Trabecular Bone and Micro-CT Imaging of Various Materials. 2013. Available online: https://www.ideals.illinois.edu/handle/2142/45644 (accessed on 17 January 2020).
- Fripp, J.; Crozier, S.; Warfield, S.K.; Ourselin, S. Automatic segmentation of the bone and extraction of the bone–cartilage interface from magnetic resonance images of the knee. Phys. Med. Boil. 2007, 52, 1617–1631. [Google Scholar] [CrossRef]
- Shellock, F.G.; Morris, E.; Deutsch, A.L.; Mink, J.H.; Kerr, R.; Boden, S.D. Hematopoietic Bone Marrow Hyperplasia: High Prevalence on MR Images of the Knee in Asymptomatic Marathon Runners. Am. J. Roentgenol. 1992, 158, 335–338. Available online: www.ajronline.org (accessed on 2 July 2020). [CrossRef]
- Yu, Y.; Li, M.; Liu, L.; Li, Y.; Wang, J. Clinical big data and deep learning: Applications, challenges, and future outlooks. Big Data Min. Anal. 2019, 2, 288–305. Available online: https://ieeexplore.ieee.org/abstract/document/8787233/ (accessed on 23 June 2020). [CrossRef]


| QID | Research Questions | Motivation |
|---|---|---|
| RQ1 | Which sort of knee bone images are used for medical image processing in this literature review? | To understand the focus of knee bone images by using the different methodologies. |
| RQ2 | Which techniques or methods are used to study the selected knee bone images? | To identify the methods or technologies for identifying the disease from knee bone images. |
| RQ3 | What are the failure and success ratios? | To identify which techniques are best and worst for medical image processing. |
| RQ4 | Which method or technology is best for which image type? | To identify which technique provides more accuracy for X-rays, MRI, and CT scans. |
| Population | Intervention |
|---|---|
| (Knee Bone) AND (Deep Learn *) | (MRI OR CT-Scan OR X-ray OR Oesth * OR Convolutional Neural Netw * OR Disease * OR Issues OR Challenges OR Accura *) |
| (Knee Bone) AND (Machine Learn *) | (MRI OR CT-Scan OR X-ray OR Oesth * OR Convolutional Neural Netw * OR Disease * OR Issues OR Challenges OR Accura *) |
| Methodology/Techniques | Image Type | # |
|---|---|---|
| Deep Learning | X-ray | 6 |
| MRI | 5 | |
| CT-Scan | 5 | |
| Machine Learning | X-ray | 6 |
| MRI | 5 | |
| CT-Scan | 5 |
| Type | Definition |
|---|---|
| Internal Validity | The point of the investigation, setting, and suppositions are introduced in the examination. |
| External Validity | The discoveries ought to be sufficiently genuine to be connected in the industry or the scholarly community. |
| Construct Validity | The connection between the research questions used to quantify/assess and the results are well characterized. |
| Conclusion Validity | The study and ends are consistent with the RQs and obtained from experimental/hypothetical investigation. |
| Purpose | Metadata |
|---|---|
| General Information | Tables 9 and 10 provide the information extraction frame that is utilized for all the chosen essential investigations to do a top-to-bottom study. It describes the author’s name of the paper, published year, image type, model, data set, disease, and accuracy of the proposed techniques. |
| Specific Information | Tables 11 and 12 demonstrate the work of the researchers that they have done by using different methodologies in their research papers, the prediction of their future work, and the advantages of their research. |
| Explicit Information | Tables 13 and 14 determine the gaps in the review articles on deep learning and machine learning papers. |
| SP# | QA1 | QA2 | QA3 | Score | Score % |
|---|---|---|---|---|---|
| SP1 | A | D | A | 2 | 66.67 |
| SP2 | S | A | D | 1.5 | 50 |
| SP3 | A | A | A | 3 | 100 |
| SP4 | A | S | A | 2.5 | 83.33 |
| SP5 | D | A | S | 1.5 | 50 |
| SP6 | A | A | A | 3 | 100 |
| SP7 | S | D | S | 1 | 33.33 |
| SP8 | A | A | A | 3 | 100 |
| SP9 | S | A | D | 1.5 | 50 |
| SP10 | A | A | A | 3 | 100 |
| SP11 | D | S | D | 0.5 | 16.66 |
| SP12 | A | D | A | 2 | 66.67 |
| SP13 | D | S | A | 1.5 | 50 |
| SP14 | A | A | A | 3 | 100 |
| SP15 | S | A | A | 2.5 | 83.33 |
| SP16 | S | A | A | 2.5 | 83.33 |
| Total | 10.5 | 11.5 | 11 | 34 | 70.83 |
| SP# | QA1 | QA2 | QA3 | Score | Score % |
|---|---|---|---|---|---|
| SP17 | D | S | A | 1.5 | 50 |
| SP18 | A | S | A | 2.5 | 83.33 |
| SP19 | A | A | S | 2.5 | 83.33 |
| SP20 | S | A | S | 2 | 66.67 |
| SP21 | D | A | A | 2 | 66.67 |
| SP22 | S | A | A | 2.5 | 83.33 |
| SP23 | A | D | S | 1.5 | 50 |
| SP24 | A | A | A | 3 | 100 |
| SP25 | D | A | D | 1 | 33.33 |
| SP26 | A | A | A | 3 | 100 |
| SP27 | A | A | A | 3 | 100 |
| SP28 | A | S | A | 2.5 | 83.33 |
| SP29 | A | D | A | 2 | 66.67 |
| SP30 | A | A | A | 3 | 100 |
| SP31 | D | A | A | 2 | 66.67 |
| SP32 | S | A | A | 2.5 | 83.33 |
| Total | 10.5 | 12.5 | 13.5 | 36.5 | 76 |
| S# | Citation | Database | S# | Citation | Database |
|---|---|---|---|---|---|
| S1 | 8 | Science Direct | S17 | 2 | Science Direct |
| S2 | 6 | IEEE | S18 | 13 | Science Direct |
| S3 | 110 | IEEE | S19 | 48 | Science Direct |
| S4 | 29 | IEEE | S20 | 27 | Google Scholar |
| S5 | 7 | Google Scholar | S21 | 9 | Google Scholar |
| S6 | 0 | Springer | S22 | 8 | IEEE Xplore |
| S7 | 0 | ACM | S23 | 7 | Google Scholar |
| S8 | 1 | IEEE | S24 | 51 | Google Scholar |
| S9 | 1 | Science Direct | S25 | 5 | Springer |
| S10 | 0 | ACM | S26 | 212 | Science Direct |
| S11 | 9 | Google Scholar | S27 | 0 | Science Direct |
| S12 | 2 | Science Direct | S28 | 1 | IEEE Xplore |
| S13 | 0 | Google Scholar | S29 | 1 | Google Scholar |
| S14 | 2 | Google Scholar | S30 | 245 | Science Direct |
| S15 | 17 | Springer | S31 | 0 | Google Scholar |
| S16 | 22 | IEEE | S32 | 0 | Google Scholar |
| # | Author | Year | Image Type | Data Set | Model | Disease | Accuracy |
|---|---|---|---|---|---|---|---|
| S1 | “A. Tiulpin, J. et al.” | 2018 | X-ray | 3000 subjects from the Osteoarthritis Initiative dataset. | Deep Siamese Convolutional Neural Network (CNN) | Osteoarthritis | Accuracy = 66.71%, ROC curve = 0.93, AUC = 0.93, MSE = 0.48 |
| S2 | “H. -J. Yang et al.” | 2018 | X-ray | ImageNet dataset | Proposed new model semi-supervised ensemble Wnet (SSEW) | Knee Bone Tumor | Two-class = 97.64% Fourth-class = 79.23% Five-class = 80.31% |
| S3 | “L. Shamir et al.” | 2009 | X-ray | 350 images of X-ray | Kellgren–Lawrence classification | Osteoarthritis | For moderate OA = 91.5%; for minimal OA = 80.4%; for doubtful OA = 57% |
| S4 | “J. Antony et al.” | 2016 | X-ray | Bilateral PA fixed Flexion knee X-ray images | Convolutional Neural Networks (CNN) | Knee Osteoarthritis | 94.2% |
| S5 | “S. S. Gornale et al.” | 2016 | X-ray | 200 datasets of knee X-ray images | The active contour segmentation technique | Osteoarthritis | 87.92% |
| S6 | “Hegadi et al.” | 2019 | X-ray | X-ray images of OA patients | K-Nearest Neighbor Algorithm (KNN) Support Vector Machine (SVM) | Osteoarthritis | For normal images (KNN = 100%, SVM = 79%) For abnormal images (KNN = 100%, SVM = 100%) |
| S7 | “J. Mun et al.” | 2018 | MRI | Online MRI dataset | Scale Space Local Binary Pattern (LBP) feature extraction, SVM | Detection of knee bone from MRI Images | Accuracy = 96.1% MCC rate = 88.26% |
| S8 | “S. Vishwanatn et al.” | 2018 | MRI | MICCAI datasets | CONVOLUTIONAL NEURAL NETWORKS (CNN) | Osteoarthritis | 87.7% |
| S9 | “F. Ambellan et al.” | 2019 | MRI |
| 3D CNNs, SSMs | Osteoarthritis | 3D MRI datasets SKI10 = 75.73%, Dataset OAI Imorphics = 90.4%, Dataset OAI ZIB = 98.5% |
| S10 | “D. Kim et al.” | 2018 | 3D MRI | MRI datasets of knee | 3D deformable approach | Osteoarthritis | DICE = 0.951, SENS = 0.927, SPEC = 0.999, ASSD = 1.16, RMSD = 2.01 |
| S11 | “F. Liu et al.” | 2018 | MRI | MRI datasets of 175 patients | Convolutional Neural Networks (CNN) | Cartilage Lesion | 91% |
| S12 | “X. -D. Wu et al.” | 2017 | CT-Scan images and MRI images | CT scan and MRI data collected from multiple types of research | Systematic literature Review | Osteoarthritis | 95% |
| S13 | “F. La Rosa et al.” | 2019 | 2D CT scan images | Dataset of 21 abdominal CT scan images | Convolutional Neural Networks (CNN) | Applicable for all knee bone diseases for image segmentation | 93% |
| S14 | “S. -W. Jang et al.” | 2014 | CT scan images | CT scan data for multiple patients | “Finite Element (FE)”, “Sobel operator”, “Laplacian of Gaussian operator”, “Canny edge detection” | Knee joint Reconstruction | 83.23% |
| S15 | “H. R. Roth et al.” | 2014 | CT scan images | CT images of 59 patients | Deep, CNN | Sclerotic metastases | 70–80% |
| S16 | “D. Yang et al.” | 2015 | 3D images | 3D image data for knee joints | CNN | Detection on Distal Femur Surface | 80% |
| # | Author | Year | Image Type | Data Set | Model | Disease | Accuracy |
|---|---|---|---|---|---|---|---|
| S17 | “G. B. Sharma et al.” | 2016 | MRI images | Tested reports of Gaucher patients | General Linear Model (GLM) | Gaucher Disease | 70% |
| S18 | “B. G. Ashinsky et al.” | 2015 | MRI images | 35 MRI images | Pattern recognition and multivariable regression (WND-CHARM) | Osteoarthritis Osteochondral | 86% |
| S19 | “P. Bourgeat et al.” | 2007 | 3D MRI | Dataset of 18 images | Support Vector Machine (SVM) | Feature extraction of knee bone for all diseases | 91% |
| S20 | “P. Lin et al.” | 2018 | MRI | (1) 36 BNC samples (2) 40 control samples | Multivariate Support Vector Machine | Osteoarthritis | 97% |
| S21 | “S. Hassanpour et al.” | 2017 | MRI Images | Knee MRI Reports | Support Vector Machine | Diagnostic yield of knee bone reports | 95% |
| S22 | “S. Zahurul et al.” | 2010 | X-ray images | X-ray images of patients | Sobel Edge Detector Operator | Osteoarthritis | 50% |
| S23 | “H. -C. Chen et al.” | 2010 | X-ray images |
| Registration-assisted active shape model | Lateral knee | 80% |
| S24 | “S. E. Lim et al.” | 2004 | X-ray images | 432 images of the femur | Support Vector Machine and Bayesian Classifier | Osteoporosis | 97.2% |
| S25 | “C. Kruse et al.” | 2017 | X-ray | 75,000 patients’ data | Bootstrap Aggregation | Osteoarthritis | 95% |
| S26 | “W. A. Hoff et al.” | 1998 | 3D X-ray images | 24 X-ray images | Computer-aided Design (CAD) | Femoral tibia | 50% |
| S27 | “Brahim et al.” | 2019 | X-ray Images | 1024 X-ray images | Multivariate Linear Regression (MLR) | Osteoporosis | 82.98% |
| S28 | “F.Demenegas et al.” | 2011 | CT scan images | Micro CT trabecular datasets | Chan–Vese and Fixed Threshold | For all diseases of knee bone | 60% to70% |
| S29 | “C. Chen” | 2014 | CT scan images | Multidetector Computed Tomography (MDCT) dataset | Finite Element Method | Osteoporosis | 98% |
| S30 | “D. A. Dennis et al.” | 2005 | 3D CT scan images | 10 knees, experienced patterns | The helical axis of the model | Anterior cruciate ligament-deficient | 90% |
| S31 | “O. Jin” | 2015 | CT images | Seven samples of pig femur bone | Finite element model | Non-specific study, elastic study of bone | 65% |
| S32 | “D. Yang et al.” | 2013 | CT images | CT scan images of patients | Finite Element Model (FME) | Porcine Trabecular Bone | 70% |
| # | Contribution | Prediction | Advantage |
|---|---|---|---|
| S1 | In the present examination, the authors showed a novel methodology for naturally diagnosing and reviewing knee OA from plain radiographs. Rather than past examinations, their model uses explicit highlights significant for the ailment, ones that are practically identical to the ones utilized in clinical practices(e.g., bone shape, joint space, etc.). Besides, considering the recently described methodologies, their technique accomplishes the best multi-class grouping results, despite having an alternate testing set: a normal multi-class precision of 66.71%, AUC of 0.93 for radiographical OA detection, quadratic weighted Kappa of 0.83, and MSE of 0.48. This can be contrasted with normal human understandings. [4] | The considerable description of their model unmistakably shows that it adapts progressive neighborhood inclusions that feature genuine important radiological discoveries. The most likely reason is that they forced space learning limitations (earlier anatomical information) in the system’s design, in this way, driving it to learn just the highlights identified with the radiographical discoveries, for example, osteophytes, bone distortion, and joint-dividing narrowing, which are altogether used to review the picture as indicated by the KL scale. They additionally report another clinically applicable outcome, the likelihood appropriation of the KL reviews of the pictures. These data come genetically from the system’s design and can be utilized as another wellspring of advantageous analytic data. For instance, if the model is not sure about the expectation (prediction), this is found in the distributions. | It was prepared exclusively with the MOST dataset and tried with the OAI dataset. The principal preferred aspect of this current study’s structure was the exhibition of the model’s capacity to learn significant OA highlights that are transferable across various datasets. This demonstrates that their strategy is strong for various phenomena and information-obtaining settings. It can help patients experiencing knee pain to obtain a quicker finding. Social insurance, by and large, will profit by a decrease in the expenses of routine work. |
| S2 | In this paper, the researchers provide a successful end-to-end deep learning model for knee bone tumor assessment. The proposed model considers the quality of a mix of supervised and unsupervised methods of detecting significant patterns for recognizing ordinary/anomalous bone and characterizing what kind of bone a tumor is. Besides, they apply the troupe system to improve the general execution. The test results demonstrate that their proposed model beats the notable existing models. [19] | In future work, the researchers will grow the present model to determine the tumor’s position, which may altogether support clinical treatment. | The researcher’s proposed model SSEW utilizes determines how to produce the more auxiliary highlights unsurpervised, which not just decreases the computational expense but also provides more data for characterization. Besides, they apply the joint system to improve precision in terms of bone tumor characterization. |
| S3 | In this paper, the authors depicted a computerized methodology for the location of OA using knee X-rays. Without an exact technique for OA analysis, the physically grouped KL review was utilized. The order is not performed such that endeavors to emulate the human grouping, however, depends on an information-driven methodology utilizing physically arranged X-beams of various KL grades, speaking to various phases of OA seriousness. The test results suggest that over 95% of moderate OA cases were accurately separated from ordinary cases, with a false positive rate of ∼12.5%. The order exactness for separating negligible OA from ordinary cases was ∼80%, and the discovery of dicey OA cases was far less persuasive. [20] | Future endeavors for enhancing the location precision for suspicious OA will incorporate the joining of important clinical data, for example, history of knee damage, body weight, and knee arrangement points; furthermore, they will likewise utilize more X-ray tests, as they are accessible. | This study was performed in the unique situation of a longitudinal aging study that will improve the examination of imaging information not exclusively for clinical OA issues such as pain but also for physiological estimates to apply to aging body issues that may add to OA seriousness. |
| S4 | This paper researched a few new techniques for the programmed measurement of knee OA seriousness utilizing the CNN model. This is increasingly exact and, furthermore, quicker than layout coordination. Their underlying way of determining the knee OA seriousness utilized highlights removed from pre-prepared CNNs. [21] | In the future, there is a plan to increase the accuracy of the CNN model of the knee joint by applying more techniques. | Past examinations have surveyed their calculations utilizing parallel and, furthermore, multi-class order measurements. This methodology was prepared to utilize relapse misfortune with the goal that mistakes are punished to the extent of their seriousness, creating more precise expectations. This methodology likewise has the advantageous property that the expectations can fall between evaluations, which accords with a nonstop infection situation. |
| S5 | Their methodology consists of 5 major steps: Image Acquisition, Image Pre-processing, Image Segmentation, Image Enhancement, and Feature Extraction, and their experimental results gained by applying the following 7 steps of their proposed active contour algorithm: The first step is pre-handling, i.e., clamor removal, picture handling, resizing, etc., and conversion to dim scale. The second step is normalizing the blurred scale picture to measure 250x250 for further investigation. The third step is segmentation, which utilizes the active shape calculation. The fourth step is to divide picture, which is improved utilizing a contrast change procedure to enable further understanding. In the fifth step, the diverse highlights are registered as shape highlights, statistical highlights, first-four minutes, Haralick highlights, and texture examination highlights. In the sixth step and lastly, 40% preparation and 60% testing is done on the acquired rundown of highlights utilizing a Random Forest classifier. The seventh step is the end of the calculations and results. [22] | In the future, an innovation or process should be produced that is related to osteoarthritic pain and clinical side effects, for example, regardless of whether the side effects are identified with joint tissue, neuropathic pain, solid pain, etc. This may help in obtaining a great arrangement rate. | A knee X-ray picture is especially inclined to undesirable bends, which may be caused by the issue breaking down the bone structures. To overcome these issues, researchers have utilized a semi-computerized strategy that represents a speedy and productive technique for dissecting the variations from the norm and issues related to the bone structures. |
| S6 | Their proposed technique could order both ordinary and anomalous pictures accurately utilizing the KNN and cubic SVM classifier. The grouping rate for typical pictures utilizing the KNN classifier is 100%; however, for the SVM, it is 79%. For irregular pictures, the KNN and, furthermore, SVM give 100% precision. The general characterization exactness of the SVM classifier is 89%. These two grouping strategies show fourfold cross-approval. [23] | In specific cases, the calculation neglects to determine the focal piece of the synovial cavity area, which might be considered for future upgrades. | The proposed method provides more accuracy than the existing algorithm. |
| S7 | In this research, the authors utilized SSLBP inclusion extraction, a variation of the neighborhood paired example, to prepare and order the pre-handled MRI images utilizing SVM. The exploratory outcome demonstrated that their methodology had higher ACC and MCC values than fluffy c-implies and, furthermore, deep component extraction techniques. Exact knee bone recognition through the proposed model would be an essential aid for the improvement of a completely self-sufficient careful framework. [24] | Researchers have no plan to do more research on this topic | The after-effects of their proposed methodology show higher ACC and MCC values than force-based strategies, particularly for MCC results. These exploratory outcomes demonstrate that the SSLBP highlight extraction connected to the SVM is better than the existing force-based picture-preparing instruments, for example, fluffy c-implies calculations. Additionally, the SSLBP highlights which things separated from their instincts in the proposed strategy beat the separated highlights from the DNN with ImageNet. |
| S8 | In this paper, the researchers built up a knee ligament division calculation from a high goal Machine Learning MR volume utilizing a novel, completely 3D Convolutional Neural Network (CNN). This is, to our knowledge, the main programmed ligament division strategy utilizing 3D CNNs. The proposed calculation performed superiorly to the best in the class calculation in the MICCAI SKI10 open test. They additionally connected their proposed calculation to another comparative MR differentiate (DESS) given by the Osteoarthritis Initiative (OAI) for OA evaluation and introduced enhanced division correctness. An initial subjective appraisal of the division results outwardly delineates ligament problems from longitudinal knee MR information. [25] | The accuracy of the proposed system will be further improved in the future. | Researchers have demonstrated that u-net performed superiorly to the current cutting edge technique within clinically satisfactory runtimes. Their Dice score measures fluctuate between 78.5% and 85.7% for different ligament surfaces for information goals of 1 × 1 × 1. 5 mm3. These Dice scores are near the revealed mean inter-observer reproducibility of 87.7%. They accept that the proposed strategies will have enhanced exactness and facilitate the programmed quantitative assessment of knee ligament morphology for the appropriation of the quantitative MRI methods for OA in routine clinical practice. |
| S9 | The researchers present a strategy for the mechanized division of knee bones and ligaments from MRI that consolidates the earlier information of anatomical shape with Convolutional Neural Networks (CNNs). The proposed approach fuses 3D Statistical Shape Models (SSMs) just as 2D and 3D CNNs to accomplish a stronger and exact division of even very unusual knee structures. The shape models and neural systems utilized are prepared to utilize information from the Osteoarthritis Initiative (OAI) and the MICCAI‘s amazing test “Division of Knee Images 2010” (SKI10), separately. They assess their strategy on 40 approval and 50 accommodation datasets from the SKI10 challenge. Unexpectedly, an exactness proportionate to the between-eyewitness changeability of human perusal is accomplished in this test. Additionally, the nature of the proposed strategy is completely assessed utilizing different measures for information from the OAI—for example, 507 manual divisions of bone and ligaments, and 88 extra manual divisions of the ligaments. Their technique yields sub-voxel exactness for both OAI datasets. They make the 507 manual divisions, like their exploratory setup, freely accessible to additionally help exploration in the field of therapeutic picture division. Taking everything into account, consolidating confined arrangements through CNNs with measurable anatomical learning using SSMs results in a best-in-class division strategy for knee bones and ligaments from MRI information. [26] | Later on, a more upfront assortment of SSMs and CNNs may improve the advantages of shape information and offer the capability to the CNN of preparing and also differentiating low-scale datasets. To help this advancement, the manual divisions made by experienced clients at the Zeus 570 Institute Berlin are made freely accessible as a feature of this distribution. | In the researcher’s work, the robotized strategy lessens the time needed for an exact division of knee bones and 505 ligaments by a factor of six compared with manual divisions by an accomplished user. |
| S10 | The researchers of this research created and assessed a programmed 3D deformable methodology in knee MRI having force inhomogeneity. They showed that the underlying point can be resolved dependomg on the histogram with earlier learning. It is additionally striking that no preparation stage is required, dissimilarly to in other custom deformable models, for example, ASM, AAM, and map book-based models. Exploratory outcomes showed that their methodology accomplishes 95% Dice, 93% SENS, and 99% SPEC in the volume assessment but an ASSD of 1.17mm and RMSD of 2.01mm in the surface assessment. [5] | Later on, they have plans to, for the most part, improve the after-effects of surface in the 3D division. Additionally, they will assess other arrangement types of X-rays to demonstrate their suitability for application to the therapeutic field. | The outcome demonstrates that their proposed methodology is valuable for performing basic and precise bone division for knee bone analysis. |
| S11 | A completely robotized deep learning-based ligament sore location framework was produced by utilizing division and, furthermore, arrangement convolutional neural systems (CNNs). Fat-smothered T2-weighted quick turn reverberate MRI informational collections of the knees of 175 patients with knee issues were reflectively broken down by utilizing the deep learning strategy. The reference standard for preparing the CNN order was the elucidation given, by the cooperating prepared musculoskeletal radiologist, of the nearness or nonappearance of a ligament sore in 17,395 little picture patches of the articular surfaces of the femur and tibia. Recipient working bend (ROC) examination and the k measurement were utilized to survey symptomatic execution and intraobserver understanding for identifying ligament sores for two individual assessments performed according to the ligament core location framework. [27] | Extra specialized improvement and approval work is expected to enhance the present ligament injury discovery framework. Upgrades to the indicative execution could be accomplished if the CNNs could assess various groupings with various tissue contrasts. | This investigation exhibited the possibility of utilizing a completely robotized deep learning-based ligament injury identification framework to assess the articular ligament of the knee joint with high demonstrative execution and great intraobserver understanding for distinguishing ligament degeneration and intense ligament damage. |
| S12 | In this systematic literature review, six examinations with an aggregate of 336 knees met the qualification criteria, and the four preliminaries were incorporated into the meta-examination. Contrasted and MRI-based PSI frameworks and CT-based PSI frameworks were related to a higher anomaliy frequency of coronas in the general appendage arrangement. While there were no noteworthy contrasts in the coronal/sagittal arrangement of the femoral/tibia segment exceptions, the precise coronal blunders in the general appendage arrangement, the rakish mistakes in the femoral/tibia segments in the coronal plane, or the frequency of increases in the embedded sizes of the femoral/tibia segments were monitored. [28] | This meta-investigation proposed that MRI-based PSI frameworks are related to a lower occurrence of anomalies of coronas with general appendage arrangements, smaller rakish coronal phenomena with general appendage arrangements, and shorter activity times than CT-based PSI. Both CT-and MRI-based PSI have advantages and disadvantages and are powerless to differentiate between many issues; therefore, PSI requires constant enhancement to accomplish better clinical results than have previously been prescribed for routine use. | To the best of researchers‘ insight, this is the first orderly study and meta-investigation of planned relative preliminaries to thoroughly and efficiently look into the current accessible literature and discover that MRI-based PSI offers potential clinical points of interest compared with the CT-based PSI: CT-based PSI is related with a higher rate of coronal anomalies and large appendage arrangements, bigger coronal rakish blunders and large appendage arrangements, and longer activity time requirements. |
| S13 | This work shows the credibility of the program’s bone division and characterization of CT scans utilizing a CNN. The model accomplishes a high Dice coefficient and ends up being very robust to Gaussian clamor. In any case, a few constraints and enhancements that would unquestionably expand the execution are distinguished. An enhanced yet comparative model could be helpful in a few clinical and examine applications for numerous therapeutic undertakings. [6] | Later on, an extremely intriguing improvement would comprise actualizing the system with 3D conventional layers. As the bones are 3D structures, the system would have the capacity to extricate more highlights and likely accomplish a higher division exactness. Particularly, the ribs, which present an extremely divided shape in transversal cuts, need to be better represented. | The proposed CNN approached in this research will improve the accuracy of bone segmentation. |
| S14 | With the popularity of picture division to create a 3D display from CT information, enthusiasm for target appraisal for the 3D models acquired utilizing different division strategies has been expanding. [29] | Taking everything into account, the Canny edge identification and calculation indicated great execution in the results of 3 out of 5 tests, showing that it is ideal for the remaking of a 3D solid model as compared to other approaches used for this research. | The Canny edge detection algorithm is best for constructing a 3D solid model. |
| S15 | The researchers structure a two-layered coarse-to-fine course structure to initially develop an exceptionally delicate and hopeful age framework with the greatest affectability of ∼92% but with a high FP level (∼50 per understanding). Areas of intrigue (ROI) for injury hopefuls are produced in this progression and capacity as a contribution to the second level. At the second level, we create N 2D sees, utilizing scale, arbitrary interpretations, and pivots as for every rouse centroid organization. These irregular perspectives are utilized to prepare a profound Convolutional Neural Network (CNN) classifier. In testing, the CNN is utilized to allocate singular probabilities for another arrangement of N irregular perspectives that are arrived at at the midpoint of every rouse to register at last, for each hopeful, the grouping likelihood. This second level acts as a profoundly specific procedure to dismiss troublesome false positives while preserving high sensitivity. We approve the methodology for the CT pictures of 59 patients (49 with sclerotic metastases and 10 typical controls). The proposed technique lessens the quantity of FP/Vol. From 4 to 1.2, 7 to 3, and 12 to 9.5 when looking at affectability rates of 60, 70, and 80% separately in testing. The Area-Under-the-Curve (AUC) is 0.834. The outcomes indicate marked enhancement compared to in past work. [30] | The mechanized identification of sclerotic metastases (bone sores) in Computed Tomography (CT) pictures can be an essential apparatus in clinical practice and research. The best-in-class strategies demonstrate execution with a 79% affectability or genuine positive (TP) rate, with 10 false-positives (FP) per volume. | The researchers results‘ showed that their proposed methodology provides more accuracy than previous work. |
| S16 | In this paper, the researchers proposed a novel structure to determine seven anatomical milestones of the distal femur bone. Their methodology is programmed, and it consolidates both worldwide shape data and nearby work shapes. The precise confinement of the anatomical tourist spots on the distal femur bone in the 3D restorative pictures is vital for knee medical procedure arranging and biomechanics examination. Be that as it may, the milestone ID process is frequently led physically or by utilizing the embedded assistants, which is tedious and lacks precision. In this paper, a programmed restriction technique is proposed to determine the places of introductory geometric tourist spots on the femur surface in 3D MR pictures. Because of the outcomes from the convolutional neural system (CNN) classifiers and shape measurements, we utilize limited band diagram slice improvement to accomplish the 3D division of the femur surface. Eventually, the anatomical tourist spots are situated on the femur as indicated by the geometric signals from the surface work. Tests show that the proposed strategy is powerful, productive, and reliable for sectioning femurs and determining anatomical milestones. [31] | There are a few bearings for future research work. One conceivable bearing is to expand preparing fluctuation and perform course location for higher accuracy. This work could likewise be extended to determine other anatomical milestones for different bones (for example, tibia) or organs in restorative pictures with contrast modalities. | Their investigation adds to the useful utilization of the 3D restorative picture preparation by enhancing the exactness of milestone limitation. |
| # | Contribution | Prediction | Advantage |
|---|---|---|---|
| S17 | In this research article, machine learning-based examination distinguished bone miniaturized scale structure changes that may clarify the pathogenesis of GD bone delicacy (Bone-GD Tablet is used in the treatment of Osteoarthritis), provide markers to evaluate the seriousness of bone defects, and provide a quantitative standard for scoring therapeutic interventions. Work is in progress to apply this method to deal with the study of bigger subtype test sizes and perform 3D small-scale design biomechanical examinations. [32] | Concerning the viability of the exhibited procedures, the researchers of this paper have a plan to more comprehensively examine the trabecular bone of various subgroups with coordinated controls, with the objective of distinguishing subgroups at more serious risk, as well as identifying treatment adequacy sooner. | This present study’s motivation was to build up a strategy to measure the seriousness of bone ailments in type 1 GD patients and to differentiate between various GD genotypes and between GD patients and healthy people. |
| S18 | A way to deal with the MRI images of ligament debasement is proposed utilizing structure acknowledgment and multivariable relapse in which picture highlights from the MRIs of histologically scored human articular ligament plugs were processed utilizing weighted neighbor separation utilizing a compound chain of importance of calculations, related to morphology (WND-CHRM). The WND-CHRM technique was first connected to a few clinically accessible MRI scan types to perform a parallel classification of typical and osteoarthritis osteochondral plugs depending on the Osteoarthritis Research Society International (OARSI) histology framework. Additionally, the picture highlights registered from WND-CHRM were utilized to build up various straight least-squares relapse demonstrations for the order and expectation of OARSI scores for every ligament plug. [33] | Numerous direct least-squares relapse predictions effectively anticipated OARSI scores and arranged attachments with correctnesses as high as 86%. | WNDCHRM (is an open source utility for biological image analysis) might be an effective technique for the grouping of ligament MRIs. |
| S19 | The researchers study the programmed characterization of finished tissues via 3D MRI. With an MRI flag structure, there is no need for unfolding. The additional data separated from the stage allow better division than just utilizing greatness highlights. A greatness increment is acquired by diminishing the number of pixels that should be characterized [7]. | Forthcoming work will investigate different procedures to remove stage data without stage unwrapping and consider different organs and groupings where the stage can help division and investigation. | This research uses the complex magnetic resonance signal, which provides the segmented information. |
| S20 | The researchers examined whether multivariate help vector machine examination would allow enhanced tissue portrayal. SVM examination was performed utilizing certain parameter combinations especially ideal for grouping properties. All in all, ordinarily, the parametric MRI appraisal of grid status in a degenerative ligament is restricted by the cover in parameter esteems between shifting degrees of debasement. [34] | The outcomes show the capacity of multivariate examination to incredibly improve the MRI appraisal of ligament network status for essential scientific studies. | Deprivation probabilities obtained from the SVM technique exhibited extraordinarily more grounded relationships with biochemical estimations than did singular MRI parameters. |
| S21 | In this research, the natural language processing framework was prepared, to master ordered knee MRI reports from two noteworthy human services associations. Radiology reports were displayed in the preparation set as vectors, and a help vector machine structure was utilized to prepare the classifier. A different test set from every association was utilized to assess the execution of the framework [35]. | The information strengthens the attainability of the multi-institutional characterization of radiological imaging content reports with a solitary machine learning classifier without requiring a foundation explicit preparation of information. | The researchers assessed the execution of the framework both inside and across associations. |
| S22 | This method was utilized to distinguish the edges of restorative pictures, especially knee osteoarthritis pictures, in various basic states utilizing Sobel administrator and the proposed developed Sobel calculation. Furthermore, the actualized program is exceptionally productive at runtime and good at identifying edges. Moreover, the program has overcome numerous weaknesses, for example, obscuring and commotion affectability [36]. | The entire program will be actualized in a chip base to enhance execution time for high-caliber and little-differentiable pictures. | The proposed algorithm is very good for blurred and distorted images. |
| S23 | In this paper, the researchers have proposed a model-guided milestone limitation strategy for programmed ISR estimation. At first, the proposed technique required building a patella to demonstrate factual patella shapes and power data from preparatory information. A component point extraction calculation was used to determine the underlying model position naturally [37]. | Later on, the proposed strategy can be utilized to examine the impacts of subjects‘ ages, races, life propensities, or work types on the typical scope of ISR. On the off-chance that there are any all-encompassing studies or applications that require more prominent exactness or proficiency of confinement, we may embrace the multi-goals system for enhancing the framework execution. | The precision of the proposed technique was confirmed by both quantitative and subjective tests. The concordance between the results and physically estimated ISRs was effectively proved by a high relationship coefficient. |
| S24 | This paper exhibits a researcher’s exploration of the recognition of bone breaks in X-ray pictures. A suite of techniques that join diverse highlights and order procedures have been produced and tried for recognizing femur breaks [38]. | The researcher’s next target is to build up a model framework for field tests in the medical clinic. | The favorable aspect of this versatile examinatopm technique is that it requires the extraction of only estimated bone forms. In this way, it can likewise endure a slight variation in shape over various patients; furthermore, it does not require the extremely precise extraction of the bone forms. |
| S25 | The researchers present a principal joined utilization of a few developed prescient models from the field of managed machine learning for hip crack forecast in a populace of DXA scanned people. The archive that groups tree-based models that utilize boosting and bootstrap conglomeration methodologies can enhance oppressive capacities for autonomous subjects and give adequate aligned probabilities with the best dependability for the female companions. They trust that these execution measurements can be further enhanced through the gathering of existing global datasets and longer perception periods [39]. | Further enhancements in prescient capacity are likely conceivable with the accumulation of more information and longer perception periods. | Machine learning can enhance hip fracture forecast past calculated relapse utilizing gathering models. |
| S26 | A technique has been developed to precisely gauge the the three-dimensional position and introduction (present) of fake knee embeds in vivo from X-ray fluoroscopy pictures utilizing intelligent 3D PC design. In vitro precision tests demonstrate that the technique is exactly within 0.5 mm of error for interpretations parallel to the picture plane and within 0.35” of introductions about any hub [40]. | Researchers have discovered that it is best to fit the femoral part first—at that point, the tibia segment. | The strategy can, on a basic level, be connected to any joint where precise CAD models are accessible. |
| S27 | This investigation has presented a robotized computer-aided diagnostic approach for the identification of OA, which the utilizes a mix of standardizations given presciently, displaying MLR utilization and highlight extraction utilizing ICA. The standardization utilizing MLR permitted us to not only lessen the inter-subject changeability but also expand the partition between CC and OA gatherings. Further investigation uncovered that the proposed framework can provide high-classification execution in recognizing solid and osteoarthritic patients from various knee sides [41]. | This CAD framework stays away from the subjectivity and the significance of the administrative skill involved in manual activities and can make predictions based on inconspicuous information. | The classification rates of the proposed CAD are higher than those obtained in past studies. |
| S28 | This research study explores the morphometrical comparison between CT scan databases for miniaturized objects by using the two-division procedure. In all three datasets and both deliberate parameters, measurable differences were found, especially for the demonstration of the expanded parameters of the pictures sectioned by this CV method [42]. | The CV calculation is proposed in instances of basic BV/TV esteems because of its protection from the fracture impact. | The primary constraint of the present investigation is the nonappearance of a strong standard against which to compare the diverse outcomes. |
| S29 | This paper attempts to fill the gap with a total and completely programmed system of FEM, displaying and applying it to MDCT pictures. It proposes a space-variant hysteresis picture preparation convention for bone pictures. Cutting-edge strategies for work age are connected as for work quality in the structure. Bone solidness is processed with μ-CT, and MDCT utilizes this system [43]. | Real bone solidness is dictated by mechanical testing. Bone anticipated as more solid by FEM was seen to be very reproducible and relate well with that anticpiated so by the mechanical testing. The outcome shows that MDCT can be utilized for FEM recreation. | The system has been effectively connected to the FEM of both μ-CT and MDCT imaging under certain conditions. At present, the technique is explored for MDCT pictures in an Iowa bone improvement study, and the pilot considers information including on subjects from various investigation cohorts with anticipated distinctions in bone digestion. |
| S30 | The goal of the present examination was to utilize fluoroscopy to precisely decide the three-dimensional (3D), in vivo, weight-bearing kinematics of 10 typical and five front cruciate tendon-lacking (ACLD) knees. Persistent explicit bone models were derived from registered tomography (CT) information [44]. | The PC-created 3D models of each subject’s femur and tibia are unequivocally enlisted to the 2D computerized fluoroscopic pictures utilizing an improved calculation that naturally changes the posture of the model at different flexion/augmentation edges. | The preference of the present trial demonstrates that it is a permitted investigation under in vivo, weight-bearing conditions for the whole scope of knee flexion. |
| S31 | The primary objective of this study was to assemble a limited component, demonstrate phenomena for trabecular bone from small scale figured tomography (miniaturized scale CT) pictures, and concentrate on the flexible properties of bone. We additionally contemplated the connection between the Young’s modulus and porosity of trabecular bone. Analysts in the past have demonstrated that porosity and clear thickness were the two fundamental factors that influenced the Young’s modulus of trabecular bone [45]. | To additionally direct this investigation, tests from different kinds of human bones ought to be planned. | For a limited component examination strategy, various yields can be extricated as required. |
| S32 | In this examination, a few morphological parameters were estimated at the same time for each example as opposed to simply concentrating on a couple of parameters. Thus, the coefficient of assurance expanded the utilization of the different relapses. However, it is still evident that the porosity and obvious thickness unequivocally influence the mechanical properties of trabecular bone [46]. | The parameters tended to in this examination are not intently correspondent to one another. Accordingly, including these non-correspondent parameters in the direct various relapses improved the exactness. | Some morphological parameters are identified with one another; the number of parameters could be diminished, generally leaving only obvious thickness |
| # | Gaps |
|---|---|
| S1 | By looking at the longitudinal information of the resulting values, a slight weakness of the ligament is seen in the MR cuts, just as in the division results, along these lines, showing the potential clinical utility of the proposed calculation. |
| S2 | In the results of this research, it may very well be observed that the pre-trained models indicate low execution in the errand of bone tumor order determination. The reason is that these modes have experienced an over-fitting issue because of the high number of calculations but fewer measures of information. |
| S3 | The arrangement precision of KL Grades 1 and 2 cannot be observed as solid, noting that the radiographs per user are frequently tested in order to recognize these evaluations, and in this manner, the confusion of the automated identification between these two evaluations cannot be considered astonishing. |
| S4 | There is a need to investigate more feature extraction by using classification for the detection of the knee joint. |
| S5 | The examination of the disorder is done according to both clinical side effects and radiological appraisal. While the authors have considered only the radiological appraisal of knee X-rays, the mischaracterization rate is rather high. |
| S6 | The ordinary picture delivered lower vitality when contrasted with the anomalous picture. The proposed calculation comes up short if the bone part in the X-ray picture is skewed, since the recognizable proof of the focal piece of synovial depression locale strongly relies upon the situation of the bone, and it is required to be immaculate in a vertical way. |
| S7 | The particular element of the bones is the unevenness of power, which can impact the result’s accuracy. |
| S8 | In the OAI information, each of the 88 patients contributes two MR volumes (~1 year, separated), which can freely fall in testing, and preparing the dataset may reveal some inclination in the assessed blunder measurements. |
| S9 | This methodology could not be utilized to use bigger subvolumes or even the full picture for the division of knee bones and ligaments, which could continually be refined by shape information. |
| S10 | The proposed outcome does not indicate a huge enhancement of the precision in surface measurements. |
| S11 | Their study had several limitations. Only the articular ligament on the femur and tibia was assessed, and the division and characterization CNNs were most certainly not streamlined for evaluation in this research. |
| S12 | PSI requires ceaseless enhancement to accomplish better clinical results than have previously been described for routine use. |
| S13 | A few constraints and upgrades that would most likely improve the execution are distinguished. An enhanced yet comparative model may not be helpful in a few clinics, and applications in various medicinal assignments should be looked into. |
| S14 | Additionally, the proposed Method 3 had a blunder rate practically identical to that of Method 1, dependent on the response drive. |
| S15 | This second level continues as a very particular procedure to dismiss troublesome false positives while preserving high sensitivities. |
| S16 | The outrageous work cost of the MRI investigation makes the procedure wasteful and costly. |
| # | Gaps |
|---|---|
| S17 | This present investigation’s impediment includes the two-dimensional examination, restricted age range, and insufficient sizes for a few subgroups. |
| S18 | There is a requirement for increasingly delicate magnetic resource imaging strategies that can recognize inconspcious changes related to pre-radiographic OA and that may conceivably serve as biomarkers for malady initation and movement. |
| S19 | This methodology would expand the multifaceted nature of the calculation. |
| S20 | This study further shows the requirement for the evaluation of multivariate techniques in settings of various attractive fields, temperatures, and heartbeat groupings, as well as in appliction to other ligament models, for example, osteoarthritis and designed tissue. |
| S21 | The interinstitutional order precision, while adequate, was not as high as interinstitutional examination. |
| S22 | The basic piece of the knee bone structure is completely overlooked, which is crucial for finding knee issues. |
| S23 | ASM techniques cannot accomplish satisfactory limitation results, since they ill suit the vast varieties of patellae present among various pictures. |
| S24 | The fraction identification rate of the person classifier is not high. |
| S25 | This methodology is doubtful as it can expel exceptional indicators. |
| S26 | The strategy does not gauge the interpretation opposite to the picture plane and expects that the two knee segments are adjusted toward this path. |
| S27 | The speculation capacities of the proposed strategy could be overestimated and ought to be taken with caution. |
| S28 | The rate of distinction between the used databases in this study was observed to be greater, which prompts typical outcomes and representation of the trabecular bone. |
| S29 | The system is required to be connected in a more extensive territory on imaging. |
| S30 | Picture twisting and non-uniform scaling can happen; these cannot be made up for via watchful alignment. |
| S31 | This investigation has a few limitations. As a matter of first importance, the examples utilized in this investigation are porcine femurs rather than human bone. Even though the macro-structure and micro-structure of porcine bones are fundamentally the same as those of human bones, the creation of trabecular bone is extraordinary. |
| S32 | Some morphological parameters are identified with one another; the number of parameters could be diminished, generally leaving only obvious thickness. |
| Deep Learning Techniques | Machine Learning Techniques |
|---|---|
|
|
| X-ray | MRI | CT Scan | |
|---|---|---|---|
| Deep Learning | 87.7% | 91.8% | 86.24% |
| Machine Learning | 75.9% | 87.8% | 77.6% |
| Studies | Datasets | X-Ray | MRI | CT Scan |
|---|---|---|---|---|
| S1 | 3000 subjects from the Osteoarthritis Initiative dataset | 66.71% | No | No |
| S2 | ImageNet dataset | 97.64% | No | No |
| S3 | 350 images of X-rays | 84.72% | No | No |
| S4 | Bilateral PA fixed flexion knee X-ray images | 94.2% | No | No |
| S5 | 200 datasets of knee X-ray images | 87.92% | No | No |
| S6 | X-ray images of OA patients | 94.9% | No | No |
| S7 | Online MRI dataset | No | 96.1% | No |
| S8 | MICCAI datasets | No | 87.7% | No |
| S9 |
| No | 88.21% | No |
| S10 | MRI datasets of knee | No | 95.9% | No |
| S11 | MRI datasets of 175 patients | No | 91% | No |
| S12 | CT scan and MRI data collected from multiple types of research | No | No | 95% |
| S13 | Dataset of 21 abdominal CT scan images | No | No | 93% |
| S14 | CT scan data of multiple patients | No | No | 83.23% |
| S15 | CT images of 59 patients | No | No | 80% |
| S16 | 3D image data of knee joints | No | No | 80% |
| Total Accuracy | 87.7% | 91.8% | 86.24% |
| Studies | Datasets | X-Ray | MRI | CT Scan |
|---|---|---|---|---|
| S17 | Tested reports of Gaucher patients | No | 70% | No |
| S18 | 35 MRI images | No | 86% | No |
| S19 | Dataset of 18 images | No | 91% | No |
| S20 | (1) 36 BNC samples, (2) 40 control samples | No | 97% | No |
| S21 | Knee MRI reports | No | 95% | No |
| S22 | X-ray images of patients | 50% | No | No |
| S23 | (1) 21 images for training patella, (2) 48 images as the validation set | 80% | No | No |
| S24 | 432 images of the femur | 97.2% | No | No |
| S25 | 75,000 patients’ data | 95% | No | No |
| S26 | 24 X-ray images | 50% | No | No |
| S27 | 1024 X-ray images | 82.98% | No | No |
| S28 | Micro CT trabecular datasets | No | No | 65% |
| S29 | Multidetector Computed Tomography (MDCT) dataset | No | No | 98% |
| S30 | 10 knees-experienced patterns | No | No | 90% |
| S31 | Seven samples of pig femur bone | No | No | 65% |
| S32 | CT scan images of patients | No | No | 70% |
| Total Accuracy | 75.9% | 87.8% | 77.6% |
© 2020 by the authors. Licensee MDPI, Basel, Switzerland. This article is an open access article distributed under the terms and conditions of the Creative Commons Attribution (CC BY) license (http://creativecommons.org/licenses/by/4.0/).
Share and Cite
Khalid, H.; Hussain, M.; Al Ghamdi, M.A.; Khalid, T.; Khalid, K.; Khan, M.A.; Fatima, K.; Masood, K.; Almotiri, S.H.; Farooq, M.S.; et al. A Comparative Systematic Literature Review on Knee Bone Reports from MRI, X-Rays and CT Scans Using Deep Learning and Machine Learning Methodologies. Diagnostics 2020, 10, 518. https://doi.org/10.3390/diagnostics10080518
Khalid H, Hussain M, Al Ghamdi MA, Khalid T, Khalid K, Khan MA, Fatima K, Masood K, Almotiri SH, Farooq MS, et al. A Comparative Systematic Literature Review on Knee Bone Reports from MRI, X-Rays and CT Scans Using Deep Learning and Machine Learning Methodologies. Diagnostics. 2020; 10(8):518. https://doi.org/10.3390/diagnostics10080518
Chicago/Turabian StyleKhalid, Hafsa, Muzammil Hussain, Mohammed A. Al Ghamdi, Tayyaba Khalid, Khadija Khalid, Muhammad Adnan Khan, Kalsoom Fatima, Khalid Masood, Sultan H. Almotiri, Muhammad Shoaib Farooq, and et al. 2020. "A Comparative Systematic Literature Review on Knee Bone Reports from MRI, X-Rays and CT Scans Using Deep Learning and Machine Learning Methodologies" Diagnostics 10, no. 8: 518. https://doi.org/10.3390/diagnostics10080518
APA StyleKhalid, H., Hussain, M., Al Ghamdi, M. A., Khalid, T., Khalid, K., Khan, M. A., Fatima, K., Masood, K., Almotiri, S. H., Farooq, M. S., & Ahmed, A. (2020). A Comparative Systematic Literature Review on Knee Bone Reports from MRI, X-Rays and CT Scans Using Deep Learning and Machine Learning Methodologies. Diagnostics, 10(8), 518. https://doi.org/10.3390/diagnostics10080518