Abstract
A total of fourteen diverse, interspecific hybrid grapevines (Vitis spp.) were evaluated for their adaptability to North Dakota winter conditions using differential thermal analysis (DTA) of low-temperature exotherms (LTE) and bud cross-sectional assessment of survival techniques. This research was conducted in two vineyard locations in eastern North Dakota. This work demonstrates the use of DTA for monitoring and selecting cultivars capable of withstanding sub-zero temperatures. These results were assessed for quantitative genetic traits. High heritability was observed for bud LTE traits and may thus be a useful target for cold hardiness breeding programs; however, it is necessary to ensure that variance is reduced when pooling multiple sample events. After DTA sampling, grapevines were assessed for survival of primary and secondary dormant buds using cross-sectional visual evaluation of death. ‘Valiant’ had the greatest primary bud survival (68%), followed by ‘Frontenac gris’, ‘Crimson Pearl’, and ‘King of the North’. These varieties are among those with potential for production in eastern North Dakota’s environment. The newly evaluated relationships between traits and the heritability of DTA results provide valuable tools to grapevine breeders for the development of cold-tolerant genotypes for future climatic challenges.
1. Introduction
The grapevine (Vitis spp.) is one of the most important horticultural crops. In the United States, grapevine is the leading horticultural crop in terms of production quantity (FAO, 2020). Freezing injury is one of the major issues restricting grapevine production in many northern regions of the United States [1,2,3].
The grapevine belongs to the genus Vitis, which consists of around 60 interfertile species [4,5]. Freezing tolerance of different Vitis species and cultivars varies significantly. V. vinifera grapes are more sensitive to cold injury than many North American native Vitis species [6]. While V. vinifera cultivars are in great demand in global markets, they are frequently damaged by freezing temperatures below −20 °C [1,2]. Multiple native North American species are more tolerant of winter temperatures than V. vinifera, such as V. riparia, which is capable of withstanding −40 °C [7,8,9,10]. The introduction of various interspecific hybrid cultivars combining European germplasm (V. vinifera) and North American species (V. aestivalis, V. riparia, V. labrusca, and other native Vitis species) throughout the middle to late 20th century has contributed to enhanced grape production in regions of the North Central and Northeastern states of the United States and Southern Canada [11,12].
Cold hardiness is influenced by genetic, environmental, and vineyard management conditions [9,13,14,15,16]. Tolerance of freezing in plants is associated with cold acclimation status, including the osmotic stabilization of cells, photosynthetic ability, antioxidant capacity, changes in hormone metabolism, and changes in cell wall structure [17]. The amount of winter damage to grapevine crops depends on interactions between different factors such as variety, viticultural management practices, and the external environment [2,9]. The productivity of grapevines and winter survival is influenced by sudden changes in temperatures and prolonged extreme freezing events. In regions of the United States where V. vinifera cultivation is not profitable or possible due to cold climates, growers have adopted several strategies to continue vineyard production; these methods include using hybrid cultivars and optimizing cultural practices in order to minimize winter damage [1]. Some of these cultural practices that are used to reduce cold damage to grapevines include wind machines to alter the temperatures at ground level (a frost avoidance mechanism), burying dormant canes of the vine with soil, and using geotextile materials to prevent freezing injury (protection against mid-winter cold damage) [18]. No commercial grapevine growers are actively using any type of trunk winter protection in North Dakota [3]. North Dakota has harsh winters, with temperatures frequently falling below −35 °C [3,19]. In the continental environment, daily and weekly temperature fluctuations are very common and these sudden temperature decreases following warmer temperatures increase the possibility of freezing injuries during the grapevine’s dormancy shoulder seasons (i.e., fall and spring), beyond traditional mid-winter cold damage [12].
Woody perennials, such as grapevines, shift from a cold-tender to a cold-hardy state towards the end of a growth season as a means of surviving in continental climates [20,21]. Grapevine dormancy and acclimatization are prompted by environmental cues including low temperatures, short days, and water stress [1,20,21,22,23,24]. These environmental cues cause morphological and physiological changes such as shoot tip abscission, periderm formation, induction of bud dormancy, growth arrest, leaf senescence, and biochemical changes [14,23]. Cold hardiness is a complex trait that is driven by a plant’s genetic potential and environmental regulation. Each grapevine cultivar or genotype has unique characteristics for winter hardiness; relative to other cultivars established on the same site, some can tolerate harsher winter temperatures than others. Maximum hardiness levels of cultivars can also change from season to season due to seasonal variations in temperatures [18]. The severity and length of the low temperatures, as well as the plant’s phenological stage all play a role in the winter injuries caused by below-freezing temperatures [25]. While a quick change in temperature from warm to extremely cold can cause severe damage to plants, a gradual drop in temperature encourages acclimatization and the ability of the plants to withstand subzero temperatures [22,26].
Grape growers in North Dakota and other northern growing climates such as the Upper Midwest face a constant threat of cold damage to grapevines each winter. To improve the production capacity for vineyards in harsh winter climates, there is a need to understand individual grapevines’ cold hardiness throughout dormancy and across tissue types. By enhancing our understanding of abiotic stress resistance, progress may be made in regional cultivar recommendations and future breeding for challenging environments in a globally changing climate.
To improve the selection of adapted grapevines, it is important to consider the heritability of traits, their correlations, and how they vary across genotypes and environments. Several methods exist for elucidating an individual accession’s value based on sampling in multiple environments, such as best linear unbiased estimates (BLUEs) and best linear unbiased predictions (BLUPs), which are used in both livestock and plant breeding [27]. The correlation between actual genotypic values and anticipated genotypic values is maximized via BLUPs through the estimation of fixed effects using generalized least square values [28,29]. Within BLUPs, individual means that are farther from the mean will be shrunk toward the overall mean. Environmental variation may also impact shrinkage of means to a varying extent [30].
By examining the consistency of a genotype’s response throughout dormancy through BLUEs and heritability of BLUPs, as well as the correlation of traits for hardiness, this study seeks to improve the overall understanding of selection methods for grapevine breeding in challenging environments while simultaneously identifying the best regionally adapted hybrid grapevines for eastern North Dakota. Consistency and interrelation of cold hardiness traits within genotypes, throughout tissue types, and across environments dictate the extent and specificity to which sampling should be recommended when screening populations for molecular marker development and when selecting individual grapevine seedlings for future cultivar development.
2. Materials and Methods
2.1. Planting Information
2.1.1. Absaraka, ND
The interspecific hybrid grapevine material assessed during the 2019–2020 period at the North Dakota State University Horticulture Research Farm (NDSU-HRF) located near Absaraka was collected from mature vines that survived the previous 2018–2019 winter killing events. All ‘Marquette’ and ‘Petite Pearl’ vines within the NDSU grape variety trial plantings died; however, wood was collected from surviving vines trained to single high wire with bilateral cordons within a 2015 planted trellis trial [31]. All ‘Prairie Star’ vines within the NDSU grape variety trial also died. ‘Prairie Star’ tissue was collected from a nearby block planted in 2009 and trained to a single high wire with bilateral cordons [32]. All other Absaraka, ND grapevine material was also collected from vines trained to single high wire bilateral cordons within the NDSU grape variety trial planting [19]. Of the vines planted within the NDSU grape variety trial, ‘John Viola’ vines were planted in 2009, while ‘Bluebell’, ‘Hasansky Sladky’, ‘King of the North’, MN1131, and ‘Valiant’ were planted in 2004.
No supplemental irrigation or fertility was provided during the 2019 growing season to evaluate plants. No fungicides or insecticides were utilized in 2019 either; this is typical for many North Dakota vineyards. Management of vineyard rows was conducted as described by Svyantek et al. (2020); vineyard row middles consisted of red fescue (Festuca rubra) and a 0.5-m weed-free strip was maintained beneath vines with periodic tillage supplemented with pre-emergent (Flumioxazin, Chateau ®, Valent USA, San Ramon, CA, USA) and post-emergent (Glufosinate-ammonium, Rely280®, BASF Corp., Durham, NC, USA) herbicide applications [3].
2.1.2. Buffalo, ND
An additional seven interspecific hybrid grapevine cultivars were also collected from mature vines planted at a nearby commercial vineyard located near Buffalo, ND approximately 15 km southwest of the NDSU-HRF. The oldest vines that were sampled, i.e., ‘King of the North’, were planted in 2003. ‘Frontenac’, ‘La Crescent’, and ‘Sabrevois’ were planted in 2004. ‘Marquette’ and ‘Frontenac gris’ were planted in 2007. ‘Crimson Pearl’ was planted as a numbered selection after 2005. All grapevines were trained to single high wire bilateral cordons, except for ‘Marquette’ and ‘Frontenac gris’, which were trained to a mid-wire with a vertical shoot positioning system. These vines were chosen for evaluation due to their survival history at the Buffalo, ND vineyard location.
A 0.3-m weed-free strip was maintained at the Buffalo, ND vineyard under vineyard rows using glufosinate-ammonium (Rely280®, BASF Corp., Durham, NC, USA) contact herbicide; the grass was maintained in the vineyard middles by mowing once every other week. Fertilizers, fungicides, and insecticides were not applied to the plots in the 2019 growing season. None of the vines received irrigation.
2.1.3. Environmental Conditions
The temperature at the sites was collected throughout the dormant season using data loggers (WatchDog A150 Temp/RH Loggers; Spectrum Technologies, Inc., Aurora, IL, USA) protected from radiation by shields (3663A Radiation Shield; Spectrum Technologies, Inc., Aurora, IL, USA) mounted at cordon height at each location. Daily maximum and minimum temperature data are shown in supplementary Figures S1 and S2.
2.2. Periderm Development and Cane Diameter
On 10 October 2019, following the first snow and after freezing triggered leaf fall and shoot tip death, a total of 30 canes per cultivar were visually rated for periderm development and measured for cane diameter. Periderm development was quantified for the first ten nodes of each cane as the number of nodes for which mature wood had properly developed. Cane diameter was measured as the average of two measurements, conducted for the wide and narrow diameters of the cane at the midpoint between the first and second node using a digital caliper (GlowGeek CD-6-150 Electronic Digital Caliper, GlowGeek, China, with 0.03 mm accuracy, 0.01 mm repeatability, and 0.01 mm resolution).
2.3. Differential Thermal Analysis
Differential thermal analysis (DTA) freezing methodology was conducted as previously described [3]. In brief, samples were collected approximately twice per month for the dormant period extending from October to April for a total of 12 sampling dates per site.
For the two sites, all samples were collected within 4 days of each other. At each sampling event, four representative canes were collected, and the first six buds of each cane were manually excised and placed on DTA cells. The first three internodes of each cane were pooled to make two representative samples; this woody tissue was then placed into DTA cells. Woody tissue was examined at every testing point, except for the 14 October and 16 October 2019 sampling dates. Other than this exception, four sets of six buds and two sets of six internodes were examined for each grapevine selection at each sampling event. Lethal temperature exotherms (LTE10,50,90) were calculated for buds via manual annotation using the Bud Processor software v 1.8.0 (Brock University, St. Catherines, ON, Canada), followed by a calculation using the Bud LTE software v 1.2.3 (Brock University, St. Catherines, ON, Canada). LTE values for canes (LTE10,mid,end) were visually identified for phloem and xylem tissue within the Bud Processor software.
2.4. Dormant Bud Death
Bud cross-sectional analysis was used to measure mortality rates of winter buds before pruning in late April 2020. For each evaluated genotype-location combination, a total of 20 canes were collected. The first eight buds of each cane were manually dissected to examine the oxidation and death of the primary and secondary buds. Green buds were considered alive, and olive-brown to brown buds were considered dead. The bud survival for each bud position on each cane was recorded and evaluated to quantify the percentage of bud survival along the cane.
2.5. Statistical Analysis
To improve the understanding of DTA responses in a broader context, the heritability, phenotypic, and genetic correlations of DTA responses were estimated using the META-R software version 6.04 [33,34]. Additionally, to improve the visualization of differences between individual grapevines’ DTA results, the best linear unbiased estimators (BLUEs) were calculated for each sampling occurrence by defining individual grapevine genotypes as a fixed-effect to enable comparison among genotypes; for graphical comparison, BLUEs were transformed and presented as a deviation from the grand-mean performance of individual genotypes within a given environment. Simultaneously, variance components were calculated to estimate the broad-sense heritability of best linear unbiased predictors (BLUPs) of DTA results based on individual genotypes’ performance as a random effect to improve and inform the use of DTA results as a future phenotypic response for selection within grapevine breeding programs. Genetic and phenotypic correlations among variables were calculated across sampling dates within the same planting environments for DTA results from sampling events between the start of November 2019 and the end of March 2020. Due to limitations in DTA cells for testing, four cane samples were utilized to calculate the performance of dormant buds while internode tissue from two individual canes was pooled to yield phloem and xylem responses. To enable correlation estimations, the data from the two individual cane samples linked to their representative one-internode sample were pooled prior to calculations.
All graphics were constructed within ggplot2 v3.4.0 in R 4.2.2 except for dormant bud damage figures [35,36]. Bud damage figures were manually created based on percentage bud survival data that were color coded using Google Sheets [37] with the color scale conditional formatting feature. A value of 0, equivalent to 0% bud survival was defined as red (RGB 255, 0, 0), a value of 100, equivalent to 100% bud survival was defined as blue (RGB 0, 0, 255), and a value of 50, equivalent to 50% bud survival was defined as a mid-point purple (RGB 128, 0, 127). These color values of specific survival percentages were then called and used as fills for graphical depictions of primary and tertiary buds along each specific grapevine’s cane using Google Slides [38].
3. Results
3.1. Periderm Development and Cane Diameter
Periderm development on 10 October 2019 ranged between 35% and 91% of nodes for the first ten nodes, with a mean of 74% for the lignified nodes in Buffalo, ND and 75% for the lignified nodes in Absaraka, ND (Table 1). In Absaraka, ND, ‘King of the North’ had the lowest quantity of cane encompassed by periderm (54%). In Buffalo, ND, ‘King of the North’ had the second lowest proportion of periderm on canes (57%), only higher than ‘Sabrevois (35%). ‘Marquette’ canes had the greatest periderm percentages at both sites.

Table 1.
Periderm development and cane diameter of 14 grapevine genotypes grown at two vineyard sites in eastern North Dakota as measured on 10 October 2019.
Cane diameter ranged from 4.63 mm to 6.94 mm in Absaraka, ND and from 4.48 to 6.73 mm in Buffalo, ND. In Absaraka, ND, three genotypes had cane diameters greater than 6.00 mm, ‘John Viola’ (6.94 mm), MN1131 (6.19 mm), and ‘Marquette’ (6.02 mm). Only two genotypes, ‘King of the North’ (6.73 mm) and ‘Marquette’ (6.22 mm), had cane diameters greater than 6.00 mm in Buffalo, ND.
3.2. Winter BLUEs and Heritability of BLUPs for Low-Temperature Exotherms
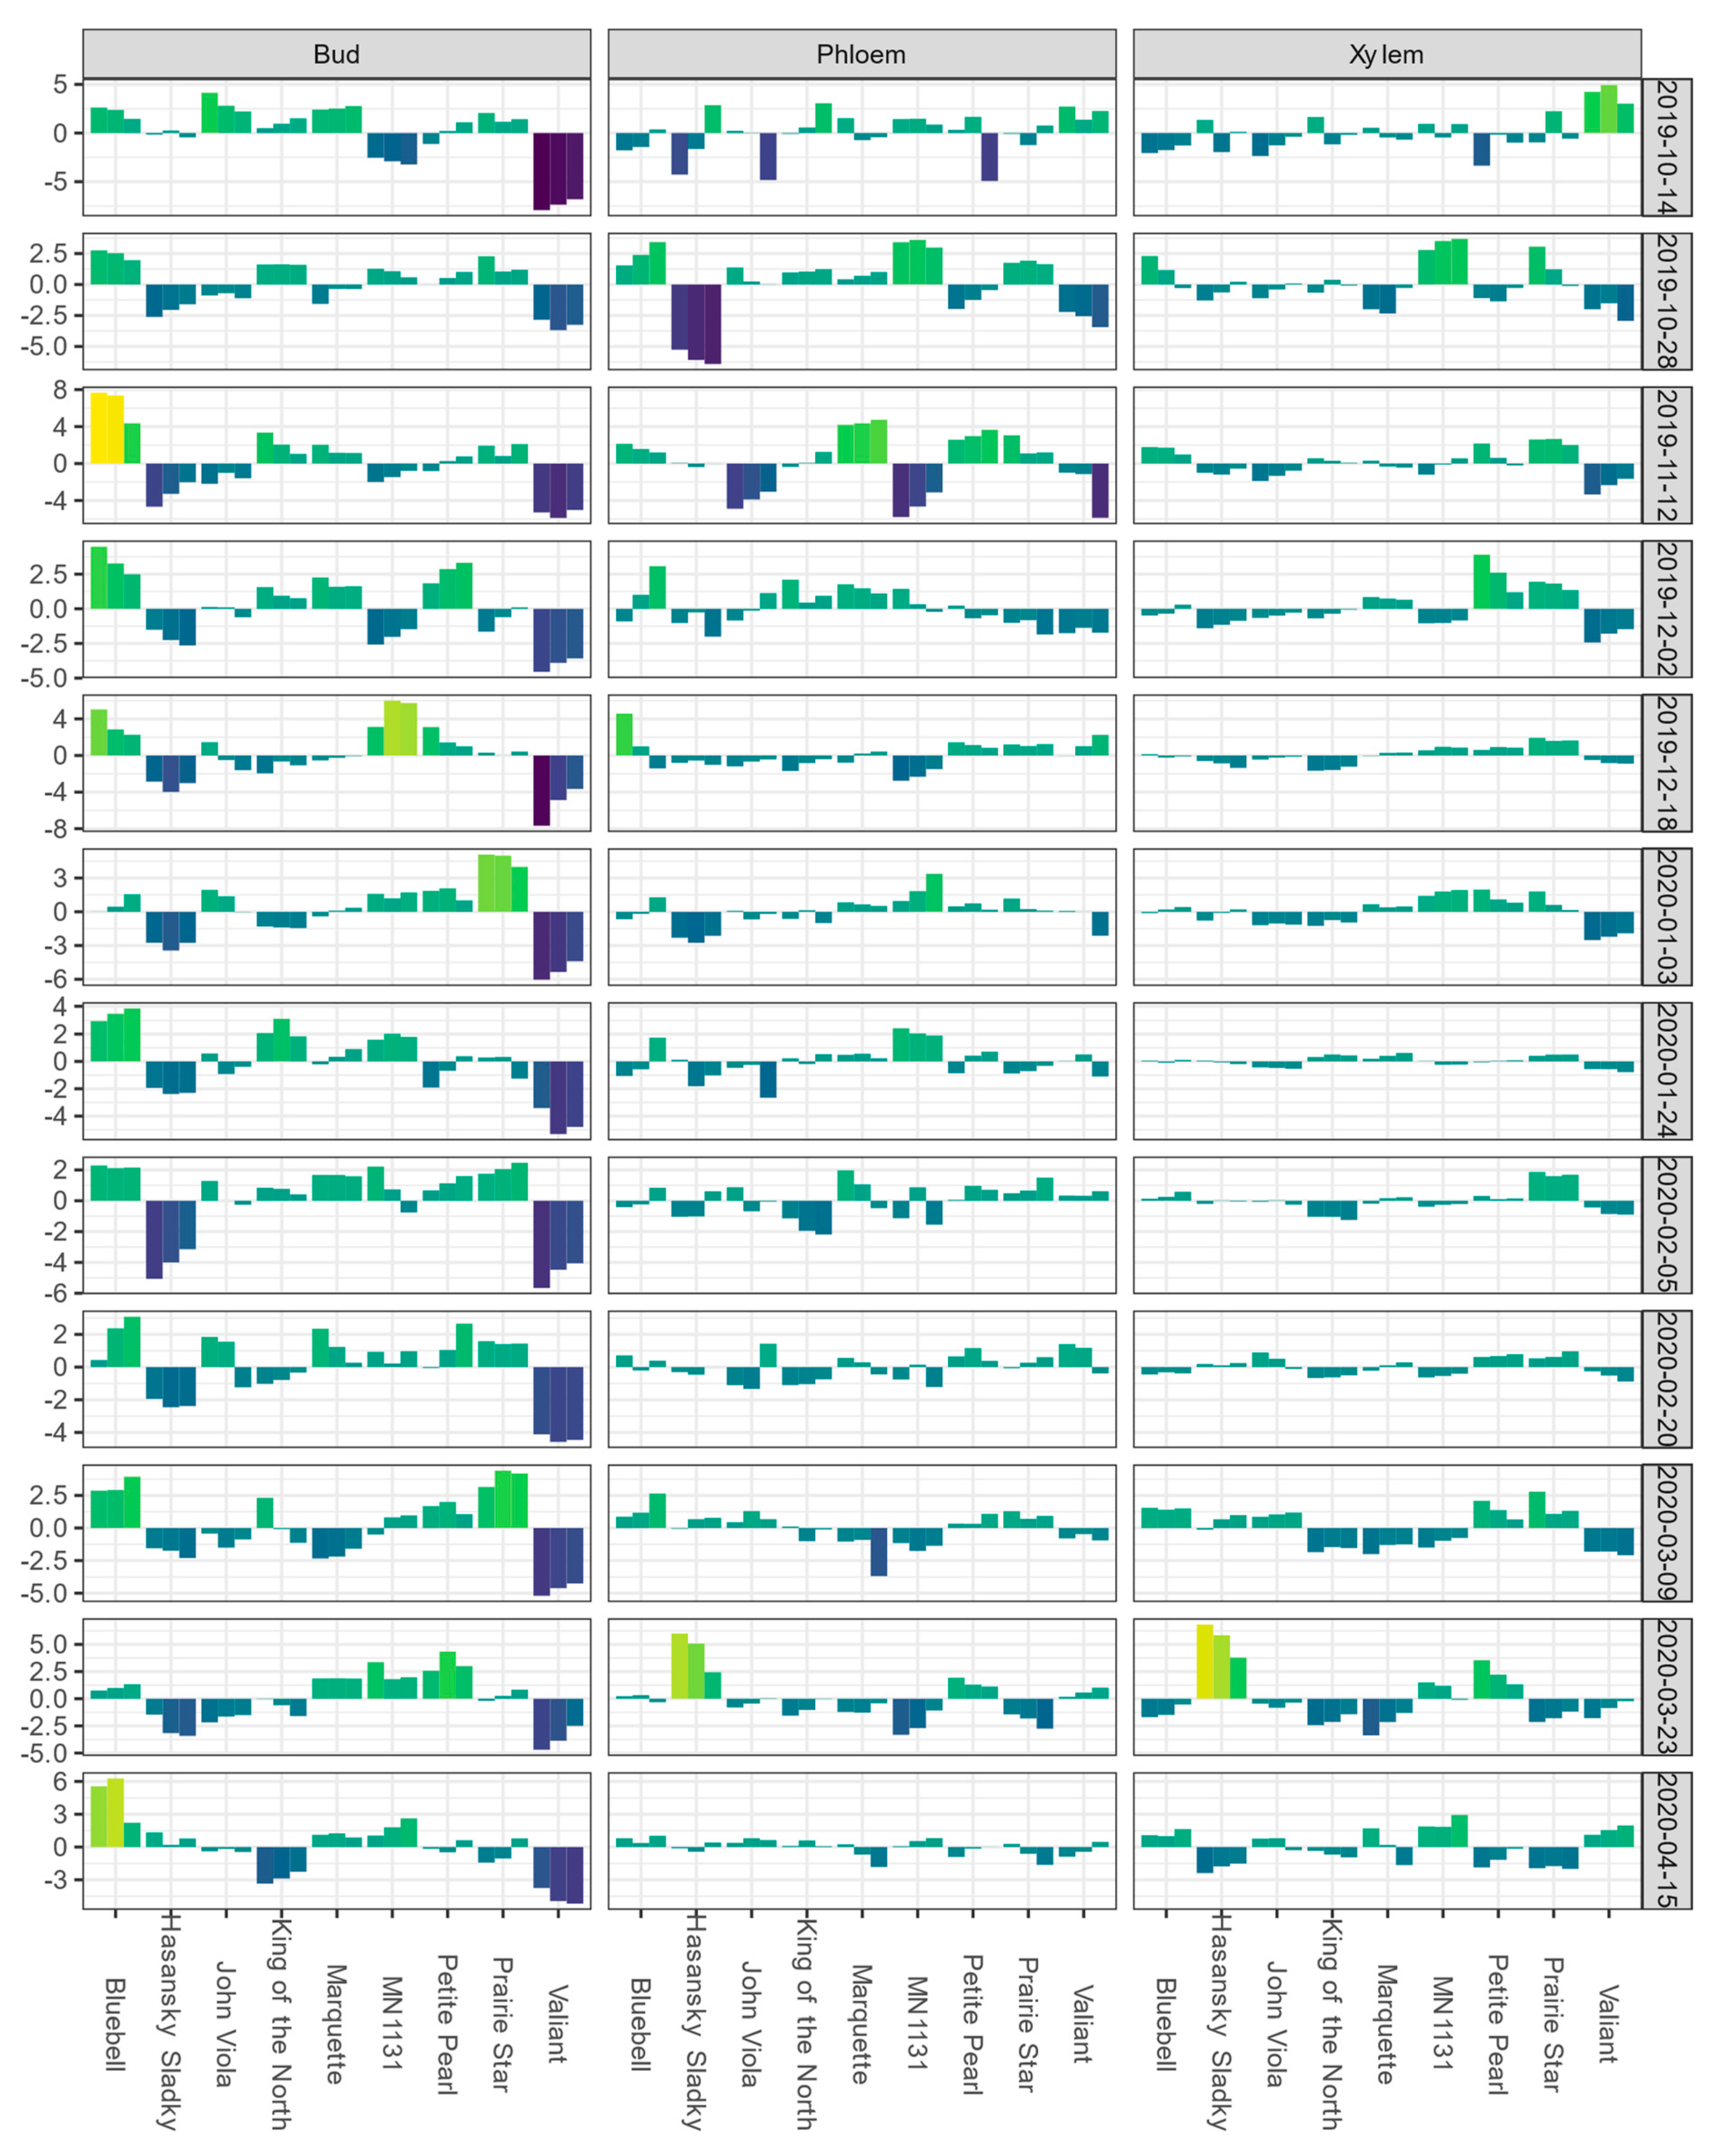
In Absaraka, ‘Valiant’ buds had the lowest BLUEs for DTA responses of LTE10, LTE50, and LTE90 on the first sampling date, 14 October 2019 (Figure 1). Mean LTE50 values of buds and LTEmid values of phloem and xylem for each sampling event are depicted in Figure S1, showing the shift in relative hardiness of tissue within a tissue type across the 2019–2020 dormant season. ‘Valiant’ buds’ LTE values remained below the mean of the population of genotypes sampled for the remainder of the sampling period. BLUEs for ‘Valiant’ xylem LTE values were below the mean estimate, except for the first and final date sampled. BLUEs of ‘Hasansky Sladky’ bud LTE values were the second most frequently below the mean estimate in Absaraka with the BLUEs of bud LTE50 values below the mean estimate on 10 out of 12 sampling events. BLUEs of bud LTE values showed the greatest spread of values for the trait. The only genotype that never had BLUEs of bud LTE values below the mean estimate in Absaraka was ‘Bluebell’.
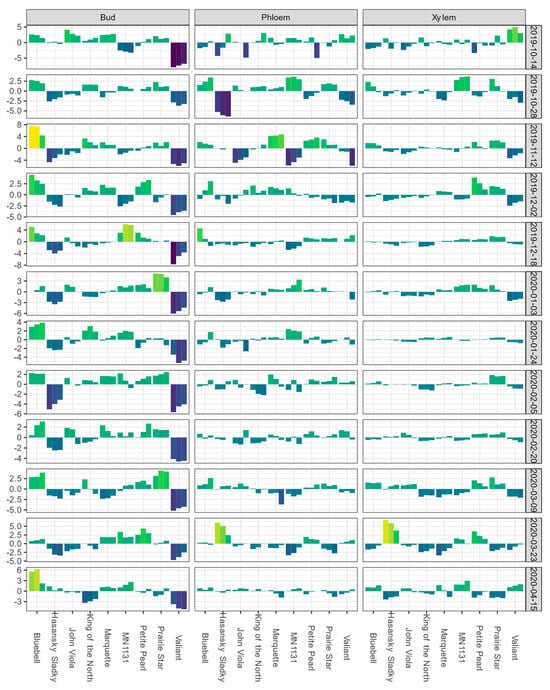
Figure 1.
Best linear unbiased estimates (BLUEs) of differential thermal analysis results for low-temperature exotherms (LTE) as LTE10, LTE50, and LTE90 for buds and LTE10, LTEmid, and LTEend for phloem and xylem, shown from left to right for a given cultivar within a given tissue type-sampling date combination); values are expressed as deviations from the grand mean for dormant buds, phloem, and xylem of nine grapevine genotypes grown near Absaraka, ND at the North Dakota State University Horticulture Research Farm during the 2019−2020 dormant season. Bud values depicted for 14 October 2019 are based on two replicates of buds rather than four. Phloem and xylem values depicted for 14 October 2019 represent the deviation from the grand mean for a single measurement per genotype and are not BLUEs. Results are color coded where bright yellow indicates a given tissue’s values are above the mean BLUE and dark blue indicates a given tissue’s values are below the mean BLUE at the sampling event.
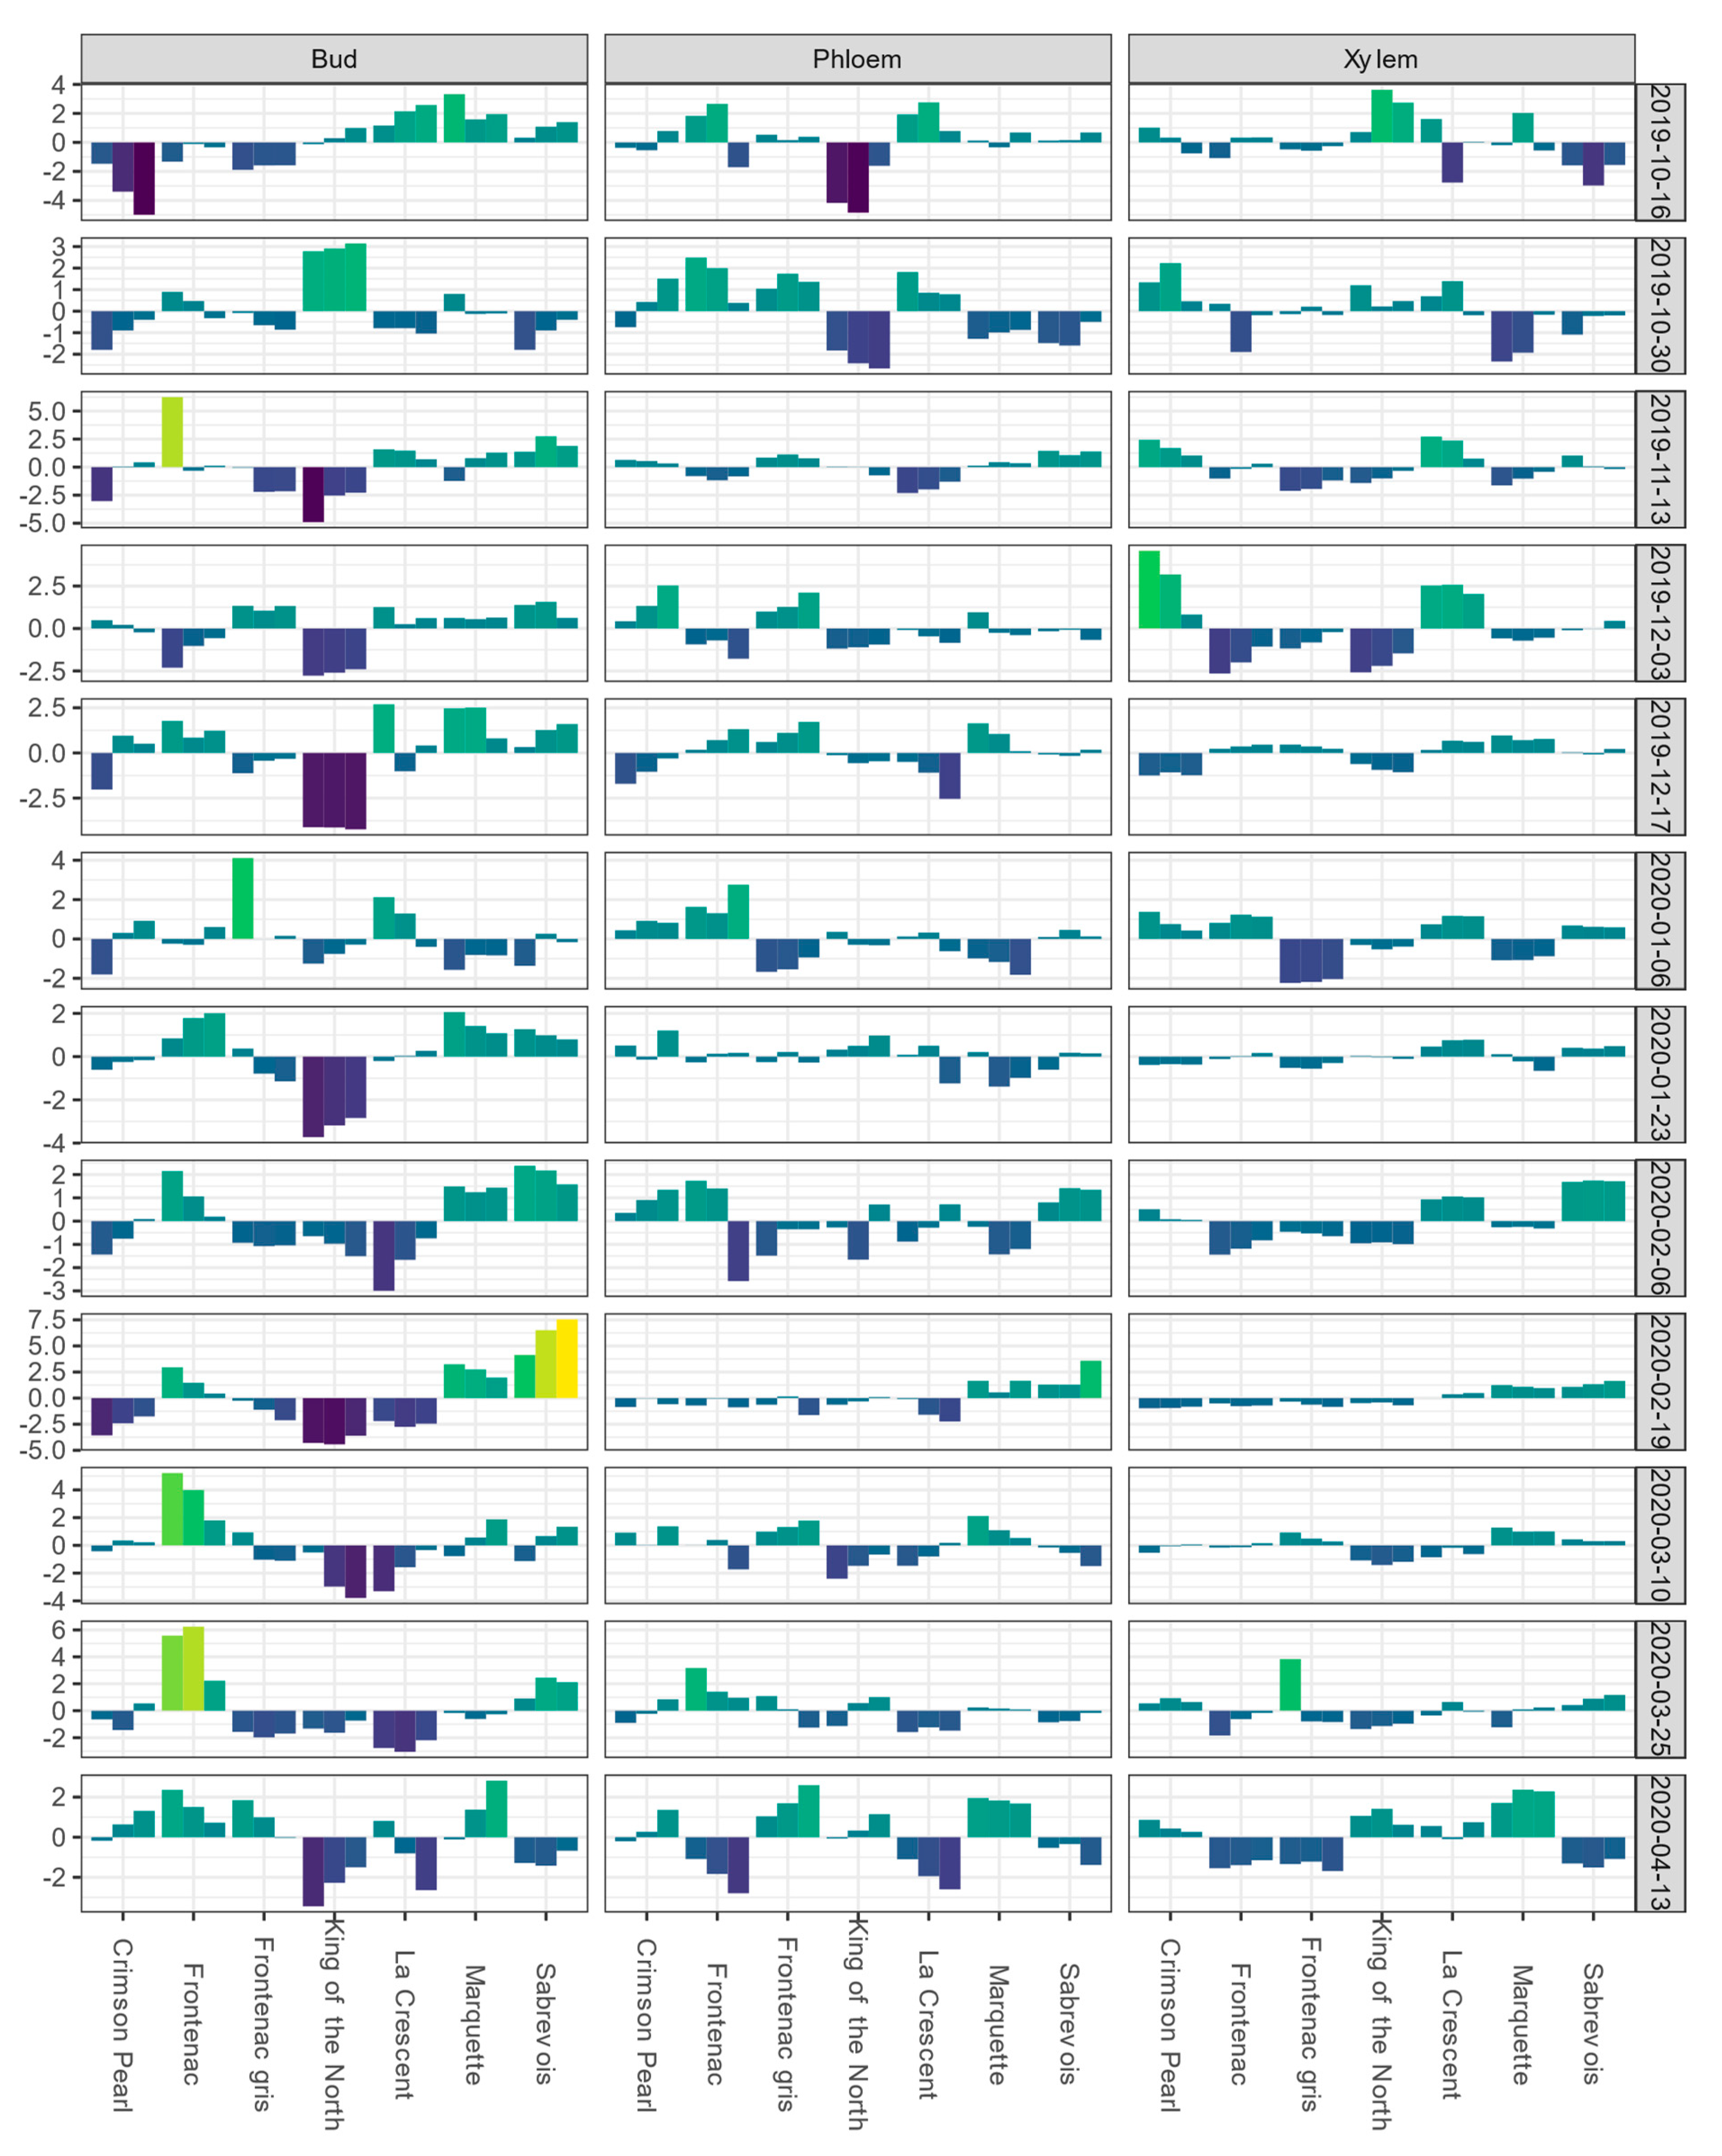
For the Buffalo vineyard, the mean LTE50 values of buds and LTEmid values for phloem and xylem for each sampling event are shown in Figure S2. BLUEs of bud LTE values for ‘King of the North’ were initially near the overall estimate value for the population or higher during October sampling events; however, from November to April of the following year, the BLUEs for bud tissue remained negative (Figure 2).
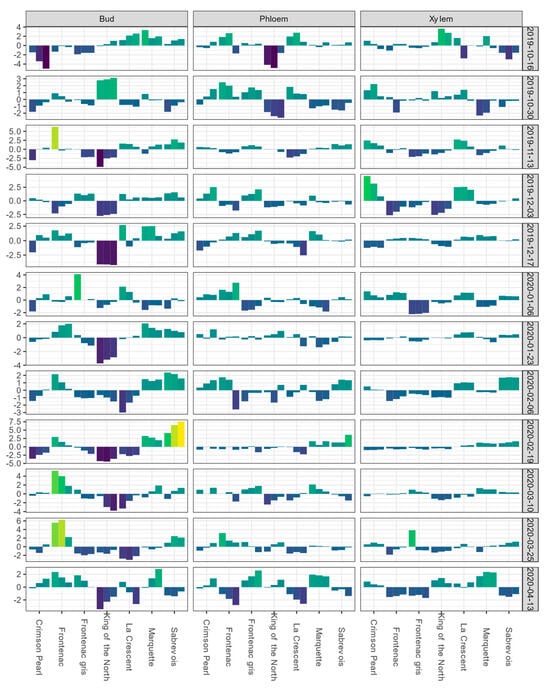
Figure 2.
Best linear unbiased estimates (BLUEs) of differential thermal analysis results for low-temperature exotherms (LTE) as LTE10, LTE50, and LTE90 for buds and LTE10, LTEmid, and LTEend for phloem and xylem, shown from left to right for a given cultivar within a given tissue type-sampling date combination); values are expressed as deviations from the grand mean for dormant buds, phloem, and xylem of seven grapevine cultivars grown at a commercial vineyard near Buffalo, ND during the 2019–2020 dormant season. Bud values depicted for 16 October 2019 are based on two replicates of buds rather than four. Phloem and xylem values depicted for 16 October 2019 represent the deviation from the grand mean for a single measurement per variety and are not BLUEs. Results are color coded where bright yellow indicates a given tissue’s values are above the mean BLUE and dark blue indicates a given tissue’s values are below the mean BLUE at the sampling event.
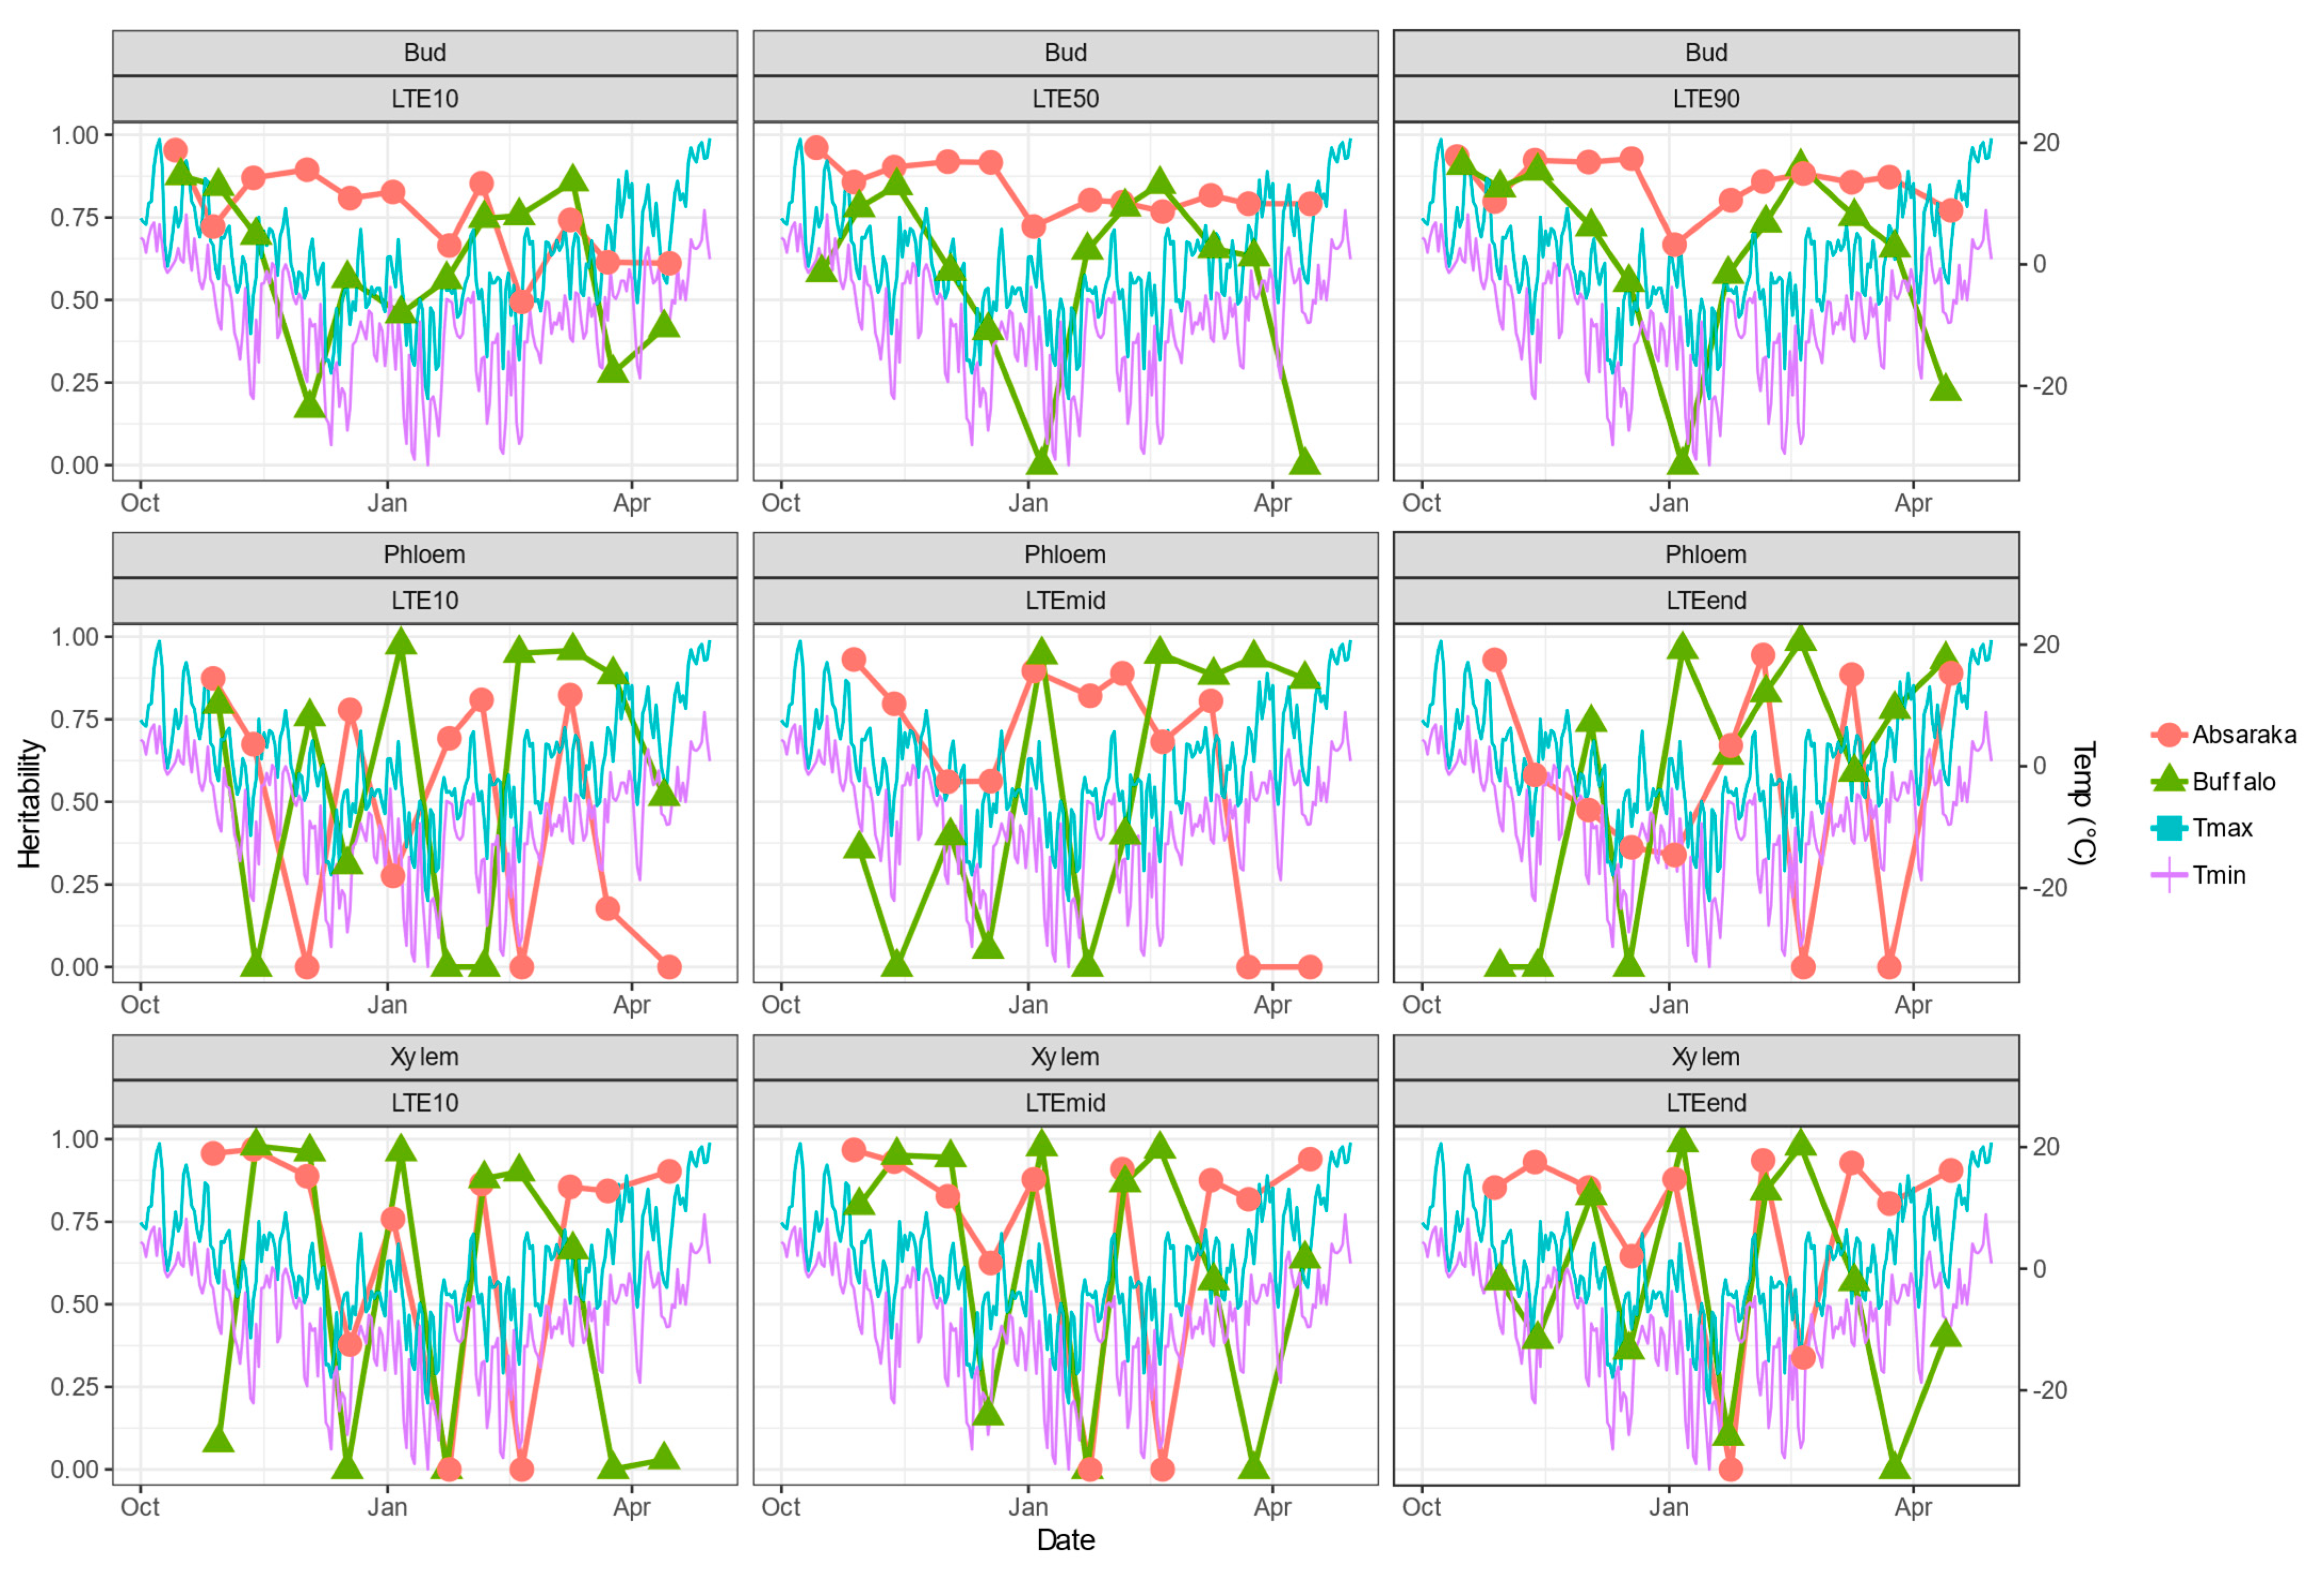
Estimates of broad-sense heritability of DTA results varied by sampling environment, location, and tissue type (Figure 3). Bud LTE values, which are the most quantitative response in their calculation, had greater levels of heritability, and for the Absaraka vineyard site, they were greater than 0.50 at many of the sampling occurrences. For the Buffalo site, Bud LTE heritability values remained more consistent than either phloem or xylem tissue.
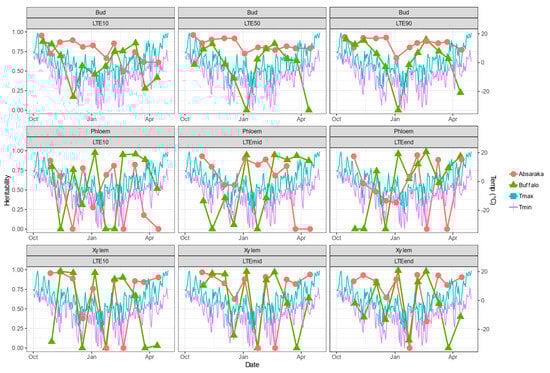
Figure 3.
Daily maximum and minimum temperatures and broad-sense heritability across the 2019–2020 dormant season for differential thermal analysis results of three tissue types of grapevine genotypes grown at a commercial vineyard near Buffalo, ND and near Absaraka, ND at the North Dakota State University Horticulture Research Farm.
The heritability of phloem LTE values approached 0.00 on nine events for the Buffalo site and seven events for the Absaraka site (out of a total of 33 phloem LTE-event possibilities per site). This was a greater frequency than bud LTE heritability estimates, which only approached 0.00 at three events for the Buffalo site. Xylem LTE value heritability estimates were similarly inconsistent with multiple sampling events approaching 0.00 for both test sites. Low heritability estimates for phloem tissue occurred coinciding with significant temperature shift events in November and December 2019 for the Buffalo site. Low heritability estimates for xylem tissue were more frequent for Buffalo than for the Absaraka site, and these low heritability estimates also frequently followed major temperature decline events.
Overall broad-sense heritability of DTA response values was greatest for bud LTE values for the Absaraka site, exceeding 0.93 for all LTE responses (Table 2). The heritability of phloem LTE values was below 0.050; however, it exceeded 0.50 for xylem LTE values. The environmental variance observed was greater for phloem and xylem tissue than for bud tissue. The coefficient of variation (CV %) was greatest for LTE10 values within each tissue type. Significant genotype × environment interactions were detected for all LTE values.
Table 2.
Overall broad-sense heritability, genotypic variance, environmental variance, and summary statistics for best linear unbiased predictors (BLUPs) of differential thermal analysis results expressed as low-temperature exotherms (LTEs) of nine grapevine genotypes combined across eleven sampling dates for individuals grown near Absaraka, ND at the North Dakota State University Horticulture Research Farm.
For the Buffalo site, the broad-sense heritability of bud LTE values was also greater than the heritability estimated for phloem and xylem tissue (Table 3). Heritability exceeded 0.81 for the three bud LTE values. Phloem LTE10 and xylem LTE10 were the only phloem and xylem LTE values with heritability estimates below 0.50. Genotype × Environment interactions were significant for all tissue LTE responses except for phloem LTE10 and LTEmid and xylem LTEmid.
Table 3.
Overall broad-sense heritability, genotypic variance, environmental variance, and summary statistics for best linear unbiased predictors (BLUPs) of differential thermal analysis results expressed as low-temperature exotherms (LTEs) of seven grapevine cultivars combined across eleven sampling dates for individuals grown at a commercial vineyard near Buffalo, ND.
The CV was greatest for LTE10 values within tissue types, indicating the greatest spread of values. Mean LTE values were very similar across the two sites and were within a single degree Celsius for any specific LTE value within tissue type across sites.
3.3. Phenotypic and Genetic Correlations among Low-Temperature Exotherm Traits
Seventeen significant phenotypic correlations (p < 0.05) were observed for the Absaraka test site, while 20 significant genotypic correlations were observed out of a total of 36 trait combinations (Table 4). The most highly correlated traits based on both phenotypic and genotypic correlations were often within tissue type, i.e., bud LTE10 to bud LTE50 (phenotypic correlation: r = 0.9876, p < 0.0001; genetic correlation: r = 0.9999, p = 0.0001). This is to be expected, especially for dormant buds for which the collective sample was utilized to calculate LTE10, LTE50, and LTE90. These within-tissue-type correlations were significant in all cases, representing almost 53% of phenotypic correlations and 45% of genetic correlations. Strong correlations were also observed across tissue types, such as the genetic correlations between bud LTE values (LTE10, LTE50, and LTE90) and phloem LTEend, and the genetic and phenotypic correlations between bud LTE values and xylem LTEend values.
Table 4.
Phenotypic (upper) and genetic (lower) correlations and p-values of nine differential thermal analysis results expressed as low-temperature exotherms (LTEs) among nine grapevine genotypes combined across nine sampling dates (November 2019 to March 2020) for individuals grown near Absaraka, ND at the North Dakota State University Horticulture Research Farm.
At the Buffalo vineyard site, seven significant phenotypic correlations and 11 significant genotypic correlations were noted (Table 5). Correlations within tissue type remained consistent and represented 100% of the phenotypic correlations observed and over 63% of the genetic correlations. Of the genetic correlations across tissue type, three were between bud LTE values and phloem LTE10 (bud LTE10-phloem LTE10 r = 0.9999, p = 0.0001; bud LTE50-phloem LTE10 r = 0.9624, p = 0.0005; bud LTE90-phloem LTE10 r = 0.9158, p = 0.0038) and the remaining genetic correlation observed was between bud LTE90 and xylem LTEend (r = 0.8176, p = 0.0247).
Table 5.
Phenotypic (upper) and genetic (lower) correlations and p-values of nine differential thermal analysis traits expressed as low-temperature exotherms (LTEs) among seven grapevine cultivars combined across nine sampling dates (November 2019 to March 2020) for individuals grown at a commercial vineyard near Buffalo, ND.
3.4. Dormant Bud Survival
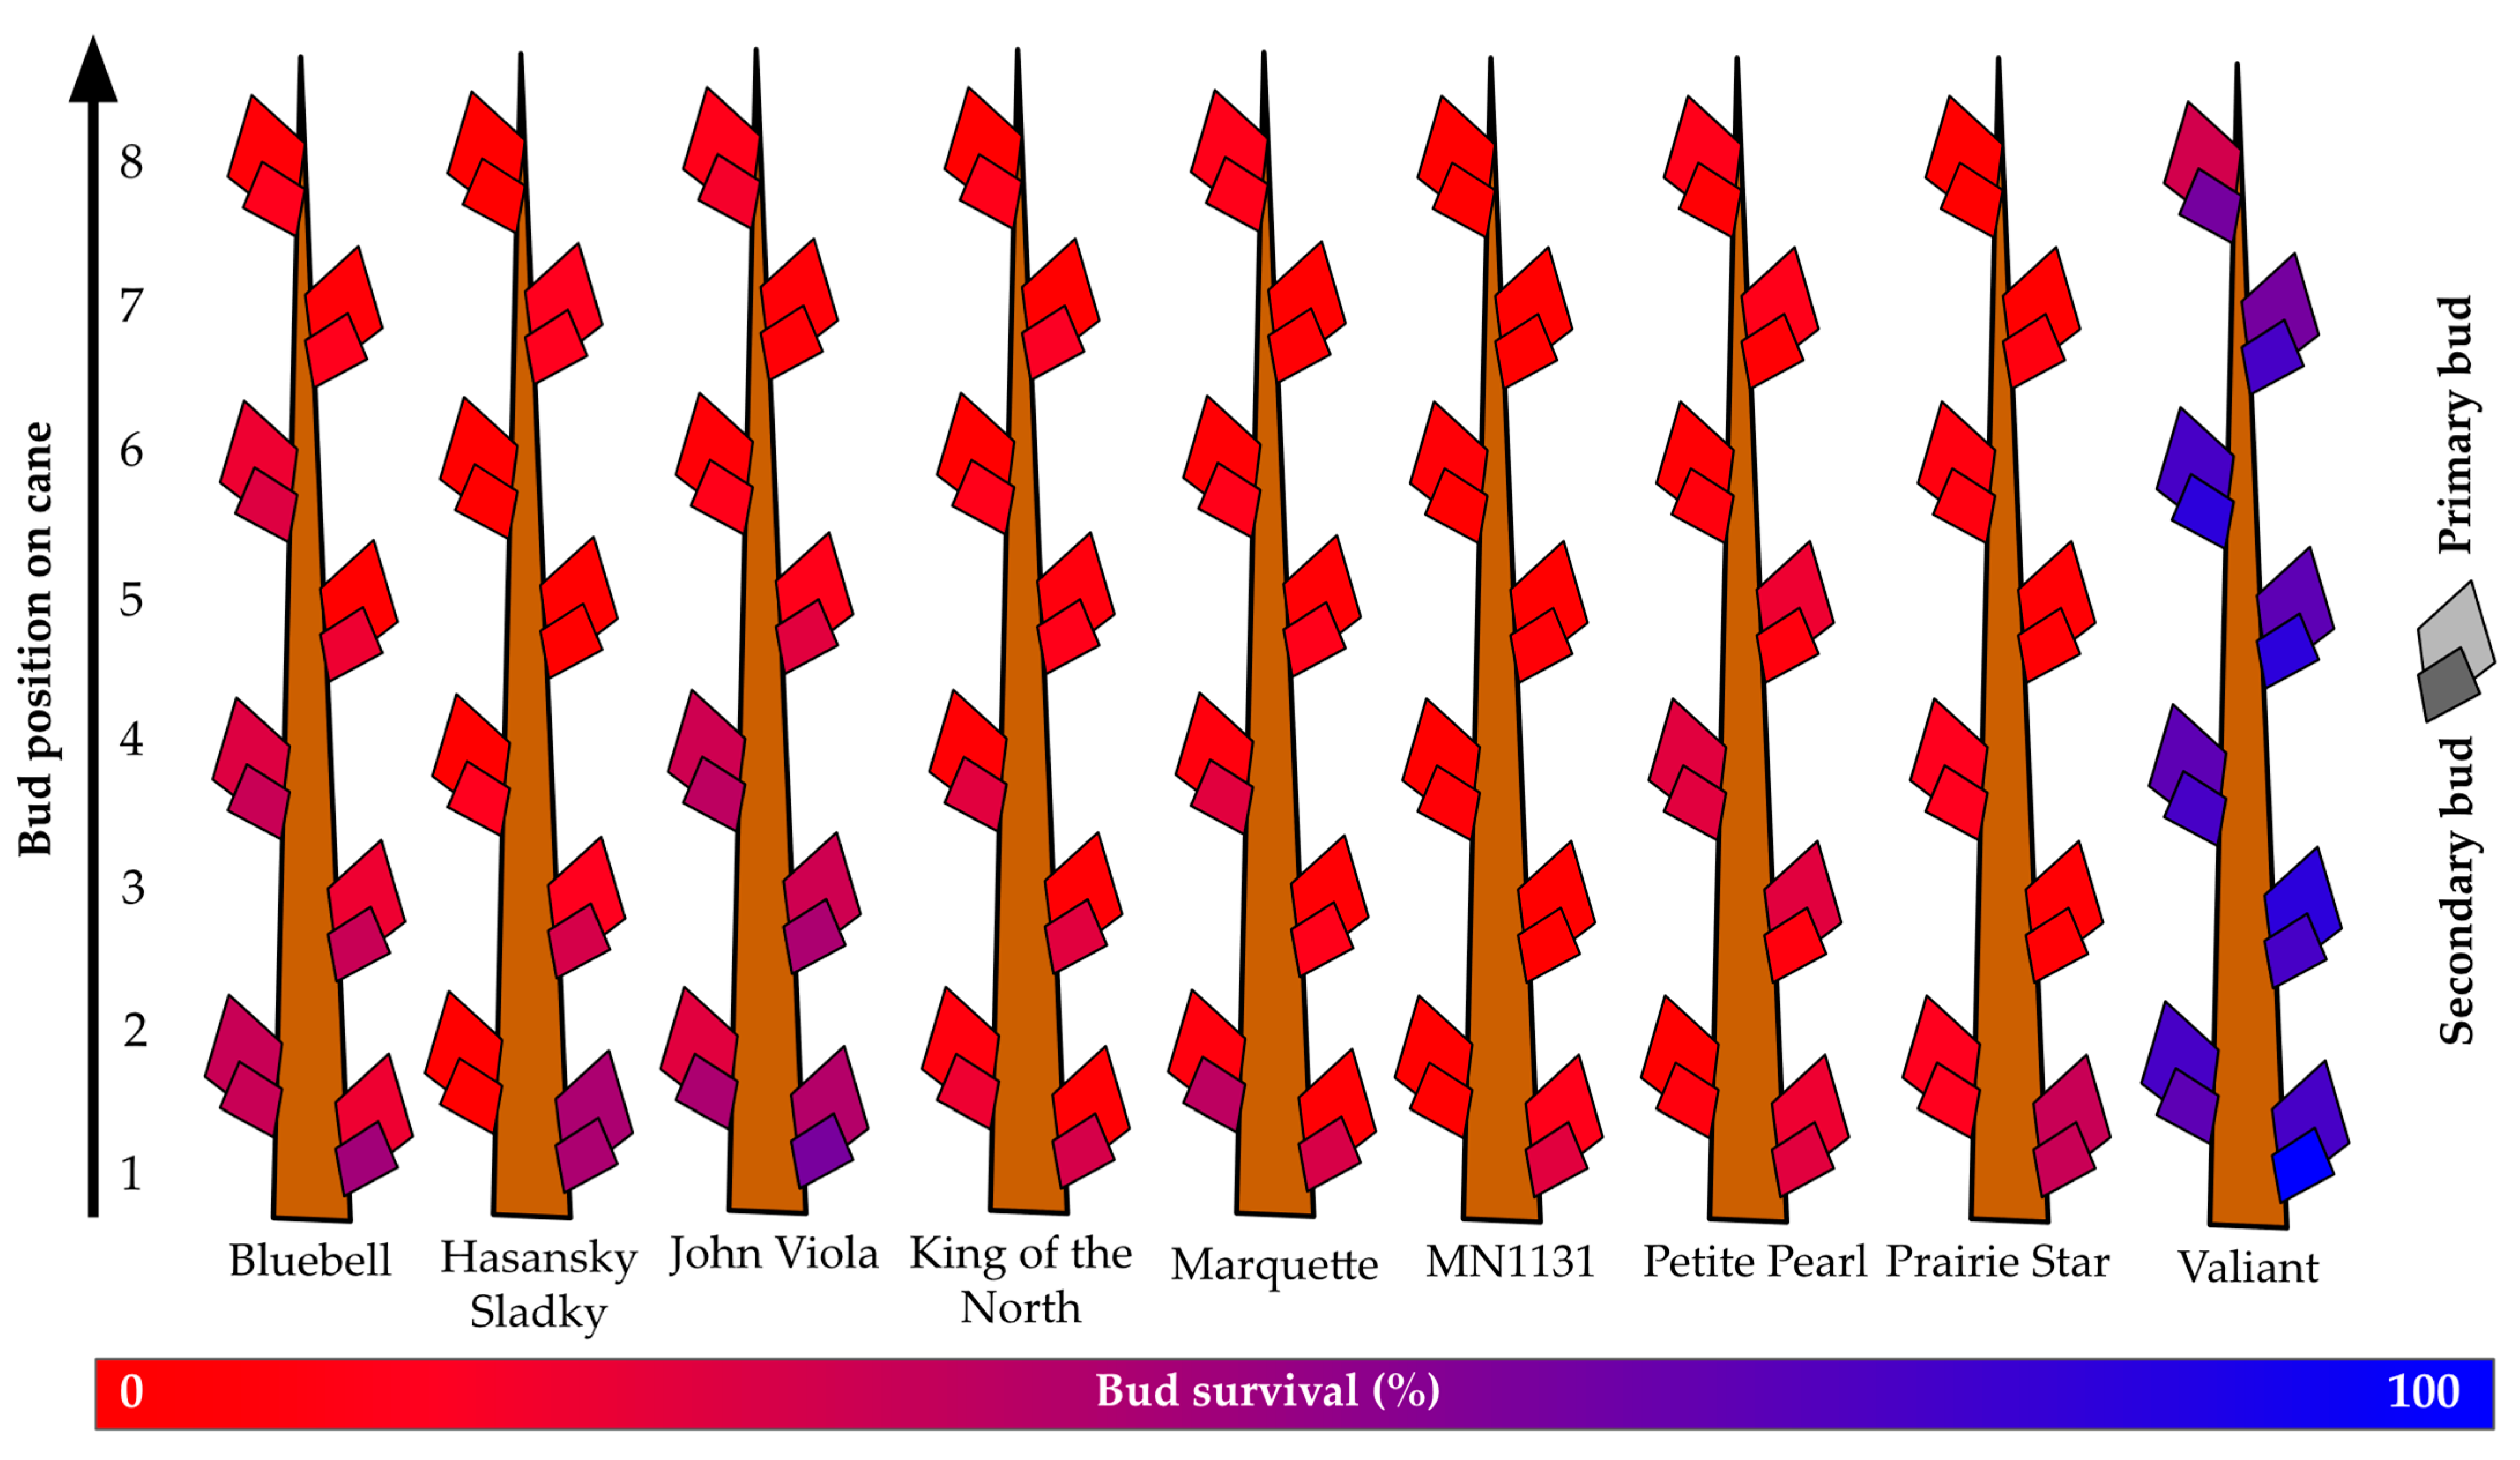
At the Absaraka site, the highest observed primary bud survival across all primary bud positions was for ‘Valiant’, which had over 68% primary bud survival and over 78% secondary bud survival (Figure 4). ‘Hasansky Sladky’ (primary: 8%; secondary: 12%), ‘King of the North’ (primary: 3%; secondary: 19%), ‘Marquette’ (primary: 5%; secondary: 18%), and MN1131 (primary: 2%; secondary: 4%) all had less than 10% primary bud survival. Secondary bud survival was greater than primary bud survival in all instances, but only ‘Valiant’ secondary buds exceeded 50% survival. ‘John Viola’ (30%) and ‘Bluebell’ (27%) had the second highest survival of secondary buds.

Figure 4.
Percent primary and secondary bud survival following the 2019–2020 dormant season of nine grapevine genotypes grown near Absaraka, ND at the North Dakota State University Horticulture Research Farm.
When only considering the first three buds along a cane, i.e., the dormant buds that would most likely be retained during dormant pruning, the survival of genotypes increased substantially. An assessment of the first three buds showed that only MN1131 (primary 4%; secondary 8%), ‘Marquette’ (primary 5%; secondary 26%), and ‘King of the North’ (primary 5%; secondary 25%) had less than 9% primary bud survival. Six genotypes (‘Hasansky Sladky’, ‘Bluebell’, ‘John Viola’, ‘King of the North’, MN1131, and ‘Prairie Star’) had greater than 1.4X increase in relative survival of buds one to three relative to buds one to eight; consequentially, these genotypes may be more aptly suited to spur pruning than cane pruning in this instance.
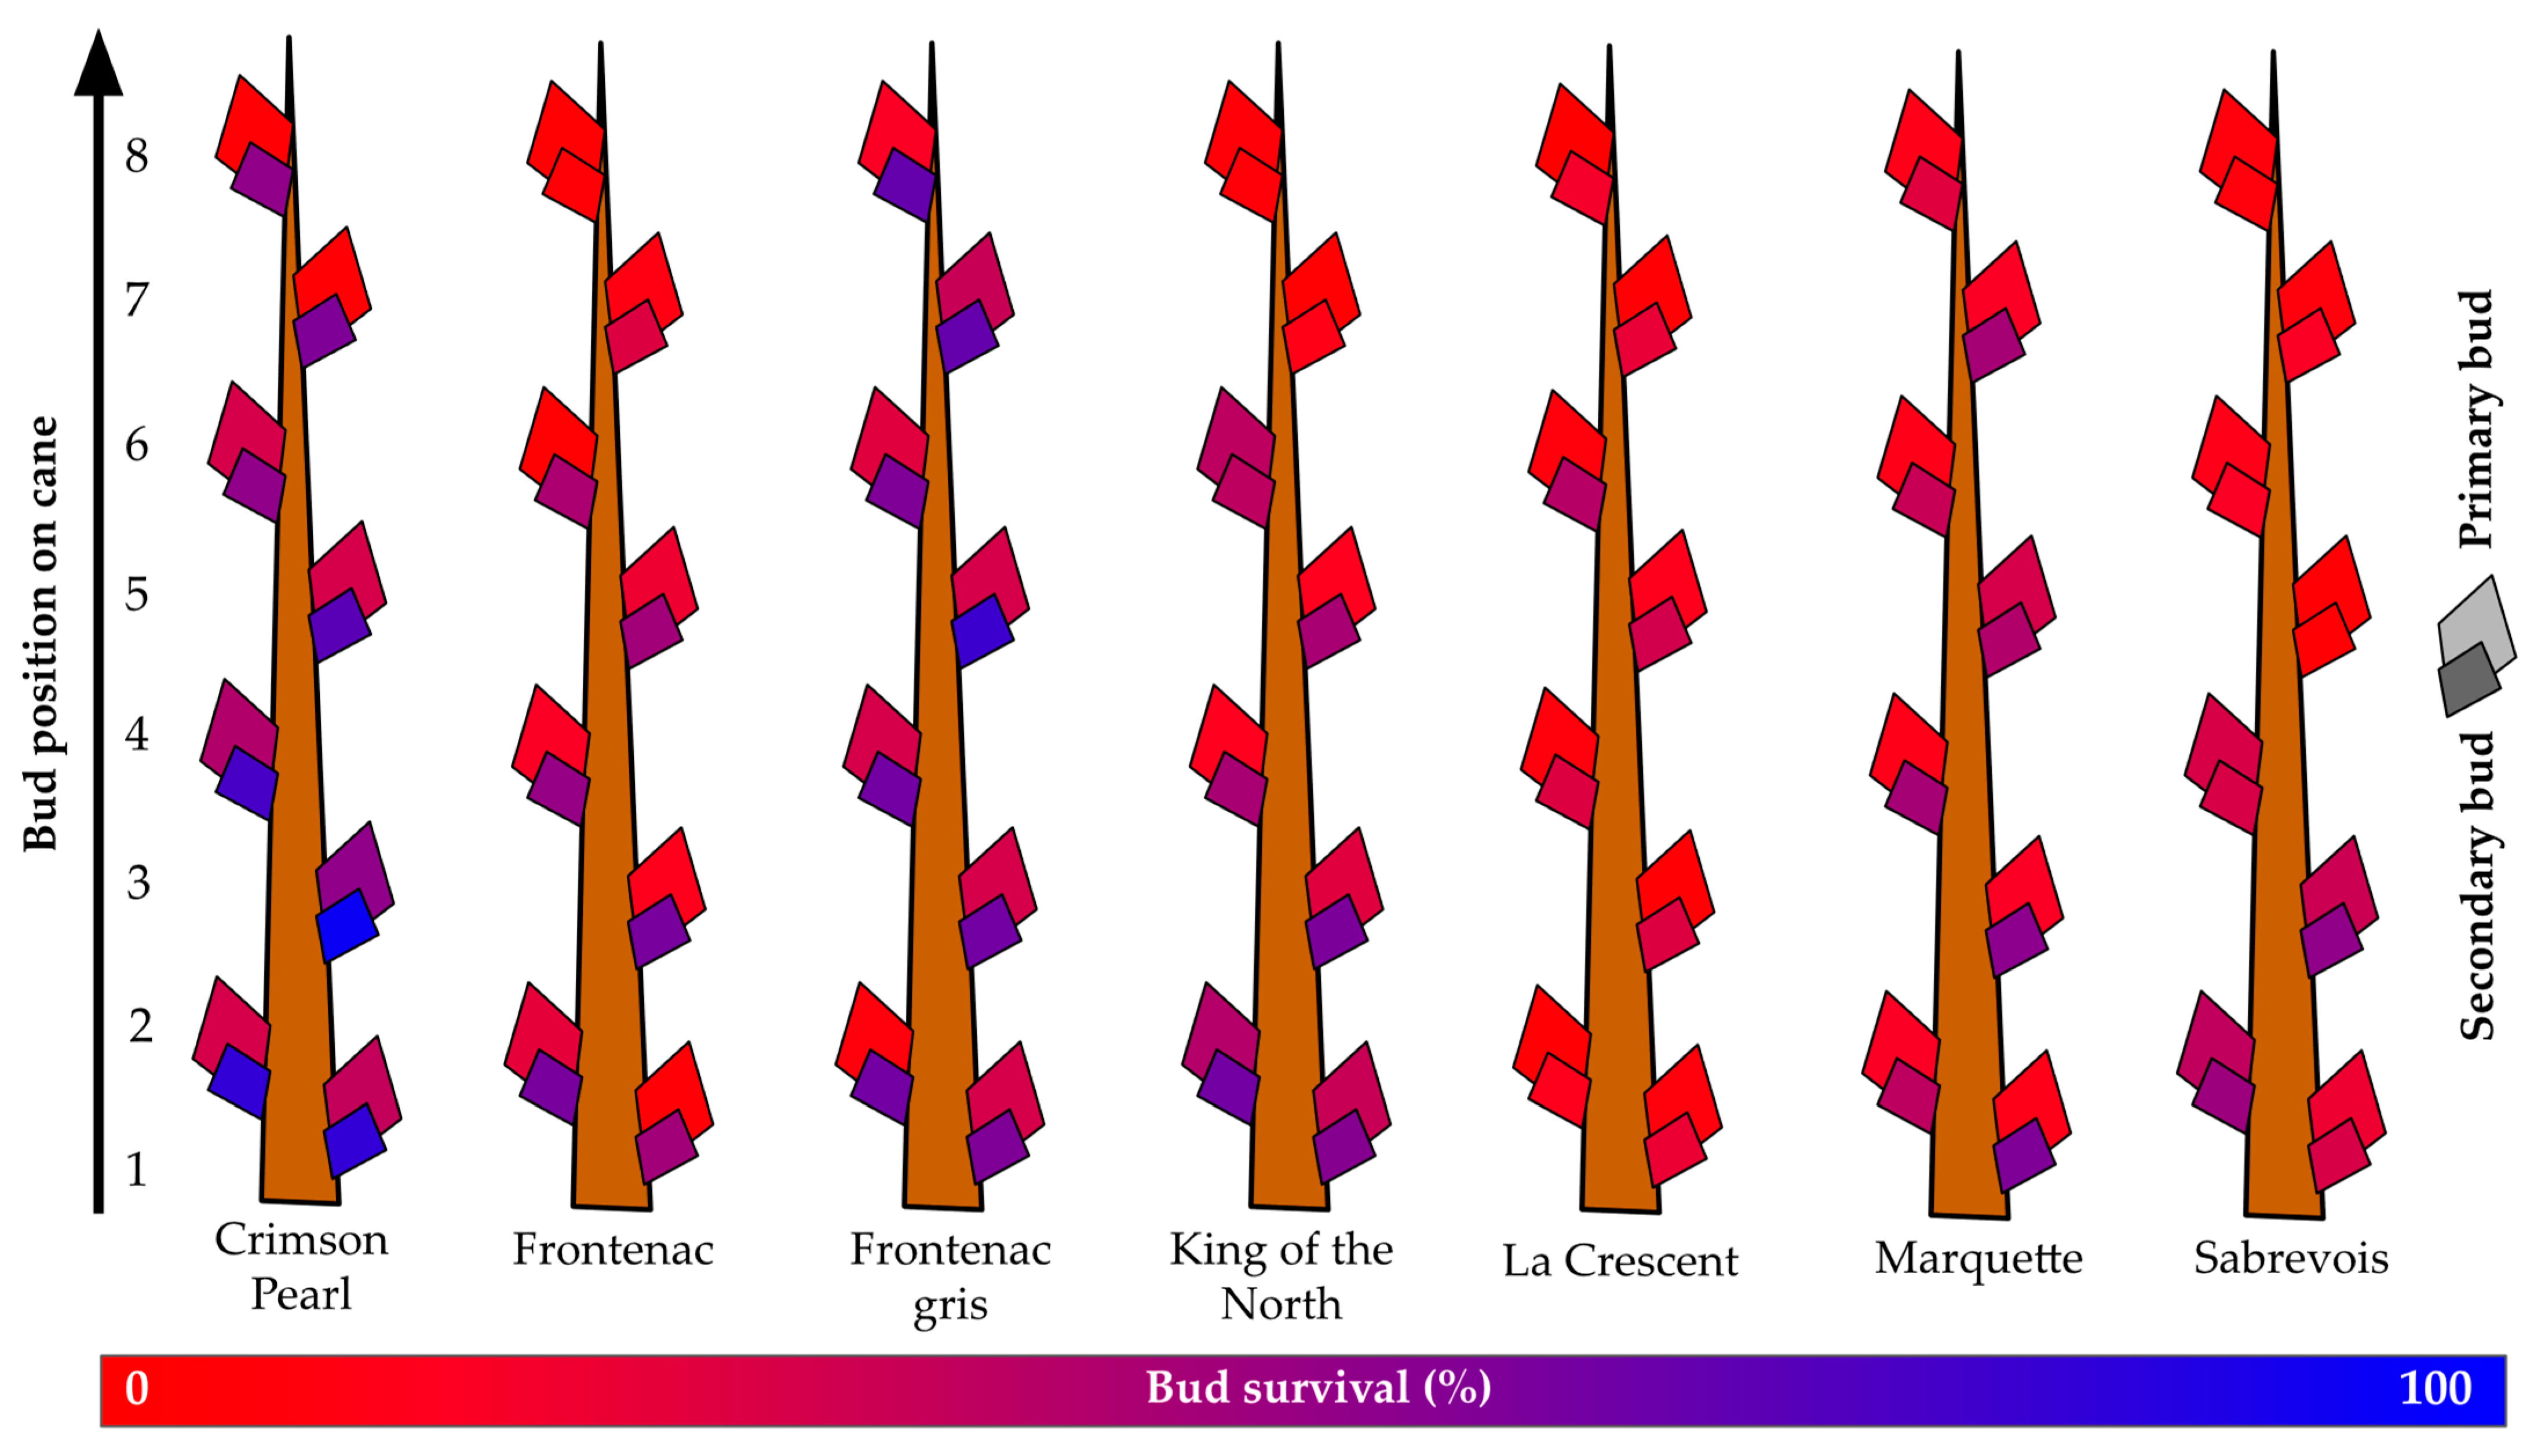
The overall survival of primary buds for the seven cultivars grown at the Buffalo vineyard was below 19%, with a maximum of nearly 29% (‘Crimson Pearl’) and a minimum of less than 7% (‘La Crescent’) (Figure 5). Secondary bud survival was greater than primary bud survival, ranging from more than 71% (‘Crimson Pearl’) to less than 25% (‘La Crescent’), with a mean of over 44% secondary bud survival. Overall, secondary bud survival was almost 1.6X greater than primary bud survival. The mean survival of primary buds one to three was below 23%. Only two grapevines exceeded 30% primary bud survival for the buds that would become spurs: ‘Crimson Pearl’ (over 39%) and ‘King of the North’ (over 33%). However, secondary buds of the same first three nodes had less than 50% survival only in two grapevines: ‘La Crescent’ (less than 21% secondary bud survival of spur buds) and ‘Sabrevois’ (less than 43% secondary bud survival of spur buds).
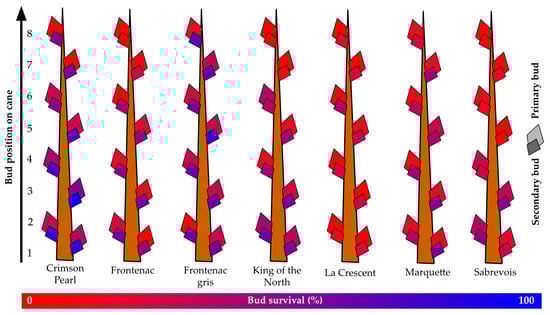
Figure 5.
Percent primary and secondary bud survival following the 2019–2020 dormant season of seven grapevine cultivars grown at a commercial vineyard near Buffalo, ND.
4. Discussion
Based on the assessment of periderm development, ‘Valiant’ was excellent for lignification traits, while ‘King of the North’ performed poorly. However, despite their differences, these two cultivars withstood the harsh winter conditions of North Dakota. Contrastingly, ‘Marquette’ had excellent periderm development, but ‘Marquette’ is the one of cultivars most frequently affected by cold injury in North Dakota [3,19]. Thus, while lignification is essential for winter tissue survival, a diversification of survival strategies appears to exist across the different genotypes.
Grapevines can withstand freezing temperatures due to two main mechanisms: freezing tolerance and freezing avoidance. Freezing tolerance is driven by a grapevine’s capacity to tolerate ice particle presence in the extracellular spaces of tissue [1,2]. Alternatively, desiccation tolerance is increased through multiple metabolic alterations within the cell [20]. Generally, xylem tissue has more extracellular spaces than phloem tissue, which translates to a higher freezing tolerance in xylem compared to phloem [39]. This is consistent with the observed rank of hardiness of xylem and phloem tissue within the present research work.
Avoidance of freezing involves a mechanism known as supercooling. Supercooling is the ability of a liquid to remain in liquid form even below subzero temperatures by isolating itself from ice nucleators and altering solute concentrations within the liquids. An incomplete vascular connection between cane tissue and the buds of grapevine acts as a barrier against ice nucleation, which facilitates supercooling [7,8,24,40,41]. The supercooled water inside the bud freezes when the temperature drops below a certain threshold, causing fatal cell damage [41]. Freezing avoidance usually occurs in buds whereas freezing tolerance occurs in cane and trunk tissues.
The genetic and phenotypic correlations herein, like the BLUPs and BLUEs examined, are focused on the correlations within the genotype/cultivars’ present generation during variety release/germplasm testing rather than their progeny. As such, it does not focus on the occurrence of these traits within a given segregating population, but rather on the correlations of the traits within the asexually propagated grapevines themselves. This is useful for improving recommendations to farmers and surmising potential effects in progeny, but it fails to depict the actual breeding value of individual genotypes’ gametic contributions to trait variation.
Phenotypic correlations are a measure of association between an individual’s observed phenotypic values for a pair of quantitative traits. This correlation helps to identify how traits are related at the physiological level and estimate how the selection of one trait will influence the selection of other traits [42]. Genetic correlations account for individual genotypes’ variability in phenotypic correlations and may be the result of pleiotropic effects (alleles that typically affect one trait also have an impact on a different trait) or by the linkage disequilibrium between alleles (each of which controls only one of the traits) [42,43]. A high genetic correlation between traits in two different environments specifies a lack of genotype × environment interaction; this is indicative that selection in one environment will result in genetic change in the other, and vice versa. Genetic gains from selection can be difficult since many quantitative traits of interest frequently exhibit genetic correlations with other traits [44]. If two traits are favorably associated, selection can simultaneously improve both traits by tandem selection and indirect selection [45]. Unfavorable trait correlations occur frequently and are a significant concern during selection [44].
Plant breeders frequently use heritability to estimate the accuracy of field trials [46]. Broad-sense heritability is defined as the percentage of phenotypic variance that is attributable to an overall variance for the genotype [47]. The heritability of certain phloem LTE traits was low, while bud LTE traits were a reliable trait with higher heritability for which marker development may be more practical. When the environmental effect on a trait is large, as with certain stress events like drought, disease, and freezing temperatures, selection based on phenotypic variation will be muddied. One of the ways to maximize the genetic gain is to increase the selection accuracy in a breeding cycle using molecular genetics approaches such as marker-assisted selection (MAS) or genomic selection (GS) [48].
Although there is still much to learn about the genetic factors that affect grapevine bud phenology and acclimation, increasing effort by researchers has been placed on examining molecular factors affecting bud cold hardiness and mechanisms that drive deacclimation and bud break [49]. Due to variations in their chilling requirements, which enable buds to transition from one stage of dormancy to another at distinct intervals, different grapevine varieties react differently to cold temperatures and dormancy [50]. With regard to high and low chill varieties as well as fast or slow burst genotypes, chilling requirements and heat requirements may vary dramatically [51]. Deacclimation rates also vary between cultivars. The majority of V. riparia and V. amurensis cultivars, which are frequently used as sources of cold hardiness, have been found to deacclimate more rapidly than common cultivated varieties. This could increase the likelihood of deacclimation during warmer winters and result in progeny suffering from frost damage in early spring [52].
Due to the absence of readily observable visual changes during the prolonged bud dormancy cycle, monitoring the dormancy status of the bud in real time is a challenging phenotype to apply within a breeding program [53]. Therefore, it is critical to continue improving methodologies that effectively capture bud cold hardiness. Recently, it has been demonstrated that budbreak strictly correlates with the loss of winter cold hardiness and that these phenological changes are supported by temperature-controlled interactions [54].
In this study, bud LTE50 and phloem LTEmid values frequently fell within similar ranges throughout the testing period, and they were consistently threatened by approximately six winter weather events. Contrastingly, xylem tissue was hardiest and projected LTEmid values generally did not intersect with winter temperatures. DTA results indicated a high likelihood of bud death due to the multiple freeze events, which fell below the expected LTE50 values. However, the presence of live buds after projected bud death indicates a potential need to refine DTA methodologies for extreme winter climates to increase the precision and reflection of naturally occurring damage in the field. To measure these effects during the dormant season, canes should be collected to simultaneously assess bud cross-sections to link with DTA results; this will provide greater insight for farmers and researchers concerning the real-world survival and the efficacy of simulated bud death results.
In addition to bud survival in North Dakota, other challenges exist for regional grape growers and winemakers. Considerable and consistent cold damage to many grapevines reduces overall vineyard productivity even when aboveground plant tissues are not killed entirely [3,19]. This persistent annual cold damage, which either impacts or kills primary buds, further constricts the yield potential of vines with pre-existing challenges stemming from small cluster size (a critical yield component) [19]. Established cultivars rarely cross a yield threshold of two metric tons per acre across several years; this is highlighted by the performance of ‘Frontenac’ and ‘Frontenac gris’, two widely grown cold hardy lines, which frequently yield below 3 kg per vine and sometimes below 1 kg per vine, depending on the location and year in North Dakota [19,55,56].
The challenges of obtaining sufficient yield are exacerbated by the conditions of harvest. Harvest of grapes in North Dakota is conducted based on monitoring of relative ripeness and weather patterns; frost and snow often prematurely end the growing season and trigger harvest decisions when accumulated GDD (base 10 °C) falls between 1100 and 1500 for the season. Due to this phenomenon and the variable genetic backgrounds of the cultivars grown, fruit and musts are often excessively acidic.
Of the genotypes evaluated within this study, ‘Valiant’ and ‘Frontenac’/’Frontenac gris’ are F1/S0 hybrids with V. riparia based on their pedigrees. ‘Valiant’ is the only cultivar to exceed 50% primary bud survival following the 2019–2020 dormant season. ‘Crimson Pearl’, ‘Frontenac Gris’, ‘John Viola’, and ‘King of The North’ (Buffalo site) exceeded 20% primary bud viability; they warrant further investigation concerning secondary bud fertility as they may be applicable varieties for production in harsh winter conditions. The level of soluble solids for these lines is acceptable for stable wine production in most years (exceeding 20 Brix for most lines); however, their titratable acidity levels pose major winemaking challenges as they frequently exceed 10.0 g/L for most lines [19]. The high levels of acid (high titratable acidity and low pH) found in North Dakota grapes are a long-standing challenge for winemakers and have driven ongoing innovation of vineyard and winemaking practices [19,55,56,57]. These management practices are supplemented by ongoing breeding work for cold-climate grapevines.
Management techniques to induce hardiness responses, such as growth regulators or fertility supplementation, should be examined to improve shoot maturation and increase the degree of cold resistance of all commercial grapevines, considering the damage frequently observed in North Dakota. Rootstock utilization as a hardiness-modulating viticultural technique has not been explored on a large scale either experimentally or commercially for grapevines in North Dakota; however, native V. riparia or ‘Valiant’ may warrant consideration in future experimental plots as rootstocks.
5. Conclusions
Continued breeding work is necessary to allow for a consistent yield of unprotected viticulture in challenging cold climate conditions such as North Dakota. Cold hardiness traits with higher heritability, such as bud LTE values may be suitable targets for marker development to enable marker-assisted selection for applied breeding programs. However, the variability of the instantaneous heritability for LTE traits of different tissues when comparing single sampling events indicates the need for improved sampling approaches to maximize the population size phenotyped while minimizing variance attributed to non-genetic sources.
Supplementary Materials
The following supporting information can be downloaded at: https://www.mdpi.com/article/10.3390/life14020178/s1, Figure S1: Differential thermal analysis results expressed as low temperature exotherms (LTEs) (LTE10, LTE50, and LTE90 for dormant buds and LTE10, LTEmid, and LTEend for phloems and xylems) for nine grapevine genotypes grown near Absaraka, ND at the North Dakota State University Horticulture Research Farm during the 2019–2020 dormant season. Figure S2: Differential thermal analysis results expressed as low-temperature exotherms (LTEs) (LTE10, LTE50, and LTE90 for dormant buds and LTE10, LTEmid, and LTEend for phloems and xylems) for seven grapevine cultivars grown at a commercial vineyard near Buffalo, ND during the 2019–2020 dormant season.
Author Contributions
Conceptualization, A.S. and B.K.; methodology, A.S. and B.K.; software, A.S. and B.K.; formal analysis, A.S. and B.K.; investigation, A.S., B.K., V.R.K., M.B., and C.A.; resources, H.H.-V.; data curation, A.S. and B.K.; writing—original draft preparation, A.S. and B.K.; writing—review and editing, A.S., B.K., V.R.K., M.B., and H.H.-V.; visualization, A.S.; funding acquisition, B.K.; supervision, H.H.-V.; project administration, H.H.-V. All authors have read and agreed to the published version of the manuscript.
Funding
The work of Bülent Köse was supported by Scientific and Technological Research Council of Türkiye (TUBITAK) through BIDEB 2219 International Postdoctoral Research Scholarship Program The funders had no role in the design of the experiment or the decision to publish.
Institutional Review Board Statement
Not applicable.
Informed Consent Statement
Not applicable.
Data Availability Statement
The data used to obtain the reported results are available in the Supplementary Files.
Conflicts of Interest
The authors declare no conflicts of interest. The funders had no role in the design of this study, data collection, analyses, interpretation of the data, writing of the manuscript, or decision to publish the results.
References
- Fennell, A. Freezing Tolerance and Injury in Grapevines. J. Crop Improv. 2004, 10, 201–235. [Google Scholar] [CrossRef]
- Zabadal, T.J.; Dami, I.E.; Goffinet, M.C.; Martinson, T.E.; Chien, M.L. Winter Injury to Grapevines and Methods of Protection. Mich. State Univ. Ext. 2007, E-2930, 106. [Google Scholar]
- Svyantek, A.; Köse, B.; Stenger, J.; Auwarter, C.; Hatterman-Valenti, H. Cold-Hardy Grape Cultivar Winter Injury and Trunk Re-Establishment Following Severe Weather Events in North Dakota. Horticulturae 2020, 6, 75. [Google Scholar] [CrossRef]
- This, P.; Lacombe, T.; Thomas, M.R. Historical Origins and Genetic Diversity of Wine Grapes. Trends Genet. 2006, 22, 511–519. [Google Scholar] [CrossRef] [PubMed]
- Reynolds, A.G. The Grapevine, Viticulture, and Winemaking: A Brief Introduction. In Grapevine Viruses: Molecular Biology, Diagnostics and Management; Meng, B., Martelli, G.P., Golino, D.A., Fuchs, M., Eds.; Springer International Publishing: Cham, Switzerland, 2017; pp. 3–29. ISBN 978-3-319-57706-7. [Google Scholar]
- Hou, L.; Zhang, G.; Zhao, F.; Zhu, D.; Fan, X.; Zhang, Z.; Liu, X. VvBAP1 Is Involved in Cold Tolerance in Vitis vinifera L. Front. Plant Sci. 2018, 9, 726. [Google Scholar] [CrossRef] [PubMed]
- Pierquet, P.; Stushnoff, C. Relationship of Low Temperature Exotherms to Cold Injury in Vitis Riparia Michx. Am. J. Enol. Vitic. 1980, 31, 1–6. [Google Scholar] [CrossRef]
- Pierquet, P.; Stushnoff, C.; Burke, M.J. Low Temperature Exotherms in Stem and Bud Tissues of Vitis Riparia Michx.1. J. Am. Soc. Hortic. Sci. 1977, 102, 54–55. [Google Scholar] [CrossRef]
- Howell, G.S. Grapevine Cold Hardiness: Mechanisms of Cold Acclimation, Mid-Winter Hardiness Maintenance, and Spring Deacclimation. In Proceedings of the ASEV 50th Anniversary Annual Meeting, Seattle, WA, USA, 19–23 June 2000; American Society for Enology and Viticulture, ASEV: Seattle, WA, USA, 2000; pp. 35–48. [Google Scholar]
- Dami, I.E.; Ennahli, S.; Zhang, Y. Assessment of Winter Injury in Grape Cultivars and Pruning Strategies Following a Freezing Stress Event. Am. J. Enol. Vitic. 2012, 63, 106–111. [Google Scholar] [CrossRef]
- Reynolds, A.G. Grapevine Breeding Programs for the Wine Industry; Elsevier: Amsterdam, The Netherlands, 2015; ISBN 978-1-78242-080-4. [Google Scholar]
- Yilmaz, T.; Alahakoon, D.; Fennell, A. Freezing Tolerance and Chilling Fulfillment Differences in Cold Climate Grape Cultivars. Horticulturae 2021, 7, 4. [Google Scholar] [CrossRef]
- Stenger, J.E.; Hatterman-Valenti, H.M. Complex Plant Process Trait Evaluation Through Decomposition of Higher-Order Interaction: A Case Study in Acclimation Responses of Cold-Climate Hybrid Grapevine Through Bilinear and Multiway Methods. J. Am. Soc. Hortic. Sci. 2022, 147, 161–173. [Google Scholar] [CrossRef]
- Stenger, J.; Hatterman-Valenti, H. Contrasting Responses to Environmental Conditions by Three Cold-Climate Winegrape Cultivars Grown in the United States Northern Plains Region. Acta Hortic. 2017, 1188, 173–180. [Google Scholar] [CrossRef]
- Karimi, R. Potassium-Induced Freezing Tolerance Is Associated with Endogenous Abscisic Acid, Polyamines and Soluble Sugars Changes in Grapevine. Sci. Hortic. 2017, 215, 184–194. [Google Scholar] [CrossRef]
- Sarikhani, H.; Haghi, H.; Ershadi, A.; Esna-Ashari, M.; Pouya, M. Foliar Application of Potassium Sulphate Enhances the Cold-Hardiness of Grapevine (Vitis vinifera L.). J. Hortic. Sci. Biotechnol. 2014, 89, 141–146. [Google Scholar] [CrossRef]
- Lucau-Danila, A.; Toitot, C.; Goulas, E.; Blervacq, A.S.; Hot, D.; Bahrman, N.; Sellier, H.; Lejeune-Hénaut, I.; Delbreil, B. Transcriptome Analysis in Pea Allows to Distinguish Chilling and Acclimation Mechanisms. Plant Physiol. Biochem. 2012, 58, 236–244. [Google Scholar] [CrossRef] [PubMed]
- Wilwerth, J.; Ker, K.; Inglis, D. Best Management Practices for Reducing Winter İnjury in Grapevines; Brock University: St. Catharines, ON, Canada, 2014. [Google Scholar]
- Hatterman-Valenti, H.M.; Auwarter, C.P.; Stenger, J.E. Evaluation of Cold-Hardy Grape Cultivars for North Dakota and the North Dakota State University Germplasm Enhancement Project. Acta Hortic. 2016, 1115, 13–22. [Google Scholar] [CrossRef]
- Wisniewski, M.; Nassuth, A.; Teulières, C.; Marque, C.; Rowland, J.; Cao, P.B.; Brown, A. Genomics of Cold Hardiness in Woody Plants. Crit. Rev. Plant Sci. 2014, 33, 92–124. [Google Scholar] [CrossRef]
- Kalberer, S.R.; Wisniewski, M.; Arora, R. Deacclimation and Reacclimation of Cold-Hardy Plants: Current Understanding and Emerging Concepts. Plant Sci. 2006, 171, 3–16. [Google Scholar] [CrossRef]
- Fennell, A.; Hoover, E. Photoperiod Influences Growth, Bud Dormancy, and Cold Acclimation in Vitis Labruscana and V. Riparia. J. Am. Soc. Hortic. Sci. 1991, 116, 270–273. [Google Scholar] [CrossRef]
- Wake, C.M.F.; Fennell, A. Morphological, Physiological and Dormancy Responses of Three Vitis Genotypes to Short Photoperiod. Physiol. Plant. 2000, 109, 203–210. [Google Scholar] [CrossRef]
- Wisniewski, M.; Bassett, C.; Gusta, L.V. An Overview of Cold Hardiness in Woody Plants: Seeing the Forest Through the Trees. HortScience 2003, 38, 952–959. [Google Scholar] [CrossRef]
- Stushnoff, C. Breeding and Selection Methods for Cold Hardiness in Deciduous Fruit Crops1. HortScience 1972, 7, 10–13. [Google Scholar] [CrossRef]
- Grant, T.N.L.; Gargrave, J.; Dami, I.E. Morphological, Physiological, and Biochemical Changes in Vitis Genotypes in Response to Photoperiod Regimes. Am. J. Enol. Vitic. 2013, 64, 466–475. [Google Scholar] [CrossRef]
- Piepho, H.P.; Möhring, J.; Melchinger, A.E.; Büchse, A. BLUP for Phenotypic Selection in Plant Breeding and Variety Testing. Euphytica 2008, 161, 209–228. [Google Scholar] [CrossRef]
- Soh, A.C. Ranking Parents by Best Linear Unbiased Prediction (BLUP) Breeding Values in Oil Palm. Euphytica 1994, 76, 13–21. [Google Scholar] [CrossRef]
- Searle, S.R.; Casella, G.; McCulloch, C.E. Variance Components; John Wiley & Sons: Hoboken, NJ, USA, 2009; ISBN 978-0-470-31769-3. [Google Scholar]
- Hill, R.R., Jr.; Rosenberger, J.L. Methods for Combining Data from Gemrplasm Evaluation Trials1. Crop Sci. 1985, 25, 467–470. [Google Scholar] [CrossRef]
- Tatar, I. Comparison of Two Single Curtain and Two Double Curtain Trellis Systems with Marquette and Petite Pearl Wine Grapes. Master’s Thesis, North Dakota State University, Fargo, ND, USA, 2020. [Google Scholar]
- Stenger, J.E. Factors Affecting Grapevine Establishment in Northern Production Regions. Master’s Thesis, North Dakota State University, Fargo, ND, USA, 2011. [Google Scholar]
- Alvarado, G.; López, M.; Vargas, M.; Pacheco, Á.; Rodríguez, F.; Burgueño, J.; Crossa, J. META-R (Multi Environment Trail Analysis with R for Windows), Version 6.04. CIMMYT Research Data & Software Repository Network. 2015. Available online: https://hdl.handle.net/11529/10201 (accessed on 17 January 2024).
- Alvarado, G.; Rodríguez, F.M.; Pacheco, A.; Burgueño, J.; Crossa, J.; Vargas, M.; Pérez-Rodríguez, P.; Lopez-Cruz, M.A. META-R: A Software to Analyze Data from Multi-Environment Plant Breeding Trials. Crop J. 2020, 8, 745–756. [Google Scholar] [CrossRef]
- R Core Team. R: A Language and Environment for Statistical Computing; R Foundation for Statistical Computing: Vienna, Austria, 2022. [Google Scholar]
- Wickham, H.; Chang, W. “Package ‘Ggplot2’.” Create Elegant Data Visualisations Using the Grammar of Graphics. 2016. Available online: https://rdrr.io/cran/ggplot2/man/ggplot2-package.html (accessed on 17 January 2024).
- Google Sheets: Free Online Spreadsheet Editor|Google Workspace. Available online: https://docs.google.com/ (accessed on 21 April 2022).
- Google Slides: Free Online Slideshow Maker|Google Workspace. Available online: https://docs.google.com/ (accessed on 21 April 2022).
- Paroschy, J.H.; Meiering, A.G.; Peterson, R.L.; Hostetter, G.; Neff, A. Mechanical Winter Injury in Grapevine Trunks. Am. J. Enol. Vitic. 1980, 31, 227–232. [Google Scholar] [CrossRef]
- Andrews, P.K.; Sandidge, C.R.; Toyama, T.K. Deep Supercooling of Dormant and Deacclimating Vitis Buds. Am. J. Enol. Vitic. 1984, 35, 175–177. [Google Scholar] [CrossRef]
- Quamme, H.A. Mechanism of Supercooling in Overwintering Peach Flower Buds1. J. Am. Soc. Hortic. Sci. 1978, 103, 57–61. [Google Scholar] [CrossRef]
- Falconer, D.S. Introduction to Quantitative Genetics; Pearson Education: London, UK, 1996; ISBN 978-81-317-2740-9. [Google Scholar]
- Lynch, M.; Walsh, B. Genetics and Analysis of Quantitative Traits; Sinauer: Sunderland, MA, USA, 1998; ISBN 978-0-87893-481-2. [Google Scholar]
- Neyhart, J.L.; Lorenz, A.J.; Smith, K.P. Multi-Trait Improvement by Predicting Genetic Correlations in Breeding Crosses. G3 Genes|Genomes|Genet. 2019, 9, 3153–3165. [Google Scholar] [CrossRef]
- Bernardo, R.N. Breeding for Quantitative Traits in Plants; Stemma Press: Woodbury, MN, USA, 2020; ISBN 978-0-9720724-3-4. [Google Scholar]
- Piepho, H.-P.; Möhring, J. Computing Heritability and Selection Response from Unbalanced Plant Breeding Trials. Genetics 2007, 177, 1881–1888. [Google Scholar] [CrossRef] [PubMed]
- Schmidt, P.; Hartung, J.; Rath, J.; Piepho, H.-P. Estimating Broad-Sense Heritability with Unbalanced Data from Agricultural Cultivar Trials. Crop Sci. 2019, 59, 525–536. [Google Scholar] [CrossRef]
- Larkin, D.L.; Lozada, D.N.; Mason, R.E. Genomic Selection—Considerations for Successful Implementation in Wheat Breeding Programs. Agronomy 2019, 9, 479. [Google Scholar] [CrossRef]
- De Rosa, V.; Vizzotto, G.; Falchi, R. Cold Hardiness Dynamics and Spring Phenology: Climate-Driven Changes and New Molecular Insights Into Grapevine Adaptive Potential. Front. Plant Sci. 2021, 12, 644528. [Google Scholar] [CrossRef] [PubMed]
- Londo, J.P.; Kovaleski, A.P. Characterization of Wild North American Grapevine Cold Hardiness Using Differential Thermal Analysis. Am. J. Enol. Vitic. 2017, 68, 203–212. [Google Scholar] [CrossRef]
- Londo, J.P.; Johnson, L.M. Variation in the Chilling Requirement and Budburst Rate of Wild Vitis Species. Environ. Exp. Bot. 2014, 106, 138–147. [Google Scholar] [CrossRef]
- Kovaleski, A.P.; Reisch, B.I.; Londo, J.P. Deacclimation Kinetics as a Quantitative Phenotype for Delineating the Dormancy Transition and Thermal Efficiency for Budbreak in Vitis Species. AoB Plants 2018, 10, ply066. [Google Scholar] [CrossRef]
- Or, E. Grape Bud Dormancy Release—The Molecular Aspect. In Grapevine Molecular Physiology & Biotechnology; Roubelakis-Angelakis, K.A., Ed.; Springer: Dordrecht, The Netherlands, 2009; pp. 1–29. ISBN 978-90-481-2305-6. [Google Scholar]
- Kovaleski, A.P.; Londo, J.P. Tempo of Gene Regulation in Wild and Cultivated Vitis Species Shows Coordination between Cold Deacclimation and Budbreak. Plant Sci. 2019, 287, 110178. [Google Scholar] [CrossRef]
- Aipperspach, A.; Hammond, J.; Hatterman-Valenti, H. Utilizing Pruning and Leaf Removal to Optimize Ripening of Vitis Riparia-Based ‘Frontenac Gris’ and ‘Marquette’ Wine Grapes in the Northern Great Plains. Horticulturae 2020, 6, 18. [Google Scholar] [CrossRef]
- Olson, B.K.; Brooke, M.; Wang, Z.; Svyantek, A.; Stenger, J.; Hatterman-Valenti, H. ‘Frontenac’ Grape Response to Canopy Management in North Dakota. Horticulturae 2021, 7, 288. [Google Scholar] [CrossRef]
- Olson, B.K. Frontenac’ Response to Leaf Removal and Training Systems and a Microvinification and Deacidification Bioassay of Interspecific Hybrids (Vitis spp.). Master’s Thesis, North Dakota State University, Fargo, ND, USA, 2016. [Google Scholar]
Disclaimer/Publisher’s Note: The statements, opinions and data contained in all publications are solely those of the individual author(s) and contributor(s) and not of MDPI and/or the editor(s). MDPI and/or the editor(s) disclaim responsibility for any injury to people or property resulting from any ideas, methods, instructions or products referred to in the content. |
© 2024 by the authors. Licensee MDPI, Basel, Switzerland. This article is an open access article distributed under the terms and conditions of the Creative Commons Attribution (CC BY) license (https://creativecommons.org/licenses/by/4.0/).