Abstract
Pothos (Epipremnum aureum) is a commonly used indoor ornamental foliage, particularly in the middle and lower regions of the Yangtze River in China. It typically grows in the tropical area, and it is yet unclear whether prolonged winter temperatures cause plant damage and impact its development. In this study, the E. aureum chilling injury response was explored by maintaining it at 1 °C. Based on the acquired results, low-temperature stress (LTS) induced wilting and yellowing of leaves and diminished chloroplast pigment concentrations, particularly the chlorophyll b content. LTS also induced overproduction of reactive oxygen species (ROS) within E. aureum and enhanced the relative electrical conductivity and superoxide dismutase activity. In addition, with prolonged LTS, the anatomical structure of E. aureum was severely damaged, resulting in a marked reduction in the photochemical activity of the photosystem Ⅱ reaction center and suppressed photosynthesis. Moreover, results of the transcriptomic analysis revealed that LTS induced the expression of genes involved in the α-linolenic acid metabolic pathway, plant hormone network, host plant–pathogen association, and MAPK axis, suggesting that LTS would activate its resistant response to cold stress. These results unraveled the physiological and transcriptomical response of E. aureum to chilling injury, which would lay a theoretical foundation for the cultivation of low-temperature-tolerant varieties of E. aureum.
1. Introduction
Being an important environmental stress factor, cold stress, caused by low-temperature stress (LTS), has an adverse effect on plant growth, development, and yield. Particularly, in recent years, LTS, brought on by an abnormally altered global climate, caused massive losses to the agricultural industry [1]. Plant cold stress is generally divided into two categories: freezing and chilling injuries [2]. Freezing injury is caused by the prolonged plant exposure to low temperatures (i.e., below 0 °C), which may freeze the internal tissues, thus resulting in irreversible damage and death of plants [3,4,5]. Alternately, chilling injury occurs when plants are exposed to low but not freezing temperatures (i.e., above 0 °C) [6]. This typically results in impaired plant growth and development, as well as reduced yield, fruit quality, and ornamental value, but not plant death. For instance, in crops, chilling injury to rice (Oryza sativa) seedlings, caused by ‘cold late spring’ weather in March and April, leads to leaf yellowing, slow seedling growth, stunted growth, wilting, and reduced tiller yields, all of which ultimately impact rice yield [7]. In case of fruits, mango (Mangifera indica) is a tropical fruit, and chilling injury, caused by improper storage, can negatively impact fruit quality, thereby resulting in lenticel discoloration and circular lesion spread, pitting, off-flavor, and pulp discoloration [8]. In terms of ornamental plants, Phalaenopsis aphrodite is known to suffer from chilling injury at a temperature of 2–7 °C. Under such conditions, its mesophyll cells collapse, its leaves become yellow, water gets immersed, and sometimes it develops sunken variegated leaves, which ultimately affects its ornamental values [9].
Pothos (Epipremnum aureum) is a perennial evergreen vine belonging to the Araceae family. It is native to the Soro Islands and is commonly referred to as Potho, Hunter’s Robe, Devil’s Ivy, or Ivy Arum [10]. Nowadays, E. aureum is the most commonly used indoor foliage plant all over China. This is primarily due to its ornamental values as it has luscious green leaves. It also has a purifying function. It serves as a natural ‘air purifier’, which greatly reduces the amount of ozone in the environment, and removes pollutants such as, xylene, formaldehyde, and benzene from indoor air [11]. Being a native of the tropical rain forest area in the Soro Islands, E. aureum prefers a warm and humid climate, with an optimal growth temperature of 20–32 °C, and it is susceptible to chilling injury or freezing damage in a low-temperature environment. Currently, E. aureum is widely used for its ornamental and purification functions in the middle and lower regions of the Yangtze River. Since the winter temperature in these regions is around 0 °C, it is easy to cause chilling injury to E. aureum. Therefore, it is critical to explore effective methods of improving its cold tolerance in the future.
Most studies on E. aureum are focused on its purifying functions [12,13]; however, few investigated its responses to stress, such as chilling injury. To elucidate the physiological and transcriptomical response of E. aureum to chilling injury, chloroplast pigment contents, reactive oxygen species (ROS), water content, relative electrical conductivity, antioxidant enzymatic activities, chlorophyll fluorescence variables, anatomical observation, and transcriptomic analysis were assessed in this study. This investigation will enhance the understanding of the E. aureum physiological and transcriptomical response to chilling injury, which would lay a theoretical foundation for the cultivation of low-temperature-tolerant varieties of E. aureum.
2. Materials and Methods
2.1. Plant Materials and Treatments
E. aureum plants that exhibited strong and steady development were purchased from the Huaduhui horticultural market in Yangzhou. E. aureum plants grown in soil were separated into two groups of 15 pots each. One group was maintained at 1 °C and was designated as the LTS group. The other group was maintained at 20 °C and was designated as the control group. Both groups received an air humidity of 60%, with light intensity of 30,000 lx for 14 h in the daytime and 0 lx for 10 h at nighttime. Leaf specimen and other data were collected on the 0, 7, 14, 21, and 28-day post-treatment, and three E. aureum plants were arbitrarily chosen as replicates for individual treatments. Following chlorophyll fluorescence parameters and ROS measurements, the collected leaves were sliced into smaller portions prior to fixation in 2.5% glutaraldehyde and ultrastructural observation. The remaining leaves were instantly frozen in liquid nitrogen prior to storage in −80 °C for further analyses.
2.2. Chloroplast Pigment Contents Measurement
Chloroplast pigment content measurements were performed as described by Lewis et al. [14]. In short, 0.2 g fresh weight (FW) leaves were weighed prior to the introduction of 12 mL of 95% ethanol and subsequent grinding of the leaves until they completely turned white. This was followed by filtration via a filter paper into a 25 mL volumetric flask. To ensure maximum yield, both the filter paper and residue were washed multiple times. Next, ethanol was introduced to stabilize the volume (V) and then mixed well. The chloroplast pigment extract absorbance values (A665 and A649 representing wavelengths 665 and 649 nm, respectively) were next recorded, and chlorophyll a and b in the samples were computed based on the following equations: chlorophyll a content = (13.95 × A665 − 6.88 × A649) × V/FW; chlorophyll b content = (24.96 × A649 − 7.32 × A665) × V/FW. To elucidate the total chlorophyll content, chlorophyll a and b contents were added together.
2.3. ROS Determination
Hydrogen peroxide (H2O2) accumulation was assessed via diaminobenzidine (DAB) staining [15], which was prepared via the introduction of a 0.1 mg·mL−1 DAB staining solution (pH 5.0) to a 50 mM Tris-acetate buffer. Fresh leaves were soaked in the prepared dye without light for 24 h, prior to boiling in 95% alcohol for 15 min, removal, and photography.
The superoxide radicals (O2−) accumulation was assessed via a kit (Shanghai Haring Biotechnology Co. Ltd., Shanghai, China). In short, fresh leaves were rapidly sliced using a double-sided blade while leaving the major veins intact. Next, the sliced samples were rinsed in distilled water on a slide prior to the addition of 10 μL dihydroethidium (DHE) fluorescent dye, incubation without light at 37 °C for 20 min, followed by observation and photography under a fluorescence microscope (Axio Imager D2, ZEISS, Dusseldorf, Germany).
2.4. Leaf Water Content Measurement
The leaf water content was determined based on the Fang et al. report [16]. In short, an analytical balance (Suzhou Scientific Instruments Co., Ltd., Suzhou, China) was used to record the weights of fresh leaves as FW. Next, leaves were incubated in a 105 °C oven (9423A, Shanghai Jinghong Experimental Equipment Co., Ltd., Shanghai, China) for 5 min, prior to drying in a 65 °C oven to constant weight, which was then recorded as the dry weight (DW). Leaf water content (%) = (FW − DW)/FW × 100%.
2.5. Relative Electrical Conductivity Measurement
The relative electrical conductivity determination followed a protocol described by Xu et al. [17]. In short, fresh leaves were rinsed in ultrapure water prior to punching approximately 1 cm diameter holes to acquire small leaf disks. About 0.1 g leaves were then weighed and inserted into a syringe with ultrapure water. Following vacuuming, the leaves and 20 mL deionized water were placed in a glass tube, which was then maintained at room temperature (RT) for 4 h. The mixture was then mixed well before the initial solution conductivity (C1) measurement via a conductivity meter (DDS–307-A, Ray Magnetic Instrument Co., Ltd., Shanghai, China). The glass tube was heated in a boiling water bath for 30 min prior to the conductivity (C2) measurement. The REC (%) was computed as follows: C1/C2 × 100%.
2.6. Antioxidant Enzymatic Activities Determination
The enzymatic activities of superoxide dismutase (SOD), peroxidase (POD), and catalase (CAT) were determined using the corresponding kits (Suzhou Keming Biotechnology Co., Ltd., Suzhou, China) following the kit directions.
2.7. Chlorophyll Fluorescence Parameters Measurement
Chlorophyll fluorescence parameters were next measured using a chlorophyll fluorescence spectrometer (Heinz Walz GmbH, Nuremberg, Germany) after the plants were incubated without light for over 2 h. PAM Win software was employed for the measurement and computation of the PSII photochemical maximum quantum yield (variable fluorescence (Fv)/maximum fluorescence (Fm), PSII photochemistry (Y(II), nonphotochemical quenching coefficient (qN), and quantum yield of nonregulated energy dissipation (Y(NO)).
2.8. Anatomical Observation
The anatomical observation referenced the Zhao et al. [18] study. Briefly, fresh leaves were sliced into smaller portions of 1 × 1 cm prior to fixation in 2.5% glutaraldehyde at 4 °C for a minimum of 4 h. The leaves were then rinsed thrice in a 0.1 M phosphate buffer for 15 min each prior to a secondary fixation in 1% osmium tetroxide for 4 h. Subsequently, they were dehydrated in 100% acetone and acetone-containing anhydrous sodium sulfate for 15 min each. This was followed by embedding in Spurr resin, sectioning, and double-staining with uranyl acetate and lead citrate. Lastly, the mesophyll cells and chloroplasts were visualized and photographed under a transmission electron microscope (TEM) (HT7700, HITACHI, Tokyo, Japan).
2.9. RNA Isolation, cDNA Library Generation, and Sequencing
Two groups of samples (control and 1 °C LTS at day 28), with three replicates, were employed for RNA-seq. Total RNA was isolated with a mirVana™ miRNA ISOlation Kit (Ambio-1561, North Augusta, SC, USA) following the kit directions, with subsequent RNA quantification via an Agilent 2100 Bioanalyzer (Agilent Technologies, Santa Clara, CA, USA). Samples with an RNA integrity number ≥7.0 and 28S/18S ratio ≥0.7 were used for subsequent analyses. cDNA libraries were generated via a TruSeq Stranded mRNA LTSample Prep Kit (Illumina, San Diego, CA, USA) per the kit directions. Lastly, these libraries were sequenced on an Illumina HiSeq 4000 platform to obtain 150 bp paired-end reads.
2.10. Sequence Assembly, Annotation, Identification, and Enrichment Analysis
Raw data (raw reads) processing employed Trimmomatic [19]. Reads with ploy-N and those with low quality were eliminated to achieve clean reads, which were then entered into the expressed sequence tag clusters (contigs) and into a transcript via Trinity [20] (version: 2.4) using the paired-end technique. The largest mRNA, based on the sequence similarity and length, was selected as a unigene for further analyses. Subsequently, unigene function was identified using unigene annotation based on the NCBI nonredundant (NR), SwissProt, and Clusters of orthologous groups for eukaryotic complete genome (KOG) databases via Blastx [21] and a cutoff E-value of 10−5. Next, proteins that received the largest hits to the unigenes were used to assign the corresponding functional roles. Using SwissProt, gene ontology (GO) stratification was conducted via mapping of the relationship between the SwissProt and GO term, followed by mapping of the unigenes to the Kyoto Encyclopedia of Genes and Genomes (KEGG) [22] database to screen for possible metabolic networks. The FPKM [23] and read count values of individual unigenes were computed via bowtie2 [24] and eXpress [25]. Differentially expressed genes (DEGs) were recognized via the DESeq [26] functions estimate size factors and nbinom test, and p value < 0.05 and fold change > 2 were set as the significance thresholds. The DEG-based GO and KEGG network enrichment analyses were carried out via R depending on the hypergeometric distribution. Lastly, TFs were recognized via the analysis of the InterProScan domain patterns in sequences with elevated coverage.
2.11. qRT-PCR Validation
A BIO-RAD CFX Connect™ Optics Module (Bio-Rad, Hercules, CA, USA) was employed for the qRT-PCR-based analysis of gene transcription. The same samples that underwent RNA-seq were employed in the qRT-PCR assessment. In short, isolated leaf RNA (1 μg) was converted to cDNA using the superscript first-strand synthesis system (PrimeScript® RT Reagent Kit With gDNA Eraser, TaKaRa, Osaka, Japan). EaActin (DN 31460) was employed as an endogenous control. All targeted primers were synthesized by Beijing Qingke Biotechnology Co., Ltd., and are summarized in Table 1. The qRT-PCR (TaKaRa, Osaka, Japan) reaction was conducted with SYBR® Premix Ex Taq™ (Perfect Real Time) using the following parameters: 55 °C for 2 min, an initial denaturation step at 95 °C for 30 s, 40 cycles at 95 °C for 5 s, 55 °C for 15 s, and 72 °C for 30 s. The relative gene expression was computed using the 2−ΔΔCt comparative threshold cycle (Ct) formula [27].

Table 1.
Primer sequences used in qRT-PCR reactions in this study.
2.12. Statistical Analysis
All experiments were replicated three times and then averaged. SAS/STAT (version 6.12, SAS Institute, Chicago, IL, USA) was utilized for the analysis of variance, and graph plotting was conducted in GraphPad 8.0 software.
3. Results
3.1. Influence of LTS on Chloroplast Pigment Concentrations
Under continuous LTS, E. aureum growth was severely altered. Relative to the controls, E. aureum under LTS gradually turned yellow and lost their luster, and some even turned black and wilted. Following 7 days of LTS, the chlorophyll b and (a + b) contents were drastically diminished compared with the controls (Figure 1A,C). Moreover, with continued LTS, the chlorophyll b and (a + b) contents were consistently lower than those of the controls (Figure 1A,C). However, LTS did not alter the chlorophyll a levels (Figure 1B). This may be due to the reduced chlorophyll content owing to diminished photosynthesis caused by LTS, which resulted in the gradual yellowing and wilting of the leaves.
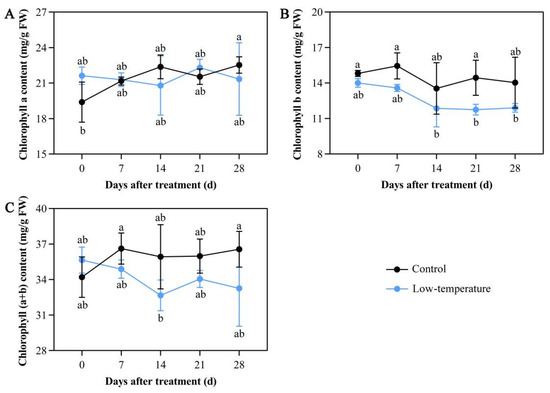
Figure 1.
Low-temperature stress (LTS) impacts chloroplast pigment contents in E. aureum leaves. (A) Chlorophyll a levels; (B) chlorophyll b levels; (C) chlorophyll (a + b) levels. Values denote mean ± standard deviation (SD), and different letters represent significantly lower or higher values compared with controls, as evidenced by Duncan’s multiple range test (p < 0.05).
3.2. Influence of LTS on ROS Concentrations
LTS causes oxidative damage in plants, which leads to the excessive production of ROS. H2O2 and O2·− are essential regulators of ROS accumulation. To measure the H2O2 production, DAB staining was used, and the leaf color represented the membrane lipid peroxidation status. A darker staining represented a higher level of membrane lipid peroxidation or membranal damage within the leaves. Following 7 days of LTS, the H2O2 accumulation status in the leaves was not markedly different from that in the controls. However, after 14 days of LTS, there was considerably more H2O2 accumulation in the leaves compared with the controls. Moreover, after 28 days of LTS, the degree of H2O2 accumulation in the leaves reached the maximum (Figure 2A). To measure O2·− accumulation, we employed DHE fluorescent probes, and a strong red fluorescence represented enhanced O2·− levels in the mesophyll cells. As illustrated in Figure 2B, following 7 days of LTS, the status of O2·− accumulation within the leaves was not markedly different from that within the controls. However, following 14 days of LTS, the status of O2·− accumulation within the leaves was elevated compared with the controls and remained consistently higher than that within the controls. These findings suggested that LTS markedly enhanced the ROS accumulation in the E. aureum leaves, causing severe oxidative damage to the plants.
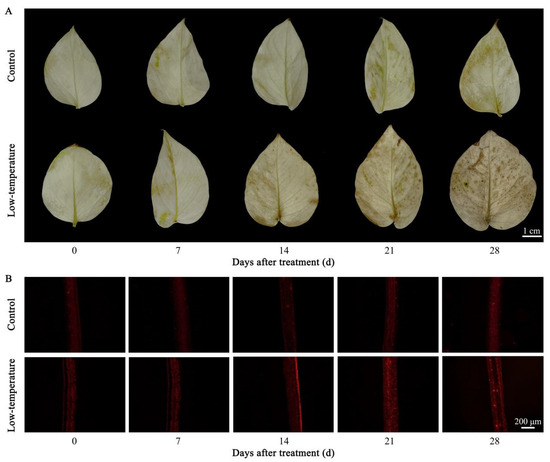
Figure 2.
Low-temperature stress (LTS) influences reactive oxygen species (ROS) concentrations in E. aureum leaves. (A) Hydrogen peroxide (H2O2) accumulation, as evidenced by diaminobenzidine (DAB) staining; (B) superoxide radicals (O2·−) accumulation, as evidenced by fluorescence prob.
3.3. Influence of LTS on Leaf Water Content
Cold stress exposure causes marked imbalance in water metabolism. Relative to the controls, LTS markedly reduced the water content in the leaves. A 7-day LTS did not alter the leaf water content compared with the controls. However, a 14-day LTS drastically diminished the leaf water content compared with the controls. Moreover, under continuous LTS, the leaf water content was substantially lower than the controls (Figure 3A). These findings indicated that LTS disrupts the delicate balance of water metabolism within E. aureum.
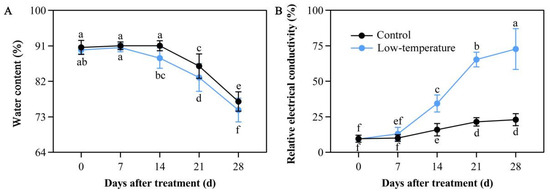
Figure 3.
Low-temperature stress (LTS) impacts water content (A) and relative electrical conductivity (B) in E. aureum leaves. Values denote mean ± standard deviation (SD), and different letters represent markedly diminished or elevated values, relative to controls, based on Duncan’s multiple range assessment (p < 0.05).
3.4. Influence of LTS on Relative Electrical Conductivity
Relative electrical conductivity can represent the stress-induced damage status of plants. Following 7 days of LTS, the relative leaf conductivity started to rise compared with the controls. In addition, with continuous LTS, the relative leaf conductivity rose to a maximum value at 28 days of LTS. The increase, compared with the controls, was by 3.16 folds (Figure 3B), indicating that the plant damage status gradually enhanced with increasing days of LTS exposure.
3.5. Influence of LTS on Antioxidant Enzymatic Activities
Antioxidative enzyme systems are known to scavenge excess ROS under abiotic stress. Following LTS, the activities of major antioxidant enzymes such as SOD, POD, and CAT were not substantially altered (Figure 4A–C). The SOD activity slightly increased, but did not reach significance (Figure 4A). These results indicated that E. aureum failed to scavenge ROS by inducing peroxidase activity under LTS.
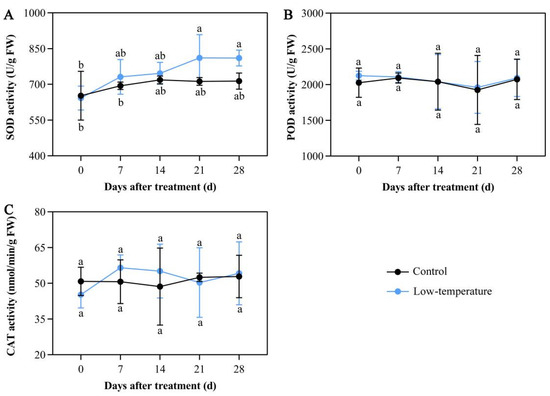
Figure 4.
Low-temperature stress (LTS) disrupts antioxidant enzymatic activities in E. aureum leaves. (A) Superoxide dismutase (SOD) activity; (B) peroxidase (POD) activity; (C) catalase (CAT) activity. Values denote mean ± standard deviation (SD), and different letters represent markedly reduced or elevated values, relative to controls, based on Duncan’s multiple range assessment (p < 0.05).
3.6. Influence of LTS on Chlorophyll Fluorescence Parameters
LTS strongly regulated chlorophyll fluorescence parameters. Under LTS, Fv/Fm of dark-adapted leaves and Y(II) values significantly decreased relative to the controls. Following 14 days of LTS, the Fv/Fm value started to reduce relative to the controls. Following 28 days of LTS, Fv/Fm reached the lowest value and was drastically diminished by 16.22%, as opposed to the controls. Following 21 days of LTS, the Y(II) value also started to reduce relative to the controls (Figure 5A,B). Meanwhile, the qN and Y(NO) values were markedly increased in the LTS leaves. Following 14 days of LTS, the Y(NO) value started to rise relative to the controls. Following 21 days of LTS, the qN value started to rise compared with the controls. Additionally, by the 28th day of LTS, both the qN and Y(NO) values reached their peaks, with increases of 17.94% and 95.01% of control leaves, respectively (Figure 5C,D). These results suggested that LTS severely disrupted the electron transport and photochemical activity of the PSII photosystem in plants, thus affecting plant photosynthesis.
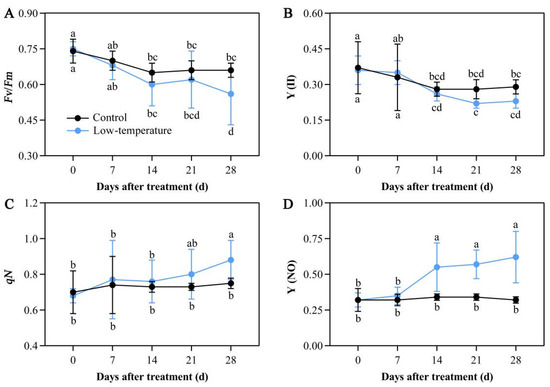
Figure 5.
Low-temperature stress (LTS) impacts chlorophyll fluorescence parameters in E. aureum leaves. (A) Variable fluorescence (Fv)/maximum fluorescence (Fm) value; (B) PSII photochemistry (Y(II)) value; (C) nonphotochemical quenching coefficient (qN) value; (D) quantum yield of nonregulated energy dissipation (Y(NO)) value. Values denote mean ± standard deviation (SD), and different letters represent markedly decreased or increased values, relative to controls, based on Duncan’s multiple range assessment (p < 0.05).
3.7. Influence of LTS on Leaf Ultrastructure
The E. Aureum mesophyll cell ultrastructure was observed via a TEM. As illustrated in Figure 6, the control leaf ultrastructure was complete with a large central vacuole, and the peripheral cytoplasm contained elliptical chloroplasts. The chloroplast envelope was complete, the internal grana were compact and of comparable size, and the grana lamellae were neatly arranged. There was a small amount of lipid droplets, and one or more starch granules were distributed within the chloroplast. Following LTS, the mesophyll cell ultrastructure significantly changed. Under continuous LTS, the mesophyll cells became gradually deformed, and the separation of the cytoplasm and cell wall was more prominent. On the 21st day of LTS, the mesophyll cells became severely deformed and irregular, and on the 28th day of LTS, the large central vacuole was completely ruptured, and the number of starch granules in the chloroplast was drastically reduced. These findings suggested that LTS completely destroyed the integrity of the chloroplast structure, which eventually affected plant photosynthesis.
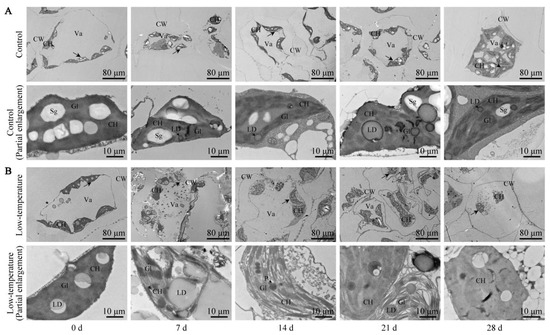
Figure 6.
Low-temperature stress (LTS) impacts mesophyll cells and chloroplasts in E. aureum leaves. (A) Control group; (B) LTS group. Lower image is an enlarged version of a portion, indicated by black arrow, of upper image. CH: chloroplast; CW: cell wall; Va: central large vacuole; Sg: starch granule; LD: lipid droplet; P: plastid pellet; Gl: basal lamellae.
3.8. Mapping and Quantitative Evaluation of Illumina Sequences
Six cDNA libraries, namely Control_1, Control_2, Control_3, Treatment_1, Treatment_2, and Treatment_3, were generated from the total RNA. All RNA-seq data associated with this investigation were uploaded to the NCBI Sequence Read Archive (SRA) database under the accession number PRJNA851036. Overall, 40.98 G clean data were acquired, with the effective data volume distribution of individual samples in 6.55 G–7.25 G; the Q30 base distribution was over 94.32–94.83%; and the average GC content was 51.54% (Table 2). Subsequently, 66,695 unigene strips were spliced with total and mean lengths of 67,423,826 bp and 1010.93 bp, respectively. The database annotations of unigenes were as follows: 28,413 (42.60%) genes to the NR library; 20,059 (30.08%) genes to the Swissprot library; 5839 (8.75%) genes to the KEGG library; 15,842 (23.75%) genes to the KOG library; 25,290 (37.92%) genes the to eggNOG library; 17,295 (25.93%) genes to the GO library; and 17,087 (25.62%) genes to the Pfam library (Table 3). The reads to the unigene had an alignment rate between 83.26% and 84.99%.
Table 2.
Quality metrics of unigenes in E. aureum leaves with control and low-temperature treatment (LTS).
Table 3.
Annotations of unigenes in E. aureum leaves with control and low-temperature treatment (LTS).
3.9. DEGs Identification and Enrichment Analyses
Unigene expression was computed via FPKM, and the results of the correlation analysis of the unigene expression between samples revealed a correlation coefficient distribution in the range 0.9982~0.9993. Based on Q value < 0.05 and |log2 (fold change)| >1, 439 DEGs were identified, with 438 upregulated and 1 downregulated expressions (Figure 7A). Based on Q value < 0.05 and DEGs number ≥ 2, 30 GO terms with 10 leading GO term enrichments in all categories were selected (Figure 7B). In the biological process (BP) category, marked DEG enrichments were in the chitin response (GO:0010200, 14.04, 15; GO term ID, enrichment score, DEGs number), sphingolipid biosynthetic process (GO:0030148, 15.75, 8), and wounding response (GO:0009611, 7.37, 11). The endoplasmic reticulum membrane (GO:0005789, 2.79, 17), nucleus (GO:0005634, 1.32, 65), and peroxisome (GO:0005777, 3.42, 6) were the three leading items in the cellular component (CC). In the molecular function (MF) category, the 8-amino-7-oxononanoate synthase activity (GO:0008710, 47.25, 5), 3-dehydrosphinganine reductase activity (GO:0047560, 27.80, 5), and xyloglucan:xyloglucosyl transferase activity (GO:0016762, 18.29, 6) were the most notably enriched. Furthermore, to elucidate the roles of DEGs, they were mapped to the reference specification path within the KEGG database. Based on Q value < 0.05 and DEGs number ≥ 2, DEGs were significantly enriched in seven KEGG pathways (Figure 7C). Among them, the plant hormone network (ko04075, 3.79, 12; KEGG pathway ID, enrichment score, DEGs number), alpha-linolenic acid metabolism (ko00592, 7.48, 5), linoleic acid metabolism (ko00591, 11.90, 3), plant–pathogen association (ko04626, 2.93, 8), and MAPK axis–plant (ko04016, 3.16, 6) were strongly related to cold tolerance.
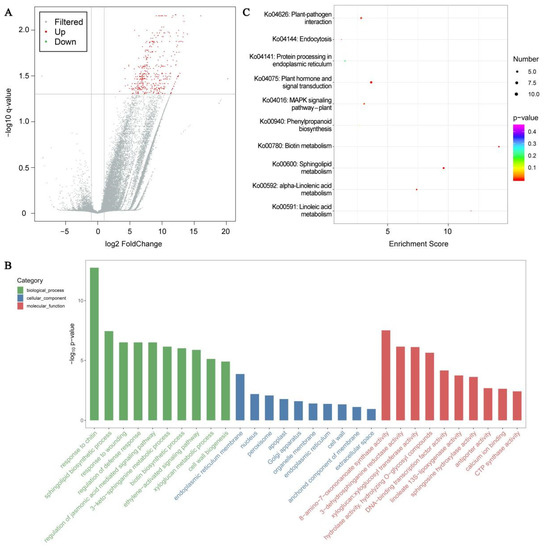
Figure 7.
Low-temperature stress (LTS) impacts transcriptomic analysis in E. aureum leaves. (A) Plot of differentially expressed genes (DEGs) in control vs. LTS leaves; (B) Leading 30 GO term distributions of DEGs under LTS; (C) Leading 10 KEGG pathway enrichments under LTS.
To better identify the core DEGs related to cold tolerance, metabolism pathway and heat map analyses were performed. In the plant hormone signal transduction, the xyloglucan:xyloglucosyl transferase (TCH4; DN31684_c2_g1_i4_1, DN32993_c2_g1_i5_2, DN32993_c2_g4_i1_2, DN34978_c1_g1_i4_2, DN35099_c0_g1_i9_1, and DN35099_c0_g5_i1_1) and jasmonate ZIM domain-containing protein (JAZ; DN22411_c0_g1_i2_1, DN27960_c0_g1_i7_1, DN28365_c0_g1_i1_1, DN30017_c0_g2_i4_2, DN30792_c0_g2_i3_2, and DN31716_c0_g2_i2_1) were associated with the brassinosteroid (BR) and jasmonic acid (JA) networks, respectively, and were markedly elevated under LTS (Figure 8A). The alpha-linolenic acid metabolism was related to the JA signaling pathway, and LTS induced the expression of key genes such as lipoxygenase (LOX; DN33096_c4_g2_i1_1, DN33938_c0_g1_i4_2, and DN34633_c0_g1_i2_1); allene oxide cyclase (AOC2; DN32010_c0_g1_i4_2); and 12-oxophytodienoate acid reductase (OPR1; DN33575_c0_g1_i10_2) (Figure 8B). In the plant–pathogen association and MAPK axis–plant, calmodulin (CaM; DN21102_c0_g1_i1_2); calmodulin-like protein (CML; DN19310_c0_g1_i1_1, DN25373_c0_g2_i1_1, DN25373_c0_g3_i1_1, DN30213_c0_g1_i2_2, and DN40156_c0_g1_i1_1); calcium-dependent protein kinase (CDPK; DN32056_c0_g2_i1_2); WRKY22 (DN30515_c2_g4_i2_2); serine/threonine-protein kinase (OXI1; DN29637_c0_g2_i1_1); and mitogen-activated protein kinase kinase kinase 17/18 (MAP3K17/18; DN28501_c0_g1_i1_1 and DN28501_c0_g3_i1_1) were also markedly enhanced under LTS (Figure 8C,D). In addition, based on the RNA-seq results, 52 DEGs were identified as transcription factors (TF) and were classified into 11 TF families (Figure 8E). Among the recognized TF families with DEG number ≥ 2, AP2/ERF and WRKY were the two top abundant categories, followed by Tify, MYB, C2H2, bHLH, and NAC.
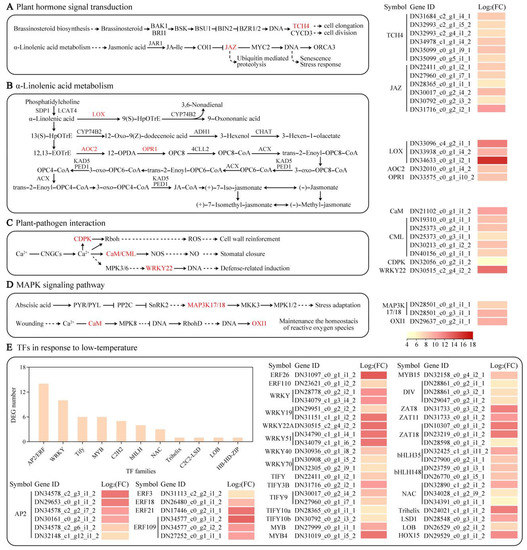
Figure 8.
The heat maps of DEGs relevant to plant hormone signaling pathway (A), alpha-linolenic acid metabolism (B), plant–pathogen association (C), MAPK axis–plant (D), and TFs (E) under low-temperature stress (LTS).
3.10. Verification of DEG Expression Profile via qRT-PCR
To verify the RNA-seq results, qRT-PCR was carried out. Fourteen DEGs, namely TCH4 (DN35099_c0_g1_i9_1), JAZ (DN22411_c0_g1_i2_1), LOX (DN34633_c0_g1_i2_1), AOC (DN32010_c0_g1_i4_2), OPR (DN33575_c0_g1_i10_2), CaM (DN21102_c0_g1_i1_2), CML (DN19310_c0_g1_i1_1), CDPK (DN32056_c0_g2_i1_2), OXI1 (DN29637_c0_g2_i1_1), MAP3K17/18 (DN28501_c0_g3_i1_1), hydroxycinnamoyl CoA: shikimate hydroxycinnamoyl transferase (HCT; DN34079_c0_g1_i1_2), cinnamyl alcohol dehydrogenase (CAD; DN33698_c3_g4_i1_2), WRKY22 (DN30515_c2_g4_i2_2), and MYB15 (DN32158_c0_g4_i2_1), were evaluated. EaActin (DN31460_c0_g1_i2_1) was used as a reference gene for qRT-PCR. The expression profiles of the 14 qRT-PCR-validated DEGs were highly consistent with the transcriptome sequencing results, suggesting great reliability of the DEG analysis data (Figure 9).
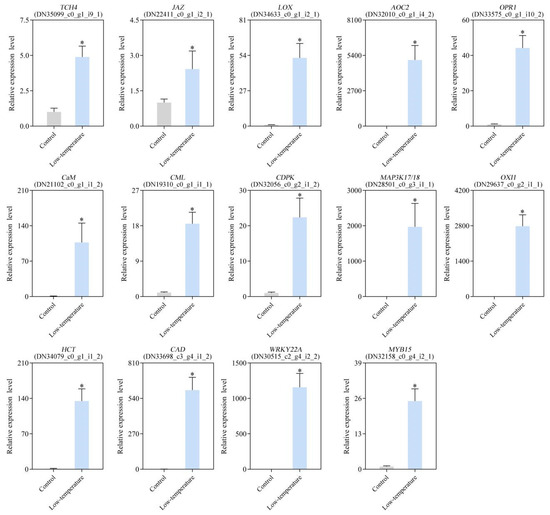
Figure 9.
Validation of gene expression profiles under low-temperature stress (LTS) using qRT-PCR. qRT-PCR analysis of 14 specific DEGs. Data are presented as mean ± standard deviation (SD), and ‘*’ indicated significantly lower or higher values, compared with control (p < 0.05).
4. Discussion
Chilling injury refers to plants in a temperature environment lower than the lowest limit of their optimal growth temperature [28], which inhibits their growth to a certain extent. LTS affects various physiological activities of plants, which is manifested by reduced growth, loss of water, withering of tissues and organs, yellow leaves with water stains, and even death [29]. In this study, the E. aureum leaves turned yellow and tarnished, and even turned black and withered under LTS. The leaf water content gradually decreased from day 0 to day 28 after LTS relative to the controls. This may be due to a reduction in the ability of the root system to absorb and transport water under the influence of cold stress, as well as the stomata closure that results in plant water loss. The leaf water content represents the water retention ability of leaves to a certain extent. When plants are subjected to cold stress, water metabolism is disrupted. This was previously demonstrated in rice [30]. Taken together, these results indicated that the cold stress degree of E. aureum can be partially reflected by the water content of leaves.
LTS affects plant photosynthesis and induces ROS overproduction, which is reflected by the accumulation of H2O2 and O2·− [31,32]. Generally, ROS accumulation leads to lipid peroxidation and plant cell death, which eventually suppresses plant development [33]. Herein, H2O2 and O2·− accumulations were enhanced with sustained LTS. This is consistent with studies on bananas (Musa nana) [34] and wheat (Triticum aestivum) [35]. LTS usually leads to membrane permeability and electrolyte leakage, which, in turn, results in the extravasation of cytosol and an increase in relative electrical conductivity [36]. Moreover, the relative E. aureum electrical conductivity also gradually augments under LTS, which is in accordance with the Fu et al. report [37]. This further verifies that LTS promotes lipid membrane peroxidation and enhances membrane permeability, thereby damaging the cellular membrane.
Antioxidative enzyme systems, comprising of SOD, POD, and CAT, sequester excess ROS under abiotic stress [38]. Under LTS, an enhanced antioxidant enzymatic activity represents a stronger ability to resist environmental stress [39]. In plant cells, SOD reduces the superoxide to H2O2, which is rapidly decomposed into O2 and H2O by CAT and POD [40,41]. Herein, we demonstrated that LTS slightly enhanced the SOD activity, similar to its activities in potato (Solanum tuberosum) [42] and Calendula officinalis [43]. This suggested that E. aureum can, to a certain extent, clear LTS-induced ROS by promoting the antioxidant enzymatic activity in order to reduce the cell membrane damage, and better adapt to the external environment. However, in coconuts (Cocos nucifera) [44], the POD and CAT activities demonstrated a gradual rising trend with decreasing temperature.
LTS accelerates the PSII electron transport by diminishing the PSII photochemical activity [45]. PSII is an integral part of the photosynthetic mechanism, and it serves an essential function in light energy conversion and electron transport. Fv/Fm strongly represents the photochemical efficiency of the PSII reaction, and it is frequently employed as a chlorophyll fluorescence kinetic parameter for the representation of photosynthetic mechanism, such as photochemical activity [46]. Chlorophyll fluorescence dissipation includes qP and qN; the latter protects the photosynthetic apparatus from intense light damage. With increasing qN, plants are able to tolerate excess light energy, owing to the better protection of the photosynthetic system. Y(NO) reflects the light damage severity, and, therefore, an increasing Y(NO) value represents further accumulation of light energy within the plant [47]. In maize (Zea mays), Zhang et al. [48] reported that the PSII reaction center is destroyed following LTS, and the plant accumulates excess light energy, which further reduces the photochemical efficiency manifested by a reduction in Fv/Fm and Y(II) and subsequent elevation in Y(NO). In this study, Fv/Fm and Y(II) were diminished with sustained LTS, whereas the qN and Y(NO) values enhanced, corroborating the results in Cycas panzhihuaensis [49]. This indicated that the PSII damage in E. aureum under LTS continued to increase with the extension of treatment days, and the plant activated the photoprotective mechanism to reduce the LTS-based damage.
The chloroplast ultrastructure is known to alter under LTS [50]. Herein, LTS caused massive alterations to the mesophyll cell ultrastructure of E. aureum. The inner vesicle was inflated, and the grana lamellae were irregularly arranged. These phenomena were consistent with the results in tung (Vernicia fordii) [51]. Together, this indicated that LTS destroyed the chloroplast structural integrity, thereby inducing irreversible damage to the plant photosynthetic system, with eventual photosynthesis suppression.
To protect themselves against cold, plants often alter their morphological, physiological, biochemical, and molecular characteristics [52]. Herein, RNA-seq was employed to screen for LTS-associated genes. Following LTS, 99.71% DEGs were upregulated compared with the controls. The results of the GO enrichment analysis demonstrated that LTS induced the modulation of the jasmonic acid network (GO:2000022), defense response (GO:0031347), calcium ion interaction (GO:0005509), and so on. In addition, using KEGG enrichment analysis, enrichments were seen in genes that participated in the plant hormone network (ko04075), alpha-linolenic acid metabolism (ko00592), plant–pathogen association (ko04626), and MAPK axis–plant (ko04016) under LTS, which was similar to the data from wucai (Brassica campestris L.) [53], tea (Camellia sinensis) [54], and pepper (Capsicum annuum L.) [55] under cold stress. These networks are modulated by various sensing and signaling genes associated with JA, Ca2+ signal network, and MAPK cascade, and this study identified additional genes that were involved in the signal sensing and signaling networks activated by LTS.
Signaling networks are critical for the response to LTS [56]. JA and its derivatives are known to regulate abiotic stress resistance [57] via interaction with JAZ subgroup members [58]. Multiple reports suggested that JA modulates cold tolerance via the activation of the CBF gene expression [59]. JA-Ile induces JAZs binding to the F-box protein COI1, which initiates the ubiquitin-based degradation of JAZs, thereby enabling ICE1/2 association and CBF activation [60]. Herein, six JAZ genes were elevated under LTS, which affected the JA signaling pathway, thereby improving cold tolerance. Moreover, Ca2+ influx is another critical-membrane-based alteration that occurs under LTS [61]. The transient elevation of the [Ca2+]cyt content via the Ca2+ influx is detected by an array of Ca2+ sensing proteins such as CaM, which undergo structural alteration and activation. Ca2+-loaded CaM/CML associations modulate a myriad of downstream proteins, which directly or indirectly regulate plant responses to environmental stressors such as LTS [62]. Herein, LTS-associated Ca2+ sensors were identified. Under LTS, one CaM, five CML, and one CDPK genes were markedly elevated suggesting that these Ca2+ signaling-associated genes promote enhanced cold tolerance. Additionally, the ROS-induced MAPK axis regulates cold stress signaling in Arabidopsis [63]. The MAPK axis involves MAP kinase kinase kinase (MAP3K or MEKK), MAP kinase kinase (MAP2K, or MKK), and MAP kinase (MAPK, or MPK) [64], and, in this study, two MAP3K17/18 were elevated following LTS. Furthermore, TFs play an essential role in modulating the gene expression in plants under abiotic stress [65,66]. In Arabidopsis, glutathione (GSH) modulates the MPK3 levels via WRKY40 in response to LTS [67]. Panax ginseng MYB4 overexpression in Arabidopsis enhances seedling tolerance to drought, salt, and cold conditions [68]. Trifoliate orange (Poncirus trifoliata (L.) Raf.) ERF109 overexpression confers augmented cold tolerance in transgenic tobacco and lemon plants, whereas inhibition of PtrERF109 in trifoliate orange based on virus-induced gene silencing (VIGS) leads to enhanced cold susceptibility [69]. Herein, LTS-responsive TFs were screened, namely TFs such as WRKY40, MYB4, and ERF109, which likely serve essential functions in cold tolerance modulation within E. aureum. Given these pieces of evidence, future investigations can elucidate the specific roles of these select TFs in metabolic networks to better comprehend their modulatory role in E. aureum.
5. Conclusions
In conclusion, this investigation examined alterations in various physiological indices and transcriptome within E. aureum following LTS to explore its tolerance to chilling injury. Under LTS, E. aureum leaves turned yellow and lost their moisture and luster. This was accompanied by excess ROS production, decreased Fv/Fm and Y(II) values, as well as severely impaired chloroplast structural integrity, which eventually led to oxidative damage and the negative modulation of photosynthesis. With sustained LTS, SOD activity was slightly increased, and the qN and Y(NO) values were elevated, compared with the controls. Therefore, E. aureum, to a certain extent, reduced oxidative damage and mobilized the photoprotective mechanism to enhance its LTS tolerance. LTS also induced the expression of genes associated with the JA, Ca2+ signal network, and MAPK axis such as JAZ, CaM, CML, and MAP3K17/18 genes. In addition, it enhanced the expression of TFs, namely WRKY40, MYB4, and ERF109, in response to chilling injury in an attempt to enhance cold tolerance in E. aureum. These results unraveled the physiological and transcriptomical response of E. aureum to chilling injury, which would lay a theoretical foundation for the cultivation of low-temperature-tolerant varieties of E. aureum.
Author Contributions
Y.W. and Y.T. planned and designed the experiments. Y.W., X.C., and Y.T. performed the experiments. Y.W. analyzed the data and wrote the manuscript. All authors have read and agreed to the published version of the manuscript.
Funding
This work was supported by the National Natural Science Funds (32102411), Natural Science Foundation of Jiangsu Province of China (BK20200924), Natural Science Foundation of Jiangsu Higher Education Institutions of China (20KJB210005), and Jiangsu Association for Science and Technology Young Scientific and Technological Talents Project—Supported by Yanqing Wu. We thank OE Biotech Co., Ltd. (Shanghai, China) for RNA-seq and Zhou Xuan for assistance with the data upload.
Institutional Review Board Statement
Not applicable.
Informed Consent Statement
Not applicable.
Data Availability Statement
Not applicable.
Conflicts of Interest
The authors declare that they have no competing interests.
Abbreviations
| AOC2 | allene oxide cyclase |
| BP | biological process |
| BR | brassinosteroid |
| CAD | cinnamyl alcohol dehydrogenase |
| CaM | calmodulin |
| CAT | catalase |
| CDPK | calcium-dependent protein kinase |
| CH | chloroplast |
| CML | calmodulin-like protein |
| CW | cell wall |
| DAB | diaminobenzidine |
| DEGs | differentially expressed genes |
| DHE | dihydroethidium |
| DW | dry weight |
| Fm | maximum fluorescence |
| Fv | variable fluorescence |
| FW | fresh weight |
| Gl | basal lamellae |
| GO | gene ontology |
| HCT | hydroxycinnamoyl CoA: shikimate hydroxycinnamoyl transferase |
| JA | jasmonic acid |
| JAZ | jasmonate ZIM domain-containing protein |
| KEGG | Kyoto Encyclopedia of Genes and Genomes |
| H2O2 | hydrogen peroxide |
| KOG | clusters of orthologous groups for eukaryotic complete genomes |
| LD | lipid droplet |
| LOX | lipoxygenase |
| LTS | low-temperature stress |
| MAP3K17/18 | mitogen-activated protein kinase kinase kinase 17/18 |
| NR | nonredundant |
| O2·− | superoxide radicals |
| OPR1 | 12-oxophytodienoate acid reductase |
| OXI1 | serine/threonine-protein kinase |
| P | plastid pellet |
| POD | peroxidase |
| qN | nonphotochemical quenching coefficient |
| ROS | reactive oxygen species |
| RT | room temperature |
| SD | standard deviation |
| Sg | starch granule |
| SOD | superoxide dismutase |
| SRA | sequence read archive |
| TCH4 | xyloglucan:xyloglucosyl transferase |
| TEM | transmission electron microscope |
| TF | transcription factors |
| V | volume |
| Va | central large vacuole |
| VIGS | virus-induced gene silencing |
| Y(II) | PSII photochemistry |
| Y(NO) | quantum yield of nonregulated energy dissipation |
References
- Walne, C.H.; Reddy, K.R. Temperature Effects on the Shoot and Root Growth, Development, and Biomass Accumulation of Corn (Zea mays L.). Agriculture 2022, 12, 443. [Google Scholar] [CrossRef]
- Gu, X.; Yang, C.; Zhao, H.; Hu, N.; Krauss, K.W.; Deng, C.; Chen, L. Sap flow evidence of chilling injury and recovery in mangroves following a spring cold spell. Trees 2021, 35, 907–917. [Google Scholar] [CrossRef]
- Szalai, G.; Majlath, I.; Pal, M.; Gondor, O.K.; Rundnoy, S.; Olah, C.; Vankova, R.; Kalapos, B.; Janda, T. Janus-Faced Nature of Light in the Cold Acclimation Processes of Maize. Front. Plant Sci. 2018, 9, 850. [Google Scholar] [CrossRef]
- Wei, C.W.; Huang, J.F.; Wang, X.Z.; Blackburn, G.A.; Zhang, Y.; Wang, S.S.; Mansaray, L.R. Hyperspectral characterization of freezing injury and its biochemical impacts in oilseed rape leaves. Remote Sens. Environ. 2017, 195, 56–66. [Google Scholar] [CrossRef]
- Zheng, G.; Li, L.; Li, W. Glycerolipidome responses to freezing-and chilling-induced injuries: Examples in Arabidopsis and rice. BMC Plant Biol. 2016, 16, 70. [Google Scholar] [CrossRef]
- Heidari, P.; Amerian, M.R.; Barcaccia, G. Hormone Profiles and Antioxidant Activity of Cultivated and Wild Tomato Seedlings under Low-Temperature Stress. Agronomy 2021, 11, 1146. [Google Scholar] [CrossRef]
- Pradhan, S.K.; Pandit, E.; Nayak, D.K.; Behera, L.; Mohapatra, T. Genes, pathways and transcription factors involved in seedling stage chilling stress tolerance in indica rice through RNA-Seq analysis. BMC Plant Biol. 2019, 19, 352. [Google Scholar] [CrossRef]
- Shivashankar, K.S.; Geetha, G.A.; Ravishankar, K.V.; Rao, D.V.S.; Pavithra, K.C.G.; Roy, T.K. Temperature gradient storage induced biochemical and molecular changes in mango (Mangifera indica L. cv. Alphonso) fruits. Acta Physiol. Plant. 2022, 44, 46. [Google Scholar] [CrossRef]
- Chen, W.L.; KO, Y.T. Exogenous hydrogen peroxide induces chilling tolerance in Phalaenopsis seedlings through glutathione-related antioxidant system. Sci. Hortic. 2021, 289, 110421. [Google Scholar] [CrossRef]
- Hung, C.Y.; Qiu, J.; Sun, Y.H.; Chen, J.J.; Kittur, F.S.; Henny, R.J.; Jin, G.L.; Fan, L.J.; Xie, J.H. Gibberellin deficiency is responsible for shy-flowering nature of Epipremnum aureum. Sci. Rep. 2016, 6, 28598. [Google Scholar] [CrossRef] [Green Version]
- Das, S.K.; Sengupta, P.; Mustapha, M.S.; Sarker, M.R. An Experimental Evaluation of Adaptogenic Potential of Standardized Epipremnum Aureum Leaf Extract. J. Pharm. Bioallied Sci. 2016, 9, 88–93. [Google Scholar] [CrossRef]
- Shyamala, S.; Manikandan, N.A.; Pakshirajan, K.; Tang, V.T.; Rene, E.R.; Park, H.S.; Behera, S.K. Phytoremediation of nitrate contaminated water using ornamental plants. J. Water Supply Res. Technol. 2019, 68, 731–743. [Google Scholar] [CrossRef]
- Hou, H.; Xu, Z. Effect Of Benzene On Formaldehyde Removal By Shoots Of Three Indoor Plant Species. Environ. Eng. Manag. J. 2015, 14, 2849–2854. [Google Scholar]
- Lewis, D.H.; Arathoon, H.S.; Swinny, E.E.; Huang, S.C.; Funnell, K.A. Anthocyanin and carotenoid pigments in spathe tissue from selected Zantedeschia Hybrids. Acta Hortic. 2003, 624, 147–154. [Google Scholar] [CrossRef]
- Tian, F.; Gong, J.; Zhang, J.; Zhang, M.; Wang, G.; Li, A.; Wang, W. Enhanced stability of thylakoid membrane proteins and antioxidant competence contribute to drought stress resistance in the tasg1 wheat stay-green mutant. J. Exp. Bot. 2013, 64, 1509–1520. [Google Scholar] [CrossRef]
- Fang, Z.W.; Wang, X.X.; Zhang, X.Y.; Zhao, D.Q.; Tao, J. Effects of fulvic acid on the photosynthetic and physiological characteristics of Paeonia ostii under drought stress. Plant Signal. Behav. 2020, 15, 1774714. [Google Scholar] [CrossRef]
- Xu, J.; Jin, J.; Zhao, H.; Li, K. Drought stress tolerance analysis of Populus ussuriensis clones with different ploidies. J. For. Res. 2019, 30, 1267–1275. [Google Scholar] [CrossRef]
- Zhao, D.; Fang, Z.; Tang, Y.; Tao, J. Graphene Oxide as an Effective Soil Water Retention Agent Can Confer Drought Stress Tolerance to Paeonia ostii without Toxicity. Environ. Sci. Technol. 2020, 54, 8269–8279. [Google Scholar] [CrossRef]
- Bolger, A.M.; Lohse, M.; Usadel, B. Trimmomatic: A flexible trimmer for Illumina sequence data. Bioinformatics 2014, 30, 2114–2120. [Google Scholar] [CrossRef]
- Grabherr, M.G.; Haas, B.J.; Yassour, M.; Levin, J.Z.; Thompson, D.A.; Amit, I.; Adiconis, X.; Fan, L.; Raychowdhury, R.; Zeng, Q.D.; et al. Full-length transcriptome assembly from RNA-Seq data without a reference genome. Nat. Biotechnol. 2011, 29, 644–652. [Google Scholar] [CrossRef]
- Altschul, S.F.; Gish, W.; Miller, W.; Myers, E.W.; Lipman, D.J. Basic local alignment search tool. J. Mol. Biol. 1990, 215, 403–410. [Google Scholar] [CrossRef]
- Kanehisa, M.; Arak, M.; Goto, S.; Hattori, M.; Hirakawa, M.; Itoh, M.; Katayama, T.; Kawashima, S.; Okuda, S.; Tokimatsu, T.; et al. KEGG for linking genomes to life and the environment. Nucleic Acids Res. 2008, 36, D480–D484. [Google Scholar] [CrossRef] [PubMed]
- Trapnell, C.; Williams, B.A.; Pertea, G.; Mortazavi, A.; Kwan, G.; van Baren, M.J.; Salzberg, S.L.; Wold, B.J.; Pachter, L. Transcript assembly and quantification by RNA-Seq reveals unannotated transcripts and isoform switching during cell differentiation. Nat. Biotechnol. 2019, 28, 511–515. [Google Scholar] [CrossRef]
- Langmead, B.; Salzberg, S.L. Fast gapped-read alignment with Bowtie 2. Nat. Methods 2012, 9, 357–359. [Google Scholar] [CrossRef]
- Roberts, A.; Pachter, L. Streaming fragment assignment for real-time analysis of sequencing experiments. Nat. Methods 2013, 10, 71–73. [Google Scholar] [CrossRef]
- Anders, S.; Huber, W. Differential expression of RNA-Seq data at the gene level—The DESeq package. Eur. Mol. Biol. Lab. 2012, 10, 1–23. [Google Scholar]
- Schmittgen, T.D.; Livak, K.J. Analyzing real-time PCR data by the comparative C-T method. Nat. Protoc. 2008, 3, 1101–1108. [Google Scholar] [CrossRef]
- Korkmaz, A.; Deger, O.; Szafranska, K.; Koklu, S.; Karaca, A.; Yakupoglu, G.; Kocacinar, F. Melatonin effects in enhancing chilling stress tolerance of pepper. Sci. Hortic. 2021, 289, 110434. [Google Scholar] [CrossRef]
- Heidarvand, L.; Maali-Amiri, R. Physio-biochemical and proteome analysis of chickpea in early phases of cold stress. J. Plant Physiol. 2013, 170, 459–469. [Google Scholar] [CrossRef]
- Dong, J.; Zhao, J.; Zhang, S.; Yang, T.; Liu, Q.; Mao, X.; Fu, H.; Yang, W.; Liu, B. Physiological and genome-wide gene expression analyses of cold-induced leaf rolling at the seedling stage in rice (Oryza sativa L.). Crop J. 2019, 7, 431–443. [Google Scholar] [CrossRef]
- Erdal, S. Androsterone-induced molecular and physiological changes in maize seedlings in response to chilling stress. Plant Physiol. Biochem. 2012, 57, 1–7. [Google Scholar] [CrossRef]
- Zhou, J.; Wang, J.; Shi, K.; Xia, X.J.; Zhou, Y.H.; Yu, J.Q. Hydrogen peroxide is involved in the cold acclimation-induced chilling tolerance of tomato plants. Plant Physiol. Biochem. 2012, 60, 141–149. [Google Scholar] [CrossRef]
- John, R.; Anjum, N.A.; Sopory, S.K.; Akram, N.A.; Ashraf, M. Some key physiological and molecular processes of cold acclimation. Biol. Plant. 2016, 60, 603–618. [Google Scholar] [CrossRef]
- Lo’ay, A.A.; EL-Khateeb, A.Y. Antioxidant enzyme activities and exogenous ascorbic acid treatment of ‘Williams’ banana during long-term cold storage stress. Sci. Hortic. 2018, 234, 210–219. [Google Scholar] [CrossRef]
- Esim, N.; Atici, O.; Mutlu, S. Effects of exogenous nitric oxide in wheat seedlings under chilling stress. Toxicol. Ind. Health 2014, 30, 268–274. [Google Scholar] [CrossRef]
- Wang, Y.X.; Hu, Y.; Chen, B.H.; Zhu, Y.F.; DaWuda, M.M.; Svetla, S. Physiological mechanisms of resistance to cold stress associated with 10 elite apple rootstocks. J. Integr. Agric. 2018, 17, 857–866. [Google Scholar] [CrossRef]
- Fu, J.; Miao, Y.; Shao, L.; Hu, T.; Yang, P. De novo transcriptome sequencing and gene expression profiling of Elymus nutans under cold stress. BMC Genom. 2016, 17, 870. [Google Scholar] [CrossRef]
- Popova, A.V.; Borisova, P.; Mihailova, G.; Georgieva, K. Antioxidative response of Arabidopsis thalianato combined action of low temperature and high light illumination when lutein is missing. Acta Physiol. Plant 2021, 44, 10. [Google Scholar] [CrossRef]
- Balabusta, M.; Szafranska, K.; Posmyk, M.M. Exogenous Melatonin Improves Antioxidant Defense in Cucumber Seeds (Cucumis sativus L.) Germinated under Chilling Stress. Front. Plant Sci. 2016, 7, 575. [Google Scholar] [CrossRef]
- Kaouthar, F.; Ameny, F.K.; Yosra, K.; Walid, S.; Ali, G.; Faical, B. Responses of transgenic Arabidopsis plants and recombinant yeast cells expressing a novel durum wheat manganese superoxide dismutase TdMnSOD to various abiotic stresses. J. Plant Physiol. 2016, 198, 56–68. [Google Scholar] [CrossRef]
- Ueda, Y.; Uehara, N.; Sasaki, H.; Kobayashi, K.; Yamakawa, T. Impacts of acute ozone stress on superoxide dismutase (SOD) expression and reactive oxygen species (ROS) formation in rice leaves. Plant Physiol. Biochem. 2013, 70, 396–402. [Google Scholar] [CrossRef]
- Che, Y.; Zhang, N.; Zhu, X.; Li, S.; Wang, S.; Si, H. Enhanced tolerance of the transgenic potato plants overexpressing Cu/Zn superoxide dismutase to low temperature. Sci. Hortic. 2020, 261, 108949. [Google Scholar] [CrossRef]
- Jan, N.; Majeed, U.; Andrabi, K.I.; John, R. Cold stress modulates osmolytes and antioxidant system in Calendula officinalis. Acta Physiol. Plant. 2018, 40, 73. [Google Scholar] [CrossRef]
- Sun, C.X.; Zhang, R.N.; Yuan, Z.Y.; Cao, H.X.; Martin, J.J.J. Physiology Response and Resistance Evaluation of Twenty Coconut Germplasm Resources under Low Temperature Stress. Horticulturae 2021, 7, 234. [Google Scholar] [CrossRef]
- Liu, W.; Zheng, C.; Chen, J.; Qiu, J.; Huang, Z.; Wang, Q.; Ye, Y. Cold acclimation improves photosynthesis by regulating the ascorbate-glutathione cycle in chloroplasts of Kandelia obovata. J. For. Res. 2019, 30, 755–765. [Google Scholar] [CrossRef]
- Krause, G.H.; Weis, E. Chlorophyll Fluorescence and Photosynthesis: The Basics. Annu. Rev. Plant Physiol. Plant Mol. Biol. 1991, 42, 313–349. [Google Scholar] [CrossRef]
- Kramer, D.M.; Johnson, G.; Kiirats, O.; Edwards, G.E. New fluorescence parameters for the determination of QA redox state and excitation energy fluxes. Photosynth. Res. 2004, 79, 209–218. [Google Scholar] [CrossRef]
- Zhang, Q.; Liu, Y.X.; Yu, Q.; Ma, Y.; Gu, W.R.; Yang, D.G. Physiological changes associated with enhanced cold resistance during maize (Zea mays) germination and seedling growth in response to exogenous calcium. Crop Pasture Sci. 2020, 71, 529–538. [Google Scholar] [CrossRef]
- Zheng, Y.L.; Yang, Y.Q.; Wang, M.; Hu, S.J.; Wu, J.R.; Yu, Z.X. Differences in lipid homeostasis and membrane lipid unsaturation confer differential tolerance to low temperatures in two Cycas species. BMC Plant Biol. 2021, 21, 377. [Google Scholar] [CrossRef]
- Hola, D.; Kutik, J.; Kocova, M.; Rothova, O. Low-temperature induced changes in the ultrastructure of maize mesophyll chloroplasts strongly depend on the chilling pattern/intensity and considerably differ among inbred and hybrid genotypes. Photosynthetica 2008, 46, 329–338. [Google Scholar] [CrossRef]
- Zhang, F.; Lu, K.; Gu, Y.; Zhang, L.; Li, W.; Li, Z. Effects of low-temperature stress and brassinolide application on the photosynthesis and leaf structure of tung tree seedlings. Front. Plant Sci. 2020, 10, 1767. [Google Scholar] [CrossRef] [PubMed]
- Shinozaki, K.; Yamaguchi-Shinozaki, K.; Seki, M. Regulatory network of gene expression in the drought and cold stress responses. Curr. Opin. Plant Biol. 2003, 6, 410–417. [Google Scholar] [CrossRef]
- Wang, C.; Zhang, M.; Zhou, J.; Gao, X.; Zhu, S.; Yuan, L.; Hou, X.; Liu, T.; Chen, G.; Tang, X.; et al. Transcriptome analysis and differential gene expression profiling of wucai (Brassica campestris L.) in response to cold stress. BMC Genom. 2022, 23, 137. [Google Scholar] [CrossRef] [PubMed]
- Li, Y.; Wang, X.; Ban, Q.; Zhu, X.; Jiang, C.; Wei, C.; Bennetzen, J.L. Comparative transcriptomic analysis reveals gene expression associated with cold adaptation in the tea plant Camellia sinensis. BMC Genom. 2019, 20, 624. [Google Scholar] [CrossRef]
- Zhang, J.W.; Liang, L.; Xie, Y.D.; Zhao, Z.; Su, L.H.; Tang, Y.; Sun, B.; Lai, Y.S.; Li, H.X. Transcriptome and Metabolome Analyses Reveal Molecular Responses of Two Pepper (Capsicum annuum L.) Cultivars to Cold Stress. Front. Plant Sci. 2022, 13, 8196390. [Google Scholar] [CrossRef]
- Janska, A.; Marsik, P.; Zelenkova, S.; Ovesna, J. Cold stress and acclimation—What is important for metabolic adjustment? Plant Biol. 2010, 12, 395–405. [Google Scholar] [CrossRef]
- Ali, M.S.; Baek, K.H. Jasmonic Acid Signaling Pathway in Response to Abiotic Stresses in Plants. Int. J. Mol. Sci. 2020, 21, 621. [Google Scholar] [CrossRef]
- Ye, H.Y.; Du, H.; Tang, N.; Li, X.H.; Xiong, L.Z. Identification and expression profiling analysis of TIFY family genes involved in stress and phytohormone responses in rice. Plant Mol. Biol. 2009, 71, 291–305. [Google Scholar] [CrossRef]
- Hu, Y.; Jiang, L.Q.; Wang, F.; Yu, D. Jasmonate Regulates the Inducer Of Cbf Expression-C-Repeat Binding Factor/Dre Binding Factor1 Cascade and Freezing Tolerance in Arabidopsis. Plant Cell 2013, 25, 2907–2924. [Google Scholar] [CrossRef]
- Sun, M.Z.; Shen, Y.; Chen, Y.; Wang, Y.; Cai, X.; Yang, J.; Jia, B.; Dong, W.; Chen, X.; Sun, X. Osa-miR1320 targets the ERF transcription factor OsERF096 to regulate cold tolerance via JA-mediated signaling. Plant Physiol. 2022, 189, 2500–2516. [Google Scholar] [CrossRef]
- DeFalco, T.A.; Bender, K.W.; Snedden, W.A. Breaking the code: Ca2+ sensors in plant signalling. Biochem. J. 2010, 425, 27–40. [Google Scholar] [CrossRef] [PubMed]
- Zeng, H.; Xu, L.; Singh, A.; Wang, H.; Du, L.; Poovaiah, B.W. Involvement of calmodulin and calmodulin-like proteins in plant responses to abiotic stresses. Front. Plant Sci. 2015, 6, 600. [Google Scholar] [CrossRef] [PubMed] [Green Version]
- Teige, M.; Scheikl, E.; Eulgem, T.; Doczi, F.; Ichimura, K.; Shinozaki, K.; Dangl, J.L.; Hirt, H. The MKK2 pathway mediates cold and salt stress signaling in Arabidopsis. Mol. Cell 2004, 15, 141–152. [Google Scholar] [CrossRef]
- Rodriguez, M.C.S.; Petersen, M.; Mundy, J. Mitogen-Activated Protein Kinase Signaling in Plants. Annu. Rev. Plant Biol. 2010, 61, 621–649. [Google Scholar] [CrossRef]
- Huang, Q.; Wang, Y.; Li, B.; Chang, J.; Chen, M.; Li, K.; Yang, G.; He, G. TaNAC29, a NAC transcription factor from wheat, enhances salt and drought tolerance in transgenic Arabidopsis. BMC Plant Biol. 2015, 15, 268. [Google Scholar] [CrossRef] [PubMed]
- Nakashima, K.; Takasaki, H.; Mizoi, J.; Shinozaki, K.; Yamaguchi-Shinozaki, K. NAC transcription factors in plant abiotic stress responses. Biochim. Biophys. Acta 2012, 1819, 97–103. [Google Scholar] [CrossRef]
- Boro, P.; Sultana, A.; Mandal, K.; Chattopadhyay, S. Interplay between glutathione and mitogen-activated protein kinase 3 via transcription factor WRKY40 under combined osmotic and cold stress in Arabidopsis. J. Plant Physiol. 2022, 271, 153664. [Google Scholar] [CrossRef]
- Lian, W.; Sun, T.; Meng, X.; Sun, R.; Hui, F.; Jiang, Y.; Zhao, Y. Overexpression of the Panax ginseng MYB4 gene enhances stress tolerance in transgenic Arabidopsis thaliana. Biol. Plant. 2021, 65, 27–38. [Google Scholar] [CrossRef]
- Wang, M.; Dai, W.S.; Du, J.; Ming, R.H.; Dahro, B.; Liu, J. ERF109 of trifoliate orange (Poncirus trifoliata (L.) Raf.) contributes to cold tolerance by directly regulating expression of Prx1 involved in antioxidative process. Plant Biotechnol. J. 2019, 17, 1316–1332. [Google Scholar] [CrossRef] [Green Version]
Publisher’s Note: MDPI stays neutral with regard to jurisdictional claims in published maps and institutional affiliations. |
© 2022 by the authors. Licensee MDPI, Basel, Switzerland. This article is an open access article distributed under the terms and conditions of the Creative Commons Attribution (CC BY) license (https://creativecommons.org/licenses/by/4.0/).