Abstract
Cup rupture failures in strip steel welds can lead to strip breakage, resulting in unplanned downtime of high-speed continuous rolling mills and scrap steel losses. Manual visual inspection suffers from a high false positive rate and cannot meet the production cycle time requirements. This paper proposes a lightweight online cup rupture visual inspection method based on an improved YOLOv10 algorithm. The backbone feature extraction network is replaced with ShuffleNetV2 to reduce the model’s parameter count and computational complexity. An ECA attention mechanism is incorporated into the backbone network to enhance the model’s focus on cup rupture micro-cracks. A Slim-Neck design is adopted, utilizing a dual optimization with GSConv and VoV-GSCSP, significantly improving the balance between real-time performance and accuracy. Based on the results, the optimized model achieves a precision of 98.8% and a recall of 99.2%, with a mean average precision (mAP) of 99.5%—an improvement of 0.2 percentage points over the baseline. The model has a computational load of 4.4 GFLOPs and a compact size of only 3.24 MB, approximately half that of the original model. On embedded devices, it achieves a real-time inference speed of 122 FPS, which is about 2.5, 11, and 1.8 times faster than SSD, Faster R-CNN, and YOLOv10n, respectively. Therefore, the lightweight model based on the improved YOLOv10 not only enhances detection accuracy but also significantly reduces computational cost and model size, enabling efficient real-time cup rupture detection in industrial production environments on embedded platforms.
1. Introduction
Strip steel is primarily categorized into cold rolled strip steel and hot rolled strip steel. Cold rolled strip steel finds extensive applications in automobile manufacturing, aerospace, and electronic equipment. Currently, the thickness of cold rolled strip steel has reached 0.1 mm, with rolling speeds attaining 1900 m/min. During the production process of cold rolled strip steel, strip breakage refers to the fracture of the strip steel caused by factors such as folding or extrusion. A strip breakage incident leads to the shutdown of the entire rolling mill unit, reduces production efficiency, poses safety risks to personnel, and renders the affected section of the strip scrap. According to historical data, a single strip breakage accident typically results in approximately 8 h of production line downtime and generates 2 to 8 tons of scrap material.
Strip breakage during rolling is mainly classified into two types: weld seam breakage and non-weld seam breakage. The causes of non-weld seam breakage are numerous and often beyond manual control. Quality inspection of strip steel predominantly focuses on the integrity of the weld seams [1,2,3]. For cold rolled strip steel, the cup rupture test is conventionally employed to evaluate the plastic deformation capacity of both the weld seam and the base metal within the heat-affected zone. A failing cup rupture test indicates insufficient weld strength, which can easily lead to strip breakage during subsequent rolling. Such breakage poses risks of personnel injury, unplanned mill downtime, and scrap steel losses. Consequently, the accurate and automated detection of defective cup rupture outcomes becomes particularly critical. Currently, domestic manufacturers primarily rely on manual visual inspection for quality assessment of cup rupture results. This approach is inherently limited by its discontinuous nature and susceptibility to human factors. The complex and variable temperature and environmental conditions during welding make sustained, uninterrupted manual monitoring practically unfeasible, while prolonged inspection tasks inevitably lead to operator fatigue. Consequently, manual inspection is prone to high false positive rates, lacks consistency and standardization in results, and struggles to meet the stringent cycle time requirements of modern high-speed production lines.
With advancing industrial automation, machine vision technology offers a novel pathway for industrial inspection [4,5], while deep learning-based defect detection achieves superior performance. Detection algorithms are classified into single-stage and two-stage methods based on training methodology [6]. Representative single-stage algorithms include SSD and the YOLO series, whereas two-stage algorithms encompass R-CNN and Faster-RCNN [7]. Although two-stage algorithms significantly enhance detection accuracy, they exhibit slower inference speeds [8]. In contrast, YOLO-based single-stage algorithms demonstrate high localization accuracy and rapid detection [9,10,11,12,13]. While global research on cup rupture detection for strip steel welds remains scarce, studies on other materials have achieved considerable depth. Li et al. [14] proposed LiteYOLO-ID, an ECA-GhostNet-C2f backbone for insulator defect detection on Jetson TX2 NX, achieving 20.2 FPS and 1% mAP@0.5 gain, but its ECA-GhostNet-C2f backbone remains complex and training speed is too slow. Kong et al. [15] used semantic and noise maps for face forgery detection, pioneering dual-map detection, but their semantic and noise fusion lacks explicit lightweight design and cannot reach millisecond-level inference on edge devices.
In practical industrial scenarios, achieving automated detection of weld cup rupture results demands not only high precision but also low parameter counts and real-time performance. Consequently, it is particularly critical to employ a deep learning algorithm that offers high accuracy, compact size, and fast detection speed for deployment on embedded devices. The standard YOLOv10 model, due to its larger size, delivers suboptimal real-time performance for cup rupture detection when deployed on embedded platforms. To address this, this paper proposes an improved YOLOv10-based model. It maintains high detection accuracy while achieving lightweighting, enabling efficient deployment on embedded platforms. This approach conserves edge computing resources and fulfills the requirements for real-time inspection.
2. Materials and Methods
2.1. Overall Structure
The YOLOv10 algorithm treats object detection as a regression problem. It takes an entire image as input, divides it into an N × N grid, and performs object classification and localization for each grid cell to obtain class probabilities and bounding box coordinates [16]. This approach significantly enhances detection speed and has been widely adopted and refined across various domains [17,18,19,20,21]. The YOLOv10 architecture comprises four components: Input, Backbone, Neck, and Detect.
YOLOv10 offers five pre-trained models (n, s, m, l, x) with progressively increasing depth, width, and complexity. Model size expands from small to large, accompanied by sequential growth in parameters and computational load. This study selects the most lightweight and balanced YOLOv10n model to achieve optimal accuracy-speed equilibrium for weld cup rupture detection.
The proposed method completes online cup rupture detection in strip steel welds using a YOLOv10n-based framework, with the overall structure depicted in Figure 1. The input stage processes 640 × 640 pixel cup rupture images through normalization, adaptive resizing, and data augmentation. Within the backbone network, ShuffleNetV2 performs feature extraction to reduce parameters and computations. An ECA attention mechanism is incorporated at the backbone terminus to enhance recognition and extraction of cup rupture crack features. The neck section employs a Slim-Neck design, utilizing a lightweight GSConv module combined with VoV-GSCSP for feature enhancement. Finally, the detection head outputs three multi-scale prediction maps to generate final detection results.
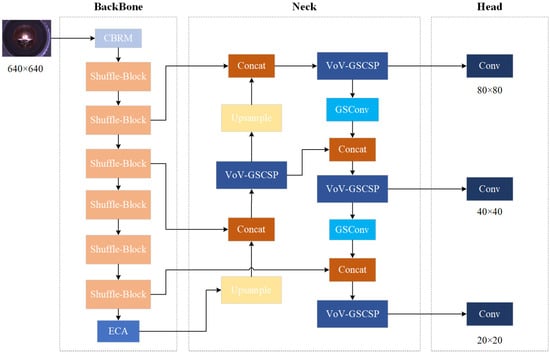
Figure 1.
Overall structure of the algorithm.
2.2. Model Lightweighting
This study selects the ShuffleNetV2 lightweight model to replace the YOLOv10n backbone network in the feature extraction layer. The core concept of ShuffleNetV2 involves channel split and channel shuffle operations [22]. These mechanisms reduce model parameters while enhancing information exchange between different channel groups, effectively balancing detection speed and accuracy.
Figure 2 details two structural configurations of the ShuffleNetV2 module. When stride = 1, channel splitting divides the input feature map uniformly along the channel dimension. The expression is given as, where C denotes the number of channels of the feature map, H denotes the vertical dimension of the feature map, and W denotes the horizontal dimension of the feature map:

Figure 2.
ShuffleNetV2 module structure.
The left branch X1 performs identity mapping to preserve original cup rupture texture features and capture crack path continuity. The right branch X2 undergoes a Depthwise Separable Convolution chain with directionally enhanced kernels to strengthen crack edge features:
Outputs from both branches are concatenated along the channel dimension, enabling deep fusion of crack path and edge features while promoting cross-channel information exchange:
When stride = 2, spatial resolution reduction and down-sampling address field-of-view limitations in microcrack detection. Depthwise Separable Convolutions on both branches capture overall crack direction while focusing on crack tip features. Output concatenation followed by channel shuffle yields final results. These two units collectively form the ShuffleNetV2 lightweight backbone, optimizing computational efficiency and feature representation capability.
2.3. Efficient Channel Attention Mechanism
Strip steel surfaces frequently exhibit scratches, oxidation spots, oil stains, and other interferences. Cup rupture cracks may present small dimensions, particularly in high-resolution images, complicating small target detection. To enhance detection accuracy, an Efficient Channel Attention mechanism is introduced. This mechanism adaptively weights channel dimensions, significantly improving sensitivity to micro-cracks and background interference resistance while maintaining lightweight characteristics. Compared to conventional attention mechanisms, ECA demonstrates higher efficiency by directly modeling cross-channel interactions through one-dimensional convolution, reducing computational overhead [23,24].
The ECA module comprises three components: Global Average Pooling, one-dimensional convolution, and Sigmoid activation [25], with its structure depicted in Figure 3. During Global Average Pooling, spatial features are compressed into channel-level statistics, amplifying low-contrast crack features, where X denotes the feature map, C is the number of channels, H × W is the spatial dimensions, z is the channel descriptor, and each element zc denotes the globally averaged response of the c-th channel:

Figure 3.
Structure of ECA mechanism.
Through one-dimensional convolution, each channel interacts with K adjacent channels, strengthening correlations between micro-crack channels and neighboring channels. This generates preliminary channel attention weights while minimizing information loss from dimensionality reduction:
where k represents the convolution kernel size, adaptively determined. The notation | · |odd denotes taking the nearest odd integer, maintaining a nonlinear relationship with channel count C:
Finally, the Sigmoid activation function maps the one-dimensional convolution output to [0, 1], generating per-channel weights. These weights multiply corresponding input feature maps to produce recalibrated output features, enhancing channels sensitive to micro-cracks, where s is the one-dimensional convolution output, the normalized channel attention weights, and ⊗ denotes channel-wise multiplication:
2.4. Slim-Neck Design
Standard Convolution (SC) extracts rich image features but incurs high computational costs due to hardware dependency. Although Depthwise Separable Convolution (DSC) significantly reduces computation, it often causes channel separation in feature maps, degrading detection accuracy. Consequently, the lightweight GSConv module proposed by Li et al. integrates SC and DSC to process redundant features while fully extracting target characteristics with reduced parameters, enabling efficient feature extraction [26]. Its structure is shown in Figure 4.

Figure 4.
GSConv network structure.
The GSConv module is deployed exclusively in the neck section to prevent data flow blockage caused by deep backbone layers. The core design of GSConv leverages feature fusion and channel shuffle mechanisms to approximate the representational capability of Standard Convolution while significantly reducing computational costs [27]. The GSConv execution flow comprises three sequential phases: standard convolutional dimensionality reduction, Depthwise Separable Convolution processing, and channel shuffle fusion [28]. Specifically, standard convolution first compresses the input feature map’s channel count M to half the target dimension, focusing on the weld cup rupture region while reducing redundant information. The standard convolution output then undergoes Depthwise Convolution followed by pointwise convolution to enhance cup rupture crack gradient features. Subsequently, outputs from standard convolution and Depthwise Separable Convolution are concatenated and channel-shuffled, enabling interaction between crack features and cup rupture geometric characteristics. This approach permeates SC-generated feature maps into each DSC-produced feature map, maintaining inter-channel connectivity to strengthen feature fusion. The parametric relationship is expressed as, where Psc denotes SC parameter count, Pgsc GSConv parameter count, DW × DH input feature map dimensions, and DK convolution kernel size:
Equation (10) demonstrates GSConv’s parameter ratio relative to SC. Deploying GSConv in feature enhancement modules reduces model complexity, accelerates cup rupture inference, and maintains crack sensitivity.
Building upon the GSConv module, Li et al. proposed the Slim-Neck design paradigm incorporating the VoV-GSCSP module to enhance detector computational cost-effectiveness. The VoV-GSCSP module constitutes a lightweight feature fusion framework based on GSConv, optimizing multi-scale feature interaction capabilities while significantly reducing computational complexity [29,30]. Its structure is illustrated in Figure 5. The core concept involves splitting input feature maps equally along the channel dimension. After one standard convolution operation, Branch 1 directly propagates features to preserve cup rupture edge geometric integrity. Branch 2 undergoes multi-stage GSConv processing to extract localized crack textures. Finally, concatenation establishes spatial correlations between cup rupture edges and crack textures to generate output features.
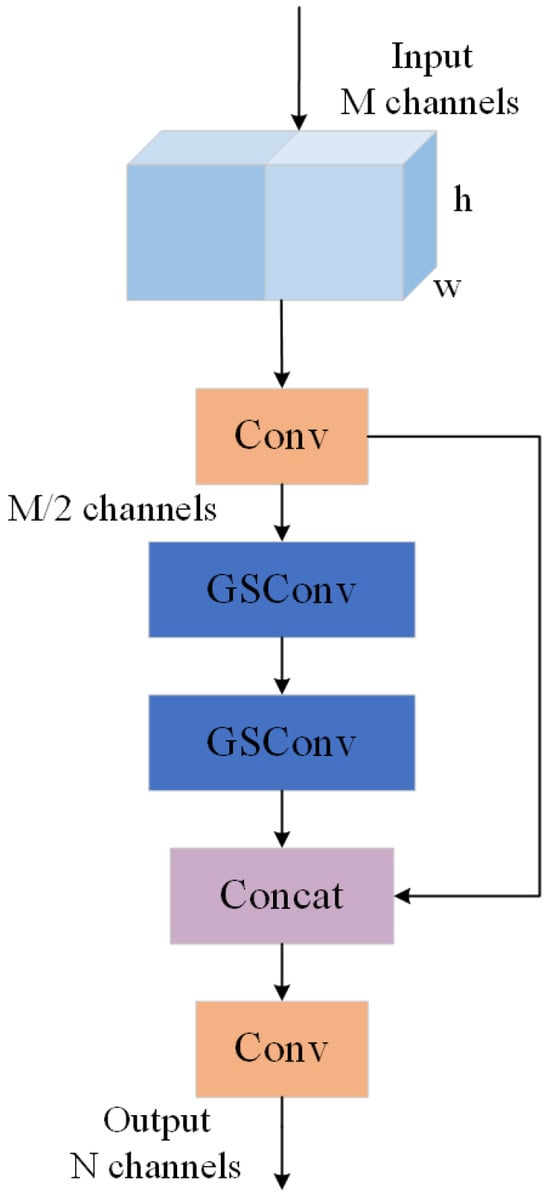
Figure 5.
Structure of VoV-GSCSP module.
Replacing conventional CSP modules with VoV-GSCSP in the neck section reduces parameters and computations while addressing limitations of traditional CSP modules in high-resolution image processing. These limitations include excessive parameters, computational redundancy, and inadequate capture of cup rupture crack details due to fixed convolutional kernels. The VoV-GSCSP module enhances micro-crack detection through multi-scale feature fusion.
This study strategically deploys GSConv and VoV-GSCSP modules within the YOLOv10n neck to achieve lightweight design. The dual reduction in parameters and computations enables real-time edge device deployment. Multi-scale feature fusion significantly improves weld cup rupture detection accuracy while reducing missed and false detections.
2.5. Training and Embedded Platform
Model training was conducted on an 8-core Intel Xeon Gold 6430 processor and NVIDIA GeForce RTX 4090 GPU platform running Linux OS. The deep learning framework was deployed under Ubuntu 22.04 with CUDA 11.8, PyTorch 2.1.2, and Python 3.10.
Model validation and migration deployment were performed on an NVIDIA Jetson Orin Nano equipped with a 128-core Maxwell GPU, a 6-core ARM CPU, and 4 GB of 64-bit LPDDR5 memory. The system runs ARM Ubuntu 22.04 LTS, and the runtime environment comprises JetPack 5.1.2, Python 3.10, PyTorch 2.1.2, CUDA 11.8, and cuDNN 8.6. The embedded platform test setup is shown in Figure 6.
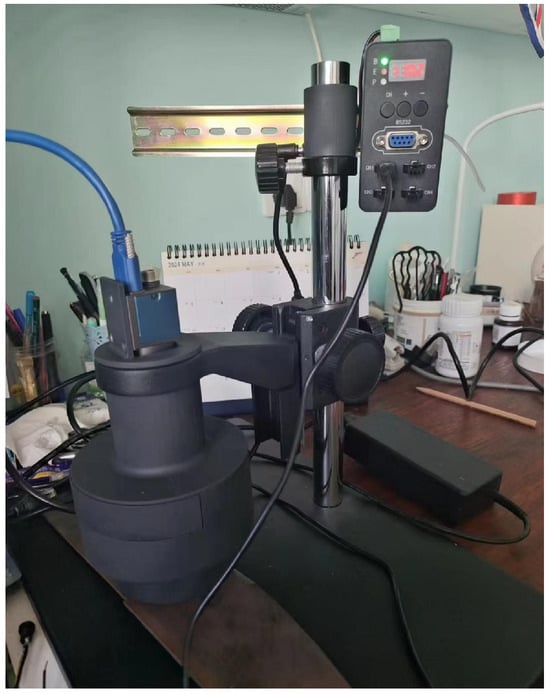
Figure 6.
Test setup of the embedded platform.
2.6. Evaluation Metrics
This study employs the following metrics to assess weld cup rupture detection model performance: Precision (P), Recall (R), mean Average Precision (mAP), Parameters (Params), Floating point operations (FLOPs), model size (Size), and real-time frame rate (FPS). Precision denotes the proportion of correctly predicted samples to total predicted samples. Recall represents the ratio of correctly predicted positive samples to actual positive samples. Mean Average Precision provides a macro-level evaluation of image recognition performance across convolutional neural network models. Floating point operations measure computational complexity, while real-time FPS characterizes detection speed.
3. Results
3.1. Dataset
The weld cup rupture dataset was collected from actual production sites, comprising 1000 samples that underwent cup rupture testing. Sample images are shown in Figure 7.

Figure 7.
Weld cup rupture test samples.
As shown in Figure 8, samples without cracks at the weld after cup rupture testing were categorized as qualified (825 samples), while those with cracks at the weld were classified as unqualified (175 samples). On-site quality inspection only classifies products as “Qualified” or “Unqualified” without detailed sub-labels. The dataset contains only binary labels (Accepted_product = 0, Defective_unit = 1) and lacks annotations for attributes like crack length or width. These labels correspond one-to-one with the PLC triggering logic (Products labeled Accepted_product are passed, while those labeled Defective_unit are scrapped). Therefore, a binary classification method is adopted. The dataset was annotated using the LabelImg tool, with two defined classes: Accepted_product and Defective_unit.

Figure 8.
Label distribution in the on-site dataset (binary only).
Due to scarcity of unqualified samples and significant class imbalance, direct training would bias model accuracy toward the majority class proportion. To address data scarcity and imbalance, augmentation techniques were applied. Both qualified and unqualified samples underwent cropping, shifting, mirroring, rotation, brightness/contrast adjustment, Gaussian noise, and salt-and-pepper noise injection. The augmented dataset totals 6000 samples with balanced distribution: 3000 qualified and 3000 unqualified samples. This enhanced dataset was randomly partitioned into training, validation, and test sets at a 7:2:1 ratio. All augmentations (crop, shift, mirror, rotate, brightness/contrast, Gaussian and salt-and-pepper noise) were applied after the 7:2:1 train/val/test split, ensuring no augmented copies cross sets.
3.2. Model Training Results and Analysis
During network training, an SGD optimizer updated network weights, with input images resized to 640 × 640 pixels. The initial learning rate was set to 0.01, batch size to 32, and training epochs to 100.
Training parameter metrics are shown in Figure 9. Precision and recall rates increased with additional epochs, exhibiting the steepest ascent during the initial 20 epochs. Upon reaching 100 epochs, both curves stabilized at 98.8% and 99.2%, respectively. The mAP50 curve similarly rose with training progression, achieving a final weld cup rupture detection mean average precision of 99.5%. These training trends demonstrate the improved model’s effectiveness and high recognition capability.
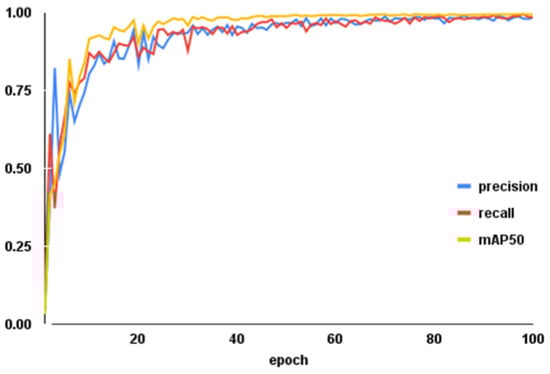
Figure 9.
Training parameter metric trends.
3.3. Lightweight Backbone Network Comparison
Using YOLOv10n as the baseline framework, this study compares ShuffleNetV2 against four lightweight alternatives: CSPDarkNet53, GhostNet, MobileNetV3, and MobileNetV4.
Experimental results in Table 1 demonstrate that the original CSPDarkNet53 backbone achieves 99.3% mAP. While GhostNet improves mAP by 0.1% and reduces FLOPs by 24%, it significantly increases parameters and model size while slowing inference. MobileNetV3 and MobileNetV4 maintain comparable mAP to the baseline, but MobileNetV4 exhibits increased parameters and size.

Table 1.
Lightweight backbone network comparison.
Although ShuffleNetV2 shows a 0.1% mAP decrease compared to MobileNetV3, it substantially reduces parameters, FLOPs, and model size. Crucially, ShuffleNetV2 achieves a 56% inference speed improvement over MobileNetV3.
3.4. Attention Mechanism Comparison
Different attention mechanisms were applied at the backbone network terminus of the lightweight model to evaluate their impact on detection performance, as shown in Table 2.
Table 2.
Attention mechanism comparison.
Table 2 demonstrates that the ECA-enhanced model achieves optimal detection accuracy and speed compared to SE, CBAM, and CA modules. All four mechanisms maintain similar parameters, computations, and model size. However, SE and CBAM exhibit lower mean average precision and slower detection speeds. When comparing CA and ECA specifically, ECA shows 0.4% higher precision, 0.2% higher mAP, and faster detection.
3.5. Ablation Experiment
To validate the effectiveness of each module, ablation experiments were conducted on the YOLOv10n architecture using ShuffleNetV2 as backbone. Results are presented in Table 3.
Table 3.
Ablation study results.
Table 3 shows that replacing the backbone with ShuffleNetV2 reduces mAP by 0.2% but decreases parameters by 40%, FLOPs by 37%, model size by 39%, and increases FPS by 66%. Adding ECA attention compensates the accuracy loss, improving mAP by 0.3% without affecting other metrics. The Slim-Neck design further reduces parameters by 4%, FLOPs by 10%, size by 3%, and boosts FPS by 6%, with an additional 0.1% mAP gain. Compared to the baseline network, the optimized model exhibits a reduction of 44% in parameters, 46% in GFLOPs, and 42% in model size. Meanwhile, it achieves a 72% increase in FPS and a 0.2-percentage-point improvement in mean average precision. The resulting model occupies only 3.24 MB of storage space.
To verify practical performance, two test images were randomly selected for comparison between the original and improved algorithms, as shown in Figure 10.
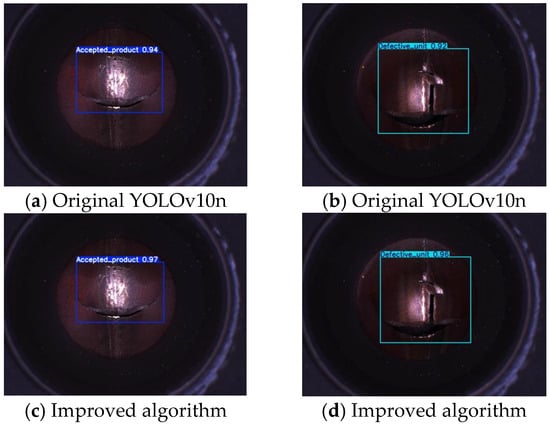
Figure 10.
Detection result comparison.
As shown in Figure 10, the improved model increases the confidence score for Accepted_product from 0.94 to 0.97 and for Defective_unit from 0.92 to 0.96, while the overall detection accuracy (mAP@0.5) is improved by 0.2 percentage points compared to the original YOLOv10n. These results confirm that the proposed scheme significantly enhances detection confidence while maintaining model lightweightness. The original model exhibited limitations in capturing edge details and associating multi-scale features, leading to an overall miss rate of 0.2 percentage points. Through enhanced edge detail capture and multi-scale feature reinforcement, the improved model effectively reduces missed detections in both Accepted_product and Defective_unit categories. The 0.2-percentage-point gain validates the necessity of the proposed improvements.
3.6. Model Stability
To ensure result reproducibility and evaluate model stability, a 5-fold cross-validation method with fixed random seeds was employed. The entire dataset was randomly shuffled and then partitioned into five folds using seeds 42–46. In each iteration, four folds were used for training and one fold for validation, with training conducted from scratch each time. Performance metrics were recorded across all five validation runs.
As shown in Table 4, the model achieves a mAP@0.5 of 99.5%, 0.2 percentage points with a standard deviation of 0.1% under 5-fold cross-validation, p < 0.05. Variations in both precision and recall are within 0.1%, and the inference speed remains stable at 853.6 ± 1.0 FPS. The number of parameters, computational load, and model size remain unchanged across all folds. Statistically significant, these results confirm that the model maintains high accuracy, strong consistency, and real-time performance under different data partitions, thereby meeting the stability requirements for industrial online inspection.
Table 4.
Stability Results of 5-Fold Cross-Validation (Random Seeds 42–46).
3.7. Comprehensive Comparative Experiment with Different Detection Models
To further evaluate the performance of the improved model among comparable methods, it was tested alongside SSD, Faster R-CNN, YOLOv5n, YOLOv8n, YOLOv10s, and YOLOv10n on an embedded platform. The comparative results are presented in Table 5.
Table 5.
Comprehensive Comparison Results of Different Models.
As shown in Table 5, the proposed model achieves a mean average precision (mAP) of 99.5%, representing a 0.2-percentage-point improvement over YOLOv10n. Compared to SSD, Faster R-CNN, YOLOv5n, YOLOv8n, and YOLOv10s, it increases mAP by 0.3, 0.2, 0.3, 0.2, and 0.1 percentage points, respectively. Among the seven models evaluated, the improved model attains the highest mAP, demonstrating its strong capability in correctly identifying cup rupture instances and effectively reducing the false detection rate during inspection.
With a compact size of only 3.24 MB, the proposed model is approximately 1/33, 1/174, and 1/2 the size of SSD, Faster R-CNN, and YOLOv10n, respectively. In terms of real-time detection speed, the improved model outperforms all six other models on both desktop and embedded platforms. It achieves a desktop real-time FPS of 854 and an embedded real-time FPS of 122, which is about 2.5, 11, and 1.8 times faster than SSD, Faster R-CNN, and YOLOv10n, respectively. 122 FPS includes pre/post-processing, single image, no batching, Jetson Orin Nano, 5 min continuous test. Moreover, it reduces computational load (in GFLOPs) by 93%, 98.8%, 38%, 45.7%, 82%, and 46.3% compared to SSD, Faster R-CNN, YOLOv5n, YOLOv8n, YOLOv10s, and YOLOv10n.
In summary, the improved lightweight network exhibits excellent test performance and offers superior real-time capability when deployed on edge devices.
To validate the performance of different models for cup rupture detection under actual industrial production conditions, tests were conducted using cup rupture images with varying lighting conditions, oil stains, and image blurring. Figure 11 illustrates the detection results of YOLOv10n and the improved model on an embedded platform.
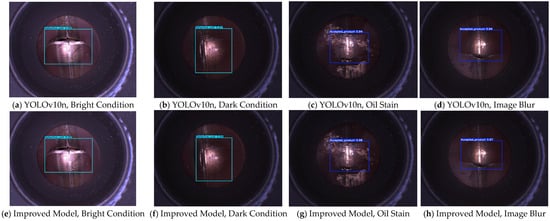
Figure 11.
Comparison of Detection Performance Between the Two Models.
As shown in Figure 11, the improved model achieves higher mean average precision (mAP) than the original model across all challenging scenarios commonly encountered in industrial practice. This demonstrates the superior detection capability of the optimized model. In summary, the experimental results indicate that the improved model enhances detection performance under real-world industrial disturbances, exhibiting stronger robustness and better generalization ability.
4. Discussion
For the task of strip steel weld cup rupture detection, this study proposes a lightweight improved framework based on the YOLO architecture. Using YOLOv10n as the baseline model, the backbone network is replaced with ShuffleNetV2 to achieve network lightweighting and inference acceleration. The ECA attention mechanism is introduced to enhance feature sensitivity to micro-cracks in cup rupture regions. Simultaneously, a Slim-Neck structure constructed with GSConv and VoV-GSCSP modules is adopted to strengthen the correlation of multi-scale feature maps while maintaining a lightweight design, thereby improving the model’s feature representation capability.
Notably, this research is the first to apply the combined scheme of ShuffleNetV2, the ECA attention mechanism, and the Slim-Neck structure to the scenario of online strip steel weld cup rupture detection. This framework achieves significant lightweighting without sacrificing detection performance: compared to the original YOLOv10n, the improved model reduces the parameter count, computational load, and model size by 44%, 46%, and 42%, respectively, while maintaining high precision, recall, and mAP@0.5 at 98.8%, 99.2%, and 99.5% (mAP@0.5 improved by 0.2 percentage points). On the computing device, it achieves a detection frame rate of 854 FPS (a 72% increase over the original model), and on embedded devices, it attains a millisecond-level detection speed of 122 FPS (a 77% increase).
These results preliminarily validate the feasibility of online inspection for “cup rupture micro-cracks with millisecond-level inference”, addressing the technical gap in the field of online strip steel quality inspection, where “high-precision identification of micro-defects” and “millisecond-level real-time detection” are difficult to achieve simultaneously. From a conceptual perspective, this also confirms for the first time the effectiveness of the technical path from “lightweight module combination to millisecond-level industrial quality inspection on the edge”. Through customized modular collaborative design, a three-way balance of “44% parameter compression, slight performance improvement, and 77% acceleration in edge deployment” is achieved, providing a reusable architectural design reference for similar online detection tasks involving micro-defects. The dataset contains 1000 original images from a single production line; validation on different lines, lighting, or camera setups was not performed and will be reported in an extended study.
5. Conclusions
The cup rupture detection results indicate that the improved model achieves a precision of 98.8%, a recall of 99.2%, and a mean average precision (mAP) of 99.5% in identifying cup rupture outcomes. Compared to the original YOLOv10n model, the mAP is improved by 0.2 percentage points, while the parameters, computational load, and model size are reduced by 44%, 46%, and 42%, respectively. The average real-time frame rates on desktop and embedded platforms reach 854 FPS and 122 FPS, representing speed improvements of 72% and 77% over the original model. In terms of detection performance, the improved model outperforms YOLOv10n, demonstrating that the proposed algorithm offers the best overall capability, along with strong robustness and generalization ability.
In summary, the improved model reduces the operational memory footprint on embedded devices while maintaining a balance between accuracy and real-time performance. It meets the dual requirements of precision and speed for weld cup rupture detection in industrial settings, thereby providing both technical and theoretical support for industrial weld cup rupture detection systems.
Author Contributions
Conceptualization, Y.Q. and S.Z.; Data curation, S.Z.; Formal analysis, Y.Q.; Funding acquisition, Y.Q.; Investigation, Y.Q.; Methodology, Y.Q. and S.Z.; Project administration, S.Z.; Resources, Y.Q.; Supervision, Y.Q.; Validation, S.Z.; Visualization, S.Z.; Writing—original draft, S.Z.; Writing—review and editing, S.Z. All authors have read and agreed to the published version of the manuscript.
Funding
This research received no external funding.
Data Availability Statement
Data are contained within the article; The code is confidential.
Conflicts of Interest
The authors declare no conflicts of interest.
References
- Gao, W.; Mu, X.Y.; Tang, N. A new algorithm for detecting air holes in steel pipe welding based on image processing. Microcomput. Inf. 2010, 26, 33–35. [Google Scholar] [CrossRef]
- Hong, Y.; An, W.; Jiang, H.J. Welding Quality Inspection for Explosion-proof Sheet of Lithium Battery Based on Pulsed Infrared Thermography. Infrared Technol. 2023, 45, 1052–1058. [Google Scholar]
- Qian, S.J.; Huang, H.D.; Shen, C.Y. Research on plug-in fillet weld flaw detecting by using flexible phased array technique. J. Mech. Strength 2022, 44, 813–818. [Google Scholar]
- Song, G.Q.; Wu, Y.M.; Feng, Y.P. Application of Machine Vision in Optical Manufacturing and Testing. Imaging Sci. Photochem. 2016, 34, 30–35. [Google Scholar]
- Liu, Z.W.; Wei, H.L.; Lu, C.F. Research Progress of Machine Vision Technology in Injection Molding Processing. China Plast. Ind. 2021, 49, 5–8. [Google Scholar]
- Pironti, P.; Ambrosanio, A.; Vismara, V.; Viganò, M.; Bucci, E.; Sirtori, P.; Peretti, G.M.; Mangiavini, L. One-stage vs. two-stage bilateral THA in Lombardy: A cost-effectiveness analysis. Cost Eff. Resour. Alloc. 2023, 21, 3. [Google Scholar] [CrossRef]
- Shilpa, R.; Deepika, G.; Sandeep, K. Object detection and recognition using contour based edge detection and fast R-CNN. Multimed. Tools Appl. 2022, 81, 42183–42207. [Google Scholar]
- Hu, Z.H.; Ruan, K.; Yu, W.H. Enhanced edge convolution-based spatial-temporal network for network traffic prediction. Appl. Intell. 2023, 53, 22031–22043. [Google Scholar] [CrossRef]
- Zhou, Q.H.; Zhang, D.Y.; Liu, H.S. KCS-YOLO: An Improved Algorithm for Traffic Light Detection under Low Visibility Conditions. Machines 2024, 12, 557. [Google Scholar] [CrossRef]
- Jorge, V.L.; Bendaoud, I.; Soulié, F. Deep learning-based YOLO for semantic segmentation and classification of weld pool thermal images. Int. J. Adv. Manuf. Technol. 2025, 137, 3573–3585. [Google Scholar] [CrossRef]
- Gu, M.; Li, X.; Hu, S.; Mi, Z.; Shen, S. YOLO-FGA: A lightweight yet high-precision network for fine-grained anomaly detection in computer chassis assembly. Int. J. Adv. Manuf. Technol. 2025. [Google Scholar] [CrossRef]
- Du, F.J.; Jiao, S.J. Improvement of Lightweight Convolutional Neural Network Model Based on YOLO Algorithm and Its Research in Pavement Defect Detection. Sensors 2022, 22, 3537. [Google Scholar] [CrossRef] [PubMed]
- Qiu, X.Y.; Chen, Y.J.; Cai, W.H. LD-YOLOv10: A Lightweight Target Detection Algorithm for Drone Scenarios Based on YOLOv10. Electronics 2024, 13, 3269. [Google Scholar] [CrossRef]
- Li, D.H.; Lu, Y.; Gao, Q. LiteYOLO-ID: A Lightweight Object Detection Network for Insulator Defect Detection. IEEE Trans. Instrum. Meas. 2024, 73, 5023812. [Google Scholar] [CrossRef]
- Kong, C.Q.; Chen, B.L.; Li, H.L. Detect and Locate: Exposing Face Manipulation by Semantic- and Noise-Level Telltales. IEEE Trans. Inf. Forensics Secur. 2022, 17, 1741–1756. [Google Scholar] [CrossRef]
- Redmon, J.; Divvala, S.; Girshick, R. You only look once: Unified, real-time object detection. In Proceedings of the IEEE Conference on Computer Vision and Pattern Recognition, Las Vegas, NV, USA, 26 June–1 July 2016; pp. 779–788. [Google Scholar]
- Redmon, J.; Farhadi, A. YOLO9000: Better, faster, stronger. In Proceedings of the IEEE Conference on Computer Vision and Pattern Recognition, Honolulu, HI, USA, 21–26 July 2017; pp. 7263–7271. [Google Scholar]
- Xie, H.; Zhou, H.; Chen, R.; Wang, B. SDMS-YOLOv10: Improved Yolov10-based algorithm for identifying steel surface flaws. Nondestruct. Test. Eval. 2025. [Google Scholar] [CrossRef]
- Li, A.; Wang, C.R.; Ji, T.T.; Wang, Q.Y.; Zhang, T.X. D3-YOLOv10: Improved YOLOv10-Based Lightweight Tomato Detection Algorithm Under Facility Scenario. Agriculture 2024, 14, 2268. [Google Scholar] [CrossRef]
- Hu, Z.L.; Cheng, L.; Han, J.Q. Underwater Target Detection with High Accuracy and Speed Based on YOLOv10. J. Mar. Sci. Eng. 2025, 13, 135. [Google Scholar] [CrossRef]
- Hu, H.Y.; Tong, J.W.; Wang, H.B. EAD-YOLOv10: Lightweight Steel Surface Defect Detection Algorithm Research Based on YOLOv10 Improvement. IEEE Access 2025, 13, 55382–55397. [Google Scholar] [CrossRef]
- Ma, N.N.; Zhang, X.Y.; Zheng, H.T. ShuffleNet V2: Practical Guidelines for Efficient CNN Architecture Design. In Proceedings of the 15th European Conference on Computer Vision—ECCV 2018, Munich, Germany, 8–14 September 2018; Springer: Berlin/Heidelberg, Germany, 2018; pp. 122–138. [Google Scholar]
- Wang, Q.L.; Wu, B.G.; Zhu, P.F. ECA-Net: Efficient Channel Attention for Deep Convolutional Neural Networks. In Proceedings of the 2020 IEEE/CVF Conference on Computer Vision and Pattern Recognition, CVPR 2020, Seattle, WA, USA, 13–19 June 2020; pp. 11534–11542. [Google Scholar]
- Wu, J.; Dong, J.; Nie, W.Y. A Lightweight YOLOv5 Optimization of Coordinate Attention. Appl. Sci. 2023, 13, 1746. [Google Scholar] [CrossRef]
- Lou, H.; Duan, X.; Guo, J. DC-YOLOv8: Small-Size Object Detection Algorithm Based on Camera Sensor. Electronics 2023, 12, 2323. [Google Scholar] [CrossRef]
- Li, H.; Li, J.; Wei, H.; Liu, Z.; Zhan, Z.; Ren, Q. Slim-neck by GSConv: A Better Design Paradigm of Detector Architectures for autonomous vehicles. arXiv 2023, arXiv:2206.02424. [Google Scholar]
- Li, H.L.; Li, J.; Wei, H.B.; Liu, Z.; Zhan, Z.; Ren, Q. Slim-neck by GSConv: A lightweight-design for real-time detector architectures. J. Real-Time Image Process. 2024, 21, 62. [Google Scholar] [CrossRef]
- Cai, C.Y.; Nie, J.L.; Tong, J. An Enhanced Single-Stage Neural Network for Object Detection in Transmission Line Inspection. Electronics 2024, 13, 2080. [Google Scholar] [CrossRef]
- Miao, X.F.; Liu, B.L.; Li, X.Q. Improved YOLOV5s Railway Crack Target Detection Algorithm. Comput. Eng. Appl. 2024, 60, 216–224. [Google Scholar]
- Liu, L.J.; Zhang, Y.; Karimi, H.R. Resilient machine learning for steel surface defect detection based on lightweight convolution. Int. J. Adv. Manuf. Technol. 2024, 134, 4639–4650. [Google Scholar] [CrossRef]


Disclaimer/Publisher’s Note: The statements, opinions and data contained in all publications are solely those of the individual author(s) and contributor(s) and not of MDPI and/or the editor(s). MDPI and/or the editor(s) disclaim responsibility for any injury to people or property resulting from any ideas, methods, instructions or products referred to in the content. |
© 2025 by the authors. Licensee MDPI, Basel, Switzerland. This article is an open access article distributed under the terms and conditions of the Creative Commons Attribution (CC BY) license.