Abstract
Accurately predicting machining-induced deformation is crucial for high-precision CNC turning, particularly when working with dissimilar metallic alloys. This study presents a novel, data-driven framework that integrates empirical deformation analysis, multivariate regression, and principal component analysis (PCA) to predict axial deformation as a function of intrinsic material properties, including Brinell hardness, thermal conductivity, and Young’s modulus. The approach begins with second-order polynomial modeling of experimentally observed force–deformation behavior, from which three physically interpretable coefficients, nonlinear (a), load-sensitive (b), and intercept (c), are extracted. Each coefficient is then modeled using log-linear power-law regression, revealing strong statistical relationships with material properties. Specifically, the nonlinear coefficient correlates predominantly with thermal conductivity, while both the linear and offset terms are governed mainly by hardness, with average R2 values exceeding 0.999 across all materials. To improve physical insight and reduce dimensionality, three non-dimensional ratios (H/E, k/E, H/k) are also introduced, enhancing correlation and interpretability. PCA further confirms that over 93% of the total variance in deformation behavior can be captured using just two principal components, with clear separation of materials based on thermomechanical signature and deformation coefficients. This is the first comprehensive study to unify empirical modeling, property-driven regression, and PCA for deformation prediction in CNC-machined alloys. The resulting framework offers a scalable, interpretable, and physically grounded alternative to black-box models, providing rapid screening of new materials, reduced experimental demand, and support for smart manufacturing applications, such as digital twins and material-informed process optimization.
1. Introduction
The shift toward smart and adaptive manufacturing systems represents a significant change in how machining processes are modeled, controlled, and optimized [1,2]. In this context, predictive modeling of deformation caused by machining is becoming essential to ensure dimensional accuracy, tool stability, and quality in CNC turning [3,4]. While surface roughness and chip formation have been widely studied, deformation remains underexplored, often being treated as a secondary effect and mitigated reactively during process tuning [5,6].
Traditional deformation models rely heavily on case-specific experimental fitting, limiting their transferability across different materials and operating conditions. This reliance on empirical data slows down flexible process planning and material replacement, particularly in environments with high product variety and low production volumes [7,8]. Most current models use force–displacement relationships that are disconnected from the fundamental physics of material behavior, making them less adaptable to new alloys or varying operating conditions [9].
Recent advances in data-driven machining and digital twin technology underscore the importance of developing frameworks that extend beyond empirical methods to directly link deformation behavior with material properties [10,11]. Past research has used various empirical and computational techniques to model machining-induced deformation. Finite element simulations, for example, can track stress–strain patterns and temperature distributions but often need extensive calibration and are not easily transferable across different materials [12,13,14]. Artificial intelligence approaches, such as artificial neural networks (ANNs) and support vector regression (SVR), have been applied to approximate deformation based on machining parameters [15,16]; however, these methods typically operate as black-box models without clear physical explanations. Some studies have linked deformation to specific properties, such as hardness or thermal conductivity [17,18], yet they often overlook the complex, multivariate relationships involving stiffness, plasticity, and heat transfer. Furthermore, few existing frameworks incorporate dimensional analysis or undergo validation across multiple materials. Consequently, current models often fail to accurately predict deformation for unfamiliar alloys or under new operational conditions. These challenges emphasize the need for a physically grounded, multivariate modeling approach that captures the fundamental thermomechanical mechanisms of deformation.
To fill this gap, a new modeling approach is introduced that views deformation not as an accidental byproduct but as a predictable response governed by the material. This study posits that key thermomechanical properties, such as Brinell hardness (HB), thermal conductivity (k), and Young’s modulus (E), contain sufficient information to predict how materials deform under turning forces.
To go beyond simple property correlations, this research presents non-dimensional property ratios, H/E, k/E, and H/k, that reflect combined physical balances among strength, stiffness, and heat dissipation. These ratios provide a more precise and more universal method for evaluating deformation patterns, illustrating how properties interact to influence strain and thermal control during cutting. They are particularly effective at differentiating alloys with similar baseline properties but different machining behaviors, such as distinguishing between Aluminum and Stainless Steel or Brass and Bronze.
Furthermore, this work goes beyond traditional regression analysis by incorporating principal component analysis (PCA) into the model. PCA reduces dimensionality while maintaining physical interpretability, showing that deformation behavior in various alloys lies within a limited subspace influenced by key material interactions. This multivariate approach enables deformation prediction, material clustering, and mechanistic understanding, making the model both a predictive tool and a diagnostic resource.
Unlike earlier models, which depend primarily on empirical calibration, this new framework utilizes experimentally obtained polynomial deformation coefficients as intermediate variables. These are then regressed against the intrinsic properties of the material. This two-step approach enables accurate, understandable, and broadly applicable modeling. Combining dimensional analysis, power-law regression, and PCA in a single pipeline marks a notable methodological innovation. This study introduces the first comprehensive deformation modeling framework that combines empirical data with physically informed regression and multivariate learning. Grounded in materials science and enhanced with dimensional and statistical rigor, this model enables materials-aware process planning, rapid assessment of new alloys, and integration with intelligent manufacturing systems in Industry 4.0 and future developments.
2. Materials and Methodological Framework
This section outlines a structured, physics-based modeling framework designed to predict axial deformation in CNC turning using the intrinsic thermomechanical properties of engineering alloys. The methodology is organized into three interconnected stages: (1) experimental measurement of force-induced deformation across a range of cutting conditions; (2) empirical modeling of the deformation response using second-order polynomial fitting to extract material-specific coefficients; and (3) multivariate regression analysis that links these coefficients to material properties through physically interpretable relationships.
This framework builds upon our earlier studies on machining-induced deformation, material stiffness gradients, and empirical behavior mapping in CNC-turned components [19,20,21]. By integrating experimental mechanics with transparent statistical modeling, the method provides generalizable deformation predictions across dissimilar alloys, eliminating the need for material-specific recalibration and supporting intelligent process design.
The following subsection describes the selected materials and their key thermomechanical properties, which form the foundation of the proposed modeling approach.
2.1. Materials Selection and Property Characterization
Five industrially relevant metallic alloys were selected to cover a broad spectrum of thermal and mechanical behaviors encountered in CNC machining: Aluminum Alloy 6061, Brass C26000, Bronze C51000, Carbon Steel 1020 Annealed, and Stainless Steel 304 Annealed (SpecLine Arabia Company Ltd. and Al Mokahal Co., Al-Jubail, Saudi Arabia). The selection reflects a purposeful contrast in machining behavior, from thermally conductive and ductile materials to high-strength, low-diffusivity alloys, ensuring comprehensive coverage of thermomechanical regimes.
Instead of relying on a long list of potentially correlated descriptors, the modeling framework prioritizes three orthogonal, physically interpretable properties. Brinell hardness (HB) reflects a material’s resistance to plastic deformation and strain localization. Thermal conductivity (k) governs heat dissipation and thermal expansion. Young’s modulus (E) captures elastic stiffness under load. Collectively, these three properties span the dominant mechanisms driving machining-induced deformation, offering both physical significance and statistical robustness by minimizing multicollinearity.
For each alloy, Brinell hardness (HB), thermal conductivity (k), and Young’s modulus (E) were obtained from verified datasheets and peer-reviewed sources, as shown in Table 1. These properties define the input layer of the regression framework and serve as interpretable predictors that connect material physics to experimentally observed deformation behavior. Their combined use enables the model to generalize across alloys with contrasting thermomechanical signatures, such as soft, conductive Aluminum versus hard, insulating stainless steel.

Table 1.
Thermomechanical Properties of Selected Metallic Alloys.
The thermophysical and mechanical properties reported in Table 1, including Brinell hardness, thermal conductivity, and Young’s modulus, were obtained from manufacturer and vendor technical datasheets corresponding to the commercial material grades used in this study. For instance, the tested materials’ values were sourced from the SpecLine Arabia Company Ltd. (Al-Jubail, Saudi Arabia) data sheet, which provides data on Carbon Steel, Stainless Steel, and Aluminum alloys. In contrast, Al Mokahal Co. (Al-Jubail, Saudi Arabia) provides data on Bronze and Brass alloys. These values represent standardized nominal properties commonly adopted as baseline inputs in machining and deformation modeling studies, rather than properties measured directly through laboratory testing in the present work. This approach was selected to ensure consistency across materials and to reflect commercially supplied alloy conditions.
With the thermomechanical properties defined for each alloy, the next step involves experimentally measuring the corresponding axial deformation responses under controlled CNC turning conditions, thereby establishing the empirical foundation for the proposed modeling framework.
2.2. Experimental Deformation Measurement
Controlled CNC turning tests were performed to quantify the axial deformation (δ) of each alloy under controlled cutting-force levels. The experimental methodology follows the same validated approach adopted in our earlier studies [19,20,21]; however, all information required to reproduce the deformation measurements is explicitly summarized here to ensure that the present study is fully self-contained.
All experiments were conducted on a CNC lathe using a TiAlN-coated tungsten carbide cutting tool. A single tool geometry was employed throughout the study to eliminate geometric variability. The cutting speed and depth of cut were held constant for all tests, while the feed rate was varied systematically to generate different cutting-force levels. Dry cutting conditions were intentionally used in all experiments to isolate thermally induced deformation effects from lubrication-related influences. The complete set of cutting parameters used in the experiments, including cutting speed, feed rate range, depth of cut, tool geometry, and cutting environment, is explicitly reported in Table 2.
Table 2.
Experimental parameters and deformation measurement specifications used in CNC turning tests.
Cylindrical workpieces were machined in a standard chucking configuration. The workpiece diameter, axial overhang length, and mounting arrangement were kept constant for all tests. Prior to machining, workpiece alignment was verified to minimize runout and unintended bending effects. These geometric and fixturing conditions define the mechanical boundary conditions governing axial deformation during cutting and are fully specified in the present text.
Figure 1 schematically illustrates the experimental arrangement used to acquire synchronized cutting-force and deformation signals during CNC turning on an Eclipse CNC lathe (ECL 400).
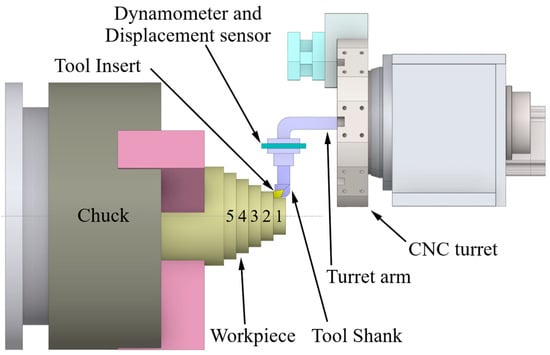
Figure 1.
Schematic of the CNC turning experimental setup for synchronized force–deformation measurements. The workpiece is clamped in a standard chuck with a constant 45 mm overhang segmented into five axial zones (Zones 1–5) for zone-resolved deformation tracking.
Cutting forces were measured using a three-component DKM2010 turning dynamometer (TeLc) mounted inline between the CNC turret and the tool shank, enabling simultaneous measurement of the main cutting, feed (axial), and radial force components (0–2000 N range, 1 N resolution). The three orthogonal force components and the deformation signal were recorded synchronously at a sampling frequency of 2000 Hz. For the deformation–force analysis, the cutting force reported in the manuscript corresponds to the resultant cutting-force magnitude computed from the three measured components; tool entry and exit transients were excluded to obtain steady-state values.
In parallel, machining-induced deformation, δ, was captured using a high-precision inductive displacement transducer rigidly fixed on the turret and oriented along the machine X-direction (radial/cutting-force direction, i.e., normal to the spindle axis) so that the probe measures the relative tool–workpiece deflection under load at a target pad located close to the tool–dynamometer stack to reduce cosine error and mounting compliance. Sensor alignment relative to the tool path was verified prior to testing to minimize cosine and mounting errors. Force and deformation signals were recorded synchronously during each pass, and steady-state values were obtained after excluding tool entry/exit transients.
The workpiece was clamped in a standard chuck with a constant axial overhang (45 mm) segmented into five axial zones (Zones 1–5), allowing zone-resolved deformation tracking along the overhang as indicated in the schematic.
The total axial deformation (δ) was measured along the tool–workpiece axis and represents the combined contribution of elastic strain, plastic displacement, and thermally induced expansion during machining. This unified deformation metric was adopted because isolating elastic, plastic, and thermal components independently under dynamic cutting conditions is experimentally nontrivial. Accordingly, the measured δ-F relationship serves as an aggregate indicator of material stiffness, yielding behavior, and heat dissipation.
For each material, multiple turning tests were conducted across a range of cutting-force levels. Each test condition was independently repeated at least three times to assess repeatability. The standard deviation of the measured deformation profiles across repetitions consistently remained within 5–7%, confirming the stability and reliability of the measurement procedure. Representative deformation values were obtained by averaging the steady-state deformation response corresponding to each cutting-force level. Accordingly, the cutting force values used in the deformation–force relationship correspond to steady-state averaged forces rather than instantaneous force fluctuations.
The resulting deformation–force datasets were subsequently fitted using second-order polynomial functions to extract physically interpretable deformation coefficients, as detailed in the following section. These coefficients form the basis for the unified property-based regression and principal component analyses presented later in the manuscript.
For conceptual clarity, Figure 1 summarizes the tool–workpiece configuration and sensor alignment, while Table 2 and the accompanying text fully specify all experimental parameters required to reproduce the deformation measurements.
Time-Resolved Force and Deformation Stability Across Axial Zones
Figure 2 illustrates the time-resolved cutting force and axial deformation responses for all five alloys across the five axial machining zones. Figure 2a,c,e,g,i depict the evolution of the resulting cutting force over time for Aluminum Alloy 6061, Brass C26000, Bronze C51000, Stainless Steel 304 Annealed, and Carbon Steel 1020 Annealed, respectively. The corresponding deformation responses are shown in Figure 2b,d,f,h,j. In all cases, the signals clearly transition from transient tool-entry behavior to a stable steady-state regime within each axial zone.
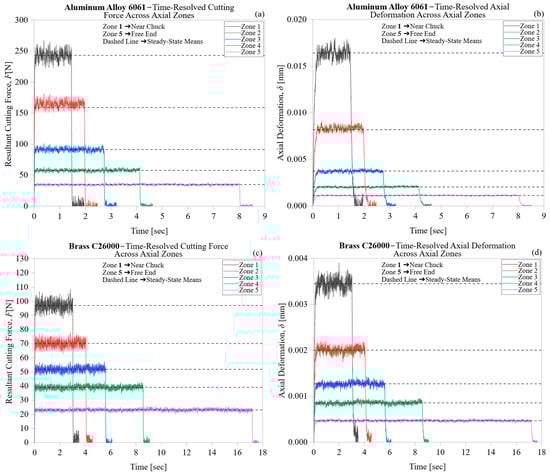
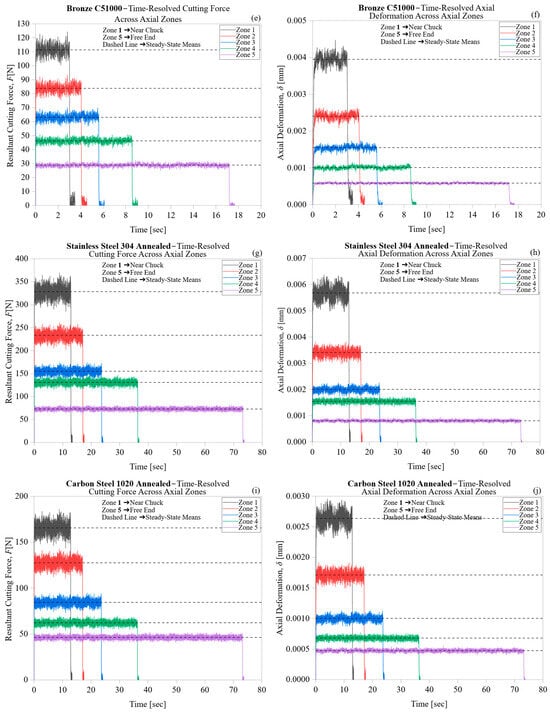
Figure 2.
Time-resolved cutting force and axial deformation responses across five axial machining zones: (a,b) Aluminum Alloy 6061, (c,d) Brass C26000, (e,f) Bronze C51000, (g,h) Stainless Steel 304 Annealed, and (i,j) Carbon Steel 1020 Annealed. Dashed horizontal lines indicate mean steady-state values ⟨F⟩ and ⟨δ⟩ computed within the shaded steady-state intervals after excluding tool entry and exit transients.
The clear steady-state plateaus observed in both force and deformation confirm that the experimental setup is reliable and that the machining conditions are consistently maintained. The dashed horizontal lines in Figure 2 mark the average steady-state values ⟨F⟩ and ⟨δ⟩, calculated over the shaded intervals that exclude transients during tool entry and exit. These averages serve as the foundation for the force–deformation relationships examined in later sections. The lack of long-term drift or oscillations within these steady-state periods suggests that the deformation response mainly reflects material properties, rather than effects from the machine or fixtures.
Across all materials, a clear zone-dependent pattern emerges. Cutting force and deformation are highest near the chuck-proximal region (Zone 1) and gradually decrease toward the free end (Zone 5). This trend indicates a progressive reduction in the workpiece’s structural stiffness along its overhang, validating the five-zone segmentation strategy used in this study. Additionally, the force and deformation signals within each zone consistently show temporal correlation, suggesting that axial deformation responds smoothly and proportionally to sustained cutting loads rather than to short-term force variations.
Material-specific differences in the time-domain response are also clear. Aluminum Alloy 6061 shows the highest deformation amplitudes at a given force, due to its low Young’s modulus and high compliance. Conversely, Stainless Steel 304 and Carbon Steel 1020 experience minimal deformation even with higher cutting forces, reflecting their high stiffness and resistance to elastic and thermally assisted plastic deformation. Brass and Bronze exhibit intermediate characteristics, with steady force levels and visible deformation sensitivity, indicating a mix of plasticity and moderate thermal effects.
Overall, the time-resolved analysis verifies that deformation caused by machining in our experiments remains stable, repeatable, and governed by material properties. The distinct separation between transient and steady-state phases confirms the validity of the averaging method used to create the empirical δ-F curves. It also justifies employing steady-state force and deformation data for polynomial fitting, regression analysis, and multivariate modeling in the following sections.
2.3. Empirical Fitting: Deformation Response Curves
The experimentally obtained force–deformation (δ-F) data for each alloy were modeled using a second-order polynomial expression to capture the nonlinear response observed under increasing cutting forces. This quadratic form was selected because machining-induced deformation exhibits a nonlinear response to increasing cutting force, driven by a combination of strain hardening, thermal softening, and geometric deflection. It allows simultaneous capture of both elastic and inelastic deformation behaviors with minimal model complexity.
In this formulation, the coefficient a represents the nonlinear deformation coefficient, which accounts for plastic amplification and thermal softening. The coefficient b indicates the load-sensitive (linear) coefficient, characterizing elastic and proportional plastic responses. The coefficient c reflects the intercept, which may arise from factors such as tool misalignment, initial preload, or fixture compliance.
These three coefficients serve as compact, physically meaningful summaries of the deformation response. They were extracted for each material using a least-squares minimization approach. These fitted coefficients provide the quantitative basis for the multivariate regression models described in the next section, which link observed deformation behavior to intrinsic material properties.
2.4. Multivariate Regression Based on Intrinsic Properties
Rather than treating the coefficients a, b, and c as abstract fitting parameters, the present work hypothesizes that they arise from material-governed mechanisms. For instance, Elastic stiffness (E) resists reversible deformation, while hardness (H) limits plastic flow and strain localization. Additionally, Thermal conductivity (k) controls heat accumulation at the cutting interface, affecting the extent of thermal softening. Therefore, each polynomial coefficient y ∈ {a, b, c}, derived from the empirical δ-F curves, was modeled as a function of E, H, and k to generalize machining-induced deformation behavior across materials. Accordingly, a mechanistically inspired multivariate power-law model is adopted:
In this formulation, C is a scaling constant, and the regression exponents α, β, and γ quantify the relative influence of stiffness, hardness, and conductivity, respectively. This formulation reflects the hypothesized interplay among elasticity, plasticity, and thermal dissipation, offering interpretable mappings from property space to deformation behavior.
To facilitate tractable regression analysis and maintain interpretability, the model was linearized using a logarithmic transformation:
This transformation enables the use of standard least-squares regression while preserving the physical meaning of the scaling exponents. Separate regressions were conducted for each deformation coefficient a, b, and c, yielding a distinct set of exponents (α, β, γ) for each regime. This modular structure allows the model to reflect the hierarchical role of material properties in nonlinear curvature (a), load-driven stiffness (b), and setup compliance or preload offset (c).
For instance, a high value of β in the regression for coefficient b implies that hardness is a primary determinant of force-dependent plastic deformation. Conversely, a dominant γ in the regression for coefficient a confirms the suppressive role of thermal conductivity on curvature through enhanced heat dissipation.
The resulting regression equations serve as the analytical core of the proposed modeling framework. They enable forward prediction of machining-induced deformation using only tabulated material properties, eliminating the need for case-specific experimental fitting. In addition, the magnitude and sign of the regression exponents offer a means for back-analyzing the dominant deformation mechanisms, revealing how stiffness, hardness, and thermal conductivity influence different deformation regimes. This structure also supports model transferability, allowing accurate predictions for new or untested alloys based solely on their intrinsic thermomechanical descriptors.
This marks a key innovation in CNC deformation modeling: transitioning from case-specific empirical trends to a compact, physically interpretable model that maps material descriptors to deformation behavior across regimes and materials. Having established the regression relationships between deformation coefficients and intrinsic material properties, it is essential to evaluate the accuracy and robustness of these models. The following section presents the statistical validation of the regression framework using multiple performance metrics and visual comparisons, ensuring that the proposed property-based model reliably captures material-specific deformation behavior.
2.5. Model Evaluation and Validation Metrics
The predictive performance of each regression model was evaluated using three standard statistical metrics, all computed in the original (non-logarithmic) domain to preserve physical interpretability. The coefficient of determination (R2) measures the proportion of variance in the observed data that is explained by the model, with values approaching 1.0 indicating a highly accurate fit. The mean absolute error (MAE) quantifies the average magnitude of deviation between predicted and actual values, offering a direct measure of typical prediction error. The root mean square error (RMSE) further emphasizes larger discrepancies and is particularly useful for evaluating the model’s reliability under high-deformation conditions, where prediction accuracy is most critical.
To visually assess prediction quality, scatter plots were generated for each deformation coefficient (a, b, and c), comparing predicted values against experimental observations. Each plot includes a 1:1 reference line along with ±10% deviation bounds, providing an intuitive sense of model agreement across the full range of data. Particular attention was paid to materials with extreme property combinations, such as Aluminum 6061, which combines low hardness with high thermal conductivity, and Stainless Steel 304, which exhibits high hardness and low conductivity, to ensure that the model remained valid across a broad thermomechanical spectrum.
Beyond statistical accuracy, the results affirm the physical robustness of the model, validating that deformation in CNC turning can be reliably captured through a compact, property-based formulation. This provides confidence in the model’s applicability for real-time simulation, material screening, and deformation-aware process design.
Having verified the high accuracy and generalizability of the regression models across diverse alloys, the next step is to examine their practical integration into machining applications.
2.6. Integration and Engineering Implications
The regression-based modeling framework developed in this study enables both forward and inverse integration into machining workflows. As a forward model, it predicts material-specific deformation solely from known thermomechanical properties (Brinell hardness, thermal conductivity, and Young’s modulus), eliminating the need for empirical calibration. Conversely, as an inverse estimator, it can approximate the cutting force required to achieve a target deformation level, facilitating deformation-aware process control.
Unlike traditional black-box models that offer limited physical transparency, this framework provides interpretable, property-driven insight into deformation behavior. Its input layer consists entirely of tabulated material properties, making it well-suited for the rapid evaluation of new or substitute alloys without requiring extensive testing.
This property-based structure supports seamless integration into digital manufacturing environments, including machining simulation platforms, digital twin architectures, and adaptive control systems. It allows engineers to make informed decisions about material selection, tooling strategies, and process parameters in deformation-critical applications.
In addition to reducing experimental overhead, the model offers a foundation for real-time deformation prediction, smart material substitution, and automated process optimization. These capabilities align with the objectives of Industry 4.0 and position the framework for deployment in next-generation intelligent machining systems.
With the regression framework fully established and its integration pathways outlined, the next step involves validating the model’s ability to capture material-specific deformation trends.
3. Empirical Modeling of Deformation
The empirical force–deformation curves revealed a robust parabolic trend across all materials, validating the use of a second-order polynomial model to capture the full spectrum of deformation behavior. This model, expressed as yielded three physically interpretable coefficients for each alloy: the nonlinear sensitivity coefficient (a), which reflects curvature in the deformation trajectory and is influenced by plastic amplification and thermal softening; the load-sensitivity coefficient (b), representing the linear proportionality between cutting force and deformation, primarily governed by elastic and early-stage plastic response; and the deformation intercept (c), denoting baseline offsets that may arise from machine compliance, thermal pre-expansion, or initial clamping effects.
As illustrated in Figure 3, each alloy exhibited a distinct nonlinear deformation response as the cutting force increased, driven by its inherent thermomechanical characteristics. The R2 values were above 0.999 for all materials, indicating an excellent fit and confirming that the parabolic approximation is valid throughout the entire deformation range.
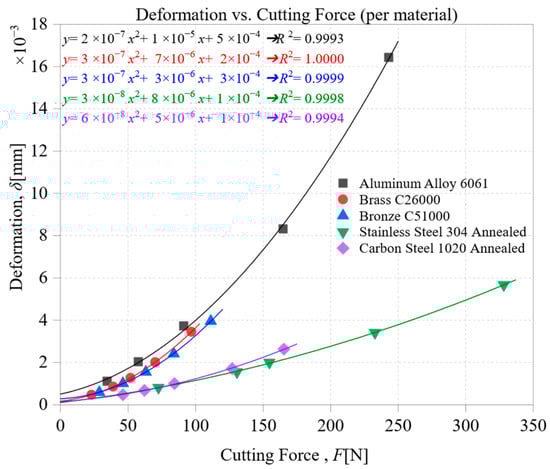
Figure 3.
Deformation vs. Cutting Force for Five Metallic Alloys.
Aluminum Alloy 6061 showed the most significant axial deformation, which is due to its low Brinell hardness (HB = 95) and low Young’s modulus (E = 69 GPa). Although it has high thermal conductivity (k = 167 W/m·K), its lack of structural rigidity allows for significant curvature and increased overall displacement.
Brass C26000 exhibited a moderate deformation response, marked by a low hardness (HB = 70) and moderate stiffness (E = 100 GPa). Its high thermal conductivity (k = 120 W/m·K) aids in reducing thermal buildup, although plastic deformation is still noticeable in the deformation trajectory.
Bronze C51000, which has a higher stiffness (E = 117 GPa) and moderate conductivity (k = 62 W/m·K), exhibited a steep force–deformation curve. This indicates a high sensitivity to increasing force and moderate resistance to plastic deformation.
Stainless Steel 304 Annealed exhibited the least deformation amplitude among all alloys, reflecting its high hardness (HB = 201), high stiffness (E = 193 GPa), and low thermal conductivity (k = 16.2 W/m·K). Its behavior was marked by minimal curvature and a nearly linear load–deformation curve, suggesting elastic dominance and minimal thermal softening.
Carbon Steel 1020 Annealed, which has the highest stiffness (E = 210 GPa) and moderate hardness (HB = 126), showed limited deformation. Its behavior was mainly linear, with a slightly higher baseline offset likely caused by setup compliance or initial preload effects.
These deformation profiles confirm that the interplay of thermal conductivity, elastic stiffness, and plastic hardness governs machining-induced distortion. The distinct trends observed across materials validate the use of second-order polynomial fitting as an effective surrogate for capturing combined elastic–plastic–thermal behavior. This empirical foundation directly supports the multivariate regression framework introduced in earlier sections.
The coefficient a quantifies the curvature of the force–deformation response and reflects the influence of nonlinear deformation mechanisms, primarily plastic amplification and thermal softening. As seen in Figure 3, Aluminum 6061, Brass, and Bronze exhibit steep curvature, indicating a high a value. This is expected due to their relatively low hardness and, in the case of Brass and Bronze, moderate thermal conductivity, which allows localized heating and strain accumulation. In contrast, Stainless Steel 304 and Carbon Steel 1020 show subdued curvature, consistent with their high hardness and low thermal diffusivity.
The coefficient b represents the linear response of deformation to increasing force and is primarily associated with elastic stiffness and proportional plasticity. In Figure 3, materials such as Brass and Bronze display a steeper linear trend, reflecting high b values, whereas Carbon Steel 1020 and Stainless Steel 304 exhibit a more restrained linear slope. Although Brass is softer than Carbon Steel, its unexpectedly high b suggests that other factors, such as microstructural anisotropy or early-stage yield behavior, may contribute to its slope.
The intercept c captures initial deformation offsets, which may result from fixture compliance, residual stress, or thermal pre-expansion before the onset of significant cutting force. As illustrated in Figure 3, Brass and Bronze exhibit the highest positive intercepts, suggesting susceptibility to setup-related deformation or early yielding. In contrast, Carbon Steel 1020 and Stainless Steel 304 show near-zero or even slightly negative intercepts, consistent with their rigidity and thermal stability. However, because extrinsic setup conditions heavily influence c, it is the least predictable of the three coefficients.
Building on the physical interpretation of the deformation coefficients, each was regressed against the intrinsic material properties using the power-law formulation introduced in Section 2.4. The resulting log-linear regression equations for the five alloys are as follows:
For the nonlinear coefficient a, the regression reveals that hardness plays the most dominant role (β = −3.84), followed by a moderate positive contribution from stiffness (α = 2.10) and a weaker influence from thermal conductivity (γ = −0.30). This aligns with the observation that materials with low hardness and moderate conductivity, such as Aluminum and Brass, exhibit stronger curvature in their δ-F response.
In the case of the load-sensitive coefficient b, hardness again emerges as the primary controlling factor with a large positive exponent (β = +3.31), indicating that higher hardness strongly suppresses proportional deformation. Stiffness plays a minor opposing role (α = −0.19), while conductivity contributes negligibly (γ = −0.04). This suggests that plastic flow resistance dominates the linear deformation regime.
Finally, the intercept coefficient c shows only weak dependence on intrinsic material properties. Stiffness has a moderate positive effect (α = 0.87), whereas hardness and conductivity have minimal influence (β = −0.025, γ = −0.17). These results confirm that c is governed mainly by extrinsic factors, such as initial setup compliance, rather than by bulk material behavior.
These regression equations provide not only interpretable physical insights but also serve as predictive tools. Before evaluating model performance quantitatively, it is essential to confirm that the predicted coefficients align well with their experimentally extracted counterparts across all tested materials. Figure 4 presents a comparative evaluation of observed versus predicted values for the three deformation coefficients, nonlinear sensitivity (a), load sensitivity (b), and intercept (c), derived from the unified regression framework. To assess prediction accuracy, each subplot includes a 1:1 ideal fit line and ±10% deviation bounds, providing both statistical and visual insight into material-specific prediction accuracy. This graphical validation complements the numerical regression analysis, highlighting the model’s strengths and limitations across different deformation regimes.
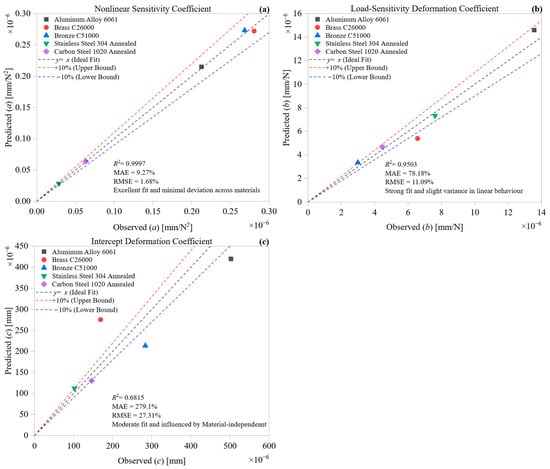
Figure 4.
Observed vs. predicted deformation coefficients: (a) nonlinear sensitivity, (b) load-sensitivity, and (c) intercept, based on multivariate regression across five alloys.
In Figure 4a, the model demonstrates exceptional accuracy in predicting the nonlinear sensitivity coefficient (a), achieving an R2 of 0.9997, an MAE of 9.27%, and an RMSE of 1.68%. All five materials, Aluminum 6061, Brass C26000, Bronze C51000, Stainless Steel 304, and Carbon Steel 1020, lie within the ±10% bounds, confirming the model’s robustness in capturing curvature-induced deformation behavior. This finding highlights the significant influence of thermal conductivity and plastic compliance on shaping nonlinear deformation, both of which are well accounted for by the regression inputs. The prediction consistency across materials with drastically different thermophysical profiles reflects the physical sufficiency of the selected descriptors.
In contrast, Figure 4b reveals moderate predictive performance for the load-sensitivity coefficient (b), with R2 = 0.9503, MAE = 78.18%, and RMSE = 11.09%. While Aluminum 6061, Stainless Steel 304, and Carbon Steel 1020 remain within the ±10% range, deviations emerge for the copper-based alloys: Brass C26000 falls below the lower bound (underpredicted), while Bronze C51000 lies above the upper bound (overpredicted). These discrepancies suggest that linear deformation sensitivity is influenced not only by hardness but also by secondary factors, such as microstructural anisotropy, strain hardening behavior, or phase distribution, which are not directly incorporated into the regression model. The model remains directionally correct but exhibits limited generalizability for alloys with complex yield transitions.
The greatest variance occurs in Figure 4c for the intercept coefficient (c), where the model yields R2 = 0.6815, MAE = 279.1%, and RMSE = 27.31%, indicating considerable prediction error. Only Stainless Steel 304 and Carbon Steel 1020 fall within the ±10% bounds. The predictions for Brass C26000 are overpredicted (above the upper bound), while Aluminum 6061 and Bronze C51000 are underpredicted (below the lower bound). This irregularity highlights the fact that c is not solely material-dependent; it encapsulates setup-specific effects, including fixture compliance, preload deformation, geometric misalignments, and early-stage thermal expansion. These factors are inherently extrinsic and therefore not captured by intrinsic properties such as hardness, stiffness, or conductivity.
From a predictive modeling standpoint, the results across Figure 4a–c reveal a hierarchical structure in regression reliability among the deformation coefficients. The nonlinear coefficient (a) exhibits the highest predictive fidelity and is evidently governed by intrinsic material characteristics, particularly thermal conductivity and plastic compliance. In contrast, the load-sensitivity coefficient (b) exhibits moderate prediction accuracy, indicating that while it partially reflects material properties such as hardness and stiffness, its behavior is also influenced by secondary factors, including strain hardening and microstructural anisotropy, which are not explicitly captured in the regression model. The intercept coefficient (c), however, demonstrates substantial variability and limited correlation with intrinsic properties, indicating that it is primarily influenced by process-specific factors such as fixture compliance, geometric misalignments, and residual thermal effects. These findings underscore the need to distinguish between deformation components that are material-deterministic and those that are experimentally contextual, suggesting that hybrid or correction-based approaches may be required to reliably estimate baseline offsets (c) in predictive deformation frameworks.
The empirical modeling stage confirmed that second-order polynomial fitting effectively captures force-dependent deformation across different alloys. The high predictive accuracy for the nonlinear curvature, along with moderate reliability for the linear deformation regime, highlights the model’s physical interpretability and generalizability. However, the weak prediction of the deformation intercept underscores the limitations of relying solely on intrinsic material properties to account for setup- or process-specific effects. These observations motivate the introduction of enhanced regression methods and dimensionality-reduction techniques, such as principal component analysis, which are explored in the following sections to improve model robustness and reduce parameter interdependence.
4. Multivariate Regression Modeling
Having established the regression framework linking thermomechanical properties to machining-induced deformation, the next step involves evaluating the physical relevance, statistical robustness, and interpretability of the model inputs. This section investigates how individual material properties, Brinell hardness, thermal conductivity, and Young’s modulus, contribute to shaping the deformation coefficients derived from empirical force–displacement data. Through a combination of property-wise analysis, unified model validation, and regression weight interpretation, the aim is to uncover the mechanistic pathways by which intrinsic material characteristics influence nonlinear compliance, load sensitivity, and initial offset behavior. The subsections that follow provide a detailed examination of each property’s role, culminating in a multivariate analysis that clarifies the combined effect of these descriptors on deformation trends.
4.1. Influence of Hardness on Deformation Coefficients
Figure 5 shows how Brinell hardness relates to the three empirically derived deformation coefficients: (a) nonlinear sensitivity, (b) load-dependent linear response, and (c) baseline deformation offset, across the five alloys studied. This analysis isolates the mechanical influence of hardness from other thermophysical parameters, allowing a focused interpretation of its role in shaping deformation behavior.
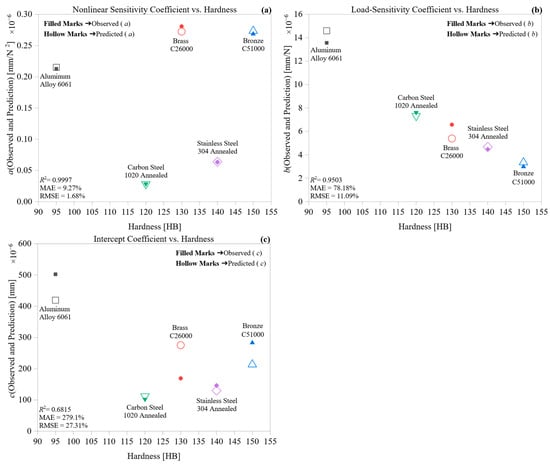
Figure 5.
Effect of Brinell hardness on deformation coefficients: (a) nonlinear term, (b) load-sensitivity, and (c) intercept.
Figure 5a clearly shows an inverse relationship between hardness and the nonlinear coefficient (a). Aluminum 6061, the softest alloy, exhibits the greatest curvature in its force–deformation curve, whereas Stainless Steel 304 and Carbon Steel 1020 have noticeably lower (a) values. This trend indicates that nonlinear compliance decreases as hardness rises, which is consistent with reduced plasticity and strain localization under higher loads. The curve’s flattening at higher hardness levels suggests a point where further increases in resistance provide only minimal improvements in limiting nonlinear deformation.
Figure 5b illustrates a more complex trend in the load-sensitivity coefficient (b). While there is a general decline with increasing hardness, the relationship is not strictly linear. For example, Brass C26000, although softer than Carbon Steel, exhibits a higher (b) than expected, suggesting that the deformation slope is affected not only by hardness but also potentially by microstructural anisotropy or thermal softening. In comparison, the linear response is less affected by extreme hardness values and more influenced by combined thermomechanical factors.
In Figure 5c, the deformation intercept (c) consistently decreases as hardness rises. Softer materials exhibit small, positive offsets, likely due to fixture compliance, thermal expansion, or initial plastic deformation. Conversely, more complex alloys, such as stainless steel and Carbon Steel, tend towards zero or slightly negative values, reflecting rigid tool–workpiece contact with minimal preload deformation. These offset values provide insight into pre-cutting conditions and initial deflection behavior, which are often neglected in simplified analytical models.
Collectively, these results confirm that Brinell hardness exerts a progressively diminishing influence on the deformation coefficients, with the most substantial effect observed in curvature (a). The influence decreases gradually for the linear coefficient (b). It has the weakest impact on intercept (c), indicating a layered mechanical response where curvature, stiffness, and preload behavior depend on progressively complex interactions. These results highlight the significance of hardness in deformation prediction models and underscore its importance as a key input in regression analyses.
4.2. Influence of Thermal Conductivity on Deformation Coefficients
Figure 6 analyzes how thermal conductivity (k) relates to three empirical deformation coefficients: nonlinear sensitivity (a), load sensitivity (b), and baseline offset (c). The trends illustrate how thermal diffusion influences deformation behavior during CNC turning. By quantifying these relationships, this section highlights the role of k as a thermal moderator of strain development and energy dissipation.
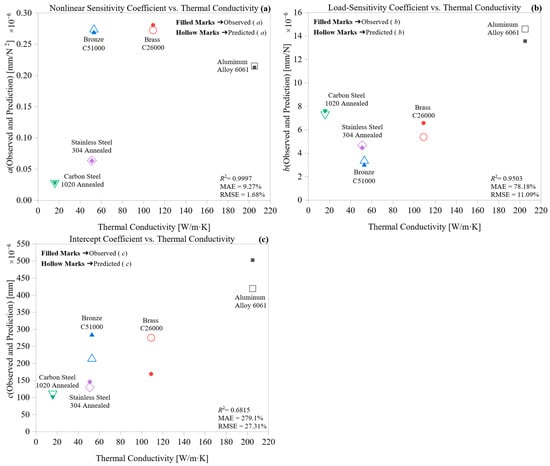
Figure 6.
Influence of thermal conductivity on deformation coefficients: (a) nonlinear term, (b) load-sensitivity, and (c) intercept.
Figure 6a reveals a clear inverse correlation between thermal conductivity and the nonlinear coefficient (a). Alloys with low thermal conductivity, such as Stainless Steel 304 and Carbon Steel 1020, show higher (a) values, indicating significant nonlinear deformation. These materials tend to trap heat near the tool–chip interface, which enhances thermal softening and plastic flow. In contrast, Aluminum Alloy 6061, with a high thermal conductivity of 167 W/m·K, has the lowest (a), suggesting that efficient heat dissipation limits localized softening. This highlights the importance of thermal conductivity (k) in managing energy buildup and the spread of nonlinear deformation. The results affirm that reduced thermal diffusion amplifies the curvature in the force–deformation profile by promoting localized heating.
Figure 6b shows a similar inverse pattern for the load-sensitivity coefficient (b), but with a gentler slope. Alloys like Bronze C51000 and Brass C26000, which have moderate thermal conductivity, fall into the middle range of (b) values. Meanwhile, high-k Aluminum exhibits a minimal increase in load response. This indicates that materials with higher thermal conductivity maintain thermal stability under load, reducing strain buildup per force. Conversely, low-k materials tend to soften more quickly under mechanical load due to localized heat, which increases the slope of the deformation curve. However, the partial deviation from linearity suggests that additional factors, such as hardness or strain-rate sensitivity, may also influence b.
In Figure 6c, the intercept coefficient (c) decreases as thermal conductivity increases, moving from slightly positive values in steels to negative values in high-k materials. This indicates that alloys with high thermal diffusion may exhibit little to no deformation, or even slight contraction, at zero load, likely due to rapid thermal relaxation during tool contact. The negative intercepts observed in Aluminum and Brass could represent micro-elastic recovery or initial thermal shrinkage instead of true deformation accumulation. Since c is also affected by fixture compliance and contact conditions, its weak correlation with k must be interpreted with caution.
Thermal conductivity strongly suppresses the nonlinear deformation coefficient, a, moderately influences the linear response, b, and weakly affects the offset, c. Unlike just mechanical factors, k directly affects heat flux at the tool-workpiece interface, impacting the size and type of deformation. Its steady inverse relationship with all three coefficients confirms its importance as a key predictor in physics-based machining models. These findings support the integration of thermal conductivity in predictive frameworks aimed at minimizing distortion and improving dimensional accuracy during machining.
4.3. Influence of Young’s Modulus on Deformation Coefficients
Figure 7 examines how Young’s modulus (E) affects deformation behavior by influencing the empirical coefficients a, b, and c. The observed trends show that elastic stiffness determines both the extent and beginning of deformation in CNC turning, varying with different alloy rigidities. This section isolates the contribution of E as a descriptor of elastic compliance and its downstream effects on plastic amplification and structural stability.
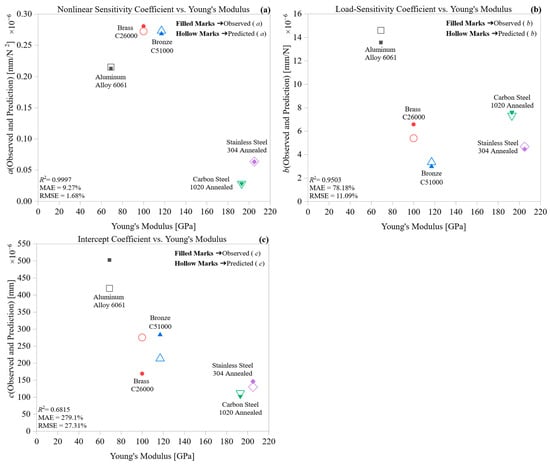
Figure 7.
Relationship between Young’s modulus and deformation coefficients: (a) nonlinear term, (b) load-sensitivity, and (c) intercept.
Figure 7a shows that the nonlinear coefficient a drops sharply as the applied field E increases. Alloys with lower stiffness, such as Brass C26000 and Bronze C51000, exhibit the highest a values, indicating stronger curvature in their force–deformation curves. This suggests their limited resistance to both elastic and early plastic deformation. Conversely, Carbon Steel 1020 and Stainless Steel 304, with E values above 190 GPa, have a values near the lower limit, meaning these stiffer materials deform more uniformly under load. The clear inverse relationship between a and E confirms that elastic stiffness reduces nonlinear deformation, especially at lower forces.
Figure 7b illustrates a similar decreasing trend for the load-sensitivity coefficient b. Materials with lower E values exhibit steeper slopes in the deformation curve due to their higher elastic compliance. Notably, Aluminum 6061, with a moderate modulus of 69 GPa, has a lower b than softer copper-based alloys, aligning it more with steels. This discrepancy suggests that the modulus alone does not entirely determine the linear deformation rate; factors such as thermal conductivity and strain hardening likely play a role in the effective stiffness during machining.
In Figure 7c, the intercept c shifts from positive to slightly negative as E increases. Alloys with lower stiffness exhibit non-zero intercepts, indicating setup-induced deflection or early compliance before significant loading occurs. As E increases, c approaches zero, signifying increased rigidity during initial tool engagement and reduced preload-induced distortion. Therefore, the intercept functions as a marker of mechanical anchoring efficiency and thermal pre-deformation.
These findings confirm that Young’s modulus is a vital factor influencing all modes of deformation. It affects both curvature (through a) and proportional response (through b), demonstrating its role in adjusting deformation gradients. Additionally, its impact on c emphasizes its stabilizing effect at the start of machining. The recurring inverse relationships support using E as a key parameter in physically based deformation models.
4.4. Evaluation of Unified Deformation Predictions
Figure 8 illustrates the predictive accuracy of the unified deformation model, which directly estimates the total axial deformation δ(F) from the applied cutting force. The model utilizes coefficients based on the inherent properties of each material, including Brinell hardness, thermal conductivity, and Young’s modulus. This approach eliminates the need for case-specific curve fitting, enabling broad predictions across various alloys using only thermomechanical descriptors. By translating intrinsic material properties into polynomial coefficients, the model serves as a generalizable surrogate for force–deformation behavior.
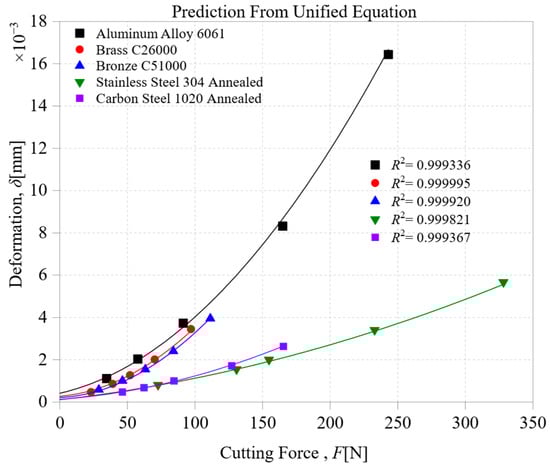
Figure 8.
Unified model predictions of axial deformation δ(F) for all five alloys based on property-driven regression coefficients.
The model demonstrates outstanding predictive accuracy across all five alloys, with R2 values of 0.999336 for Aluminum 6061, 0.999995 for Brass C26000, 0.999920 for Bronze C51000, 0.999821 for Carbon Steel 1020, and 0.999367 for Stainless Steel 304. These results closely match the material-specific polynomial fits shown in Figure 3, with maximum R2 deviations limited to ±0.004%. This minimal difference highlights the high fidelity of the property-based regression in accurately reproducing detailed deformation profiles. The tight agreement also confirms that no material class suffers a significant tradeoff in predictive precision due to model unification.
Notably, Aluminum 6061 exhibits a slight increase in prediction accuracy (+0.0036%), demonstrating the unified model’s ability to capture its unique high-conductivity property. Conversely, Stainless Steel 304 exhibits the greatest deviation (−0.0033%) but still fits well. Brass C26000 and Bronze C51000 differ from their original regressions by only −0.0005% and +0.0020%, respectively. Carbon Steel 1020 also shows a minor improvement of +0.0026%. Though these differences seem small, they are meaningful; in nonlinear deformation modeling, even sub-percent deviations can subtly affect curvature accuracy, especially in extrapolative force regimes. Such precision becomes increasingly crucial in digital twin applications and real-time control systems.
The model maintains the complete morphological details of the force–deformation response for all materials. Ductile alloys, such as Aluminum and Brass, exhibit a sharp increase in deformation with applied force. In contrast, stiff alloys, such as Stainless Steel and carbon steel, show a more gradual, linear response. This result verifies that the unified model not only provides accurate predictions but also preserves the physical realism of each material’s deformation behavior. No smoothing or distortion is introduced by the use of property-based surrogates, preserving the distinguishing features of each alloy’s mechanical signature.
In summary, the unified framework effectively connects intrinsic material properties with deformation behavior, achieving the accuracy of specialized models while offering greater scalability and efficiency. Its low error margin, physical interpretability, and transferability make it an ideal candidate for integration into process optimization, virtual machining platforms, and adaptive CNC control. This property-driven approach offers a strong, material-aware foundation for advanced machining workflows.
While the unified model performs exceptionally well across all alloys, it remains essential to examine how individual material characteristics influence the shape and magnitude of their deformation profiles.
4.5. Contribution Analysis of Multivariate Regression Coefficients
Figure 9 shows how three main thermomechanical properties, Brinell hardness (α), thermal conductivity (β), and Young’s modulus (γ), affect the polynomial deformation coefficients (a), (b), and (c). The bars depict signed standardized regression weights, with the ±1.20 reference lines helping to distinguish between dominant and marginal predictors. This approach enables a mechanistic understanding of the physical contribution of each property to machining-induced deformation behavior. Standardization facilitates direct comparison of predictors with different units and scales, making the dominance thresholds meaningful across coefficients.
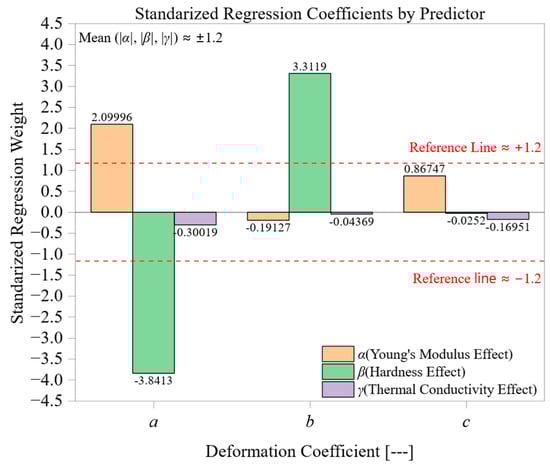
Figure 9.
Standardized regression contributions of material properties (Brinell hardness α, thermal conductivity β, and Young’s modulus γ) to deformation coefficients a, b, and c.
The nonlinear coefficient (a), which controls the curvature in the force–displacement response, is most significantly affected by thermal conductivity (β = −3.84), showing the largest negative contribution and surpassing the ±1.20 threshold considerably. This highlights how high conductivity suppresses curvature by enhancing heat dissipation. Hardness (α = 2.10) also exceeds the threshold but in the opposite direction, indicating it strengthens nonlinear deformation in harder materials. Conversely, Young’s modulus (γ = −0.30) remains within the ±1.20 range, suggesting elastic stiffness has a minor influence in this context, likely because it weakly affects thermally driven softening mechanisms. These results reinforce the thermal–plastic interplay as the primary driver of nonlinear deformation.
The slope coefficient (b), indicating load sensitivity, reveals a reversed predictor hierarchy. Hardness (α = 3.31) stands out as the only dominant factor, surpassing the +1.20 threshold again, which confirms that plastic flow resistance controls the acceleration of deformation with increasing force. Meanwhile, the contributions from thermal conductivity (β = −0.19) and modulus (γ = −0.044) fall below the reference line, indicating that load-induced deformation is primarily unaffected by thermal transfer or elastic strain capacity. This suggests that the linear regime is governed mainly by material strength, rather than by thermal or elastic factors.
For the case of the intercept (c), which reflects preload deformation and initial compliance, hardness (α = 0.867) remains the dominant factor, though it now just falls slightly below the +1.20 threshold. This suggests a significant but moderate effect on the onset of deformation. Young’s modulus (γ = −0.170) exerts a secondary influence, aligning with its known role in elastic contact behavior at low loads. In contrast, thermal conductivity (β = −0.025) plays a nearly insignificant role, remaining close to zero and well below any relevant level. This hierarchy highlights that c is influenced more by mechanical anchoring and fixture compliance than by heat transfer characteristics.
Taken together, the ±1.20 reference bands act as practical thresholds for assessing the dominance of material properties. Predictors that exceed this range, in terms of thermal conductivity (a) and hardness for both (a) and (b), are likely primary drivers of deformation. Conversely, contributions within the band indicate weaker or context-dependent influences. This visualization not only clarifies the multivariate relationships but also provides a valuable tool for screening material behaviors: for example, materials with low (k) and high (H) values are predicted to exhibit steep deformation curves and high load sensitivity. The signed coefficients provide further directional insights, distinguishing between suppressive effects (negative weights) and amplifying ones (positive weights).
This coefficient-level analysis confirms the physical basis of the regression framework. It reveals that deformation during machining occurs through different thermomechanical pathways depending on the regime: nonlinear, load-sensitive, or initial compliance. Incorporating both the magnitude and sign with the ±1.20 benchmark enhances interpretability and practicality in selecting or optimizing materials for deformation-critical turning processes.
The preceding analysis confirmed that Brinell hardness, thermal conductivity, and Young’s modulus each contribute uniquely to deformation behavior during machining. However, interpreting these properties in isolation may overlook their combined physical significance. To address this, the next stage of analysis introduces a set of non-dimensional ratios that integrate mechanical and thermal characteristics into unified, scale-independent metrics.
5. Analysis with Non-Dimensional Ratios
Enhancing the interpretability and dimensional consistency of the deformation model requires moving beyond individual material properties toward composite, physically meaningful ratios. In this context, three non-dimensional metrics were derived: hardness-to-stiffness ratio (H/E), thermal-to-stiffness ratio (k/E), and hardness-to-conductivity ratio (H/k). Each ratio encapsulates a distinct aspect of material behavior, including plastic compliance, conductive elasticity, and thermal–mechanical imbalance, which governs how deformation evolves under machining conditions. These ratios were identified through principal component analysis as dominant, low-redundancy features, offering a compact yet powerful representation of thermomechanical performance. The following subsections examine their impact on the nonlinear, linear, and intercept coefficients of deformation, providing new insights into material-specific deformation pathways.
5.1. Influence of Hardness-to-Stiffness Ratio (H/E) on Deformation Coefficients
Figure 10 explores the connection between the hardness-to-stiffness ratio (H/E) and the deformation coefficients a, b, and c. This non-dimensional metric combines material resistance to plastic deformation, hardness, elastic response, and Young’s modulus, providing an overall measure of strain tolerance under contact loading. The observed trends demonstrate how this ratio affects the sensitivity, gradient, and intercept of the force–deformation behavior during machining. Its physical significance lies in characterizing a material’s balance between compliance and strength, which governs how deformation initiates and evolves.
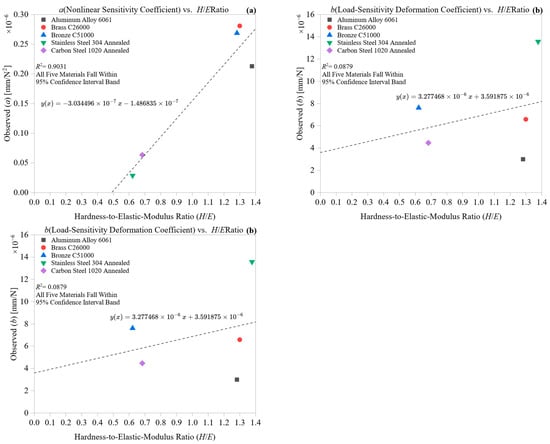
Figure 10.
Effect of hardness-to-stiffness ratio (H/E) on deformation coefficients: (a) nonlinear term, (b) load-sensitivity, and (c) intercept.
In Figure 10a, the nonlinear coefficient (a) shows a clear increasing pattern with H/E. Aluminum Alloy 6061 and Stainless Steel 304, which have the lowest H/E ratios due to their high stiffness or moderate hardness, respectively, exhibit minimal nonlinearity in their deformation responses. Conversely, materials like Brass C26000 and Bronze C51000, with higher H/E values, display greater (a) values, indicating a more pronounced nonlinear response as force increases. This suggests that as the material becomes more compliant relative to its resistance to plastic flow, the deformation curve becomes more curved, especially at higher forces. The response illustrates that high H/E ratios are predictive of early plastic instability under load.
Figure 10b indicates a weaker correlation between H/E and the load-sensitivity coefficient (b), although a slight upward trend can be seen. The clustering of materials in this subplot suggests that while H/E may affect the slope of the deformation–force curve, its influence is secondary to direct stiffness or thermal properties. Notably, Bronze and Brass still show higher (b) values compared to their H/E ratios, aligning with their tendency for early-stage plasticity. Conversely, Carbon Steel 1020, despite having a moderate H/E, displays a much lower (b), emphasizing that stiffness alone does not suffice to predict load sensitivity without considering thermal and yield properties. This reinforces the multi-factorial nature of linear deformation gradients.
In Figure 10c, the intercept coefficient (c) demonstrates a clear increasing trend as H/E rises. This indicates that materials capable of accommodating more strain before fully elastic recovery tend to have greater preload deformation or setup compliance. Brass and Bronze are positioned at the top right quadrant, correlating with higher H/E and larger positive intercepts. Despite its ductility, Aluminum shows a lower coefficient of thermal expansion (c), likely due to its higher thermal conductivity, which reduces initial expansion. In contrast, Stainless Steel and Carbon Steel, with lower H/E, exhibit negative or near-zero intercepts, aligning with their more rigid initial response during tool engagement.
Overall, the hardness-to-stiffness ratio is a key predictor of the complexity of the deformation response. A higher H/E ratio is associated with greater deformation curvature and more setup compliance, whereas lower ratios tend to exhibit a linear elastic and stiffer response. These findings justify using H/E as a physically meaningful and dimensionally consistent predictor in machining deformation models, especially in cases where plasticity and compliance must be simultaneously accounted for.
5.2. Influence of Thermal-to-Stiffness Ratio (k/E) on Deformation Coefficients
Figure 11 examines the impact of the ratio of thermal conductivity to stiffness (k/E) on the deformation coefficients a, b, and c. It provides a thermomechanical view of how conductive elasticity influences deformation during machining. The k/E parameter is a non-dimensional metric that reflects how well the material dissipates heat compared to its elastic stiffness, making it particularly important in dynamic cutting scenarios where heat accumulation and mechanical flexibility are both at play. It serves as a proxy for the material’s ability to resist thermally induced deformation under load.
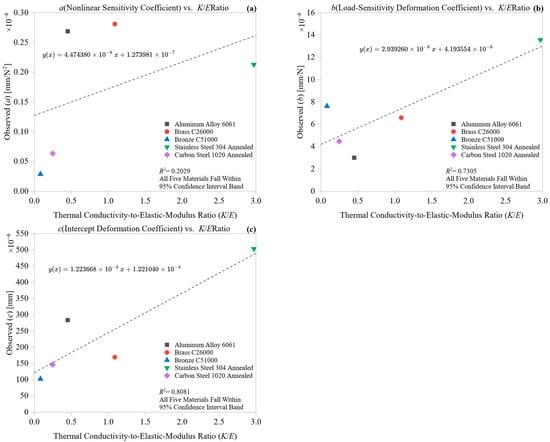
Figure 11.
Influence of conductivity-to-stiffness ratio (k/E) on deformation coefficients: (a) nonlinear term, (b) load-sensitivity, and (c) intercept.
Figure 11a shows a clear exponential decrease in the nonlinear coefficient (a) as k/E increases. Aluminum 6061, characterized by its very high thermal conductivity and relatively low Young’s modulus, appears at the far right of the horizontal axis, corresponding to the lowest (a) value. Conversely, Bronze C51000 and Brass C26000 have the highest (a) values and are located on the far left, where poor thermal conduction and moderate stiffness heighten nonlinearity. This trend suggests that a high k/E ratio helps the material dissipate heat efficiently, preventing thermal softening from dominating and thus reducing nonlinear deformation growth under increasing force. The material-specific positions confirm that the k/E ratio acts as a regulator of curvature in force–displacement behavior, especially in thermally sensitive alloys.
The relationship shown in Figure 11b between k/E and the load-sensitivity coefficient (b) is also inverse but exhibits slightly more variation. Again, Aluminum demonstrates the lowest (b), implying that its high thermal diffusivity helps buffer deformation responses even as the load increases. Steels and copper-based alloys tend to cluster at lower k/E values and exhibit higher b levels, indicating a steeper deformation trend. This correlation suggests that poor thermal dissipation under load promotes material softening, resulting in increased deformation per unit force. While less predictive than for a, the relationship remains physically meaningful in load-dominated regimes.
Figure 11c illustrates a highly nonlinear relationship between k/E and the intercept coefficient (c), where materials with low thermal-to-stiffness ratios exhibit high positive intercepts. Bronze and Brass tend to cluster in the upper left of the plot, indicating that preload displacement may be potentially caused by setup compliance, low thermal diffusion, and early-stage yielding. Conversely, Aluminum and the two steel groups move toward the lower right, with near-zero or slightly negative values of (c), suggesting a rigid tool–material interaction with little initial displacement. This may be due to their higher thermal conductivity, which reduces early expansion or micro-yielding.
Overall, the plots in Figure 11 demonstrate that the k/E ratio is a vital factor influencing both nonlinear and load-dependent deformation behaviors. As the k/E ratio rises, materials show less curvature, decreased deformation sensitivity, and minimal initial compliance. These trends underscore the role of conductive elasticity in moderating thermally driven strain accumulation during machining. Incorporating k/E into predictive frameworks strengthens the physical interpretability of machining deformation models, particularly when both heat conduction and stiffness jointly govern material response.
5.3. Influence of Hardness-to-Conductivity Ratio (H/k) on Deformation Coefficients
Figure 12 examines how the non-dimensional hardness-to-conductivity ratio (H/k) influences the deformation coefficients a, b, and c. This ratio indicates the balance between plastic resistance and heat dissipation, highlighting the thermal-mechanical imbalance in machining. Materials with high H/k tend to accumulate more strain energy and thermal gradients, whereas those with low H/k quickly transfer heat away from the cutting interface. This composite metric is particularly relevant in high-energy machining processes where mechanical loading and thermal confinement co-occur.
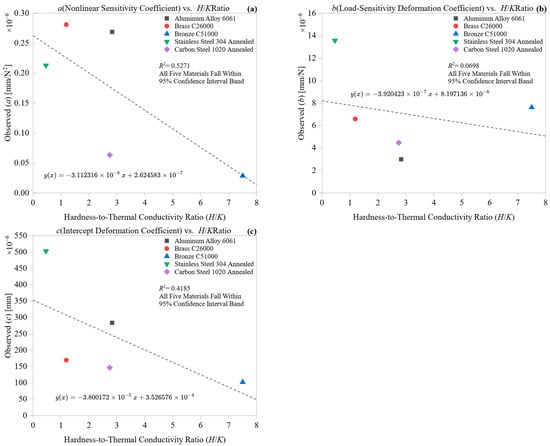
Figure 12.
Effect of hardness-to-conductivity ratio (H/k) on deformation coefficients: (a) nonlinear term, (b) load-sensitivity, and (c) intercept.
In Figure 12a, the nonlinear coefficient (a) increases significantly with increasing H/k, indicating that materials resistant to indentation but poor at heat dissipation tend to exhibit highly nonlinear deformation profiles. Brass C26000 and Bronze C51000, located in the upper-right quadrant, display higher H/k ratios and corresponding high (a) values. This pattern is due to localized heat buildup combined with mechanical resistance, which enhances the curvature of deformation. Conversely, Aluminum 6061 and Stainless Steel 304, which have lower H/k ratios, are located at the lower end of the (a) axis, suggesting that high thermal conductivity reduces nonlinearity even for materials with moderate hardness. These results position H/k as a suppressor or enhancer of thermally driven geometric amplification.
The trend in Figure 12b mirrors that of the nonlinear term but with reduced magnitude. The load-sensitivity coefficient b generally increases with H/k, reflecting greater deformation per unit force in materials that resist plastic flow yet retain heat. Carbon Steel 1020 and Bronze C51000 demonstrate steeper slopes, indicating higher b values and difficulty in relieving thermal stress under load. Stainless Steel, which maintains a balance between mechanical and thermal properties, exhibits a moderate b value despite its low H/k, reinforcing the notion that material balance, not ratio extremity alone, dictates linear response. This suggests that H/k is a valuable but non-exclusive predictor in load-dominant deformation behavior.
Figure 12c illustrates a strong positive correlation between H/k and the intercept coefficient (c). Materials like Brass and Bronze, which have high H/k ratios, exhibit higher positive intercepts, indicating significant deformation at near-zero force. This may result from stored residual strain or setup-induced yielding, worsened by poor heat conduction that hampers the stabilization of the contact zone. Conversely, Aluminum 6061 and Stainless Steel 304 are positioned at the lowest end of the (c) region, reflecting minimal preload deformation due to effective thermal diffusion that limits early thermal expansion or localized yielding. These findings underscore the role of thermal mitigation in stabilizing the initial contact zone during cutting.
Taken together, the results show that the H/k ratio effectively reflects the imbalance between mechanical resistance and thermal mitigation. An increased H/k ratio amplifies both the curvature and slope of the force–deformation curve, leading to greater initial displacement under small loads. This composite metric provides an interpretable and dimensionally balanced predictor of deformation severity, particularly in alloys with poor thermal conductivity. Its predictive ability works well alongside existing metrics, such as H/E and k/E, making H/k a useful addition to comprehensive models of deformation in thermally assisted machining.
The analysis of non-dimensional ratios demonstrated that combining thermomechanical properties into physically grounded metrics, such as H/E, k/E, and H/k, enhances both the interpretability and predictive capability of the deformation model. These ratios captured key aspects of material behavior, including compliance, thermal diffusion, and plastic resistance, and provided consistent trends across all deformation regimes. While effective in isolating dominant mechanisms, a broader understanding of inter-property relationships and dimensional redundancy remains essential. The next stage employs principal component analysis (PCA) to reveal latent structures, reduce feature dimensionality, and identify the most informative combinations of material descriptors for deformation prediction.
6. Principal Component Analysis
Principal Component Analysis (PCA) was used to identify hidden patterns in the multivariate deformation data and reduce dimensionality while preserving the dominant sources of variance. This approach offers a concise and understandable representation of material behaviors alongside their thermomechanical descriptors, moving beyond simple coefficient regression toward a more comprehensive, pattern-focused modeling.
Figure 13 shows the scree plot of explained and cumulative variance for the five principal components (PCs). PC1 accounts for 69.63% of the total variance, indicating a dominant latent factor that influences most deformation variations across the alloys studied. PC2 adds another 23.39%, bringing the total explained variance to 93.02%. PC3 accounts for 4.41%, increasing the total to 97.43%, while PC4 contributes a small 2.56%. PC5 has an insignificant contribution (~4.2 × 10⁻³¹%) and is statistically negligible.
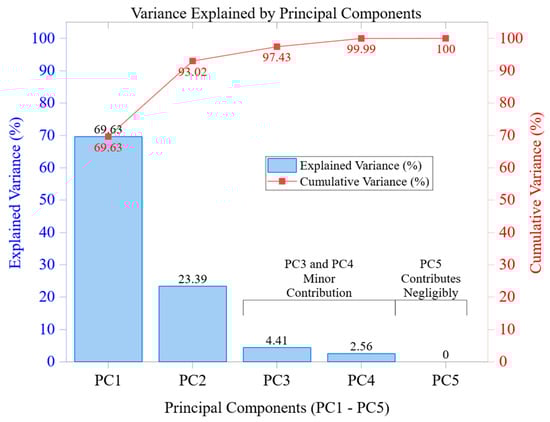
Figure 13.
Scree plot showing both explained variance (%) and cumulative variance (%) for principal components PC1 to PC5. PC1 and PC2 jointly account for over 93% of the total variance in the dataset.
The sharp drop in eigenvalue magnitudes after PC2 indicates that the deformation-property system has a highly focused variance pattern. This makes a two-dimensional PCA projection effective in retaining almost all vital information, supporting its application for material clustering and multivariate analysis. Importantly, this compression is not only statistical but also physical, highlighting meaningful trends related to stiffness, plasticity, and thermal behavior.
A closer examination of the principal components reveals distinct physical behaviors represented along each axis. The first principal component (PC1) primarily reflects the combined deformation sensitivity, influenced by thermal conductivity (k) and Brinell hardness (HB). Variables such as the non-dimensional ratios k/E and H/E, along with the nonlinear deformation coefficient a, show strong positive loadings on PC1, while Young’s modulus (E) loads negatively. This suggests that PC1 acts as a thermo-mechanical softening axis, effectively distinguishing between ductile, heat-conductive materials and those with high stiffness and resistance to deformation.
Conversely, the second principal component (PC2) separates materials based on stiffness-controlled behavior. It is positively related to hardness (HB) and the intercept term c, indicating materials that exhibit early compliance or preload deformation. The slope coefficient b contributes negatively to PC2, representing materials that respond more linearly to increasing cutting force. Therefore, PC2 can be seen as an axis of mechanical compliance and load responsiveness, capturing variations in initial deformation and progressive plasticity across different materials.
Together, PC1 and PC2 illustrate a physically meaningful deformation landscape: PC1 controls the balance between thermal softening and structural rigidity, while PC2 shows the transition from early compliance to progressive plasticity. The fact that this two-dimensional projection captures 93.02% of the variance suggests that machining-induced deformation can be accurately represented within a low-dimensional, physically meaningful space.
This PCA implementation confirms the internal consistency of the model’s regression framework and offers a multivariate classification map that categorizes materials based on their thermomechanical and deformation responses. The findings support predictive activities, such as material screening, process optimization, and deformation-aware design, particularly in settings with limited data or when rapid prototyping is required. Additionally, the correlation circle and biplot in Figure 13 clarify these axes by illustrating how variable contributions relate to the positions of different materials within the PCA space.
Figure 14 shows a two-dimensional principal component (PC) projection of material scores (Figure 14a) and variable loadings (Figure 14b). These are based on the first two principal components, which together explain 93.02% of the total variance. This combined view allows simultaneous analysis of material clustering and the influence of individual features, illustrating how thermomechanical descriptors collectively determine deformation behavior. The visualization facilitates both classification and mechanistic interpretation.
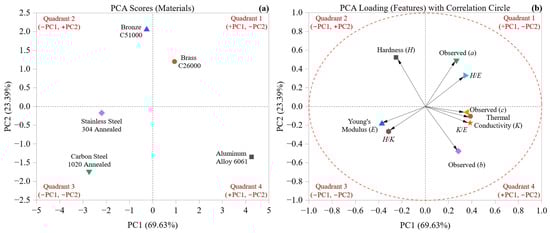
Figure 14.
(a) PCA scores for materials and (b) PCA loadings with correlation circle of properties and deformation coefficients.
Figure 14a displays a PCA score plot with four clear material groups along the PC1–PC2 axes. Aluminum 6061 is positioned at the far right in Quadrant 4 (+PC1, −PC2), due to its high thermal conductivity and low stiffness, which emphasizes its unique thermal–mechanical properties. Brass C26000 appears in Quadrant 1 (+PC1, +PC2), showing a mix of plasticity and moderate stiffness. Bronze C51000, with the highest PC2 value (2.06), is distinctly located in Quadrant 2, underscoring its high plastic deformation and moderate thermal resistance. Both Stainless Steel 304 and Carbon Steel 1020 are found in the negative PC1 region, in Quadrants 3 and 4, respectively, due to their high stiffness and limited thermal diffusion. Stainless Steel, having the lowest scores on both PCs, indicates a profile characterized by rigidity and minimal deformation sensitivity.
These spatial arrangements are clarified by the contributions shown in Figure 14b, where the correlation circle illustrates the direction and strength of each descriptor. Vectors near the boundary of the unit circle have a greater impact on the overall variance. The vector for thermal conductivity (PC1 = +0.388, PC2 = −0.105) points positively along PC1, indicating a strong association with Aluminum. In contrast, Young’s modulus (−0.373, −0.184) and hardness (−0.251, +0.523) are directed toward the negative PC1 area, aligning closely with Stainless and Carbon steels, which confirms their stiffness-dominated characteristics.
The three deformation coefficients also exhibit a clear spatial pattern. The nonlinear term a and intercept c both tend toward Quadrant 2 (+PC2), correlating with Bronze and Brass, which feature higher nonlinearity and initial compliance. Conversely, the slope coefficient b has a negative projection along PC2 (–0.476), distinguishing it from the others and indicating a different mechanistic pathway, more similar to Aluminum’s deformation rate than to its initial or nonlinear responses. This directional separation illustrates that different deformation modes cluster along unique physical axes in PCA space.
Among the non-dimensional indices, H/E (0.344, 0.330) and k/E (0.385, −0.175) stand out as significant anchors along PC1, highlighting their importance as indicators of stiffness, thermal, and mechanical properties. The opposing directions of H/k (−0.315, −0.267) confirm that thermal conductivity plays a role in reducing deformation, particularly when hardness is the primary resistance.
Figure 14a,b together provide a clear, physically based explanation of the deformation mechanisms that determine material response. The PCA space not only differentiates alloys based on their main thermomechanical characteristics but also identifies which features have the strongest multivariate influence on their deformation behavior. These findings highlight the importance of stiffness- and conductivity-weighted descriptors as key predictive indicators, while the deformation coefficients (a, b, c) reflect direction-dependent mechanical behaviors. Overall, this multivariate visualization enhances both the clarity of classification and the interpretive depth of the entire modeling approach.
7. Discussion
The present modeling strategy surpasses traditional, material-specific curve-fitting methods by establishing a unified, property-based approach to predict deformation caused by machining. Unlike earlier empirical models that view deformation as directly linked to machining parameters, this framework considers the force–displacement behavior as a result of the material’s thermomechanical properties. This shift from reactive to predictive property-driven modeling represents a notable improvement in both accuracy and physical understanding.
The deformation coefficients, including nonlinear curvature a, load sensitivity b, and baseline intercept c, showed explicit dependencies on inherent material properties. Thermal conductivity (k) was the primary factor affecting the nonlinear coefficient a, with materials having low conductivity (such as steels) experiencing more thermal softening due to localized heating, which leads to increased nonlinear deformation. In contrast, Brinell hardness (HB) primarily affects the linear slope coefficient b, controlling the initiation of plastic strain as the applied force increases. The intercept term c, though less predictable, was strongly linked to compliance and micro-yielding effects during initial contact and was notably sensitive to both hardness and Young’s modulus (E).
The intercept term c reflects setup-dependent influences, such as fixture compliance, tool and workpiece alignment, chucking-induced preload, and early thermal drift, that occur prior to the development of significant cutting forces. These effects are extrinsic to the material and therefore cannot be predicted reliably from intrinsic properties alone, which explains the comparatively lower R2 and higher error metrics observed for this coefficient. Accordingly, c should be interpreted as a configuration-specific offset rather than a material-governed parameter, and applications requiring high-accuracy absolute deformation predictions may require per-setup calibration of this term.
A key innovation of this framework is its use of non-dimensional composite descriptors, specifically the ratios H/E, H/k, and k/E. These combined indices offer mechanistic insights beyond what individual properties can provide. High H/E ratios correlate with elevated a and c values, suggesting that materials with strong resistance to elastic strain also tend to accumulate preload deformation, likely due to reduced elastic recovery. Materials with low k/E ratios, such as steel alloys, exhibit increased a and b, indicating that poor thermal diffusivity worsens deformation under increasing load. Conversely, Aluminum 6061, with a high k/E ratio, consistently displays the lowest deformation coefficients across all regimes, demonstrating effective thermal regulation and elastic stiffness.
The quadratic δ(F) representation and the associated log-linear regressions for the deformation coefficients provide a compact and interpretable surrogate for the smooth force–deformation behavior observed in the present experiments. However, this formulation imposes structural assumptions that may not hold in machining regimes involving significantly different force levels, feeds, speeds, tool geometries, or lubrication conditions. Moreover, dynamic mechanisms such as strain-rate sensitivity, transient thermal gradients, and evolving tool–chip interactions are not explicitly accounted for and may introduce nonlinearities beyond the scope of this surrogate model. Accordingly, the present framework should be viewed as valid within the operating window sampled in this study, while broader machining conditions may require model extension or more detailed mechanistic or data-driven approaches.
The present framework relies on three bulk properties, Brinell hardness, thermal conductivity, and Young’s modulus, to construct a compact and interpretable regression model. These properties were selected because they are widely available and reflect aggregate effects of the underlying microstructure. However, important microstructural factors such as grain size, phase fractions, prior work hardening, crystallographic texture, and residual stresses are not explicitly represented, and their omission may limit the model’s fidelity for materials whose deformation behavior is strongly microstructure-driven. Accordingly, the current formulation should be viewed as a foundational, extensible framework, with future work aimed at incorporating microstructural descriptors once a sufficiently broad dataset is available to support their inclusion.
Principal component analysis (PCA) further supported the findings by confirming the structural coherence of the deformation-property space. The first two principal components accounted for over 93% of the total variance, indicating that the dataset has a low-dimensional yet physically meaningful nature. The loading plot showed an orthogonal separation between stiffness- and conductivity-weighted features, relating to different deformation behaviors: curvature (a), slope (b), and offset (c). The PCA score plot clearly clustered the alloys: Aluminum was distinct due to its high conductivity and low modulus, while carbon and stainless steels grouped closely because of their high stiffness and low thermal conductivity. Copper-based alloys appeared in intermediate PCA zones, reflecting their moderate thermal and mechanical properties.
The present regression framework is intentionally material-property-driven, with cutting speed, feed rate, depth of cut, tool geometry, and lubrication held constant to isolate the influence of intrinsic material parameters. Consequently, the framework is formulated within a specific operating window defined by the experimental conditions of this study. Application to other machining regimes, particularly those characterized by pronounced strain-rate effects, transient thermal gradients, or tool-geometry-dependent interactions, may require additional calibration or incorporation of process-dependent descriptors. Future extensions of the framework will focus on integrating such variables to enable coupled material-process prediction and broader machining-parameter optimization.
These findings demonstrate that deformation in CNC turning isn’t merely random or material-specific, but follows a structured, generalizable pattern within a thermomechanical space that can be physically interpreted. The unified modeling approach, which relies solely on accessible material properties, offers significant practical benefits. It enables predictive transferability of behavior across different materials without requiring separate calibrations for each, thereby supporting simulation-driven process design, adaptive control, and digital twin integration in Industry 4.0 settings.
All deformation coefficient data points in Figure 10, Figure 11 and Figure 12 fall within the 95% confidence intervals of their regression models, providing strong statistical validation. This confirms that the linear relationships between deformation coefficients and the proposed non-dimensional material ratios (H/E, k/E, and H/k) are reliable. The consistent results across different property domains suggest that these models are both statistically robust and physically meaningful, making them well-suited for predicting behaviors in various metallic alloys.
The unified deformation model developed in this study is based on five metallic alloys selected to span a broad range of thermomechanical behavior; however, the statistical generalizability of the regression exponents is constrained by the size and composition of this dataset. Materials such as titanium alloys, nickel-based superalloys, tool steels, and heat-treated microstructures may exhibit deformation mechanisms not fully represented in the present sample. Accordingly, the model should be viewed as an extensible foundation rather than a universal predictor, and extrapolation beyond the studied material classes should be performed with caution or supported by additional calibration as more materials are incorporated.
In summary, the proposed framework offers both theoretical and practical benefits: it consolidates empirical deformation trends within a clear physical model, introduces understandable composite descriptors for better predictive insight, and confirms the deformation-property relationship via dimensionality reduction. These contributions position the model as a reliable and scalable tool for deformation-aware machining optimization across diverse material systems.
8. Conclusions
This study introduces a comprehensive, physics-based, and empirically validated modeling framework that predicts machining-induced deformation in metallic alloys using only their inherent thermomechanical properties. It redefines deformation behavior in terms of cutting force, described through three coefficients: curvature (a), slope (b), and intercept (c). These coefficients are modeled as multivariate functions of Brinell hardness, thermal conductivity, and Young’s modulus, removing the need for customized experimental fitting. The outcome is a unified, accurate, and interpretable predictive tool that is broadly adaptable to diverse alloy systems.
The model not only identified how each property subtly affects the behavior but also explained the physical mechanisms behind deformation. Thermal conductivity was the main factor reducing nonlinear displacement, as it helps dissipate heat and lessen thermal softening. Hardness determined how quickly the material deformed under load, while Young’s modulus affected the material’s flexibility before it engaged. These results go beyond simple empirical formulas, providing a basis grounded in the thermomechanical principles of material behavior during cutting.
A key contribution of this work is the introduction of non-dimensional ratios, H/E, k/E, and H/k, as predictors that capture combined mechanical and thermal responses. These ratios effectively distinguish different material classes and showcase consistent monotonic trends across all deformation coefficients. Using such compact, dimensionless descriptors simplifies the complex behavior of materials, enabling the model to generalize more reliably across various materials and conditions while reducing the need for extensive data.
The application of principal component analysis validated the internal consistency of the deformation–property space. By capturing over 93% of the total variance in a two-dimensional subspace, PCA revealed that the deformation behavior of metallic alloys exists on a low-dimensional yet physically meaningful manifold. This dimensionality reduction supports enhanced interpretability, material clustering, and deformation-aware decision-making in process planning and alloy selection.
This modeling framework bridges physical insight with data efficiency. It is scalable, requiring only tabulated material data; transferable, applicable across diverse alloy classes without retraining; and extensible, ready for integration with machining simulations, optimization routines, or intelligent manufacturing platforms. By linking thermophysical descriptors directly to deformation outcomes with minimal computational and experimental overhead, the framework advances the vision of predictive, intelligent, and sustainable manufacturing.
Looking forward, the model can be extended to account for time-dependent effects such as strain rate sensitivity and dynamic thermal gradients, as well as multidimensional deformation patterns arising from complex tool–material interactions. Future integration with machine learning algorithms or digital twin environments could further enhance predictive capabilities, enabling real-time control and adaptive process optimization grounded in material-aware deformation modeling.
Author Contributions
Conceptualization, M.S.A.; methodology, M.S.A.; software, M.S.A. and S.A.B.; validation, M.S.A. and S.A.B.; formal analysis, M.S.A. and S.A.B.; investigation, S.A.B.; resources, M.S.A.; data curation, S.A.B.; writing—original draft preparation, M.S.A.; writing—review and editing, S.A.B.; visualization, M.S.A.; supervision, M.S.A.; project administration, M.S.A. All authors have read and agreed to the published version of the manuscript.
Funding
This research received no external funding.
Institutional Review Board Statement
Not applicable.
Informed Consent Statement
Not applicable.
Data Availability Statement
The original contributions presented in this study are included in the article. Further inquiries can be directed to the corresponding author.
Acknowledgments
The author gratefully acknowledges Umm Al-Qura University, Makkah, Saudi Arabia, for providing the facilities and resources that supported the successful completion of this research.
Conflicts of Interest
The author declares no conflicts of interest.
Abbreviations
The following abbreviations are used in this manuscript:
| CNC | Computer Numerical Control |
| δ | Total axial deformation |
| HB | Brinell Hardness |
| k | Thermal Conductivity |
| E | Young’s Modulus |
| H/E | Hardness-to-Stiffness Ratio |
| k/E | Conductivity-to-Stiffness Ratio |
| H/k | Hardness-to-Conductivity Ratio |
| R2 | Coefficient of Determination |
| MAE | Mean Absolute Error |
| RMSE | Root Mean Square Error |
| a | Nonlinear Deformation Coefficient |
| b | Load-Sensitive Deformation Coefficient |
| c | Intercept Coefficient |
| PC | Principal Component |
| PCA | Principal Component Analysis |
| μ | Mean |
| σ | Standard Deviation |
References
- Gutakovskis, V.; Gerins, E.; Naginevicius, V.; Gudakovskis, V.; Styps, E.; Sertvytis, R. Adaptive Control for the Metal Cutting Process. Int. J. Eng. Res. Afr. 2020, 51, 1–7. [Google Scholar] [CrossRef]
- Wang, C.; Ghani, S.B.C.; Cheng, K.; Rakowski, R. Adaptive smart machining based on using constant cutting force and a smart cutting tool. Proc. Inst. Mech. Eng. Part B J. Eng. Manuf. 2013, 227, 249–253. [Google Scholar] [CrossRef]
- Li, E.; Zhou, J.T.; Yang, C.-Y.; Zhao, J.; Li, Z.; Zhang, S.; Wang, M. Part machining deformation prediction based on spatial-temporal correlation learning of geometry and cutting loads. J. Manuf. Process. 2023, 92, 397–411. [Google Scholar] [CrossRef]
- Mao, J.; Zhao, M.; Wei, X.; Zhang, L. A material constitutive model-based prediction method for flank milling force considering the deformation of workpiece. J. Manuf. Process. 2022, 84, 403–413. [Google Scholar] [CrossRef]
- Tausendfreund, A.; Frerichs, F.; Stöbener, D.; Fischer, A. Experimental validation of workpiece deformation simulations by means of rigorous boundary condition analysis. Procedia CIRP 2022, 108, 341–345. [Google Scholar] [CrossRef]
- Hao, X.; Li, Y.; Yinghao, C.; Liu, C.; Xu, K.; Tang, K. A time-varying geometry modeling method for parts with deformation during machining process. J. Manuf. Syst. 2020, 55, 15–29. [Google Scholar] [CrossRef]
- Wilson, E.K. Predicting microstructural evolution based on deformation history of A230 alloy using a finite element method-assisted generative model. Mater. Sci. Eng. A-Struct. Mater. Prop. Microstruct. Process. 2022, 854, 143852. [Google Scholar] [CrossRef]
- Ellis, R.J.; Liu, S.; Lin, M.; Wang, X.; Wang, X.; Fu, Y.; Ren, X.; Zhang, Z.; He, J. A framework for predicting the local stress-strain behaviors of additively manufactured multiphase alloys in the sequential layers. Mater. Sci. Eng. A-Struct. Mater. Prop. Microstruct. Process 2021, 832, 142367. [Google Scholar] [CrossRef]
- Felder, S.; Kopic-Osmanovic, N.; Holthusen, H.; Brepols, T.; Reese, S. Thermo-mechanically coupled gradient-extended damage-plasticity modeling of metallic materials at finite strains. Int. J. Plast. 2022, 148, 103142. [Google Scholar] [CrossRef]
- Antók, D.; Fekete, T.; Tatár, L.; Bereczki, P.; Kocsó, E. Evaluation Framework for Tensile Measurements, based on Full-Field Deformation Measurements and Digital Twins. Procedia Struct. Integr. 2022, 37, 796–803. [Google Scholar] [CrossRef]
- Muhammad, W.; Brahme, A.; Ibragimova, O.; Kang, J.; Inal, K. A machine learning framework to predict local strain distribution and the evolution of plastic anisotropy & fracture in additively manufactured alloys. Int. J. Plast. 2021, 136, 102867. [Google Scholar] [CrossRef]
- Sevier, M.; Yang, H.T.Y.; Lee, S.; Chandrasekar, S. Severe Plastic Deformation by Machining Characterized by Finite Element Simulation. Metall. Mater. Trans. B-Process Metall. Mater. Process. Sci. 2007, 38, 927–938. [Google Scholar] [CrossRef]
- Paturi, U.M.R.; Narala, S.K.R.; Kakustam, S. Investigations on the effects of different constitutive models in finite element simulation of machining. Mater. Today Proc. 2018, 5, 25295–25302. [Google Scholar] [CrossRef]
- Stupnytskyy, V.; Hrytsay, I. Simulation Study of Cutting-Induced Residual Stress. In Advances in Design, Simulation and Manufacturing II, Proceedings of the 2nd International Conference on Design, Simulation, Manufacturing: The Innovation Exchange, DSMIE-2019, Lutsk, Ukraine, 11–14 June 2019; Ivanov, V., Trojanowska, J., Machado, J., Liaposhchenko, O., Zajac, J., Pavlenko, I., Edl, M., Perakovic, D., Eds.; Lecture Notes in Mechanical Engineering; Springer: Cham, Switzerland, 2020. [Google Scholar] [CrossRef]
- Ahamed, E.; Samal, P.K.; Suresh, B.S.; Kemparaju, H.R. Artificial Neural Network-Based Prediction of Cutting Parameters from Tool Vibration and Forces. In Advances in Smart Grid Automation and Industry 4.0, Proceedings of the ICETSGAI4.0, Ranchi, India, 5–9 December 2019; Reddy, M.J.B., Mohanta, D.K., Kumar, D., Ghosh, D., Eds.; Lecture Notes in Electrical Engineering; Springer: Singapore, 2021; Volume 693. [Google Scholar] [CrossRef]
- Kosarac, A.; Mladjenovic, C.; Zeljkovic, M.; Tabakovic, S.; Knezev, M. Neural-Network-Based Approaches for Optimization of Machining Parameters Using Small Dataset. Materials 2022, 15, 700. [Google Scholar] [CrossRef] [PubMed]
- Khandelwal, S.; Basu, S.; Patra, A. A Machine Learning-based surrogate modeling framework for predicting the history-dependent deformation of dual phase microstructures. Mater. Today Commun. 2021, 29, 102914. [Google Scholar] [CrossRef]
- Wijesinghe, K.; Wanni, J.; Kholgade Banerjee, N.; Banerjee, S.; Achuthan, A. Characterization of microscopic deformation of materials using deep learning algorithms. Mater. Des. 2021, 208, 109926. [Google Scholar] [CrossRef]
- Alsoufi, M.S.; Bawazeer, S.A. Predictive Modeling of Surface Integrity and Material Removal Rate in Computer Numerical Control Machining: Effects of Thermal Conductivity and Hardness. Materials 2025, 18, 1557. [Google Scholar] [CrossRef] [PubMed]
- Alsoufi, M.S.; Bawazeer, S.A. Probabilistic Analysis of Surface Integrity in CNC Turning: Influence of Thermal Conductivity and Hardness on Roughness and Waviness Distributions. Machines 2025, 13, 385. [Google Scholar] [CrossRef]
- Alsoufi, M.S. A Dual-Mean Statistical and Multivariate Framework for Machinability Evaluation in CNC Turning: Gradient and Stiffness Analysis Across Five Materials. Materials 2025, 18, 2952. [Google Scholar] [CrossRef] [PubMed]
Disclaimer/Publisher’s Note: The statements, opinions and data contained in all publications are solely those of the individual author(s) and contributor(s) and not of MDPI and/or the editor(s). MDPI and/or the editor(s) disclaim responsibility for any injury to people or property resulting from any ideas, methods, instructions or products referred to in the content. |
© 2025 by the authors. Licensee MDPI, Basel, Switzerland. This article is an open access article distributed under the terms and conditions of the Creative Commons Attribution (CC BY) license.