Abstract
Vertical axial-flow pumps with bidirectional passages are widely used in applications requiring flow reversal. However, their unique inlet geometry often leads to asymmetric impeller inflow conditions. This study investigates the internal flow behavior and pressure pulsation characteristics of a vertical bidirectional axial-flow pump under design, critical stall, and deep stall conditions using unsteady Reynolds-averaged Navier–Stokes simulations combined with Fast Fourier Transform and wavelet analysis. Results show that the pump reaches peak efficiency at the design point, with critical and deep stall occurring at 0.6 Qdes and 0.5 Qdes, respectively. The head at the deep stall condition shows a further drop of 7.51% compared to the critical stall condition. This progressive performance degradation is attributed to vortex-induced blockage: it initiates with the intensification of the tip leakage vortex and evolves into large-scale separation vortices covering the suction surface under deep stall—a mechanism distinctly influenced by the bidirectional inlet’s stagnant water zone. Inlet asymmetry, reflected by a normalized velocity coefficient (Vn) below 0.6 in the stagnant water zone under design flow, is partially mitigated during stall due to flow confinement. Pressure pulsations at the blade leading edge are dominated by the blade passing frequency (BPF), with amplitudes under critical stall about 3.2 times those at design conditions. At the impeller outlet, critical stall produces a mixed dominant frequency (shaft frequency and BPF), whereas deep stall yields the highest pulsation amplitude (BPF ≈ 4.8 × the design value) resulting from extreme passage blockage. These findings clarify how bidirectional-inlet-induced vortices modulate stall progression and provide theoretical guidance for enhancing the operational stability of such pumps under off-design conditions.
1. Introduction
The vertical bidirectional axial-flow pump enables bidirectional pumping operation through the controlled opening and closing of gate as shown in Figure 1. It is widely employed in irrigation and drainage systems along coastal and riverine areas [1,2]. However, the unique configuration of its bidirectional flow passage tends to promote the formation of large-scale vortices on the gate-closed side, resulting in a localized “stagnant water zone” [3,4]. This region not only degrades the inflow conditions to the impeller but, more critically, shifts the system’s critical stall point toward higher flow rates. Under stall conditions, the vortical structures shed from the stagnant water zone induce pronounced transient pressure pulsations [5]. These intense fluctuations are a primary driver of flow instability, component vibration, and even blade fatigue cracking. Therefore, a thorough transient analysis of vortex-induced pressure pulsations in vertical bidirectional axial-flow pumps under stall conditions—aimed at elucidating their generation mechanisms and propagation behavior—holds significant engineering and academic value for enhancing operational reliability and extending the stable operating range of this pump type.
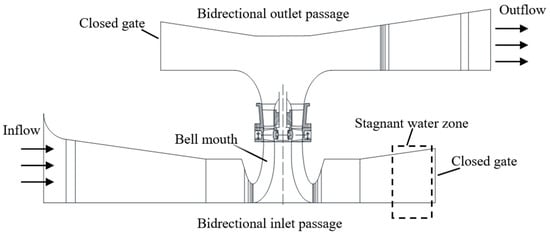
Figure 1.
Simplified sketch of the vertical axial-flow pump with bidirectional passage.
The continuous advancement of computer technology has established Computational Fluid Dynamics (CFD) as a fundamental methodology for elucidating the internal flow field structures in pumps, with widespread application in the study of unsteady flow phenomena [6,7]. Unsteady Reynolds-averaged Navier–Stokes (URANS) simulations have proven particularly effective in capturing critical flow features, including the evolution of stall precursor vortices, propagation patterns of rotating stall cells, and the complex interactions between tip leakage vortices and stall flow structures [8]. Representative studies demonstrate the methodology’s capabilities: Wang et al. [9] successfully predicted the internal flow field in marine centrifugal pumps with transition modeling, identifying two distinct hump regions (0.2–0.3 Qdes and 0.5–0.6 Qdes) in the performance curve, thereby providing enhanced computational strategies for stall analysis. Zhao et al. [10] employed Pressure Propulsion Power and Lamb Vector Divergence to track the spatial evolution of stall development, revealing through enstrophy analysis that small-scale stall vortices contribute significantly to energy dissipation. Complementing these findings, Shi et al. [11] demonstrated that stator gap leakage flow in full-flow pumps destabilizes the impeller inlet, increasing turbulent entropy production and shifting the critical stall point toward higher flow rates. Building upon these theoretical insights, researchers have developed optimization strategies for stall suppression, such as Ji’s findings [12,13] that strategic tip clearance enlargement promotes more uniform energy distribution in leakage regions, while Bulge_Tip and Double_Rib_Tip geometries effectively reduce turbulent kinetic energy dissipation, collectively shifting both critical and deep stall points toward lower flow rates. Despite these advances, current research on stall flow fields remains predominantly focused on unidirectional intake passages with relatively uniform inflow conditions [14,15], leaving a significant research gap in understanding the transient interference effects between strong nonlinear vortices induced by dead zones in vertical bidirectional intake passages and their impact on stall development.
Pressure pulsation serves as the most direct and critical dynamic indicator of internal flow instability in pumping systems [16]. The choice of signal processing methodology is therefore crucial for elucidating the underlying mechanisms of strongly non-stationary stall-induced flow phenomena. Conventional frequency-domain analysis can effectively identify the dominant spectral components of pressure fluctuations [17,18]. For instance, Li et al. [19] detected sub-synchronous dominant frequencies in pump-turbine draft tubes and components induced by rotor-stator interaction, while Dai et al. [20] reported that the blade passing frequency dominates at the impeller inlet of a bidirectional axial flow pump, with a higher amplitude under reverse operation. However, such methods cannot resolve the temporal evolution of spectral characteristics during large-scale vortex development. This limitation has motivated the adoption of time-frequency analysis techniques, particularly continuous wavelet transform, whose superior time-frequency localization capabilities have proven valuable for characterizing strongly nonlinear pressure pulsations [21]. Representative applications include Shi et al.’s [22] identification of intermittent broadband effects at variable-speed pump inlets and persistent narrowband shaft-frequency components at guide vane exits, Ni et al.’s [23] demonstration of how staggered blade configurations disrupt rotor-stator interaction patterns through pulsation energy dispersion, and Lu et al.’s [24] tracking of cavitation-induced frequency modulation where blade-passing and shaft frequencies alternate as dominant components. Despite these methodological advances, the systematic application of time-frequency analysis to decode the spectral evolution throughout the stall process in vertical bidirectional axial-flow pumps—particularly under the influence of dead zone vortices—remains an open research challenge. Such investigation is essential for reconstructing the complete physical transition from localized vortex disturbance to global instability, especially when correlating specific pressure pulsation components with vortex dynamics through integrated CFD and signal analysis.
This study investigates the transient interference effect of the stagnant water zone within a vertical bidirectional inlet channel on the development of stall flow. Using unsteady Reynolds-averaged Navier–Stokes (URANS) simulations, the characteristics and internal flow field of a vertical bidirectional axial-flow pump are analyzed under design and stall conditions. The spatial distribution and evolution of pulsating energy induced by the stagnant water zone during stall are visually examined. By applying Fast Fourier Transform (FFT) and continuous wavelet transform (CWT) to dynamic pressure signals, the time-frequency behavior of the internal flow is systematically resolved. The key novelty of this work lies in establishing, for the first time, a dynamic correlation mechanism between the vortical structures inside the stagnant zone of the bidirectional inlet channel and the pressure pulsations at specific monitoring locations. The findings provide theoretical support for enhancing operational stability and facilitating the application of vertical bidirectional axial-flow pump systems.
2. Research Methods
2.1. Three-Dimensional Model
The investigated model comprises a vertical bidirectional axial-flow pump system, consisting of bidirectional inlet and outlet passages, an impeller, and guide vanes. The impeller is equipped with 4 blades and has a hub diameter of 144 mm, while the guide vane assembly contains 7 blades with a hub diameter of 136 mm. The bidirectional flow passages are configured with valves on both sides. During operation, the valve on the active side remains open, while the opposite valve is closed. As no flow occurs behind the closed valve, this section is omitted in the 3D model, as illustrated in Figure 2. The pump operates at a rotational speed of 1325 rpm, with design parameters including a flow rate of 292 L/s, a head of 6.2 m, and an efficiency of 77%.
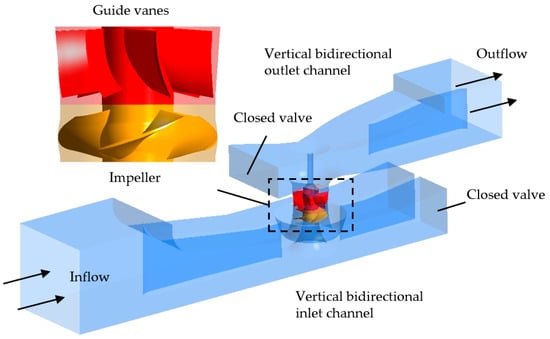
Figure 2.
Three-dimensional model of the vertical bidirectional axial-flow pump.
2.2. Numerical Simulation
The unsteady Reynolds-averaged Navier–Stokes (URANS) equations were employed as the governing equations [25]. For Reynolds stress closure, the SST k-ω turbulence model was adopted due to its improved performance in predicting flows with strong adverse pressure gradients and moderately intense vortical structures [26]. This model combines the accuracy of the k-ω formulation near the wall with the robustness of the k-ε model in the far field and incorporates a shear-stress transport (SST) limiter to better capture separated and stalled flows. The inlet boundary was specified as a mass-flow inlet, while the outlet was treated as an opening with prescribed static pressure and direction. All solid walls were modeled as hydraulically smooth with no-slip conditions [27]; the wall roughness for the impeller and guide vanes was set to 0.0125 mm, and that for the bidirectional inlet and outlet channels to 0.05 mm, in accordance with experimental processing standards. The impeller domain was defined as a rotating zone, and all other components as stationary. Interfaces between stationary components were configured as “None”, and the rotor-stator interface was modeled using the Transient Rotor Stator method [28,29]. The impeller rotational speed was set to 1325 rpm, and the numerical time step was set to 0.000377358 s, corresponding to a 3° rotation per step [30]. The total simulated physical time was 0.45283 s, equivalent to 10 full impeller revolutions.
The computational domain, illustrated in Figure 3, comprises four principal hydraulic components. Each component is discretized using structured hexahedral grids to accurately resolve the evolution of stall vortices. The near-wall regions in all components are refined with boundary layer grids. The Y+ value, defined as the dimensionless wall distance, is a critical parameter in turbulence modeling that indicates whether the near-wall mesh is fine enough to resolve the viscous sublayer or whether wall functions can be applied appropriately [31,32]. For the SST k-ω model employed in this study, a Y+ value between 30 and 300 on hydraulically smooth walls is generally recommended to ensure accurate wall-function treatment while maintaining computational efficiency. In the present simulation, the average Y+ values for the inlet channel, impeller, guide vanes, and outlet channel are 7.3, 26.3, 17.6, and 23.2, respectively. The maximum Y+ on the impeller and guide vanes remain below 71 and 75, respectively. These values lie within the recommended range and ensure that the near-wall resolution is sufficient to capture key vortical structures such as the tip-leakage vortex and corner vortices, which are essential for predicting stall inception and progression. The detailed Y+ distributions for these two components are provided in Figure 4. A grid independence analysis, summarized in Figure 5, shows that once the total number of grid nodes exceeds 6,082,587, the variation in pump head and efficiency remains within 1.5% and 0.4%, respectively, confirming mesh adequacy. Accordingly, the final grid consists of 1,603,404, 1,111,116, 1,992,200, and 1,375,867 nodes for the bidirectional inlet channel, impeller, guide vanes, and bidirectional outlet channel, respectively.
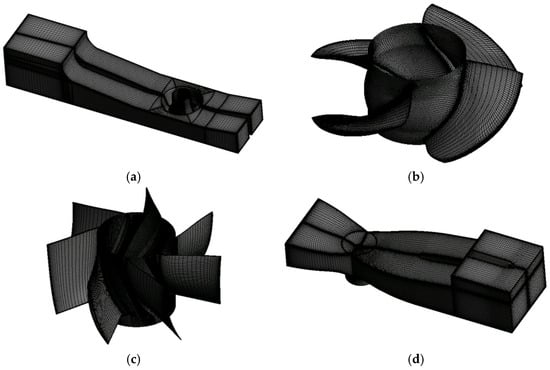
Figure 3.
Grid division of (a) inlet channel, (b) impeller, (c) guide vanes and (d) outlet channel.
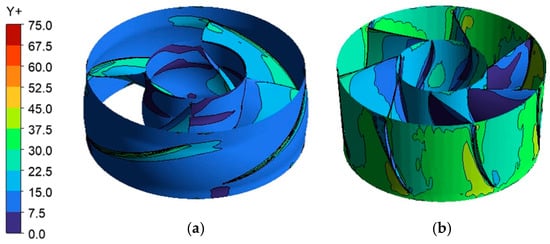
Figure 4.
Y+ distribution of (a) Impeller and (b) Guide vanes.
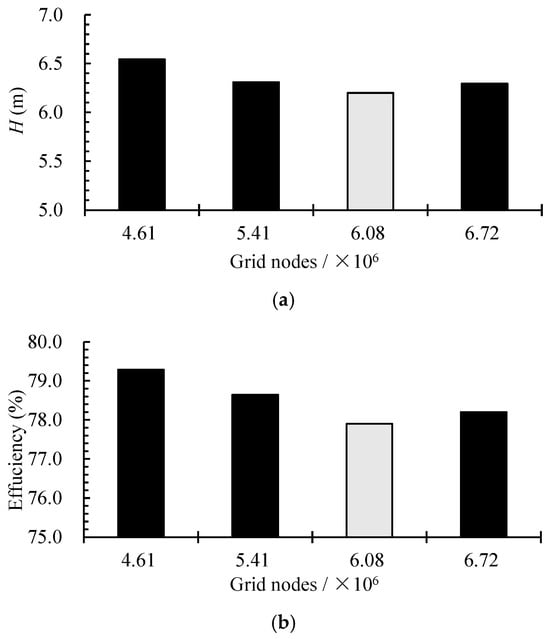
Figure 5.
Grid independence analysis of (a) head and (b) efficiency at the design condition.
3. Test Verification
To validate the reliability of the numerical simulations, a vertical closed-loop test rig was constructed for hydraulic performance measurements of the bidirectional axial-flow pump, as illustrated in Figure 6. The test facility features a two-level structure with upper and lower layers. The upper level, situated 3.1 m above the reference plane, is equipped with a JCL2 intelligent torque and speed sensor (range: 500 N‧m, uncertainty: <0.1%) for shaft torque measurement and input power calculation. A Yokogawa EJA intelligent differential pressure transmitter (range: 0–25 m, uncertainty: <0.1%) is used to determine the pump head. This level also houses two high-pressure tanks and one low-pressure tank to stabilize the inflow and outflow conditions, thereby ensuring measurement accuracy for the inlet and outlet pressures. The lower level, located at −2.6 m, incorporates a German Cologne intelligent electromagnetic flowmeter (uncertainty: 0.2%) for monitoring the operational flow rate.
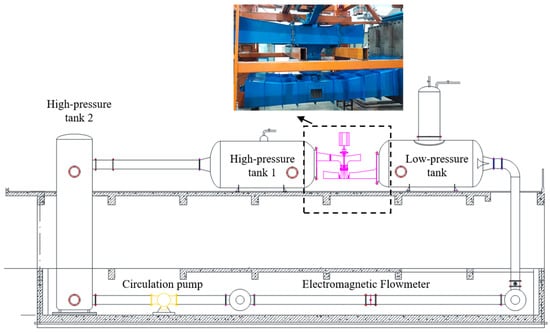
Figure 6.
Schematic of the vertical bidirectional axial-flow pump test bench.
Figure 7 compares the simulated and measured characteristic curves (head and efficiency) of the bidirectional axial-flow pump. The numerical predictions align well with the experimental data. Both efficiency curves peak at the design flow rate (292 L/s). The stall region is characterized by a falling head curve with decreasing flow, where the onset and minimum head define the critical and deep stall points, respectively. The simulated critical and deep stall points occur at 0.6 Qdes and 0.5 Qdes, closely matching the corresponding experimental values of 0.58 Qdes and 0.48 Qdes. The maximum relative errors remain within 9% for head (near critical stall) and 10% for efficiency (near deep stall). These discrepancies are within typical engineering tolerances for such pump studies and are likely attributable to known limitations of the URANS approach and the SST k-ω model in strongly separated and rotating stall flows, as well as to simplifications in boundary condition setup—factors also reported in comparable works on stall analysis in axial-flow machines [33]. The agreement confirms that the mesh resolution, turbulence model, and boundary conditions are adequate for capturing the main flow features and performance trends in the present study.
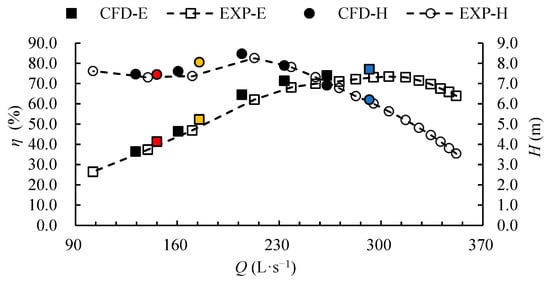
Figure 7.
Comparison of simulated and test performance curves. (The deep stall point, critical stall point, and design point are marked in red, yellow, and blue, respectively.).
4. Results and Discussion
Building on the validated numerical model that accurately predicts the experimental performance curve and stall points, this section analyzes the internal flow field and pressure pulsation characteristics under design (292 L/s), critical stall (175 L/s), and deep stall (146 L/s) conditions. The aim is to reveal the underlying flow mechanisms responsible for the experimentally observed performance drop, stall point shift, and intensification of pressure pulsations.
4.1. Comparison of Internal Flow Field and Vortex Structure
To examine the influence of the stagnant water zone on the internal flow distribution and impeller inflow, horizontal cross-sectional planes were defined at various axial positions, as shown in Figure 8.
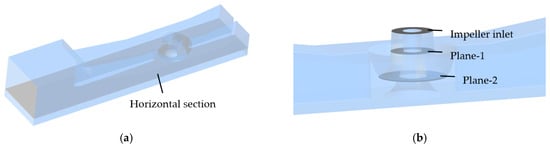
Figure 8.
(a) Horizontal cross-section and (b) axial plane defined in the vertical bidirectional inlet channel.
Figure 9 presents the velocity distribution (contour and vectors) in the horizontal cross-section of the vertical bidirectional inlet channel. To quantitatively evaluate the flow uniformity under different operating conditions, the normalized velocity coefficient Vn (defined in Equation (1)) is adopted, where Vn > 1 and Vn < 1 correspond to high- and low-speed regions, respectively. The results reveal a high-speed zone on the inlet side and an extensive low-speed region (stagnant water zone) adjacent to the closed gate. This flow pattern persists even under the design condition, indicating that the stagnant water zone is an inherent feature of the geometric configuration rather than being operation-dependent. Although the fluid enters circumferentially from below the bell mouth, the velocity distribution at its central section exhibits clear non-axisymmetry, reflecting notable inflow non-uniformity. Specifically, the velocity remains lower on the stagnant water zone side and higher on the opposite side. Interestingly, as stall develops and intensifies, the flow distribution near the bell mouth becomes more uniform. This improvement is attributed to the flow blockage caused by vortical structures within the impeller, which restricts the main passage flow and diverts more fluid toward the original low-velocity region, thereby partially mitigating the velocity disparity.
where is the relative velocity, and is the average relative velocity of the plane in which it is located.
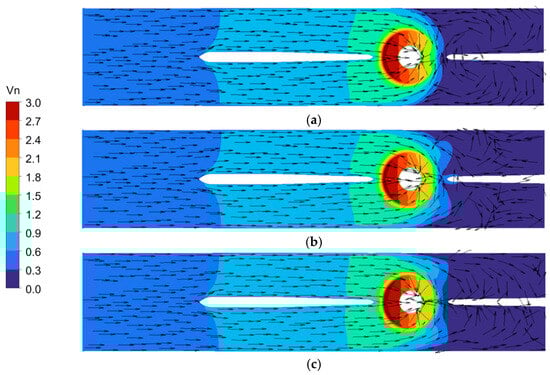
Figure 9.
Flow streamlines and velocity contours on the horizontal plane of the vertical bidirectional inlet channel under (a) design (292 L/s), (b) critical stall (175 L/s), and (c) deep stall (146 L/s) condition.
To examine the influence of the stagnant water zone on impeller inflow under various operating conditions, Figure 10 illustrates the distribution of the normalized velocity coefficient at different axial positions. The analysis indicates that in axial planes located farther from the impeller, where the pre-swirl effect is minimal, the velocity distribution exhibits typical stagnation interference characteristics—a distinct low-speed zone on one side and a high-speed zone on the other. As the observation plane approaches the impeller, the pre-swirl effect intensifies and gradually becomes the dominant mechanism, displacing the influence of the stagnant water zone. This effect drives high-speed fluid to diffuse toward the low-speed region, ultimately resulting in a nearly axisymmetric velocity profile at the impeller inlet. Notably, the onset of stall conditions modulates the degree of flow asymmetry without altering the fundamental distribution pattern. As stall develops, the increased flow resistance through the impeller particularly suppresses the transport capacity in the original high-speed zone. This suppression weakens the velocity gradient between the high-speed and stagnant regions, thereby alleviating the overall flow asymmetry while still preserving the basic spatial pattern of higher velocities near the inlet side and stagnation near the gate side.
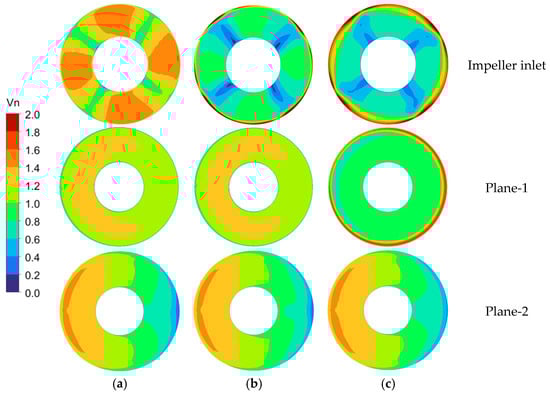
Figure 10.
Distribution of the normalized velocity coefficient at various axial positions of the inlet bell mouth under (a) design (292 L/s), (b) critical stall (175 L/s), and (c) deep stall (146 L/s) condition.
To further investigate the impact of the stagnant water zone-induced effect on the energy characteristics of the axial flow pump, the total entropy generation rate is adopted as the hydraulic evaluation index, and its calculation formula is shown below:
where and represent indirect entropy production rate and direct entropy production rate. denotes the time-averaged velocity components in the i (x, y, and z) directions of the Cartesian coordinate system. and are the density and turbulent dissipation rate, respectively.
Figure 11 presents the distribution of total entropy generation within the flow passage section at different axial positions. The results reveal a clear evolution in both the location and extent of high-entropy regions. At cross-sections far from the impeller, a pronounced high-entropy zone is localized near the stagnant water area, primarily due to flow separation and intense shear layers that dissipate mechanical energy. As stall conditions initiate and intensify, the reduced flow rate weakens these shear interactions, causing this high-entropy area to gradually diminish. Moving axially closer to the impeller, the influence of the stagnant zone subsides, and the impeller’s pre-swirl effect becomes dominant. This leads to significantly elevated entropy generation around the hub, especially at the inlet section, resulting from enhanced viscous dissipation in the sheared flow. With the onset and progression of stall, increased flow instability and secondary flows also generate a distinct high-entropy region near the shroud. Ultimately, under the developed stall conditions, the combined effects from both hub and shroud regions cause high entropy generation to spread across nearly the entire cross-section.
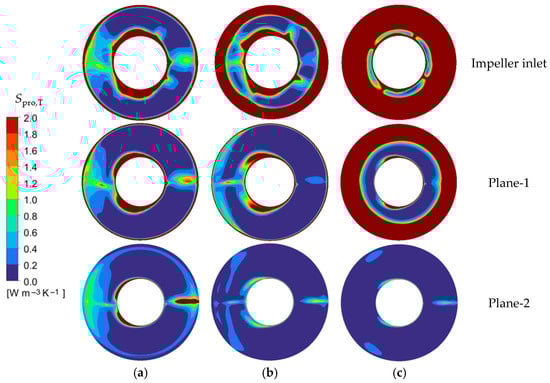
Figure 11.
Distribution of the total entropy production at various axial positions of the inlet bell mouth under (a) design (292 L/s), (b) critical stall (175 L/s), and (c) deep stall (146 L/s) condition.
Figure 12 illustrates the radial distribution of axial velocity at the impeller inlet section under different operating conditions and the radial coefficient R* was defined as Equation (2). Under design conditions, the axial velocity decreases near the hub (R* = 0–0.05) due to wall effects and in the tip region (R* = 0.95–1.00) owing to tip leakage flow, while maintaining uniformity across the mid-span regions, indicating stable inflow. As the pump enters the critical stall condition, the velocity deficit zone expands radially inward to R* = 0.8–1.0, reflecting the enhanced blockage effect induced by the tip leakage vortex, though the main flow region remains largely unaffected. Under deep stall conditions, the low-velocity region further extends to R* = 0.5–1.0, whereas velocities in the hub region (R* = 0.0–0.5) remain comparable to those under design conditions. This behavior results from large-scale stall vortices formed by the interaction of secondary flow and tip leakage, which significantly obstruct the blade tip and mid-span flow passages. Consequently, despite the reduced operating flow rate, the effective through-flow area diminishes even more drastically, leading to concentrated flow and sustained high axial velocity in the hub region.
where is the calculated radius, and are the hub and shroud radius, respectively.
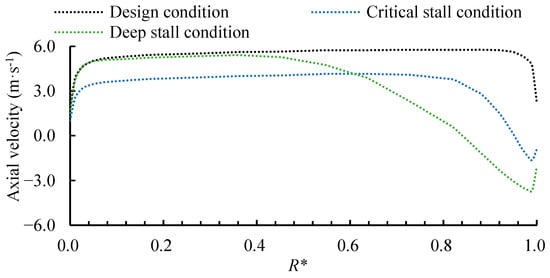
Figure 12.
Radial distribution of axial velocity at the impeller inlet under design, critical stall, and deep stall conditions.
The λ2-criterion is based on the negative eigenvalues of the pressure Hessian matrix and physically corresponds to identifying regions of local pressure minima induced by rotational motion. It more rigorously excludes interference from strong shear flows and is therefore better suited for clearly identifying vortex cores within the complex shear background flow of blade passages. Figure 13 depicts the three-dimensional vortex structures within the impeller under three operating conditions, identified using the λ2-criterion. Under design conditions, the tip leakage flow generates discontinuous spiral vortices, while localized wake vortices form at the blade trailing edges. As the pump transitions into the critical stall condition, the tip leakage vortices evolve into coherent cylindrical structures, the wake vortices expand significantly, and distinct corner vortices emerge in the hub region. Under deep stall conditions, the tip leakage vortices saturate spatially, occupying the entire tip gap region. Simultaneously, the blade wake vortices extend further toward the leading edge, and the hub corner vortices propagate circumferentially. These results systematically reveal the spatial evolution of the vortex structures during the transition from design to deep stall conditions.
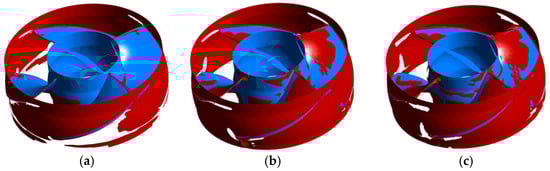
Figure 13.
Vortex structures inside the impeller identified by the λ2-criterion under (a) design (292 L/s), (b) critical stall (175 L/s), and (c) deep stall (146 L/s) condition.
Building upon the previously described evolution of vortical structures, the progressive development and expansion of three-dimensional vortex systems—including tip leakage vortices, wake vortices, and hub corner vortices—directly induces redistribution of blade loading as stall initiates and deepens. This redistribution substantially modifies the work capacity of the blades, consequently manifesting as the characteristic S-shaped head curve in pump performance. To quantitatively elucidate the underlying mechanism of blade work capacity variation, Figure 14 presents the static pressure coefficient Cp (defined as Equation (6)) distributions over the blade surface under three operating conditions, where the lower and upper profiles represent the suction and pressure surfaces, respectively. Under design conditions, the pressure differential between the two surfaces remains moderate, with the maximum difference located in the streamwise range of 0–0.25. As the pump enters critical stall, the pressure on the suction surface within this region drops markedly due to the local low-pressure zone induced by intensified tip leakage and wake vortices. Meanwhile, the pressure surface experiences elevated pressure resulting from increased incidence angle, collectively leading to a significant rise in blade loading. Under deep stall, however, the pressure surface remains stable, while large-scale separation vortices covering the suction surface weaken the suction effect of tip leakage, causing static pressure recovery and an overall reduction in the pressure differential. This evolution of static pressure distribution clearly reveals the inherent correlation between blade load variation and enhanced flow instability under stall conditions.
where P denotes the pressure on the blade, vu is the circumferential velocity and ρ means the density.
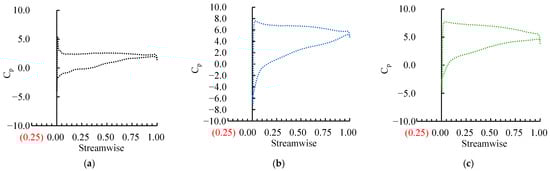
Figure 14.
Blade surface static pressure coefficient under (a) design (292 L/s), (b) critical stall (175 L/s), and (c) deep stall (146 L/s) condition.
Building upon the previously established vortex evolution patterns, the blade tip, hub, and mid-span regions emerge as the three primary locations experiencing the most pronounced vortex structure modifications. To clarify the evolution of vortex intensity under different operating conditions, Figure 15 presents the vorticity distribution across an unrolled cylindrical surface at three characteristic radial positions (R* = 0.95, 0.50, 0.05). In the tip region (R* = 0.95), as operation shifts from design to critical stall, an extensive high-vorticity zone appears around the blade leading edge and inlet area, primarily resulting from the intensified tip leakage vortex and enhanced local flow separation. With further progression to deep stall, this high-vorticity region becomes more concentrated near the blade leading edge, indicating both migration and stabilization of the leakage vortex core. In the mid-span region (R* = 0.50), the overall vorticity level decreases as stall develops, while the wake vortex zone continues to expand, suggesting a shift in the dominant flow mechanism from small-scale turbulence to large-scale separation structures. Near the hub (R* = 0.05), the blade wake vortex area progressively enlarges with stall severity, while the high-vorticity region in the mid-passage gradually contracts. This pattern demonstrates how the hub corner vortex and associated secondary flow systems increasingly dominate the local flow spectrum during stall development, thereby suppressing the formation and growth of other turbulent structures.
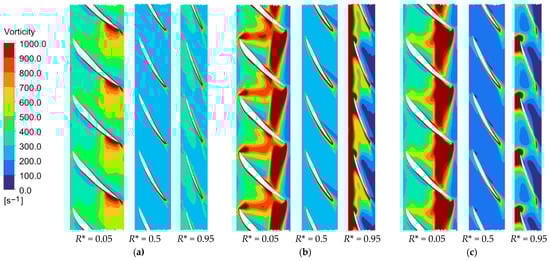
Figure 15.
Vorticity distribution on the unwrapped cylindrical surface of the impeller at (a) design (292 L/s), (b) critical stall (175 L/s), and (c) deep stall (146 L/s) condition.
4.2. Pressure Pulsation Characteristics and Their Correlation with Vortex Dynamics
Based on the analysis of internal vortex structures and flow field patterns presented in Section 4.1, the morphological and intensity variations in blade wake vortices, tip-leakage vortices, and leading-edge shedding vortices are identified as the most prominent features across different operating conditions—particularly during the transition from design to critical and deep stall. Given the significant role of vortex evolution in flow instability, this study examines its influence on pressure pulsation characteristics by arranging multiple monitoring points at key positions, including the impeller inlet, outlet, and the tip region (Figure 16). These probes capture the time–frequency behavior of pressure pulsations under varying operational states, enabling a systematic correlation between unsteady vortex dynamics and hydraulic response. Among them, points B1, B2, and B3 are located in the gap between the impeller and guide vanes, while A1, A2, and A3 are situated near the blade leading edge.
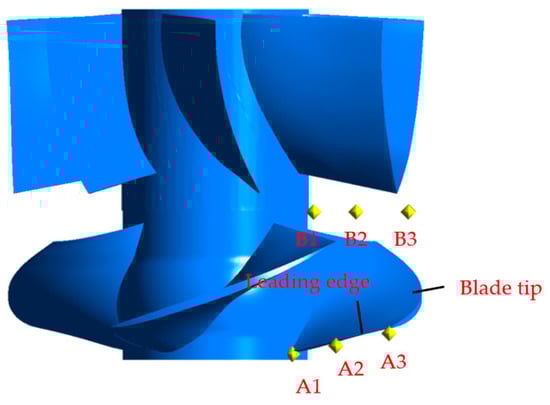
Figure 16.
Layout of pressure monitoring points at the impeller leading edge and the impeller-guide vane interface.
Figure 17 presents the time-domain pressure pulsation signals at monitoring points within the blade leading-edge region during the last two complete impeller revolutions, while Table 1 provides the corresponding peak-to-peak values at points A1–A3 under different operating conditions. The results reveal a consistent pattern of four distinct peaks and four troughs within each rotation cycle, which corresponds directly to the periodic interaction between the four impeller blades and the surrounding flow field. It is noteworthy that under the same operating condition, the peak-to-peak values at the three monitoring points follow the order A3 > A2 > A1. Specifically, compared to A1, the values at A3 increase by 84.2%, 127.6%, and 96.5% under the design, critical stall, and deep stall conditions, respectively. This highlights the intensified pressure oscillations and enhanced flow instability induced by the unsteady tip-leakage vortex in this region. A comparison across different operating conditions shows that the peak-to-peak pressure pulsations under both critical and deep stall are significantly higher than those under the design condition, indicating that the evolution of vortex structures during stall generally amplifies the dynamic response of the system. However, further analysis reveals that the pulsation amplitude under deep stall is actually lower than that under critical stall. This phenomenon can be attributed to the extreme flow blockage developed in the blade leading-edge region during deep stall: large-scale stall vortices severely restrict the effective flow passage area, resulting in a substantial reduction in through-flow. The decreased flow rate subsequently weakens the overall hydrodynamic energy and pressure oscillation intensity, leading to the observed attenuation in pressure pulsation amplitude.
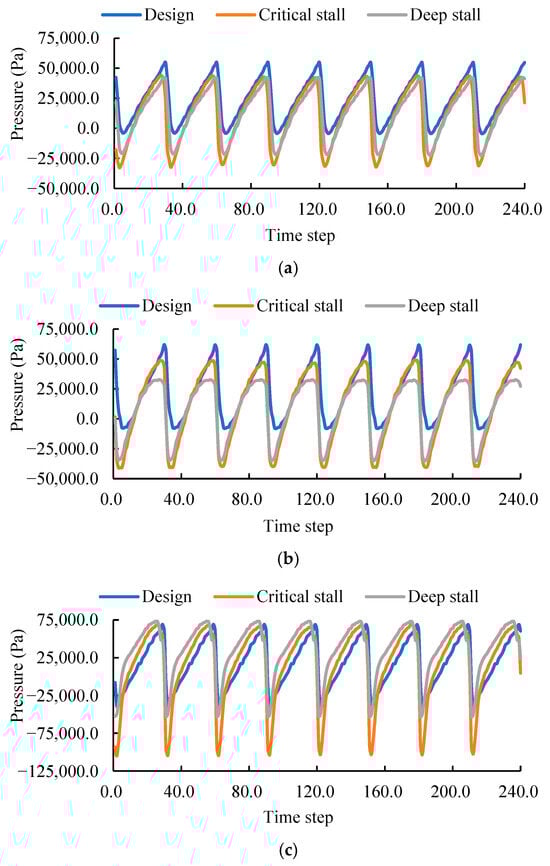
Figure 17.
Time-domain pressure pulsations at the blade leading edge under three operating conditions: (a) point A1, (b) point A2, and (c) point A3.

Table 1.
Peak-to-peak pressure pulsation amplitude at monitoring point A1, A2 and A3 under three conditions.
Figure 18 illustrates the time-domain pressure pulsation characteristics at monitoring points in the impeller outlet region during the last two rotation cycles. The results indicate a stable periodic pattern of four clear peaks and troughs per rotation cycle, corresponding to the four impeller blades, with Table 2 listing the specific peak-to-peak values at points B1–B3 under various operating conditions. Under both design and critical stall conditions, the highest peak-to-peak value occurs at monitoring point B2, while the lowest is observed at B3, suggesting that the mixing between wake vortices and the main flow predominantly takes place in the mid-span region. Compared to B3, the peak-to-peak value at B2 increases by 70.3% and 77.3% under design and critical stall conditions, respectively. Under deep stall conditions, the peak-to-peak amplitudes at monitoring points B1, B2, and B3 increase progressively from the hub to the blade tip. This indicates that the strong interaction between the tip leakage flow and the blade wake vortices serves as the primary mechanism responsible for the radial intensification of flow instability in this region.
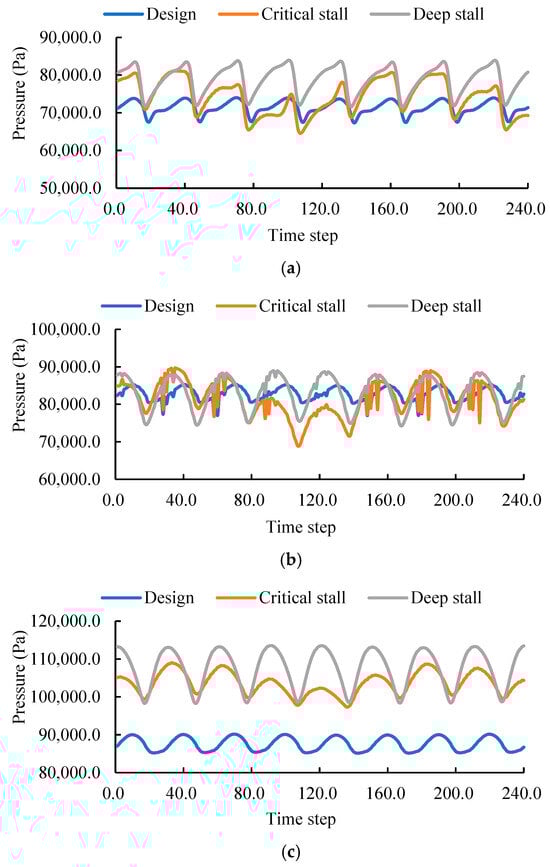
Figure 18.
Time-domain pressure pulsations at the impeller outlet under three operating conditions: (a) point B1, (b) point B2, and (c) point B3.
Table 2.
Peak-to-peak pressure pulsation amplitude at monitoring point B1, B2 and B3 under three conditions.
Figure 19 presents the frequency-domain characteristics of pressure pulsations at the blade leading edge under three operating conditions, with Table 3 providing the corresponding maximum dominant frequency amplitudes at each monitoring point. The results indicate that the dominant frequencies at all monitoring points are locked to the blade passing frequency (BPF) and its harmonics. Notably, the amplitudes of these spectral components increase progressively from the hub toward the blade tip. Under the design, critical stall, and deep stall conditions, the dominant frequency amplitude at point A3 is 69.3%, 81.1%, and 63.8% higher than that at point A1, respectively. Under stall conditions, although the large-scale stall cell rotates at a frequency lower than the shaft frequency, it periodically sweeps through each blade passage. This global disturbance, which is fixed relative to the blade count, synchronously modulates the load on each blade, fundamentally explaining the significant energy increase observed at the BPF and its harmonics. A comparison across different operating conditions reveals that the BPF amplitudes at all three monitoring points follow the order: critical stall > deep stall > design condition. This behavior can be attributed to the intense development stage of the tip-leakage vortex and local flow separation under critical stall, where periodic vortex shedding and interaction are most pronounced, leading to highly concentrated pressure pulsation energy at the BPF. Under deep stall, although the separated flow region expands, the evolution of vortex structures tends toward lower frequencies and becomes more globally distributed. Consequently, part of the high-frequency pulsation energy is dissipated, resulting in a lower BPF amplitude compared to the critical stall condition. Under the design condition, the BPF amplitude remains the lowest due to the relatively stable flow and the absence of large-scale unsteady vortex structures.
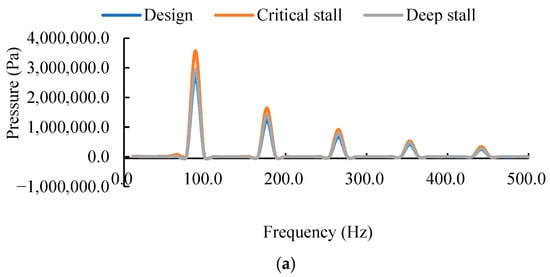
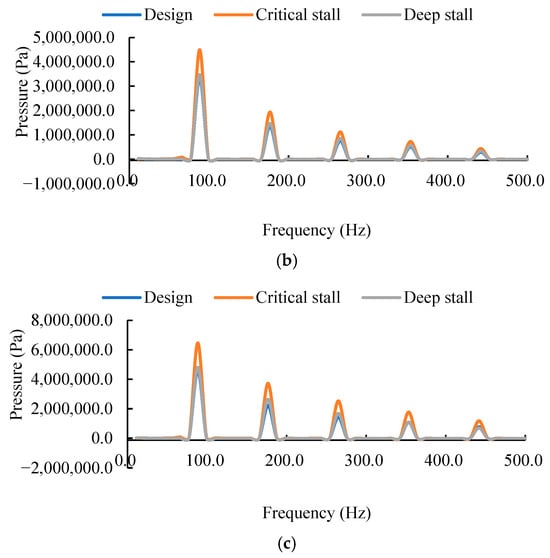
Figure 19.
Frequency-domain pressure pulsations at the blade leading edge under three operating conditions: (a) point A1, (b) point A2, and (c) point A3.
Table 3.
Fundamental frequency amplitude at monitoring point A1, A2 and A3 under three conditions.
Figure 20 shows the frequency-domain characteristics of pressure pulsation at the impeller outlet monitoring points under three operating conditions, with Table 4 listing the maximum dominant frequency amplitudes at points B1, B2, and B3 under different operating conditions. Analysis indicates that the dominant frequency components under the critical stall condition include the shaft frequency, blade passing frequency, and their harmonics, whereas the design and deep stall conditions primarily exhibit the blade passing frequency and its harmonics. This difference arises because, under critical stall, the combined effect of the tip-leakage vortex and the rotating stall cell excites low-frequency disturbances synchronized with the shaft, while also coupling with high-frequency components generated by periodic flow around the blades. Under the design condition, the flow remains relatively stable, while during deep stall, the shaft frequency component is masked due to the dominance of large-scale stall structures. Across all operating conditions, the dominant frequency amplitude increases from the hub to the tip, which is mainly attributed to the most significant interference between the clearance leakage flow and the wake vortex in the blade tip region, leading to a radial increase in unsteady flow energy. Compared to point B1, the dominant frequency amplitude at point B3 increases by 26.1%, 57.8%, and 73.4% under the design, critical stall, and deep stall conditions, respectively.
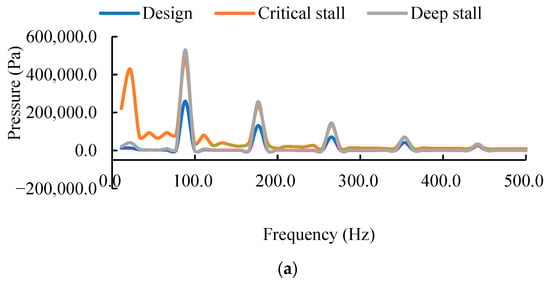
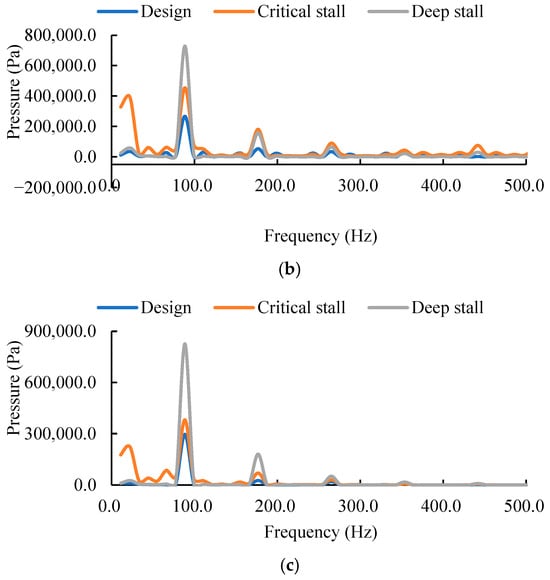
Figure 20.
Frequency-domain pressure pulsations at the impeller outlet under three operating conditions: (a) point B1, (b) point B2, and (c) point B3.
Table 4.
Fundamental frequency amplitude at monitoring point B1, B2 and B3 under three conditions.
The Short-Time Fourier Transform (STFT) suffers from inherent trade-offs between temporal and spectral resolution due to its fixed analysis window. In contrast, the Continuous Wavelet Transform (CWT) employs a scalable time-frequency window, making it more effective at identifying transient events like stall inception and vortex shedding, along with tracking their frequency evolution. This adaptability renders CWT particularly suitable for analyzing non-stationary stall signals. As the highest pulsation amplitude occurs near the blade tip, Figure 19 presents the time-frequency results at monitoring point A3 under the three operating conditions based on CWT. Since the highest amplitude of the dominant frequency occurs near the blade tip region, Figure 21 presents the time–frequency distributions at monitoring point A3 under the three operating conditions. As shown, the dominant frequency bands under all three conditions are concentrated near the blade passing frequency (BPF = 4 × shaft frequency). Among them, the critical stall condition exhibits the widest frequency bandwidth and the highest amplitude. It can also be observed that under all three conditions, the dominant frequency shows a slight upward trend over time, which may be attributed to minor rotational speed fluctuations or evolving flow instabilities. Figure 22 displays the time–frequency distributions at monitoring point B3 under the three operating conditions. Compared with Figure 21, the amplitude of the dominant frequency is significantly lower. Under deep stall, however, the frequency band is the widest and its amplitude reaches the maximum. This can be explained by the large-scale, high-energy stall vortices prevailing at the impeller outlet in deep stall, which generate strong pressure fluctuations while also distributing energy over a broader frequency range due to their chaotic nature. In addition, it is evident that the dominant frequency remains stable over time without significant variation, indicating that the excitation mechanism at the impeller outlet is relatively steady compared to the leading edge region.
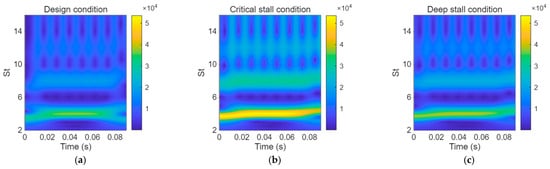
Figure 21.
Wavelet Time-Frequency Plot of point A3 under (a) design condition, (b) critical condition and (c) deep stall condition.
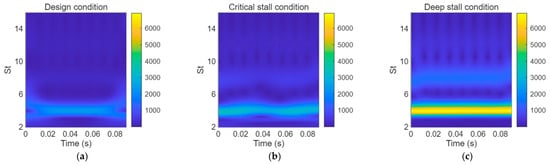
Figure 22.
Wavelet Time-Frequency Plot of point B3 under (a) design condition, (b) critical condition and (c) deep stall condition.
5. Conclusions
This study employs unsteady Reynolds-averaged Navier–Stokes simulations combined with FFT and CWT analysis to investigate the flow field structure and pressure pulsation characteristics of a vertical bidirectional axial-flow pump under design, critical stall, and deep stall conditions. The main findings are summarized as follows:
- (1)
- The performance drop is quantifiably governed by vortex-induced blockage. The pump achieves its peak efficiency at the design operating point. Critical stall and deep stall occur at flow rates of 0.6 Qdes and 0.5 Qdes, respectively. A further head drop of 7.51% is observed from the critical to the deep stall condition, which is primarily attributed to the progressive intensification of internal flow blockage.
- (2)
- The inherent inlet asymmetry actively modulates the stall process. A significant stagnant water zone is formed on the closed side of the gate in the inlet channel, resulting in an asymmetric distribution of flow velocity at the inlet of the horn tube. As stall occurs, the decrease in flow area forces the fluid to flow through the original low-speed zone, which to some extent weakens this asymmetry.
- (3)
- A hierarchical vortex evolution defines the stall progression. The intensification of stall first enhances the clearance vortex between the blade tips, causing a decrease in the axial velocity at the inlet, followed by significant development of the inlet vortex and wake vortex. Under deep stall conditions, the suction surface is covered by large-scale separation vortices, which suppress the suction effect of blade tip leakage flow, restore static pressure, and enable the blade load to reach its maximum at critical stall.
- (4)
- Pressure pulsation provides a spectral signature for diagnosing stall stages. The main frequency of pressure pulsation at the leading edge of the blade is the blade passing frequency, and the periodic shedding of the gap vortex during the critical stall time leads to its highest amplitude. The main frequency at the impeller outlet is still the blade passing frequency under design and deep stall conditions, while at critical stall, due to the formation of rotating stall clusters, the main frequency is manifested as the coexistence of shaft frequency and blade passing frequency; Under deep stall, the flow blockage intensifies, causing the pulsation amplitude to rise to its peak.
This study provides a theoretical basis for the optimized design and stable operation of vertical bidirectional axial-flow pumps. However, the turbulence model adopted here exhibits certain limitations in predicting flows with strong adverse pressure gradients, and actual inflow fluctuations during operation were not considered. Future work will introduce more refined turbulence models and experimental validation under multiple operating conditions. Drawing on insights from transient lubrication dynamics in pumps [34], subsequent research will further explore feasible optimization strategies for the bidirectional passage structure to mitigate adverse pressure gradients and enhance operational stability.
Author Contributions
Conceptualization, F.M.; methodology, F.M. and Q.H.; software, F.M., Q.H. and H.T.; validation, FM. and H.T.; formal analysis, F.M. and Y.L.; investigation, F.M. and H.T.; resources, F.M. and Y.L.; data curation, F.M. and M.G.; writing—original draft preparation, F.M.; writing—review and editing, F.M., M.G. and J.L.; visualization, F.M.; supervision, F.M.; project administration, F.M.; funding acquisition, F.M. and J.L. All authors have read and agreed to the published version of the manuscript.
Funding
This research was funded by the Open Research Subject of Key Laboratory of Fluid Machinery and Engineering (Xihua University), Sichuan Province (grant number LTJX-2025003). Changzhou Science and Technology Project, (grant number CJ20250093).
Data Availability Statement
Data is contained within the article.
Conflicts of Interest
Author Mingming Ge was employed by Suzhou Joule Smart New Energy Co., Ltd. The remaining authors declare that the research was conducted in the absence of any commercial or financial relationships that could be construed as a potential conflict of interest.
Nomenclature
The following nomenclature are used in this manuscript:
| FFT | Fast Fourier transform |
| CWT | Continuous wavelet transform |
| n | Rotation speed |
| Qdes | Design flow rate |
| E | Efficiency |
| H | Head |
| URANS | Unsteady Reynolds-averaged Navier–Stokes |
| EXP | Experiment |
| CFD | Computational fluid dynamics |
| Y+ | Dimensionless wall distance |
| Total entropy production rate | |
| Indirect entropy production rate | |
| Direct entropy production rate | |
| The time-averaged velocity components in the i (x, y, and z) directions of the Cartesian coordinate system | |
| Density | |
| Turbulent dissipation rate | |
| Vn | Normalized velocity coefficient |
| Rhub | Hub radius |
| Rrim | Rim radius |
| R* | Radial coefficient |
| Streamwise | Axial coefficient |
| Cp | Static pressure coefficient |
| BPF | Blade passing frequency |
References
- Wang, Y.; Cheng, L. Research on the flow characteristics and energy variation characteristics of the outlet passage of a two-way flow pump device based on Liutex and energy balance equation method. Energy 2025, 318, 134805. [Google Scholar] [CrossRef]
- Lu, R.; Zhang, H.Y.; Li, Y.J.; Yuan, J.P.; Xu, J.; Wang, L.Y. The effect of bell mouth height on the hydraulic characteristics of the two-way pump station based on the parameter design. Proc. Inst. Mech. Eng. Part A J. Power Energy 2022, 236, 1320–1334. [Google Scholar] [CrossRef]
- Zheng, Y.H.; Li, Y.J.; Yuan, S.Q.; Zhu, X.Y.; Wang, M.C. Improvement of energy performance of a two-way pumping station based on controllable diffusion technology. Phys. Fluids 2024, 36, 075188. [Google Scholar] [CrossRef]
- Li, Y.J.; Lu, R.; Zhang, H.Y.; Deng, F.J.; Yuan, J.P. Improvement of intake structures in a two-way pumping station with experimental analysis. Appl. Sci. 2020, 10, 6842. [Google Scholar] [CrossRef]
- Zheng, Y.H.; Li, Y.J.; Zhu, X.Y.; Yuan, S.Q.; Zhang, H.Y.; Wang, H.L. Hydraulic performance improvement of a two-way pumping station through bell mouth shape design. Phys. Fluids 2024, 36, 035119. [Google Scholar] [CrossRef]
- Lu, J.X.; Wang, Y.; Wang, B.M.; Zhou, Y.Z.; Liu, X.B.; Si, Q.R. Study on the vibration characteristics induced by rotating stall in a centrifugal pump based on improved variational mode decomposition. Flow Meas. Instrum. 2025, 102, 102761. [Google Scholar] [CrossRef]
- Ye, C.L.; An, D.S.; Huang, W.R.; Heng, Y.G.; Zheng, Y. Investigation on stall characteristics of centrifugal pump with guide vanes. Water 2023, 15, 21. [Google Scholar] [CrossRef]
- Wang, H.; Li, Y.; Kong, Y.; Zhang, S.; Niu, T. Unsteady study on the influence of the angle of attack of the blade on the stall of the impeller of the double-suction centrifugal pump. Energies 2022, 15, 9528. [Google Scholar] [CrossRef]
- Wang, H.; Li, Y.B.; Kong, Y.S.; Zhang, S.F.; Niu, T. Investigation on stall characteristics of marine centrifugal pump considering transition effect. Ocean Eng. 2023, 280, 114823. [Google Scholar] [CrossRef]
- Zhao, Z.Z.; Song, W.W.; Jin, Y.X.; He, L. Numerical study on flow stall and kinetic energy conversion of low-specific-speed centrifugal pump. Phys. Fluids 2023, 35, 044104. [Google Scholar]
- Shi, L.J.; Jiang, Y.H.; Shi, W.; Sun, Y.; Qiao, F.Q.; Tang, F.P.; Xu, T. Numerical analysis of energy loss in stall zone for full tubular pump based on entropy generation theory. J. Mar. Sci. Eng. 2023, 11, 895. [Google Scholar] [CrossRef]
- Ji, L.; Li, Y.K.; Li, W.; Li, S.; Yang, Y.F.; Yang, Y.; Li, H.M.; Agarwal, R.K. Investigation of vortex dynamics diagnosis in the stall state of mixed-flow pump with blade gap size effect. J. Braz. Soc. Mech. Sci. Eng. 2023, 45, 395. [Google Scholar] [CrossRef]
- Ji, L.L.; Li, S.; Li, W.; Huang, Y.X.; Shi, W.D.; Yang, Y.; Li, H.M.; Yang, Y.F.; Agarwal, R.K. Study on passive suppression method of rotating stall in mixed-flow pump: Using different impeller rim structures. Proc. Inst. Mech. Eng. Part A J. Power Energy 2023, 237, 965–984. [Google Scholar] [CrossRef]
- Zhou, R.; Liu, H.; Dong, L.; Ooi, K.T.; Dai, C.; Hua, R. Study on the stall vortex and vibration characteristics in multi-stage pump under natural flow condition. Phys. Fluids 2023, 35, 084117. [Google Scholar] [CrossRef]
- Zhou, R.Z.; Liu, H.L.; Dong, L.; Ooi, K.T.; Dai, C.; Hua, R.A. Unsteady Simulation and Analysis of Energy Loss Mechanism of a Vertical Volute Pump Under Stall Conditions. J. Fluids Eng. 2023, 145, 081201. [Google Scholar] [CrossRef]
- Barrio, R.; Blanco, E.; Parrondo, J.; González, J.; Fernández, J. The effect of impeller cutback on the fluid-dynamic pulsations and load at the blade-passing frequency in a centrifugal pump. J. Fluids Eng. 2008, 130, 111102. [Google Scholar] [CrossRef]
- Zhang, N.; Li, D.L.; Gao, B.; Ni, D.; Li, Z. Pressure Pulsation Characteristics of a Self-Priming Pump under Typical Operating Conditions/OL. Processes 2024, 12, 335. [Google Scholar]
- Zhou, L.; Zheng, S.; Ding, S.; Xie, C.; Liu, R. Influence of propeller on brash ice loads and pressure fluctuation for a reversing polar ship. Ocean Eng. 2023, 280, 114624. [Google Scholar] [CrossRef]
- Li, Y.P.; Hao, P.C.; Zhang, Z.C.; Zhang, L.H.; Hai, H.Y.; Zhang, H.X.; Wang, X.K.; Wang, J.R.; Zhao, Z.P.; Peng, P.J. Characterization of Pressure Pulsation Propagation in a Pump-Turbine Based on the Same-Frequency Tracking Method. Energy Sci. Eng. 2025, 13, 3588–3604. [Google Scholar] [CrossRef]
- Dai, Y.; Shi, W.; Yang, Y.; Xie, Z.; Zhang, Q. Numerical Analysis of Unsteady Internal Flow Characteristics in a Bidirectional Axial Flow Pump. Sustainability 2023, 16, 224. [Google Scholar] [CrossRef]
- Jiang, D.J.; Yang, F.; Cai, Y.P.; Xu, G.Y.; Tang, F.P.; Jin, Y. Cross influence of rotational speed and flow rate on pressure pulsation and hydraulic noise of an axial-flow pump. Phys. Fluids 2023, 35, 095144. [Google Scholar] [CrossRef]
- Shi, L.J.; Xue, M.Z.; Xu, P.F.; Guo, R.; Han, Y.; Chen, Y.Y.; Yang, Y.; Xia, W.Y. Model test and numerical simulation study on the hydraulic performance similarity theory and pressure pulsation characteristics of vertical axial flow pump device based on variable-speed and variable-angle adjustment. Energy 2025, 324, 135962. [Google Scholar] [CrossRef]
- Ni, D.; Chen, J.B.; Wang, F.F.; Zheng, Y.J.; Zhang, Y.; Gao, B. Investigation into Dynamic Pressure Pulsation Characteristics in a Centrifugal Pump with Staggered Impeller. Energies 2023, 16, 3848. [Google Scholar] [CrossRef]
- Lu, J.X.; Liu, J.H.; Qian, L.Y.; Liu, X.B.; Yuan, S.Q.; Zhu, B.S.; Dai, Y.S. Investigation of pressure pulsation induced by quasi-steady cavitation in a centrifugal pump. Phys. Fluids 2023, 35, 025119. [Google Scholar] [CrossRef]
- Liu, K.; Shi, X.; Wang, D.; Feng, Y.; Jian, Y.; Li, W. A method for the dynamic characteristic analysis of a rotor-rolling bearing system influenced by elastohydrodynamic lubrication. J. Sound Vib. 2025, 608, 119075. [Google Scholar] [CrossRef]
- Oro, J.M.F.; Perotti, R.B.; Vega, M.G.; González, J. Effect of the radial gap size on the deterministic flow in a centrifugal pump due to impeller-tongue interactions. Energy 2023, 278, 127820. [Google Scholar] [CrossRef]
- Meng, F.; Hu, Q.; Liu, J.; Li, Y.; Zhang, G.; Lu, J. Effects of Inflow Deflection Angle on the Stall Formation Mechanism and Flow Field Structure in a Vertical Axial-Flow Pump. Machines 2025, 13, 1054. [Google Scholar] [CrossRef]
- Shi, W.; Xie, B.; Ni, C.; Yu, X.; Chai, Y.; Shi, L. Numerical Simulation and Model Test on Pressure Fluctuation and Structural Characteristics of Lightweight Axial Flow Pump. Processes 2024, 12, 2369. [Google Scholar] [CrossRef]
- Meng, F.; Li, Y.; Li, M.; Ning, C. Investigation of Blade Root Clearance Flow Effects on Pressure Fluctuations in an Axial Flow Pump. Machines 2025, 13, 733. [Google Scholar] [CrossRef]
- Long, Y.; Wu, Z.G.; Zhang, M.Y.; Xu, Y. Research on the transient flow and vortex structure evolution mechanism of reactor coolant pump under non-uniform inflow. Ann. Nucl. Energy 2025, 217, 111346. [Google Scholar] [CrossRef]
- Kaya, M.N. Shock-Boundary Layer Interaction in Transonic Flows: Evaluation of Grid Resolution and Turbulence Modeling Effects on Numerical Predictions. Comput. Model. Eng. Sci. 2025, 145, 327. [Google Scholar] [CrossRef]
- Zhang, H.; Li, K.; Liu, T.; Liu, Y.; Hu, J.; Zuo, Q.; Jiang, L. Analysis the composition of hydraulic radial force on centrifugal pump impeller: A data-centric approach based on CFD datasets. Appl. Sci. 2025, 15, 7597. [Google Scholar] [CrossRef]
- Yuan, G.; Song, J.; Yang, Y.; Ni, B.; Yang, D.; Xue, Y. Experimental study on icebreaking mechanism and failure modes of submerged high-pressure water jets. Ocean Eng. 2025, 323, 120586. [Google Scholar] [CrossRef]
- Guo, H.; Li, Y.; Zhao, B.; Guo, Y.; Xie, Z.; Lu, X.; Xu, H.; Wang, M.; Morina, A. Study on Transient Lubrication of Floating Bush in High-Pressure Fuel Pump Coupling with Camshaft Bending Vibration. Tribol. Int. 2025, 215, 111357. [Google Scholar] [CrossRef]
Disclaimer/Publisher’s Note: The statements, opinions and data contained in all publications are solely those of the individual author(s) and contributor(s) and not of MDPI and/or the editor(s). MDPI and/or the editor(s) disclaim responsibility for any injury to people or property resulting from any ideas, methods, instructions or products referred to in the content. |
© 2025 by the authors. Licensee MDPI, Basel, Switzerland. This article is an open access article distributed under the terms and conditions of the Creative Commons Attribution (CC BY) license.