Abstract
Life distribution comparison is important in reliability and survival analysis to model system aging and longevity. The article develops a non-parametric hypothesis test procedure for testing exponentiality against the Used Better than Aged in Laplace transform (UBAL) family of life distributions. The test in this case is developed based on moment inequalities in the Laplace transform, which yields a computationally straightforward and theoretically sound methodology. We establish the asymptotic behavior of the test statistic and evaluate its performance through Monte Carlo simulations, showing acceptable power against common alternatives such as the Weibull, linear failure rate, and Makeham distributions. Critical values are also provided for practical use under complete and right-censored data. The usefulness of the procedure is also illustrated on real medical data sets, including leukemia, liver cancer, and lung cancer patient survival times, and COVID-19 deaths data. The results indicate the applicability and success of the proposed method in detecting deviations from exponentiality. Overall, this research contributes a handy statistical method for reliability, risk analysis, and medical survival analysis, where system aging is of the utmost importance.
Keywords:
statistical inference; family of exponential distribution; moment inequalities; UBA and UBAL classes of life distributions; medical data MSC:
62G10; 62G20; 62N05
1. Introduction
In the field of survival and reliability analysis, comparing different life distributions is essential to comprehending the longevity and behavior of diverse systems. In this context, figuring out a life distribution is “better” than another in terms of survival characteristics is one of the main issues. There are several ways to approach this comparison, such as by using stochastic ordering, which offers a way to compare the distributions based on how likely they are to fail or survive at any particular moment. Among the different stochastic orders, the Laplace ordering is particularly useful in comparing life distributions, as it captures the notion that one distribution is stochastically smaller than another if its survival function is “better” in a certain sense.
The UBAL class serves as a valuable tool in systems which show concave aging patterns particularly in medical survival data and component reliability under cumulative shocks. The UBAL model provides better flexibility and realism than traditional stochastic orders like IFR and NBUE in these cases.
Laplace ordering has been widely studied in the context of life distributions, and it has been shown to be a powerful tool for comparing the longevity of different systems. The concept of aging and its influence on reliability theory has been a fundamental topic in the field of survival analysis and life distributions. Identification and categorization of life distributions by their aging behavior are needed in engineering, medical science, and actuarial science. Among the root works are Bryson and Siddiqui [], Esary et al. [], and Barlow and Proschan [], with subsequent refinements by Navarro [] and Klefsjo []. Many studies have considered various aging classifications, such as the NBUC and NWUC proposed by Denuit []. Fernandez-Ponce et al. [] have also investigated the multivariate NBU. Furthermore, Ahmad [] examined UBA and UBAE. Abu Youssef and Bakr examined the Laplace order for UBA [].
Among the diverse methods of classification, moments inequality provides a robust framework for analyzing and comparing life distributions, offering valuable insights into their structural properties. This paper proposes a novel non-parametric approach to hypothesis testing for the UBAL class moments inequality. We aim to address the limitations of existing parametric methods by developing a flexible framework that can adapt to diverse datasets and maintain high efficiency in detecting deviations from the UBAL assumption. The proposed methodology employs moments inequality, which are computationally efficient and theoretically grounded, making them suitable for a wide range of practical applications.
Definition 1.
Let X be a non-negative random variable representing the lifetime of a device. The survival function (also known as the reliability function) is:
the mean (expected) lifetime is defined as:
Let , be the residual lifetime at time t, the mean residual life at time t is the expected remaining lifetime of a device that has already survived up to time t. Denote this as μ(t). It is given by:
Definition 2.
A random variable is smaller than a random variable with respect to Laplace transform order (denoted by ) if, and only, if
It is equivalent to
Applications, properties and interpretations of the Laplace transform order in the statistical theory of reliability, and in economics can be found in Klefsjo [], and Denuit [].
Definition 3.
Let X be a random lifetime having distribution function F, Then F is UBAL, provided that , Ɐ,
Note: is the expected remaining lifetime as time tends to infinity.
For more details, see Abu-Youssef and Bakr [].
Testing exponentiality issues against different age classes of life distributions was examined by statisticians and reliability analysts from a number of angles (see Table 1); for additional details, see Ahmad [], Bakr et al. [], Mahmoud and Al-Babtain [], Gadallah et al. [], Abu-Youssef and El-Toony [], and Bakr [,].

Table 1.
Exponential vs. NBUE vs. IFRA vs. NBUFR vs. UBAL.
The UBA and UBAE classes are being expanded by the UBAL to a larger and more useful format. Ahmad [] has described a few interpretations, attributes, and closure features of the UBAL class. According to Abu Youssef et al. [], who investigated the Laplace order for UBA, the UBAL class is maintained under the shock model. Similarly, many tests for exponentiality against certain types of life distributions have been put forth. It is commonly understood why these tests are preferred over omnibus tests for exponentiality. Consequently, it makes sense to employ tests that are well-suited to identify potential alternatives, provided one is somewhat knowledgeable about the class of distributions that could arise. Restricting the range of potential options too much could be even more harmful. This makes the use of a reasonably broad class of aging distributions a logical compromise.
In order to verify exponentiality against the UBAL class of life distributions, this work focuses on creating reliable statistical procedures. Using order statistics, moment inequalities, and other non-parametric techniques, the suggested tests seek to offer a trustworthy framework for assessing hypotheses. Both theoretical analysis and real-world applications in survival and dependability scenarios confirm the concept.
The main objective of this paper is to develop a non-parametric hypothesis test to assess whether a lifetime distribution F follows the exponential law or belongs to the broader Used Better than Aged in Laplace transform (UBAL) class. Formally, we consider the hypotheses is exponential, vs. is UBAL. The test is constructed using moment inequalities derived from the Laplace transform of leading to a statistic under , and under Thus, the paper’s aim is to:
- Derive and analyze the properties of δ(s),
- Establish its asymptotic distribution,
- Evaluate its power and efficiency through Monte Carlo simulations, and
- Demonstrate its applicability to complete and censored medical datasets.
This is the format for the remainder of the paper. The UBAL class and its defining characteristics are thoroughly described in Section 2. The theoretical underpinnings and practical application of the suggested testing approach are described in detail in the same Section. In order to assess the test’s performance, the end of Section 2 provides comprehensive Monte Carlo simulations and compares them to current techniques. The theoretical underpinnings and practical application of the suggested testing approach for censored data are described in detail in Section 3. The real-world applications discussed in Section 4 highlight the technique’s practical relevance across multiple sectors. Section 5 ends with a summary of the results and recommendations for additional study. This study offers a useful tool for researchers and practitioners alike by bridging the gap between theoretical developments and practical applicability. It also contributes to continuing attempts to improve nonparametric testing methods for complicated aging classes.
2. Moment Inequalities
For the proposed class, the moments inequality is given by the following result. The existence and finiteness of all moments are assumed in following the results.
Theorem 1.
Let X be a random lifetime possessing finite moments for any r = 1, 2, …. Consider , and has the UBAL property; then for all non-negative integer and ,
Proof.
If has the UBAL property, then from (1), we have
where
Since
and
Then the result follows.
If , then Equation (2) reduces to
This result is useful in applications such as reliability engineering and survival analysis, where moment-based characterizations are often needed for incomplete or censored data. The inequality can also be used as a diagnostic tool to test for deviations from exponentiality and to validate UBAL assumptions in empirical datasets. □
2.1. Testing Hypothesis Procedure
The exponential distribution’s simplicity and memoryless nature make it a key component of survival analysis and reliability theory. However, more generic classes of life distributions are required to accurately simulate aging processes since real-world lifetime statistics frequently depart from exponential behavior. UBAL is a generalization of this class of life distributions. This class includes components or systems that have certain aging traits that are more complex than those that exponentiality can explain.
There are important theoretical and practical ramifications to test exponentiality against the UBAL class. Theoretically, it sheds light on whether the exponential model is suitable for characterizing a particular data set, which is important in situations where exponentiality is frequently taken for granted. Practically speaking, these tests are essential in dependability analysis since knowledge of a system’s aging characteristics can affect risk assessment, maintenance plans, and resource allocation.
The UBAL class includes a broad range of life distributions with aging characteristics different from the exponential distribution and is distinguished by its concave order attributes and correlations in Laplace transform order. Determining whether a data set supports exponentiality or more closely conforms to the UBAL framework is the goal of hypothesis testing for this class. Special statistical problems arise from this, especially when the data show small departures from exponentiality.
Fernández-Ponce and Rodríguez-Grinolo [] introduced nonparametric tests for exponentiality against aging alternatives, using stochastic ordering and residual life functions, providing foundational methodology for aging analysis. Abu-Youssef et al. [] proposed nonparametric tests tailored for the UBAL class, focusing on comparing survival functions using Laplace transform ordering, which is directly related to the current paper’s theoretical base. Bakr [] developed tests for exponentiality based on generalized aging classes and examined their efficiency in detecting departures from exponential life distributions. Mahmoud et al. [] studied moment inequalities and provided characterizations of specific life distribution classes using transform techniques, enriching the theory behind classes like UBAL. Abu-Youssef et al. [] introduced and studied the class of life distributions “used better than aged” in mgf ordering. It also developed statistical tests within this framework, highlighting performance comparisons under various aging structures.
We develop a test statistic according to Theorem 1 and to test the null hypothesis is exponential, vs. is UBAL; the measure of departure can be written as
If , then reduces to
It is worth noting that under and and under .
The empirical estimator of the test statistic can be computed using the following:
and the following represents the appropriate invariant test statistic:
where
This equation defines the invariant test statistic δₙ(s), which adjusts the empirical estimator to account for scale invariance. It incorporates a weighted sum involving the observed data Xᵢ, an exponential component, and correction terms to ensure robustness under the null and alternative hypotheses.
The following theorem establishes the asymptotic normality of the proposed test statistic.
Theorem 2.
Let be the test statistic defined in Equation (7). Under the null hypothesis H0, and using the theory of U-statistics as presented in Lee [], the statistic satisfies:
where the asymptotic variance under H0 is given by:
where is given from Equation (8) at i =1.
Proof.
Directly calculating, we can obtain as:
as well as the variance
The variance under is given by:
Thus, under , the variance is given by Equation (9). □
2.2. Relative Efficiency
The Pitman Asymptotic Relative Efficiency (PARE) is a measure used to compare the performance of two statistical tests based on their asymptotic properties. Specifically, it evaluates the relative efficiency of one test with respect to another under local alternatives. In this context, PAE refers to the Pitman asymptotic efficiency of our proposed test statistic compared to other well-established tests. A higher PAE value indicates a more powerful test under small deviations from the null hypothesis.
To assess the quality of the recommended test method, we can compare our test to a few other well-known classes. For the (RNBUL) class of life distribution, we employ the test put forward by Mahmoud et al. [], and for the (NBUFR) class of life distribution, we employ as proposed by Mahmoud and Abdul Alim []. Then, comparisons are made using the Pitman asymptotic relative efficiency (PARE). Here, we will employ the following choices.
The LFR, Makeham, and Weibull distributions have been used as alternatives for the exponential model. (See Figure 1 and Figure 2).
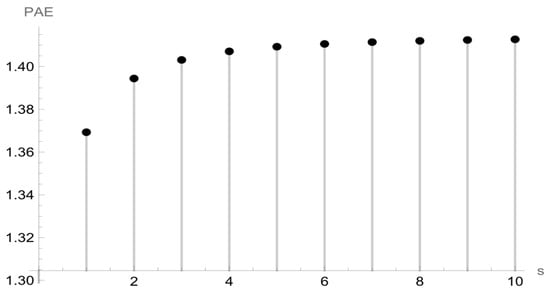
Figure 1.
The relationship between PAE and s for LFR.
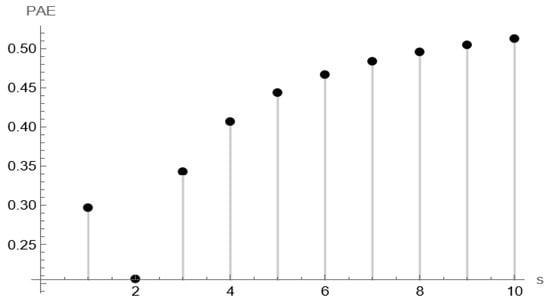
Figure 2.
The relationship between PAE and s for Makeham.
- (i)
- PAE in case of the LFR distribution:
When
When ,
- (ii)
- PAE in case of the Makeham distribution.
When
When 4.125,
Figure 1, Figure 2 and Figure 3 illustrate how the Pitman Asymptotic Efficiency (PAE) of the proposed test varies with the parameter s under the LFR and Makeham alternatives, respectively. The curves show that the efficiency is sensitive to the choice of s, with moderate values of s providing stable and relatively high efficiency across both models. This confirms that s can be tuned to capture specific departures from exponentiality, while values around s = 5–10 appear to be robust choices in practice.
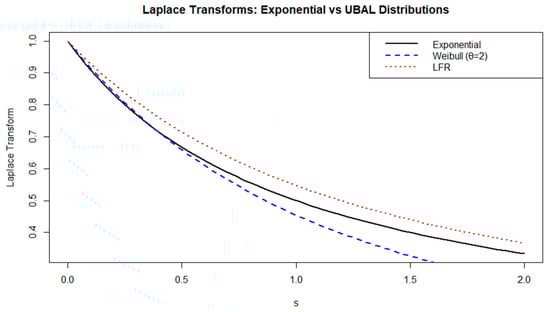
Figure 3.
Comparing the Laplace transforms of the exponential, Weibull (UBAL case), and LFR distributions.
Table 2 summarizes the direct computations of PAE of , and our .
Table 2.
PAE of , and .
The efficiencies in the table clearly demonstrate that our test performs well for , which denote the cumulative distribution functions corresponding to the LFR, and Makeham survival models, respectively.
PARE’s of and concern with respect to and whose PAEs are listed in Table 2, are displayed in Table 3.
Table 3.
PARE of and concerning and .
Table 3 shows that for LFR, and Makeham, the statistics and perform well.
2.3. Power Estimates
The power of the suggested test will be assessed using Table 4 and Table 5 at a significance level of 0.05 and 0.01. These powers were determined using 10,000 simulated samples with n = 10, 20, and 30 for the Weibull, LFR, and Makeham distributions.
Table 4.
Power estimates at .
Table 5.
Power estimates at .
2.4. Critical Values
Here, we compute the test statistic of our test as s = 5 and s = 10 provided in (2.6) for a few chosen values of s using 10,000 simulations with sample sizes n = 5(5)100 from the usual exponential distribution (See Table 6 and Table 7).
Table 6.
The critical values of .
Table 7.
The critical values of .
Table 6 and Table 7, along with Figure 4 and Figure 5, show how the asymptotic normality of our test improves as the value of s decreases for sample sizes n = 5, 10, 15, …, 100.
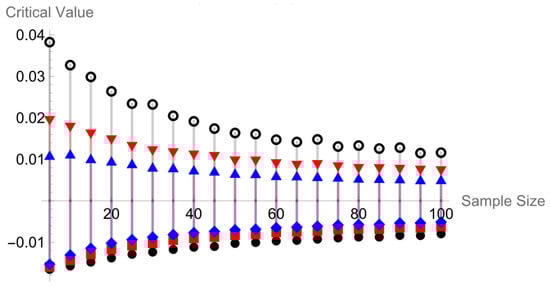
Figure 4.
The Relation Between n and critical values at s = 5.
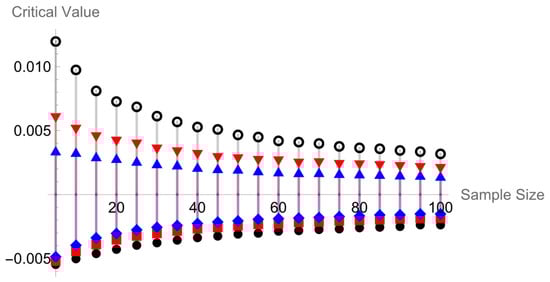
Figure 5.
The Relation Between n and critical values at s = 10.
3. Hypothesis Testing with Censored Data
This section proposes a test statistic for comparing and using randomly selected right-censored data.
The rationale is based on extending the uncensored case by incorporating the Kaplan–Meier estimator to handle incomplete data effectively.
Let us construct the test statistic like this:
where
Once more, the 90%, 95%, and 99% percentage points of the test statistic in (12) are simulated for a few chosen values of s from the typical exponential distribution in Table 8 and Figure 6 below, based on 10,000 simulated and sample sizes of n = 2, 4, 6, …, 20, 30, 40, …, 100.
Table 8.
The critical values of .
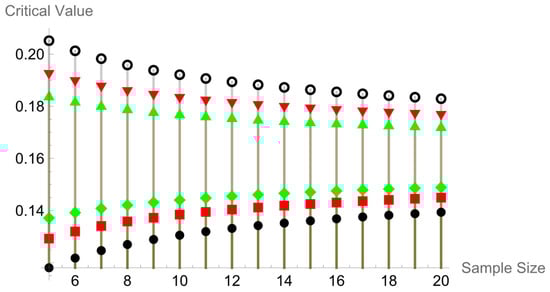
Figure 6.
Relation between sample size and critical values at s = 5.
4. Applications
We use a variety of real data sets to illustrate the usefulness of the findings in this study.
Application 1.
Case of complete data.
Example 1.
Analyze the data in Abouammoh et al. [], which show the ages (in years) of 40 patients aged with blood cancer (leukemia) in one of Saudi Arabia’s health ministry hospitals (see Figure 7).
Figure 7.
Representation of leukemia data set.
The calculated statistic is (6) , which exceeds the critical value in Table 6. As a result, we conclude that this data set appears to have the UBAL feature rather than the exponential characteristic.
Example 2.
The data set reported in Almetwally et al. [] represents a 24-day COVID-19 data collection from 15 October 2020, to 7 November 2020, in the United Kingdom. The drought mortality rate was utilized to generate this information (see Figure 8).
Figure 8.
Representation of COVID-19 data set.
The result shows that , and the critical value is 0.011396. The null hypothesis is therefore rejected, indicating that the UK COVID-19 data is compatible with the UBAL characteristic at a 95% confidence level.
Example 3.
Bakr [] collected data on the survival times (in years) of 43 individuals diagnosed with a specific type of leukemia. In this instance, the critical value is 0.010595 as n = 43. We calculate the statistic in (6) 0.073664, which are both smaller than the critical values in
Table 6. As a result, we conclude that this data set appears to have the UBAL property rather than the exponential.
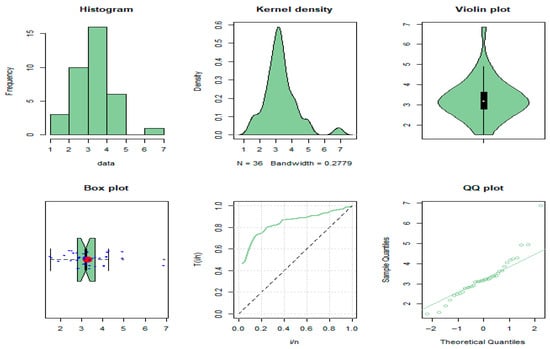
Example 4.
Analgesics data set, see Jamal et al. [], depicts the longevity of 20 persons who took analgesics.
At , , the critical values = This value results in the acceptance of . Then, we reject the UBAL property of data and conclude that the data have the property (see Figure 9).
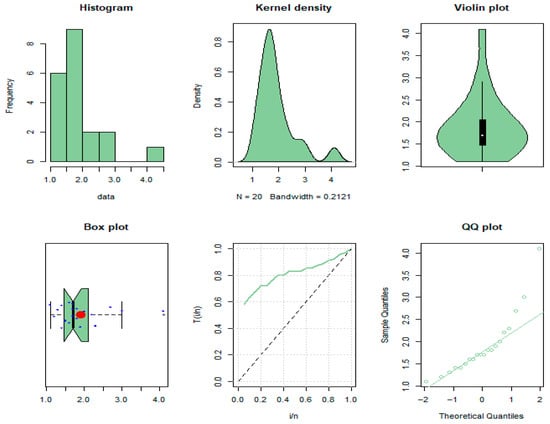
Figure 9.
Representation of analgesics data set.
Application 2.
Case of censored data.
Example 5.
In this application, we use data from Mahmoud et al. [], which shows the ages (in days) of 51 liver cancer patients from the Elminia Cancer Center, Ministry of Health, Egypt, who began the medical study in 2000. Only 39 patients are monitored (right-censored) in the investigation, while the remaining 11 are dropped (missing).
With n = 51, the critical value is 0.1705. 0.21209, which exceeds the threshold limit in Table 8. This value determines the rejection region of . Then we reject the exponential property of the data.
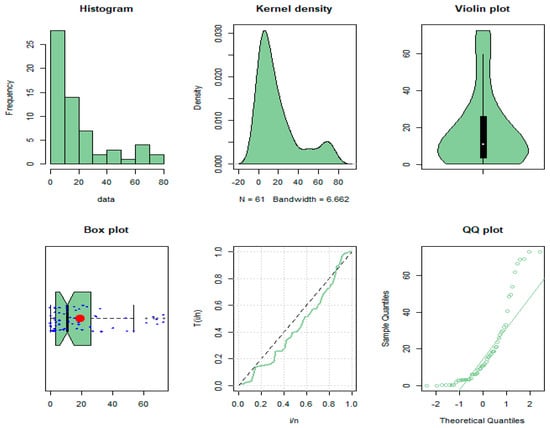
Example 6.

Examine the survival durations, expressed in weeks, of 61 patients with cyclophosphamide-treated inoperable lung cancer reported by Kamran Abbas et al. [] and Lee and Wolfe []. The patients whose therapy was stopped due to a degenerating state are represented by the 33 uncensored (see Figure 10) and 28 censored observations.
Figure 10.
Representation of (lung cancer) data set.
We compute the statistic in (12), 0.4758. Using Table 8 as the critical value, which is 0.16966 as n = 61. Consequently, we deduce that this data set appears to possess the UBAL feature instead of the exponential characteristic.
5. Conclusions
In the context of the Used Better than Aged in Laplace (UBAL) class of life distributions, this study has provided a thorough framework for non-parametric hypothesis testing against Laplace ordering. The suggested techniques offer a reliable and adaptable way to assess complicated lifespan data without depending on constrictive parametric assumptions by utilizing moment inequalities. In addition to strengthening the statistical methods available for investigating UBAL distributions, the theoretical underpinnings established here expand their relevance in a variety of domains, most notably medical science.
The results show how effective moment inequalities are at differentiating between life distributions with minor variations in aging traits. This is particularly relevant to medical applications, as it is essential to comprehend how biological systems age and how well treatments work. The suggested methodology has demonstrated its usefulness in detecting departures from baseline distributions through simulations and real-world case studies, providing significant insights into the dynamics of survival statistics and treatment results. Our current development focuses on right-censoring, which is the most frequent form in reliability and survival studies. We also highlight that the extension of our methodology to left- and interval-censored data is an interesting direction for future work, since it would require adapting the estimating functions and variance expressions to accommodate these censoring mechanisms.
The methodology described in this research has potential for wider use in dependability analysis, risk assessment, and decision-making under uncertainty, in addition to its immediate applications in medical science. For increased accuracy and scalability, future studies could investigate applying these techniques to different types of life distributions and combining them with newly developed data analytics tools. In summary, a major advancement in the study of life distributions has been made with the creation of non-parametric hypothesis testing techniques based on moment inequalities. In addition to advancing our theoretical knowledge of Laplace ordering and UBAL classes, this work offers a useful framework for solving problems in the engineering and medical disciplines.
Author Contributions
Methodology, M.E.B. and A.A.E.-T.; Software, M.E.B. and A.A.E.-T.; Validation, M.E.B. and O.S.B.; Formal analysis, A.A.E.-T.; Investigation, M.E.B. and A.A.E.-T.; Resources, M.E.B.; Data curation, M.E.B. and A.A.E.-T.; Writing—original draft, M.E.B.; Supervision, M.E.B. and A.A.E.-T.; Project administration, M.E.B.; Funding acquisition, M.E.B. and A.M.A. All authors have read and agreed to the published version of the manuscript.
Funding
Ongoing Research Funding program (ORF-2025-1004), King Saud University, Riyadh, Saudi Arabia.
Institutional Review Board Statement
Not applicable.
Informed Consent Statement
Not applicable.
Data Availability Statement
Data is contained within the article.
Acknowledgments
This study was funded by an Ongoing Research Funding program (ORF-2025-1004), King Saud University, Riyadh, Saudi Arabia.
Conflicts of Interest
The authors declare no conflict of interest.
Abbreviations
| IFR | Increasing failure rate |
| IFRA | Increasing failure rate average |
| NBU | New better than used |
| NB(W)UC | New better (worse) than used in a convex ordering |
| UBA | Used better than age |
| UBAC | Used better than age in convex order |
| UBAC (2) | Used better than age in concave order |
| UBAL | Used better than age in Laplace transform |
| UBAmgf | Used better than age in moment generating function |
| PARE | Pitman asymptotic relative efficiency |
| LFR | Linear failure rate |
References
- Bryson, M.C.; Siddiqui, M.M. Some criteria for aging. J. Am. Stat. Assoc. 1969, 64, 1472–1483. [Google Scholar] [CrossRef]
- Esary, J.D.; Marshall, A.W.; Proschan, F. Some reliability applications of the hazard transform. SIAM J. Appl. Math. 1970, 18, 849–860. [Google Scholar] [CrossRef]
- Barlow, R.E.; Proschan, F. Statistical Theory of Reliability and Life Testing: Probability Models; Holt, Rinehart and Winston: Austin, TX, USA, 1975. [Google Scholar]
- Navarro, J. Preservation of DMRL and IMRL aging classes under the formation of order statistics and coherent systems. Stat. Probab. Lett. 2018, 137, 264–268. [Google Scholar] [CrossRef]
- Klefsjo, B. A useful aging property based on the Laplace transform. J. Appl. Prob. 1983, 20, 615–626. [Google Scholar] [CrossRef]
- Denuit, M. Laplace transform ordering of actuarial quantities. Insur. Math. Econ. 2001, 29, 83–102. [Google Scholar] [CrossRef]
- Fernandez-Ponce, J.M.; Pellerey, F.; Rodrıguez-Grinolo, M.R. On a new NBUE property in multivariate sense: An application. Comput. Stat. Data Anal. 2011, 55, 3283–3294. [Google Scholar] [CrossRef]
- Ahmad, I.A. Some properties of classes of life distributions with unknown age. Stat. Probab. Lett. 2004, 69, 333–342. [Google Scholar] [CrossRef]
- Abu-Youssef, S.E.; Bakr, M.E. Laplace transform order for unknown age class of life distribution with some applications. J. Stat. Appl. Probab. 2018, 7, 105–114. [Google Scholar] [CrossRef]
- Bakr, M.E.; Al-Babtain, A.A.; Khosa, S.K. Statistical modeling of some cancerous diseases using the Laplace transform approach of basic life testing Issues. Comput. Math. Method. Med. 2022, 2022, 8964869. [Google Scholar] [CrossRef]
- Mahmoud, E.B.; Al-Babtain, A.A. Non-parametric hypothesis testing for unknown aged class of life distribution using real medical data. Axioms 2023, 14, 369. [Google Scholar] [CrossRef]
- Gadallah, A.M.; Mohammed, B.I.; Al-Babtain, A.A.; Khosa, S.K.; Kilai, M.; Yusuf, M.; Bakr, M.E. Modeling various survival distributions using a nonparametric hypothesis testing based on Laplace transform approach with some real applications. Comput. Math. Method. Med. 2022, 2022, 5075716. [Google Scholar] [CrossRef]
- Abu-Youssef, S.E.; El-Toony, A.A. A new class of life distribution based on Laplace transform and it’s applications. Inform. Sci. Lett. 2022, 11, 355–362. [Google Scholar] [CrossRef]
- Bakr, M.E. Statistical modeling for some real applications in reliability analysis using non-parametric hypothesis testing. Symmetry 2023, 15, 1735. [Google Scholar] [CrossRef]
- Bakr, M.E. Non-parametric hypothesis testing to address fundamental life testing issues in reliability analysis with some real applications. AIMS Math. 2024, 9, 22513–22531. [Google Scholar] [CrossRef]
- Fernandez-Ponce, J.M.; Rodrıguez-Grinolo, M.R. Testing exponentiality against NBUE distributions with an application in environmental extremes. Stoch. Environ. Res. Risk Assess. 2015, 29, 679–692. [Google Scholar] [CrossRef]
- Bakr, M.E. On basic life testing issues in medical research using non-parametric hypothesis testing. Qual. Reliab. Engng. Int. 2023, 40, 1002–1013. [Google Scholar] [CrossRef]
- Mahmoud, M.A.W.; Diab, L.S.; Radi, D.M. Testing exponentiality against renewal new better than used in Laplace transform order: Applications in reliability. J. Egypt. Math. Soc. 2019, 27, 49–60. [Google Scholar] [CrossRef]
- Abu-Youssef, S.E.; Ali, N.S.A.; Bakr, M.E. Used better than aged in mgf ordering class of life distribution with application of hypothesis testing. J. Stat. Appl. Probab. Lett. 2020, 7, 23–32. [Google Scholar] [CrossRef]
- Lee, A.J. U-Statistics Theory and Practice, 1st ed.; Routledge: New York, NY, USA, 1990. [Google Scholar] [CrossRef]
- Mahmoud, M.A.W.; Abdul Alim, A.N. A Goodness of Fit Approach to for Testing NBUFR (NWUFR) and NBAFR (NWAFR) Properties. Int. J. Reliab. Appl. 2008, 9, 125–140. [Google Scholar]
- Abouammoh, A.M.; Abdulghani, S.A.; Qamber, I.S. On partial orderings and testing of new better than renewal used classes. Reliab. Eng. Syst. Saf. 1994, 43, 37–41. [Google Scholar] [CrossRef]
- Almetwally, E.M.; Alharbi, R.; Alnagar, D.; Hafez, E.H. A new inverted topp-leone distribution: Applications to the COVID-19 mortality rate in two different countries. Axioms 2021, 10, 25. [Google Scholar] [CrossRef]
- Jamal, F.; Reyad, H.; Chesneau, C.; Nasir, M.A.; Othman, S. The Marshall-Olkin odd Lindley-G family of distributions: Theory and applications. Punjab Univ. J. Math. 2020, 51, 111–125. [Google Scholar]
- Abbas, K.; Hussain, Z.; Rashid, N.; Ali, A.; Taj, M.; Khan, S.A.; Manzoor, S.; Khalil, U.; Khan, D.M. Bayesian Estimation of Gumbel Type-II Distribution under Type-II Censoring with Medical Applications. Comput. Math. Methods Med. 2020, 7, 1–11. [Google Scholar] [CrossRef]
- Lee, S.Y.; Wolfe, R.A. A simple test for independent censoring under the proportional hazards model. Biometrics 1998, 54, 1176–1182. [Google Scholar] [CrossRef] [PubMed]
Disclaimer/Publisher’s Note: The statements, opinions and data contained in all publications are solely those of the individual author(s) and contributor(s) and not of MDPI and/or the editor(s). MDPI and/or the editor(s) disclaim responsibility for any injury to people or property resulting from any ideas, methods, instructions or products referred to in the content. |
© 2025 by the authors. Licensee MDPI, Basel, Switzerland. This article is an open access article distributed under the terms and conditions of the Creative Commons Attribution (CC BY) license (https://creativecommons.org/licenses/by/4.0/).