Abstract
Phishing is one of the main threats against companies where the main weakness against this type of threat is the worker. For this reason, it is essential that workers have a high security awareness for which it is fundamental to carry out a good safety-awareness campaign. However, as far as we are concerned, a mathematical study of the evolution of security awareness taking into account interactions with other people has not been considered. In this paper, we study how security awareness evolves through two belief-propagation models and Graph Neural Networks. Since this approach is new, the two most basic models were chosen to simulate propagation of beliefs: Sznajd model variant and Hegselmann–Krause model. On the other hand, because Graph Neural Networks are a current and very powerful tool, it was decided to use them to analyze the evolution of beliefs. We consider that with them information-awareness campaigns can be improved. As an example, we propose different awareness measures according to future beliefs and social influence.
Keywords:
safety-awareness campaigns; belief-propagation model; graph neural network; social influence; deep learning MSC:
68T20
1. Introduction
Phishing is a type of cyber-attack that aims to deceive a user in order to obtain relevant information. For this reason, it is one of the most frequent attacks you can find on the Internet today [1]. It is therefore essential to improve countermeasures against this type of attack. The three main countermeasures against this type of attack are the following [2]: education of users so that they can recognize phishing, prevention so that the user does not interact with this type of attack and the use of law enforcement. In this article, we focus on user education.
In order for company users to have good security awareness, organized education must be carried out. For education to be effective, it must be targeted and practical so that users can give feedback and it has to have an impact on workers [3]. Some articles analyze the strengths and weaknesses of current methods and propose new methods of awareness raising [4,5]. For example, in articles [6,7], games are proposed to improve security awareness and in articles [8,9] different programs are proposed to increase awareness. Characteristics that affect security awareness are analyzed in some articles too [10,11]. In order to measure this security awareness, we can consider a five-step ladder model: (1) knowledge, (2) attitude, (3) normative belief, (4) intention and (5) behavior [12]. In this way, a score can be given to the security awareness of each user. In this article, these scores are considered known and will be used to create better security campaigns.
According to network-based approaches, the opinion of a person can be influenced by the opinions of the people nearby [13,14,15]. In this article, security awareness will be treated as an opinion. In addition, it will be considered that this may change over time based on interactions with people nearby. Numerous articles propose measures to improve the security awareness of a group of people, especially in companies. However, we believe that the evolution of the security awareness of a group of people, taking into account the interactions between them, has not been analyzed comprehensively and mathematically. We believe that by taking this characteristic into account, awareness campaigns can be improved. For this reason, this article will study the evolution of the security awareness of a group of people according to their interactions.
Until now, no theoretical model had been proposed to study security awareness considering the influence of people represented through a graph. Firstly, we considered the Sznajd and Hegselmann–Krause models, as they are already proven models that account for the propagation of real beliefs [16,17]. However, these models are very restrictive with a fixed mechanism. For this reason, we proposed a deep learning model based on Graph Neural Networks. In this way, it was verified that if the propagation follows either of the two previous models or even a combination of both, the model can predict its evolution quite accurately. Therefore, we understand that the use of this type of deep learning technique allows better adaptation to real data than the basic models previously proposed due to its flexibility and adaptability. Additionally, an attempt was made to reproduce these models under realistic conditions: a real network was considered, and the creation of security awareness values was approached in a non-trivial way. Finally, based on the results obtained from the simulations, we proposed different techniques to improve security awareness. To achieve this, the current measures were linked to the different types of results.
The contributions of this article are the following: (1) The consideration of security awareness as a belief that can change with interactions with other people. As far as we are concerned, security awareness has not been considered as such a belief. Consequently, as this aspect has not been previously addressed, it constitutes a novel area of research that remains unexplored to date. The main reason for this consideration is that security awareness changes according to the information we receive about it from our environment and not only from courses or activities related to it. To represent these interactions, we considered the use of graphs. (2) The study of the evolution of these beliefs as a function of various mathematical models. There are mathematical models to predict the evolution of beliefs in general. We used Sznajd and Hegselmann–Krause models to simulate the spread of this type of belief, for which they had not been used before. Graph Neural Networks were also used due to the nature of the problem to predict the evolution of the two previous models. Indeed, Graph Neural Networks are more flexible and adaptable to the specific problem. (3) Based on the models considered, we propose security measures that can be applied in companies to improve their local and global security awareness. We believe that these countermeasures can help to improve the security campaigns carried out in companies.
We organized the rest of the article as follows: Section 2 introduces the network theory about communities, Section 3 and Section 4 explain the belief models and GNNs used in this article, the mathematical problem to be solved in this article is in Section 5, in Section 6 we introduce belief-propagation simulations on a real network, in Section 7 we present some applications in companies and finally the conclusions are presented in Section 8.
2. Network Communities
The most basic example of a network is a clique. A clique is a group of nodes where each node is connected to the rest of the network nodes. On the other hand, a community is defined as a set of nodes that are densely connected to each other and loosely connected to the rest of the nodes. In this section, we review the best known methods of generating graphs that contain clearly differentiated communities:
- Ring of cliques: This is a set of cliques of the same size connected to each other forming a ring. That is, each clique is connected to two cliques with a single link. To generate them, it is enough to detail only the number of cliques (n) and the size of them .
- Relaxed caveman graphs: These are formed by rewriting the links of a ring of cliques with a certain probability. To generate them, it is necessary to detail the number of cliques (n), the size of them (k) and the probability of rewriting a link (p).
- Planted partition graphs: This is a set of groups of the same size that are highly connected inside and to a low degree connected with other groups. To generate them, it is necessary to detail the number of groups (n), the size of them (k), the probability of forming links within each group and the probability of forming links outside the group .
- Random partition graphs: These can be considered as planted partition graphs where the groups are of different sizes. To generate them, it is necessary to detail the size of each of the groups , the probability of forming links within each group and the probability of forming links outside the group .
- Gaussian random partition graphs: These can also be considered as planted partition graphs where the size of the groups has a certain mean and variance. To generate them, it is necessary to detail the number of nodes , the mean of the group , a parameter that determines the variance of the size of the groups , the probability of forming links within each group and the probability of forming links outside the group .
- Stochastic Block Models: These can be considered as random partition graphs where it is also necessary to detail the link probabilities with each of the groups (including oneself). To generate them, it is necessary to detail the size of each of the groups and the probability of forming links of a group i with a group j with .
All of them can be easily generated in Python (version 3.11.12) with the Networkx library [18]. Some illustrative examples of such networks are shown in Figure A1; they are generated with Python and drawn with Gephi (version 0.10.1).
One of the most famous algorithms for detecting communities is Louvain’s algorithm. This method considers that initially each node is in a community. Then, each of the nodes is moved to a neighboring community and checked if the modularity is increased. A node moves to that community if this modularity increases. Otherwise, the node remains in its community. The modularity that each node i gains can be calculated using the following formula:
where is the degree of node , is the degree of node in community C, is the total number of links incident to community C and m is the number of links in the network. The algorithm described here is only used with undirected networks. However, it can be easily extended to directed networks.
3. Belief-Propagation Models
In this section, we present a variant of the Sznajd model [19,20,21] and the Hegselmann–Krause model [22,23]. Each of these models simulates the evolution of opinions in a population in a different way. Next, we use these models to simulate the evolution of security awareness over time.
3.1. Sznajd Model Variant
In this model, each vertex is initially considered to have good or bad security awareness at time instant t, . If vertex has good security awareness at time t then ; otherwise, . The structure of this propagation model is:
- A node and a neighbor of this node are chosen at random.
- Based on their opinions, the opinions of neighboring nodes are modified:
- If , then the neighbors of and , and become of the same opinion as these two nodes:
- If then no opinion changes.
- Steps 1 and 2 are repeated for a number of iterations.
Figure A2 shows a visual example of this type of propagation.
3.2. Hegselmann–Krause Model
This model takes into account that initially each of the vertices has an opinion represented by a value at a time instant t, . Thus, if is close to 0, the node has low security awareness and if is close to 1, the node has high security awareness. The evolution of beliefs proceeds as follows:
- For each node , we obtain the group of neighbors that share an opinion close to its:where is the parameter that determines how close the security awareness has to be to join a node to this group.
- The opinion of each node is updated as the average of the opinions of this group:
- Steps 1 and 2 are repeated for a number of iterations or until the beliefs converge.
Figure A3 shows a visual example of this type of propagation.
3.3. Model Convergence
In order to illustrate the convergence, we consider that the network is a Stochastic Block Models type where the sizes of the groups are and the probabilities of forming links between a group i and a group j are with . The matrix () verifies that it is symmetric and that is much larger than .
In the case of the Sznajd variant model, it is necessary to choose two nodes: the first one is chosen randomly and the second one is also chosen randomly among the neighbors of the first one. However, since is much larger than , the second node is very likely to belong to the group where the first one is. Therefore, the most likely thing is that the predominant value of the group (0 or 1) will prevail in each of the groups.
In the case of the Hegselmann–Krause model, we can define a lower bound for the probability of consensus when the opinions are initially independent and identically distributed with values in the opinion set [23]. Figure A4 shows an example of the evolution of opinions in a model Stochastic Block Model.
The following parameters were used to perform this simulation. A network with four groups of 75 nodes was considered. Moreover, the matrix representing the probabilities of the links inside and outside the groups is:
The opinions of the nodes in the first group are random numbers in , the opinions of the nodes in the second group are random numbers in , the opinions of the nodes in the third group are random numbers in and the opinions of the nodes in the fourth group are random numbers in .
4. Graph Neural Networks
This section defines the main algorithms associated with the Graph Neural Network models used in this paper. These algorithms include layers, functions, loss functions and an optimizer.
4.1. Layers
In this case, they are used to learn new representations of each of the nodes.
- GraphSAGE [24,25]: In this article, we use the variant of the original GraphSAGE layer that pytorch goemetric (a library Python) defined. Given that the representation of a node is and the set of neighbors of node is , the representation of each node is updated as follows:where and are weight matrices that are learned by training the network. In this case, the summation will be used as agg.
- Linear [26]: Given that the input dataset is x, we can obtain the output set as follows:where W and b are parameters that are learned by training the neural network.
4.2. Functions
- Relu [27]: If the input dataset is x, the output dataset is as follows:
- Sigmoid: If the input dataset is x, the output dataset is as follows:It should be noted that these last two functions have no parameters for learning.
4.3. Loss Functions
They are used to measure the model error.
- Binary cross entropy with logits: Considering that is the logit according to the model associated with node and is the label of node , we have that:
- Mean squared error: Considering that is the predicted value according to the model for node and is the label of node , we have that:
4.4. Optimizer
This is used to reduce the model error.
- Adam [28]: This algorithm takes into account the initial parameters, , , , , and the loss function with learning parameters at time , . Then, the learning parameters are updated to minimize the loss function following the following algorithm:where symbolizes the gradient with respect to the variables. It should be noted that some parameters have the following usual values: , , . These values were used in this article. However, the learning rate is the most important parameter and usually varies depending on the problem. We use in the models of this article.
5. The Mathematical Problem
The fundamental problem addressed in this article is the prediction of the evolution of security awareness in a group of individuals. That is, a person i has a level of security awareness at a given time t, which we will denote as . We consider this value to be within the interval , , where 0 represents the minimum score and 1 the maximum score. In this way, each person is associated with a time series that determines their level of security awareness:
where is a discrete and finite set of time points. To make this prediction, the following hypotheses were considered:
- The security awareness of each person can change over time based on the security awareness of their peers. In this article, the relationships of an individual i will be represented with their peers through a graph where V is the set of vertices and E is the set of edges. In this way, each person i will be represented by a node and the person’s security awareness i will be influenced by the neighboring nodes of the node , :
- It will be considered that the Markov property holds:
- Taking into account the two previous hypotheses, it will also be considered that the propagation of security awareness evolves according to the Sznajd model variant, the Hegselmann–Krause model or a combination of both:with and .
These models have been tested in various opinion-propagation studies, but they have never been considered for studying security awareness. By applying these models multiple times, predictions can be made about the security-awareness states of each person over r time instances:
However, it is important to highlight that these models exhibit a relatively inflexible evolution to adapt to real data. For this reason, a Graph Neural Network (GNN) was considered the best option for predicting security awareness. This type of model is capable of considering both the relationships within the network and the security-awareness values over time. Another factor to consider is its computational cost. The computational cost of other recurrent deep learning models, such as LSTM or GRU [29], is much higher when simultaneously considering multiple time series. In fact, LSTM or GRU networks alone are not capable of accounting for a non-Euclidean space. That is, they are unable to consider the relationships defined by a graph. Alternatively, they could consider all time series jointly. However, they would assume that each security-awareness instance could be influenced by every individual. In this article, a network with 4039 nodes is presented, which represents 4039 time series. The computational cost of this type of recurrent deep learning over such a large number of time series is high, despite the use of various techniques to reduce it [30]. Finally, it is worth noting that some models that combine recurrent layers with Graph Neural Networks have recently been created [31,32]. However, since we obtained good results with a simpler model, we chose to focus on this approach in this article.
Finally, to test the effectiveness of Graph Neural Networks, the evolution of each of the models starting from an initial state and ending in a final state will be attempted to be predicted using a Graph Neural Network:
6. Belief-Propagation Simulation
In this section, we perform simulations to predict the future of security awareness. We begin by discussing the social network that determines people and their relationships. Then, we simulate the evolution of beliefs through the Sznajd and Hegselmann–Krause models. Finally, it will be proved that the evolutions in both models can be predicted using Graph Neural Networks.
6.1. Social Network
In this section, the real network that we are going to use to carry out the simulation is presented. This network is called Ego-Facebook and can be downloaded from the Stanford Network Analysis Project (SNAP) page [33]. Ego-Facebook is characterized by having 4039 nodes and 88,234 links. Moreover, according to Louvain’s algorithm, 15 communities can be differentiated. Figure A5 shows a visualization of this network.
6.2. Belief-Propagation Models
To observe the evolution of belief-propagation models, nodes were considered to present different beliefs. The security-awareness levels were constructed by considering both randomness and group-based structure. To this end, groups with predominantly high security awareness and groups with predominantly low security awareness were defined. Additionally, nodes with high and low security awareness were randomly distributed. To construct this belief, the following steps were performed:
- Initially, all nodes are considered to have high awareness: for all .
- In the following, we consider the three largest communities where the majority of nodes () have low awareness, . In Sznajd’s model, the nodes with low awareness verify for all , while in the Hegselmann–Krause model is a random number belonging to the interval for all .
- Subsequently, we consider that there are some nodes with low awareness, , uniformly distributed throughout the network. In the Sznajd model, these nodes verify for all . In the Hegselmann–Krause model, it is verified that is a random number in the interval for all .
- Next, three communities are considered where most of the nodes (), , have high awareness. For the Sznajd model, for all and for the Hegselmann–Krause model is a random number in the interval for all .
- Finally, some nodes are considered with a medium awareness in the Hegselmann–Krause model (). Then, each node of these nodes verifies that is a random number in the interval .
The Sznajd model is probabilistic since it chooses nodes randomly in the network. Therefore, 500 simulations were considered, selecting 500 nodes in each one of them. Thus, the predicted value of each node is 1 if in the 500 simulations 1 appears as the final value more than half of the times (>250). Otherwise, it is given the value 0. Figure A6 shows an example of the evolution of this model.
In this figure, we can see how in groups where there is a predominant belief, this ends up imposing itself on the whole group. The main reason is that it is more likely to find two neighboring nodes with the same belief in those groups where that belief predominates. However, if the network is large, nodes with few links may not change anything. This is because if a node has few neighbors it is more difficult for it to change its mind according to this algorithm since this algorithm selects two nodes randomly at each step and changes their neighbors. This method converges faster because in each iteration the beliefs of several nodes are updated simultaneously. This condition can be observed especially in networks with communities where there are many nodes sharing neighbors’ beliefs.
In the Hegselmann–Krause model, it is necessary to define two parameters: the number of iterations and the distance of the beliefs which a person considers, . In this case we took 500 iterations and . Figure A7 shows an example of the evolution of this model.
In this case, it can be observed how in groups where they have a similar opinion, the group converges towards an average of the opinion. However, it can be observed that in groups with high security awareness there are a few nodes with low security awareness. Similarly, this occurs in groups with low security awareness and nodes with high awareness. This is mainly due to the parameter . On the one hand, if this parameter is large (close to 1) then almost all beliefs of neighboring nodes are taken into account to update the belief of a node. On the other hand, if this parameter is small (close to 0) then only the beliefs of the nodes that have a similar opinion to the target node are taken into account to update its belief.
6.3. Graph Neural Networks
In this section, Graph Neural Networks will be built to capture the evolution of the previous models. The main idea is to prove that it can predict the future value of each node in both models.
There are two main types of GNNs, spectral methods and spatial methods. Spectral methods use graph Fourier transform and the eigendescomoposition of the graph Laplacian to form the convolution operation. The main disadvantage of these methods is that they apply techniques that depend on the graph structure. That is, they cannot be applied to a different graph. This is a problem for our case since people make new friends and therefore the graph changes. This problem is not faced by spatial methods, which take into account the beliefs of the neighbors. On the other hand, unlike other deep learning techniques, these models are not better at applying many layers since each node would take into account all the nodes of the graph instead of only the closest ones. Because of this, in many places only 2, 3 or 4 of these layers are applied followed by other deep learning layers depending on the problem. In this article, we use two layers of type SAGE (a type of spatial layer). The main reason for choosing this layer is that it is able to take into account only the security awareness of neighboring nodes in the graph to update a node’s security awareness.
In order to simplify the construction of the GNN for each of the models, it was considered that they have the same general structure: two SAGE layers followed by three linear layers. We apply RELU to the output of each of these layers, except for the last linear layer. Figure A8 shows the structure of the GNNs used in this article. In cases where the Hegselmann–Krause model is used, we add a sigmoid function at the end because this is a regression problem and beliefs are between 0 and 1. In the case of the Sznajd model, this is not necessary since it is a classification problem.
The number of neurons in each layer is 32 in all cases except the last layer. In this last layer, the output is one neuron. It was considered a transductive node classification and the ratios of samples to include in the validation set and test sets are and , respectively. In order to know if this GNN is able to capture the future evolution of these two models, three cases were considered (Table 1 shows the hyperparameters used in these cases):

Table 1.
Hyperparameters.
- Prediction of the Sznajd model: As the opinions of each of the nodes is 0 or 1, binary cross entropy with logits (BCEWL) was used as a loss function. Adam with learning rate 0.001 was used as the optimizer. It was considered 100 epochs. Depending on the random assignment of initial beliefs of the nodes, different results were obtained. An accuracy between and was obtained in the test set. Figure A9 shows an example of the confusion matrix.
- Prediction of the Hegselmann–Krause model: As the opinion of each node is in the interval , the Mean Squared Error (MSE) was used as a loss function. The Adam optimizer with learning rate 0.001 was also used in this case. It was considered 300 epochs. We obtained an error between and in the test set. The mean absolute error is between and in the test set.
- Prediction of a combination of the Sznajd and Hegselmann–Krause models: In this case, the following combination of the two models was considered:where is the prediction of node and is the final time in each model. The Adam optimizer with learning rate 0.001 was also used in this case. In this case, mean squared error was also used as a loss function. It was considered 300 epochs. The error obtained in this case is between and in the test set. The mean absolute error is between and in the test set.
The hyperparameters were chosen to achieve good results across the three cases. However, if each case were considered individually, alternative architectures might improve the results. On the other hand, the main objective of this article is to present a new type of problem—security-awareness analysis—and a novel way to approach it through the use of Graph Neural Networks. The results show that this problem can be addressed in this way, despite its potential for improvement.
In general, the procedure followed to obtain these results is as follows: First, a network was formed where each node was assigned a value. This value represents its security awareness. Then, the Sznajd and Hegselmann–Krause models were used to obtain predictions from the given security awareness. Finally, the GNNs were used with the initial data and the data predicted by the previous models. This model was trained following the traditional backpropagation process commonly used by other deep learning methods. The optimizer and loss function used by each model are specified in each of the three cases.
Due to the low error in all models, we can say that GNNs are able to learn the dynamics of these models correctly. This GNN model was chosen because of its simplicity. However, the results obtained can be easily improved by adding different types of layers such as other more expressive GNN layers, batchnorm, dropout and so on.
7. Application in Companies
As is well known and in the context of the modern workplace, where employees are often the first line of defense against phishing attacks, the study of employee awareness of phishing cyber threats is a critical aspect of cybersecurity. Accordingly, belief models such as the Sznajd model and Hegselmann–Krause models offer valuable tools for exploring and describing these complex dynamics. These models are based on social science and network theory, and allow us to simulate how workers’ beliefs and attitudes towards phishing evolve and change over time (i.e., we can gain insights into workers’ collective behavior and the spread of phishing awareness). These models take into account factors such as social influence, peer interactions and information dissemination within an organization, and the results obtained provide valuable information for designing targeted cybersecurity training programs, developing effective communication strategies and ultimately strengthening an organization’s resilience against this cyber threat. In addition, the use of belief models not only improves our understanding of the human factor in cybersecurity, but also aids in the development of proactive measures to mitigate the risks associated with phishing in the workplace.
Predicting security awareness in a company requires data. Two simple ways to collect these data are through employee testing or fake phishing attacks. Depending on the data we have, different models should be used:
- If you only have one security-awareness value, then you can apply Sznajd’s model and the Hegselmann–Krause model. These models are able to predict the evolution of these beliefs through a specific algorithm. Therefore, the main limitation of these models is that it only makes sense to apply them assuming that the beliefs evolve according to these algorithms. This means that these models do not always resemble the actual evolution of beliefs.
- If you have more than a single measure of safety awareness, you can use GNNs. The main advantage of these models is that they learn how security awareness evolves from the data and not by following a specific algorithm. In fact, as seen in the previous section, GNNs are able to learn the way of evolution from the two previous models (even a combination of both) with a considerably low error. Therefore, we consider that these types of deep learning models are more flexible and can better adapt to the actual evolution of the security awareness. In addition, these models can take into account characteristics of individuals that may influence propagation (age, position, etc.). However, these models would not be effective when people’s beliefs do not depend on their environment or it is excessively complicated to capture the effect that one person’s belief has on another. Depending on the information given, we propose the use of two different types of GNNs:
- If there are few values over time, a simple model similar to the one used in this article can be used.
- If there are many values over time, temporal GNNs can be used.
Due to the mandatory risk-prevention test taken when joining a company, most employees can be considered to have high safety awareness. However, due to the very rapid evolution of malware, some situations of weakness can be differentiated. This article considers three weaknesses and proposes corresponding solutions:
- A few randomly distributed nodes have medium future security awareness. To overcome this, it is sufficient for the people representing these nodes to learn from their colleagues. Then, this problem can be solved by holding meetings and group activities/games to exchange opinions about security with their colleagues.
- A few randomly distributed nodes have low future security awareness. For these people, it is recommended that they learn about the current state of malware. A simple way to overcome this is by taking individual security courses. These courses have to be effective and include practical activities.
- There are groups with low future security awareness. In this case, several security-learning talks and group activities can be conducted for groups with these weaknesses. Security experts must organize learning. In this way, they can learn about current malware threats.
Then, these belief models and GNNs can locate future parts of the employee network with problems. Applying these concrete measures to these parts can save time and money.
8. Conclusions
This paper analyzes the propagation of people’s security awareness through two models: Sznajd’s model and the Hegselmann–Krause model. From the propagation of these models, future predictions of people’s beliefs can be obtained. A limitation of these models is that they take into account only one characteristic. To overcome this, the use of GNNs is proposed. In addition, these GNN models can be reused if the network changes. An example where this occurs is in companies. Because of this, some problems that companies may have and their corresponding solutions are proposed. Finally, simulations of these models were carried out considering a real network.
In this article, we saw the two simplest methods of belief propagation and GNNs. However, there are much more complex methods for simulating belief propagation. As future work, we will consider analyzing these new methods and detecting which ones are better to stigmatize the propagation of security awareness. We will also seek from this analysis to create new methods specific to our problem. Finally, each of these methods will be compared with different types of GNNs in a similar way to this article expecting to obtain GNN structures that are able to simulate these evolutions. Additionally, the aim will be to conduct this analysis using completely real data.
Author Contributions
Conceptualization, J.D.H.G.; methodology, J.D.H.G.; software, J.D.H.G.; writing—original draft preparation, J.D.H.G.; writing—review and editing, A.M.d.R.; visualization, J.D.H.G.; supervision, A.M.d.R. All authors have read and agreed to the published version of the manuscript.
Funding
This research received no external funding.
Data Availability Statement
Data are contained within the article.
Conflicts of Interest
The authors declare no conflicts of interest.
Appendix A
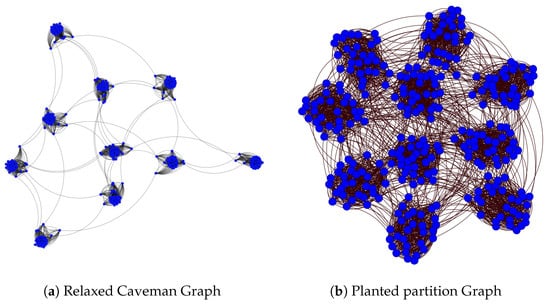
Figure A1.
Communities in networks: nodes are blue and links are black. (a) A relaxed caveman graph with , and . (b) A planted partition graph with , , and .
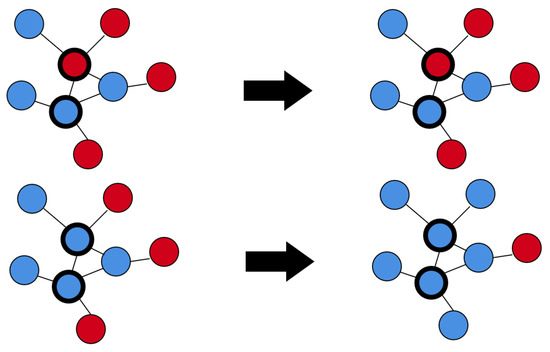
Figure A2.
An example of propagation of Sznajd’s model. Blue nodes are considered to have good awareness while red nodes have poor awareness. The nodes with thicker circumference correspond to those chosen randomly in an iteration.
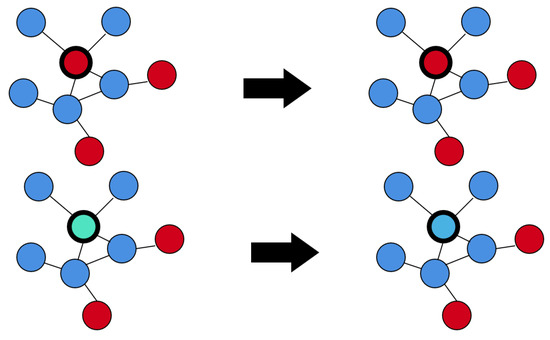
Figure A3.
An example of propagation of Hegselmann–Krause’s model. Blue nodes are considered to have good awareness while red nodes have poor awareness. Light blue indicates a less positive aspect while darker blue indicates a more positive aspect. The node with the thickest circumference corresponds to the one chosen to update its security awareness in an iteration.
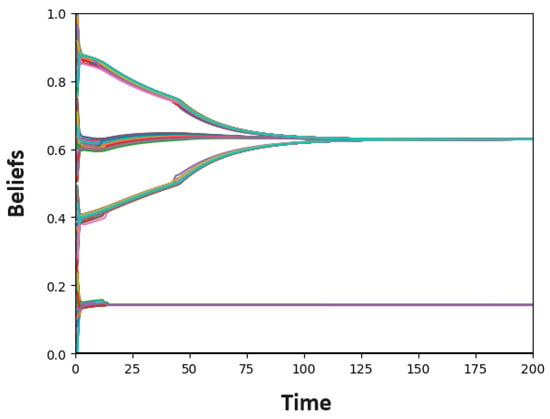
Figure A4.
Example of convergence of Hegselmann–Krause model. Each function represents the evolution of the opinion of a node.
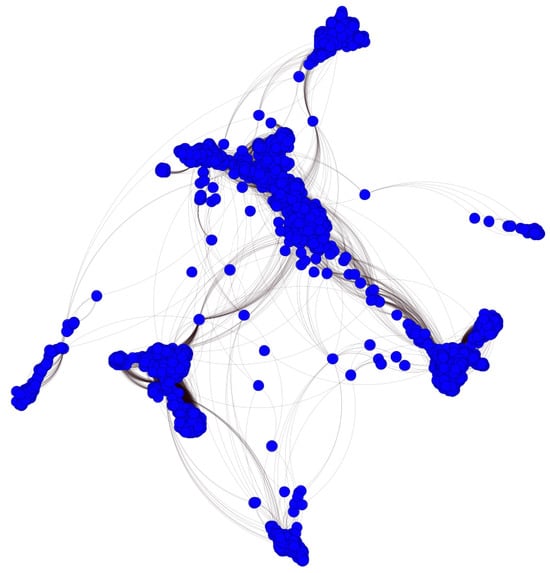
Figure A5.
Ego-Facebook network. The nodes are blue and the links are black.
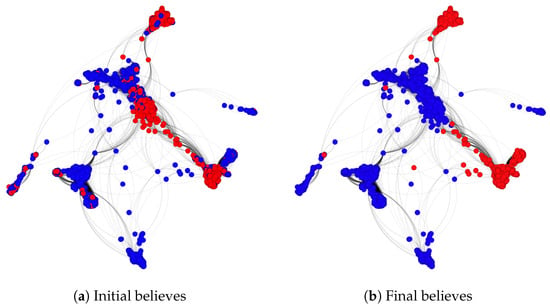
Figure A6.
Sznajd model: Blue nodes are considered to have good awareness while red nodes have poor awareness.
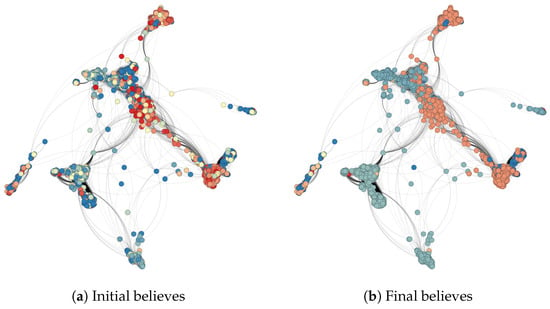
Figure A7.
Hegselmann–Krause model: Dark blue nodes are considered to have very good awareness, dark red nodes have very poor awareness, blue nodes are considered to have good awareness, orange nodes are considered to have poor awareness and yellow nodes are considered to have medium awareness.

Figure A8.
Structure of GNNs.
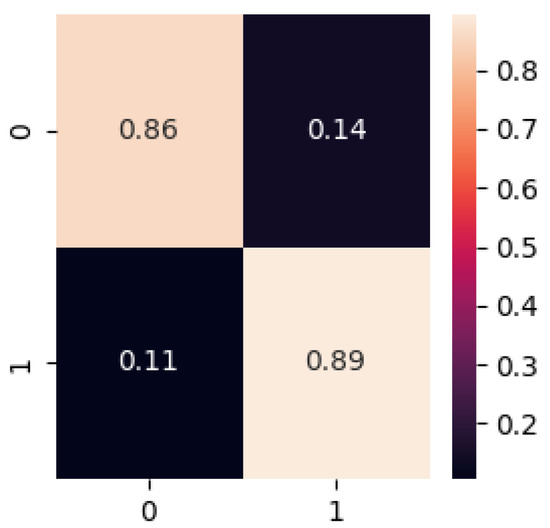
Figure A9.
Confusion Matrix.
References
- Zwilling, M.; Klien, G.; Lesjak, D.; Åukasz, W.; Cetin, F.; Basim, H.N. Cyber Security Awareness, Knowledge and Behavior: A Comparative Study. J. Comput. Inf. Syst. 2022, 62, 82–97. [Google Scholar] [CrossRef]
- Alkhalil, Z.; Hewage, C.; Nawaf, L.; Khan, I. Phishing attacks: A recent comprehensive study and a new anatomy. Front. Comput. Sci. 2021, 3, 563060. [Google Scholar] [CrossRef]
- Bada, M.; Sasse, A.M.; Nurse, J.R.C. Cyber Security Awareness Campaigns: Why do they fail to change behaviour? arXiv 2019, arXiv:1901.02672. [Google Scholar]
- Siponen, M.T. A conceptual foundation for organizational information security awareness. Inf. Manag. Comput. Secur. 2000, 8, 31–41. [Google Scholar] [CrossRef]
- Kruger, H.; Kearney, W. A prototype for assessing information security awareness. Comput. Secur. 2006, 25, 289–296. [Google Scholar] [CrossRef]
- Hart, S.; Margheri, A.; Paci, F.; Sassone, V. Riskio: A Serious Game for Cyber Security Awareness and Education. Comput. Secur. 2020, 95, 101827. [Google Scholar] [CrossRef]
- Sharif, K.H.; Ameen, S.Y. A Review of Security Awareness Approaches With Special Emphasis on Gamification. In Proceedings of the 2020 International Conference on Advanced Science and Engineering (ICOASE), Duhok, Iraq, 23–24 December 2020; pp. 151–156. [Google Scholar] [CrossRef]
- Peltier, T.R. Implementing an Information Security Awareness Program. Inf. Syst. Secur. 2005, 14, 37–49. [Google Scholar] [CrossRef]
- Hansche, S. Designing a Security Awareness Program: Part 1. Inf. Syst. Secur. 2001, 9, 1–9. [Google Scholar] [CrossRef]
- Rezgui, Y.; Marks, A. Information security awareness in higher education: An exploratory study. Comput. Secur. 2008, 27, 241–253. [Google Scholar] [CrossRef]
- McCormac, A.; Zwaans, T.; Parsons, K.; Calic, D.; Butavicius, M.; Pattinson, M. Individual differences and Information Security Awareness. Comput. Hum. Behav. 2017, 69, 151–156. [Google Scholar] [CrossRef]
- Stefaniuk, T. Training in shaping employee information security awareness. Entrep. Sustain. Issues 2020, 7, 1832. [Google Scholar] [CrossRef] [PubMed]
- Spears, R. Social Influence and Group Identity. Annu. Rev. Psychol. 2021, 72, 367–390. [Google Scholar] [CrossRef] [PubMed]
- Hollebeek, L.D.; Sprott, D.E.; Sigurdsson, V.; Clark, M.K. Social influence and stakeholder engagement behavior conformity, compliance, and reactance. Psychol. Mark. 2022, 39, 90–100. [Google Scholar] [CrossRef]
- Hu, X.; Chen, X.; Davison, R.M. Social Support, Source Credibility, Social Influence, and Impulsive Purchase Behavior in Social Commerce. Int. J. Electron. Commer. 2019, 23, 297–327. [Google Scholar] [CrossRef]
- Sznajd-Weron, K. Sznajd model and its applications. Acta Phys. Pol. Ser. 2005, 36, 2537–2547. [Google Scholar]
- Douven, I.; Riegler, A. Extending the Hegselmann–Krause Model I. Log. J. IGPL 2009, 18, 323–335. [Google Scholar] [CrossRef]
- Hagberg, A.A.; Schult, D.A.; Swart, P.J. Exploring Network Structure, Dynamics, and Function using NetworkX. In Proceedings of the 7th Python in Science Conference, Pasadena, CA, USA, 19–24 August 2008; Varoquaux, G., Vaught, T., Millman, J., Eds.; pp. 11–15. [Google Scholar] [CrossRef]
- Sznajd-Weron, K.; Sznajd, J.; Weron, T. A review on the Sznajd model—20 years after. Phys. A Stat. Mech. Its Appl. 2021, 565, 125537. [Google Scholar] [CrossRef]
- Rossetti, G.; Milli, L.; Rinzivillo, S.; Sîrbu, A.; Pedreschi, D.; Giannotti, F. NDlib: A python library to model and analyze diffusion processes over complex networks. Int. J. Data Sci. Anal. 2017, 5, 61–79. [Google Scholar] [CrossRef]
- Rossetti, G.; Milli, L.; Rinzivillo, S.; Sirbu, A.; Pedreschi, D.; Giannotti, F. NDlib: Studying Network Diffusion Dynamics. In Proceedings of the 2017 IEEE International Conference on Data Science and Advanced Analytics (DSAA), Tokyo, Japan, 19–21 October 2017; pp. 155–164. [Google Scholar] [CrossRef]
- Hegselmann, R.; Krause, U. Opinion Dynamics and Bounded Confidence Models, Analysis and Simulation. J. Artif. Soc. Soc. Simul. 2002, 5. [Google Scholar]
- Lanchier, N.; Li, H.L. Consensus in the Hegselmann–Krause Model. J. Stat. Phys. 2022, 187, 20. [Google Scholar] [CrossRef]
- Hamilton, W.L.; Ying, R.; Leskovec, J. Inductive Representation Learning on Large Graphs. arXiv 2018, arXiv:1706.02216. [Google Scholar]
- Fey, M.; Lenssen, J.E. Fast Graph Representation Learning with PyTorch Geometric. In Proceedings of the ICLR Workshop on Representation Learning on Graphs and Manifolds, 2019. Available online: https://arxiv.org/abs/1903.02428 (accessed on 23 April 2025).
- Salas, R. Redes neuronales artificiales. Univ. Valparaıso Dep. Computación 2004, 1, 1–7. [Google Scholar]
- He, J.; Lin Li, J.X.; Zheng, C. Relu Deep Neural Networks and Linear Finite Elements. J. Comput. Math. 2020, 38, 502–527. [Google Scholar] [CrossRef]
- Kingma, D.P.; Ba, J. Adam: A Method for Stochastic Optimization. arXiv 2017, arXiv:1412.6980. [Google Scholar]
- Yang, S.; Yu, X.; Zhou, Y. LSTM and GRU Neural Network Performance Comparison Study: Taking Yelp Review Dataset as an Example. In Proceedings of the 2020 International Workshop on Electronic Communication and Artificial Intelligence (IWECAI), Shanghai, China, 12–14 June 2020; pp. 98–101. [Google Scholar] [CrossRef]
- Masuko, T. Computational cost reduction of long short-term memory based on simultaneous compression of input and hidden state. In Proceedings of the 2017 IEEE Automatic Speech Recognition and Understanding Workshop (ASRU), Okinawa, Japan, 16–20 December 2017; pp. 126–133. [Google Scholar] [CrossRef]
- Seo, Y.; Defferrard, M.; Vandergheynst, P.; Bresson, X. Structured Sequence Modeling with Graph Convolutional Recurrent Networks. arXiv 2016, arXiv:1612.07659. [Google Scholar]
- Chen, J.; Wang, X.; Xu, X. GC-LSTM: Graph Convolution Embedded LSTM for Dynamic Link Prediction. arXiv 2021, arXiv:1812.04206. [Google Scholar] [CrossRef]
- Leskovec, J.; Krevl, A. SNAP Datasets: Stanford Large Network Dataset Collection. 2014. Available online: http://snap.stanford.edu/data (accessed on 23 April 2025).
Disclaimer/Publisher’s Note: The statements, opinions and data contained in all publications are solely those of the individual author(s) and contributor(s) and not of MDPI and/or the editor(s). MDPI and/or the editor(s) disclaim responsibility for any injury to people or property resulting from any ideas, methods, instructions or products referred to in the content. |
© 2025 by the authors. Licensee MDPI, Basel, Switzerland. This article is an open access article distributed under the terms and conditions of the Creative Commons Attribution (CC BY) license (https://creativecommons.org/licenses/by/4.0/).