Abstract
Quartz purification is a key driver of the silicon-based industrial sector. This study used typical vein quartz from Jiangxi Province, China as a raw material to systematically investigated the occurrence states of impurities and conducted an in-depth chemical purification study. The effects of various parameters on impurity removal via acid leaching were investigated. The results revealed distinct removal patterns: independent minerals were effectively removed with low-concentration acid; inclusion impurities were efficiently eliminated by optimizing temperature and acid concentration; and lattice impurities proved resistant to removal. The optimal acid-leaching conditions were identified as follows: 80 °C leaching temperature, mixed acid system of HF-HCl-H2SO4 (volume ratio 1:1:1), 7 wt% acid concentration, 6 h leaching time, and a 1:1 solid–liquid ratio. The removal efficiencies of Al, K, and Fe reached 77.0%, 87.5%, and 80.0%, respectively, and the product (the quartz particles after acid leaching) purity was elevated to 99.92%. Furthermore, this study clarified the influence of acid-leaching parameters on purifying high-aluminum low-iron quartz sand, providing a valuable theoretical basis and technical reference for the deep processing of similar quartz ores.
1. Introduction
Quartz, as one of the primary rock-forming minerals, is widely distributed in the Earth’s crust and predominantly exists in the form of low-temperature α-quartz. Its main component is SiO2, making it the most crucial raw material for SiO2 in industrial production [,,]. Natural quartz contains various impurity elements, primarily iron, aluminum, and potassium, whose presence significantly hampers the application and value of quartz products. When these trace elements are incorporated into the crystal lattice of quartz, they can adversely affect its physical and chemical properties. For example, Fe impurity influences the color of quartz sand, while K and Na impurities notably alter its thermal expansion behavior [,,]. Therefore, applying effective purification techniques to remove these impurities is of great importance.
The primary methods for purifying quartz sand include auxiliary treatments (e.g., calcination, water quenching, and ultrasonic processing), physical methods (e.g., magnetic separation and flotation), and chemical methods (e.g., acid leaching). The industrial production usually employs combined physical–chemical processes for quartz sand purification [,]. Physical methods can effectively remove independent mineral impurities but not those within the crystal lattice or inclusion bodies. In contrast, chemical acid leaching is highly effective against diverse impurities, making it an essential technique for achieving high-purity quartz [,]. From a crystallographic perspective, quartz has a three-dimensional network structure formed by silicon–oxygen tetrahedra connected through shared vertices. This unique structure provides exceptional physical and chemical stability, rendering it insoluble in common acidic environments such as HCl, H2SO4, and HNO3, but soluble in HF [,,], creating favorable conditions for selectively removing impurities. It is noteworthy that the type, content, and occurrence state of impurities in quartz sand vary significantly with its origin [,,,]. Moreover, different acids exhibit distinct efficiencies in removing various impurities. For example, hot phosphoric acid (250 °C) can selectively dissolve silicates [], while iron removal efficacy varies considerably among acids [,]. Optimizing the acid-leaching process for each specific raw material is therefore essential.
Nestled on the eastern foothills of the southern Luoxiao Mountains, Jiangxi Province boasts abundant quartz resources. With reserves exceeding 550 million tons, it hosts the world’s largest single silica deposit, offering a significant advantage in supplying high-purity quartz raw materials that are economically viable. Therefore, this study systematically investigates the purification of vein quartz obtained from a location in Jiangxi. The effects of acid-leaching temperature, type of acid, acid concentration, leaching time, and solid–liquid ratio on the purification efficiency were systematically investigated. An optimized system for the acid-leaching process parameters was established, and the removal patterns of impurity elements and their correlations with process parameters were analyzed. The results not only enhance the purification efficiency of the target quartz sand but also provide valuable references for developing acid-leaching processes for other similar quartz mines.
2. Experimental Materials and Methods
2.1. Raw Materials
The raw material used in this work was obtained from a vein quartz deposit in Jiangxi Province, China. The raw ore was processed through a series of steps, including classification, crushing, manual sorting, and grinding, to produce quartz sand. The fraction collected between 70 and 120 mesh sieves was selected as the starting material for the purification experiments, which had a measured particle size range of 81–255 µm. The content of impurity elements in raw quartz sand was analyzed by inductively coupled plasma- optical emission spectrometry (ICP-OES), and the results are summarized in Table 1. The hydrofluoric acid (HF), hydrochloric acid (HCl), nitric acid (HNO3), and sulfuric acid (H2SO4) used in the experiments were purchased from Xilong Scientific Co., Ltd. (Shantou, China), all with analytical reagent (AR) grade purity. The oxalic acid (H2C2O4, AR) employed in the study was obtained from Jianji High-Tech Silicon Material Co., Ltd. (Ji’an, China), in solid form. The ultrapure water used in the experiments was produced by a Liding LD-WFUP-20 ultrapure water system.

Table 1.
The content of impurity elements in experimental quartz sand (µg/g).
2.2. Acid-Leaching Experiments
All samples used in the experiments were obtained from the same raw ore through a single sampling event conducted during the same period. After laboratory sieving, the samples were thoroughly homogenized by mixing in a stainless-steel container, followed by random weighing of 10 g aliquots for experimental use. For acid-leaching experiments, 10 g of quartz sand was weighed (Mettler MA204E electronic balance) and transferred into a 100 mL lidded polytetrafluoroethylene (PTFE) beaker. After adding the predetermined concentration of acid solution, the mixture was homogenized using a PTFE stirrer at 500 rpm for 2–3 s. The beaker was immersed in a thermostatic water bath (Shanghai Kesheng Instrument DF-101T) and maintained at the target temperature for a specified duration without stirring. Upon completion of leaching, the sample was rinsed with ultrapure water until the pH reached neutral. Finally, the purified quartz sand was dried at 70 °C for 8 h in a DHG-9240A drying oven from Shanghai Precision Scientific Instrument Co., Ltd. (Shanghai, China).
2.3. Materials Characterization
X-ray diffraction (XRD) analysis was conducted using a D8 Advance instrument from Bruker Corporation (Billerica, MA, USA). Impurity content analysis was performed by Agilent ICP-OES from Agilent Technologies, Inc. (Santa Clara, CA, USA). Inclusions in quartz sand particles were examined using a XPL-3230 microscope from Shanghai Precision Scientific Instrument Co., Ltd. (Shanghai, China). Thin sections of quartz were prepared with a STX-202AQ diamond wire cutting system from Hefei Kejing Materials Technology Co., Ltd. (Hefei, China). The morphology and composition of impurities were characterized using a Phenom XL, benchtop scanning electron microscope from Phenom Scientific (Eindhoven, The Netherlands). Particle size distribution analysis was carried out with a Mastersizer 3000 laser diffraction particle size analyzer from Malvern Panalytical (Malvern, UK).
Prior to ICP analysis, the samples must be subjected to microwave digestion. An accurately weighed amount of sample is placed into a PTFE digestion vessel, followed by the addition of 5 mL HNO3, 3 mL HCl, 1 mL HF, and 2 mL hydrogen peroxide (H2O2). The vessel is then sealed and placed in a microwave digestion system. The temperature was ramped to 130 °C over 20 min at 1200 W, and held at this temperature for 5 min. It is then further ramped to 180 °C over 20 min and maintained at that temperature for 40 min. After digestion, the vessel was allowed to cool to room temperature. The cooled digestate was quantitatively transferred into a 25 mL plastic volumetric flask and diluted to the mark with deionized water. The digested solutions were then analyzed by ICP in sequence. Any samples with concentrations exceeding the calibration curve range were appropriately diluted and reanalyzed.
3. Results and Discussion
3.1. Impurities in Quartz Sand
XRD analysis of the quartz sand was first performed. As presented in Figure 1, the raw quartz sand is in the typical quartz phase. As the impurity content exceeded the detection limit of XRD, ICP-OES was employed to determine the concentrations of the major impurity elements. As shown in Table 1, the “Sum” parameter represents the total concentration of the dominant impurity elements (i.e., elements that together constitute at least 95% of the impurity load: Al, Fe, K, Li), accounting for 95.63% of the total impurity load. Consequently, “Sum” was employed as the critical indicator for optimizing the process parameters in subsequent experiments.
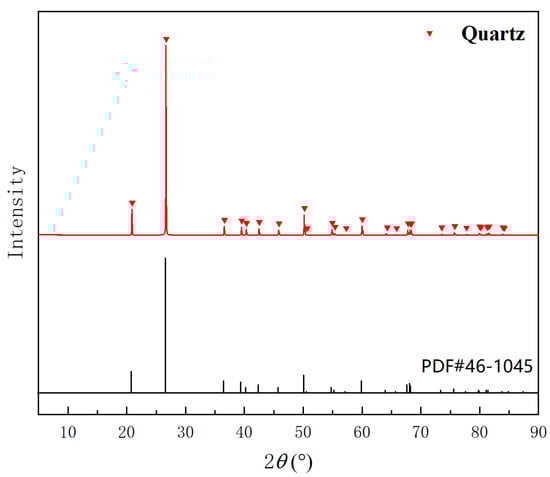
Figure 1.
XRD pattern of raw quartz sand.
To observe the microstructure, the raw quartz sand was examined under an optical microscope. As shown in Figure 2, the inclusion analysis performed by revealed that 88% of the quartz sand particles were classified as opaque. A subset of these appeared relatively transparent, containing fewer inclusions that were also more localized. However, the remainder, were densely packed with inclusions distributed uniformly throughout the entire grain, causing them to appear black under optical microscopy. The removal of these deeply embedded inclusions poses a significant challenge for impurity extraction.
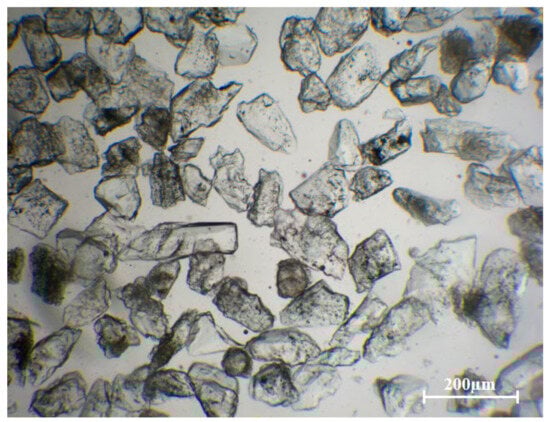
Figure 2.
Optical micrograph of quartz sand particles at 50× magnification.
Impurities in quartz are classified into three categories, i.e., independent minerals, inclusions, and lattice impurities [,]. Larger independent minerals, existing separately from quartz grains, are relatively easy to remove. In contrast, smaller minerals, often embedded within quartz particles, are referred to as mineral inclusions. To identify the mineral impurities, thin sections were prepared from crushed raw quartz ore using a diamond wire saw and subsequently examined under an optical microscope. As shown in Figure 3a,b, independent minerals observed in thin sections of the raw quartz include yellowish-brown film-like impurities, identified as hematite films on the surface of quartz grains. In addition, white blocky independent minerals approximately 100 µm in size, distributed within the quartz matrix, which are likely metallic minerals. These larger independent mineral impurities can be effectively removed through crushing and manual sorting processes, with most residual impurities being eliminated during subsequent acid-leaching treatments [,,].
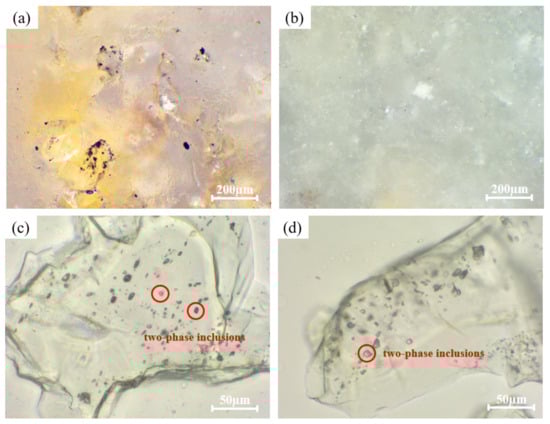
Figure 3.
(a,b) Large isolated minerals in raw quartz matrix. (c) Fluid inclusions distributed throughout the particles. (d) Fluid inclusions concentrated at the edges.
Inclusions can be classified into mineral inclusions and fluid inclusions. The formation mechanisms of fluid inclusions involve entrapment during crystal growth and fluid infiltration into quartz fractures. Mineral inclusions in quartz form through entrapment during growth from a melt, capture during grain boundary migration in metamorphism, or exsolution during the cooling or decompression of supersaturated quartz []. As shown in Figure 3c,d, the raw quartz contains rich fluid inclusions, which exhibit two distribution patterns, i.e., scattered throughout the particles (Figure 3c), and concentrated along the edges (Figure 3d). Furthermore, two-phase gas–liquid inclusions also can be observed within the red circles in the figures. These fluid inclusions display a banded distribution, with individual shapes, ranging primarily from 2 to 20 µm in size.
Mineral inclusions in the raw quartz sand were further characterized by SEM and EDS. As shown in Figure 4a, the inclusion exhibits a layered structure with a size of approximately 40 µm. EDS point analysis (insert in Figure 4a) reveals that the main elements are K, Al, Si, and O, with corresponding contents of 3.99%, 10.36%, 20.55%, and 65.10%, respectively. This composition identifies the phase as muscovite (e.g., KAl2(AlSi3O10) (OH)2). Furthermore, a white inclusion approximately 5 µm in size is visible in Figure 4b. EDS point analysis identifies Fe and O as the main elements (contents of 36.04% and 35.28%, respectively), confirming it as an iron oxide (e.g., Fe2O3). Lattice impurities exist in two forms, i.e., one type substitutes for Si4+ (e.g., Al3+, Fe3+, Ti4+), while the other occupies interstitial sites in the lattice channels (e.g., Li+, K+). The latter primarily acts as charge compensators for the substituting ions, as illustrated in Figure 4c []. Among these, Al3+ substitution for Si4+ is the most common and is typically charge-compensated by H+, Li+, or Na+, as indicated by the red circles in Figure 4c. Although Li is the fourth most abundant impurity element in the raw quartz sand, no Li-bearing inclusions were detected in SEM analysis of ore thin sections. Previous studies have shown that the [FeO4/2/Li+]0 center exhibits lower lattice distortion energy than the [FeO4/2/Na+]0 center []. It has also been demonstrated that Al3+ substitution for Si4+ is the main reason for the incorporation of H+, Li+, and Na+ into the lattice. When the concentration of substitutional Al3+ exceeds 200 ppm, the concentration of Li as a charge compensator increases significantly []. In summary, Li is likely present in the lattice as a charge-compensating element.
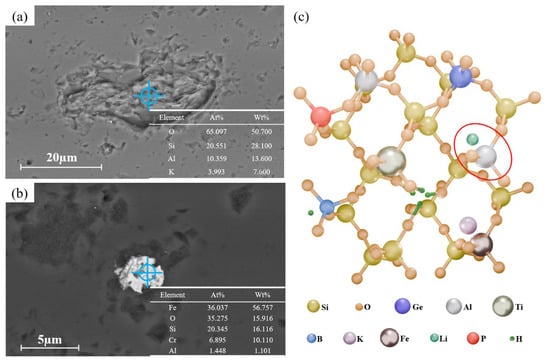
Figure 4.
SEM image of (a) potassium mica inclusions and (b) iron oxide inclusions. (c) Schematic diagram of lattice impurities in quartz.
3.2. Purification of Quartz Sand by Acid-Leaching Treatment
Acid-leaching experiments were first conducted using a 5 wt% mixture of HF and H2C2O4 at a solid-to-liquid ratio of 2:1 for 4 h. It should be specifically noted that this mass concentration refers to the concentration of the stock single-acid solutions used to prepare the leaching solution. The experiments were performed at temperatures ranging from 40 to 80 °C (in 10 °C increments). The removal efficiency is calculated using Equation (1). In the equation, w1 is the original impurity content and w2 is the impurity content after acid leaching. The impurity content is calculated using Equation (2). In the equation, x is the instrument reading; is the dilution factor; V is the final volume and m is the sample mass. As shown in Figure 5, high removal efficiencies were achieved for Al, Fe, and K, indicating their effective removal, whereas the removal efficiency of Li remained low. With increasing temperature from 40 °C to 80 °C, the total impurity content decreased gradually, and the overall removal efficiencies improved consistently. The optimum condition, characterized by the lowest total impurity content and the highest removal efficiency, was observed at 80 °C. The increase in temperature enhanced both the reaction kinetics and the extent of acid-impurity interactions, resulting in the best purification efficiency at 80 °C [,]. Therefore, this temperature was selected for subsequent acid-leaching experiments.
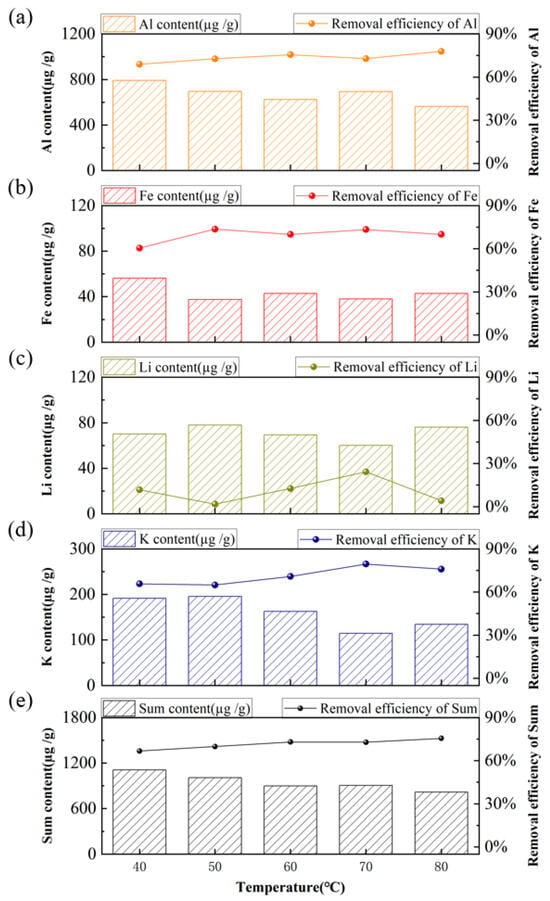
Figure 5.
Effect of acid-leaching temperature on the content and removal efficiency of major impurities. (a) Al, (b) Fe, (c) K, (d) Li, (e) Sum of Al, Fe, K, and Li.
Ten different acid combinations involving HF, HCl, H2SO4, HNO3, and H2C2O4 (with HF as a constant component) were systematically evaluated under the following conditions, i.e., acid-leaching temperature of 80 °C, acid concentration of 5 wt%, leaching time of 4 h, and a solid-to-liquid ratio of 2:1. The results of the acid-leaching experiments are presented in Figure 6. The HF-HCl-H2SO4 was most effective, resulting in the lowest total impurity content. This can be attributed to the fact that Al is the most abundant impurity element in the raw quartz sand, and both sulfuric acid and hydrochloric acid exhibit high effectiveness in dissolving Al-containing compounds [,,,,]. Consequently, the HF-HCl-H2SO4 system was selected for subsequent acid-leaching experiments.
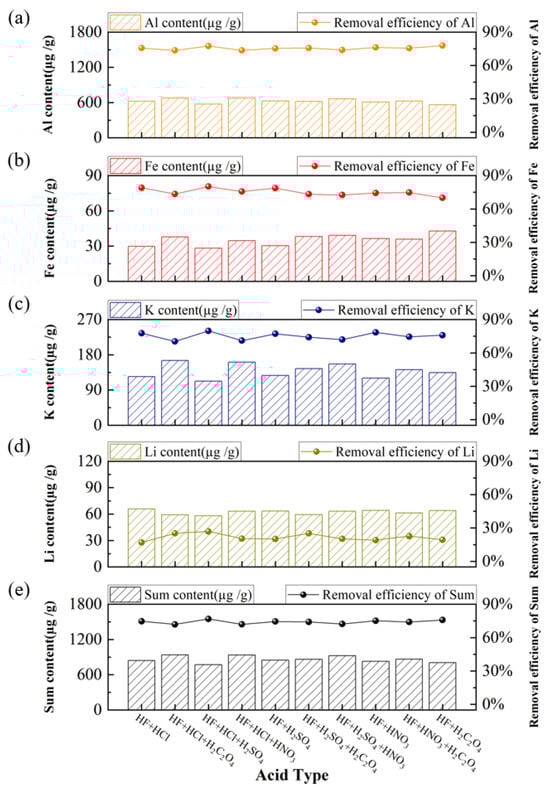
Figure 6.
Effect of acid type on the content and removal efficiency of impurities, (a) Al, (b) Fe, (c) K, (d) Li, (e) Sum of Al, Fe, K, and Li.
As the conditions of acid-leaching temperature (80 °C), acid system of HF-HCl-H2SO4 (volume ratio 1:1:1), leaching time (4 h), and solid-to-liquid ratio (2:1) were optimized, the acid-leaching experiments were further conducted at acid concentrations ranging from 1% to 10% by weight (1%, 2%, …, 10%). As shown in Supplementary Figure S1, the 0% corresponds to the raw quartz sand material without acid-leaching treatment. The Al impurity removal efficiency increased sharply between 0% and 1% acid concentration, indicating that easily soluble independent minerals were effectively dissolved even at low acid dosages. The removal efficiencies of Al, K, and Fe impurities (Figure 7a, b, and c, respectively) continued to rise gradually with increasing acid concentration before eventually stabilizing. This trend reflects the dissolution of impurities that exist as mineral inclusions. In contrast, the removal efficiency of Li impurities (Figure 7d) exhibited no clear correlation with acid concentration, which is attributed to its predominant occurrence as lattice impurities that are difficult to remove. As the acid concentration increased from 1% to 7%, the total impurity content decreased progressively, leading to an improvement in overall removal efficiency. However, when the concentration exceeded 7% or even 10%, no significant additional reduction in total impurity content or enhancement in removal efficiency was observed. As the acid concentration increases, its reactivity gradually diminishes, causing the impurity removal efficiency curve to plateau [,]. Concurrently, once the acid concentration is sufficiently high to remove surface and near-surface impurities, further increases in concentration do not enhance impurity removal efficiencies, as the low etching rate of quartz prevents the release of deeper-seated impurities []. Therefore, an acid concentration of 7% was selected for the subsequent acid-leaching experiments.
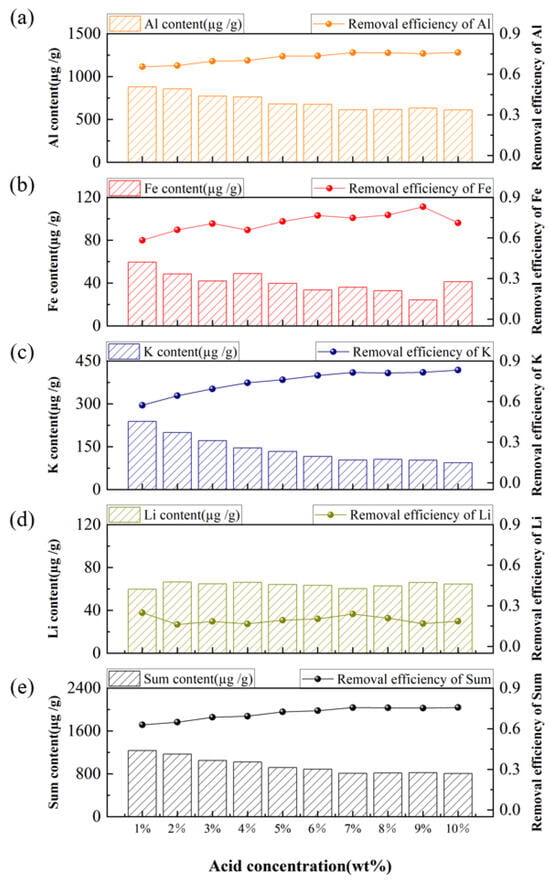
Figure 7.
Effect of acid concentration on the content and removal efficiency of impurities, (a) Al, (b) Fe, (c) K, (d) Li, (e) Sum of Al, Fe, K, and Li.
The influence of leaching durations on the content and removal efficiency of impurities was further investigated in the acid system of HF-HCl-H2SO4 (volume ratio 1:1:1) under the leaching temperature of 80 °C with an acid concentration of 7 wt% and a solid-to-liquid ratio of 2:1. Figure 8 shows the results of acid-leaching experiments conducted with leaching durations of 0.5 h, 1 h, 2 h, 4 h, 6 h, 8 h, 16 h, and 24 h. The results show that the total impurity content decreased progressively as the leaching time increased from 0.5 h to 6 h, leading to a corresponding improvement in overall removal efficiency. However, further extending the time beyond 6 h up to 24 h resulted in a significantly slower reduction in impurity content and improvement in efficiency. Based on these observations, a leaching time of 6 h was selected as most suitable time for subsequent acid-leaching experiments.
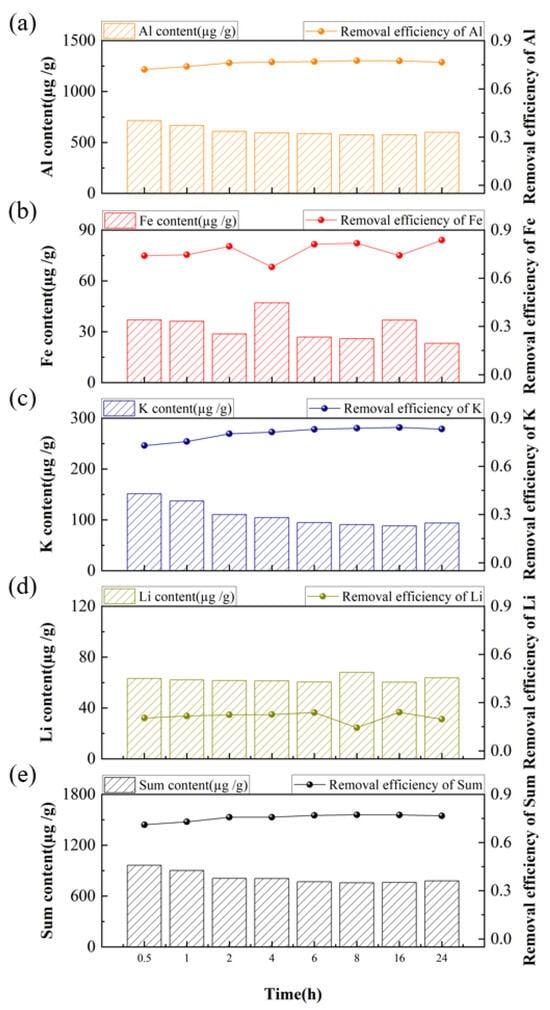
Figure 8.
Effect of acid-leaching time on the content and removal efficiency of impurities, (a) Al, (b) Fe, (c) K, (d) Li, (e) Sum of Al, Fe, K, and Li.
The acid-leaching experiments were further conducted at various solid-to-liquid ratios of 4:1, 3:1, 2:1, 1:1, 1:2, 1:3, and 1:4 in HF-HCl-H2SO4 (volume ratio 1:1:1) with an acid concentration of 7 wt% under the temperature of 80 °C for 6 h. The results (Figure 9) indicate that even at a high solid-to-liquid ratio of 4:1, where wetting was insufficient, the acid vapor generated in covered beakers effectively reacted with impurities in the small quartz sand sample, preventing a significant decline in removal efficiency. As the solid-to-liquid ratio decreased from 4:1 to 1:1, the total impurity content dropped steadily, correlating with a consistent improvement in overall removal efficiency. However, beyond the 1:1 ratio, further dilution to 1:4 resulted in a markedly slower efficiency of change in both parameters. At higher solid-to-liquid ratios, the acid may be insufficient to fully saturate the quartz sand, leading to incomplete reactions. Conversely, when the S:L ratio is lower than 1:1, excess acid beyond the stoichiometric requirement drives impurity dissolution toward equilibrium []. Decreasing the solid-to-liquid ratio enhances slurry fluidity and mass transfer efficiency, ensuring complete interaction between acid and quartz sample. However, excessively low solid-to-liquid ratios significantly reduce mass transfer rates and result in over-dilution of the leachate, which in turn lowers impurity removal efficiency due to reduced oxide concentrations [,]. Therefore, a solid-to-liquid ratio of 1:1 was identified as the optimal for this acid-leaching process.
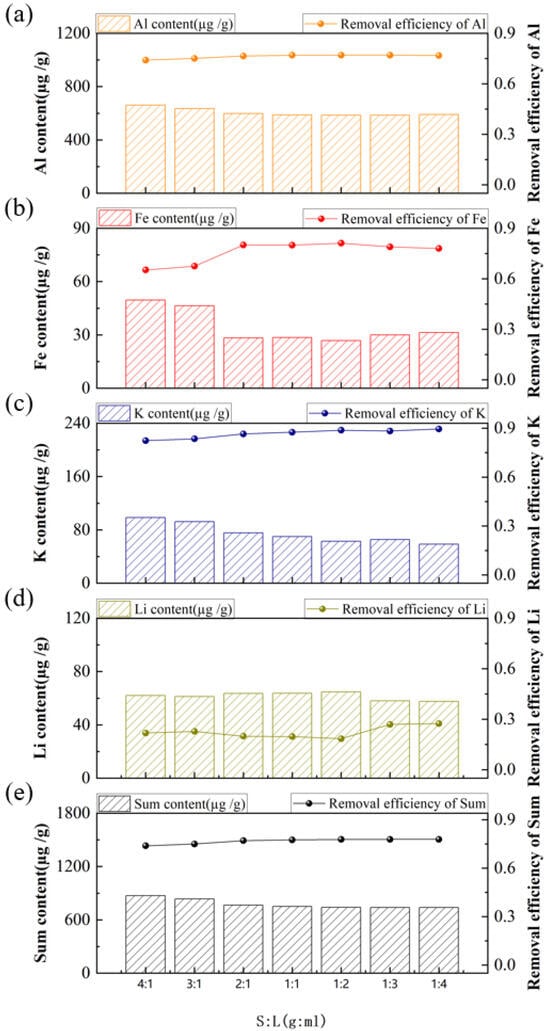
Figure 9.
Effect of solid-to-liquid ratio on the content and removal efficiency of impurities, (a) Al, (b) Fe, (c) K, (d) Li, (e) Sum of Al, Fe, K and Li.
Ultimately, the optimized leaching conditions were established as follows: acid-leaching temperature of 80 °C, mixed acid system of HF-HCl-H2SO4 (volume ratio 1:1:1), an acid concentration of 7 wt%, a leaching time of 6 h, and a solid-to-liquid ratio of 1:1. The impurity content of the resulting high-purity quartz sand under these optimal conditions is summarized in Table 2, with a final purity of 99.92%.
Table 2.
Impurity content of the quartz sand obtained under optimal process (µg/g).
A Pearson correlation analysis was performed on the contents of Al, K, Fe, and Li impurities, with the results summarized in Table 3. In experiments testing different acid types, the correlation among impurities was relatively weak, which is attributed to the distinct removal efficiencies of each acid for specific impurities. In contrast, experiments investigating other parameters revealed a significant correlation between the contents of Al and K impurities. Conversely, the correlations between Al and Fe, as well as between K and Fe, were comparatively weak. These results indicate that Al and K impurities, which are associated with the similar carrier minerals (such as independent minerals and mineral inclusions), were removed concurrently. Iron impurities, also present as independent minerals and inclusions, exhibited a partial correlation with Al and K in certain conditions. However, Li existing primarily as a lattice impurity showed no correlation with Al, K, or Fe impurities.
Table 3.
Pearson correlation analysis of impurity content.
4. Conclusions
In conclusion, a comprehensive characterization and analysis were performed on the independent minerals, inclusion impurities, and acid-leaching purification effectiveness of a typical vein quartz ore from a specific location in Jiangxi Province. A series of acid-leaching experiments was investigated systematically, and the results show that the removal difficulty during purification follows the order: lattice impurities > inclusions > independent minerals. This conclusion is supported by three key findings: (1) A low acid concentration of 1% effectively removed 62.89% of impurities, confirming the easy dissolution of independent minerals. (2) A significant correlation was observed between the content changes in K and Al. As process parameters were optimized, their removal efficiencies increased concurrently, indicating the progressive removal of muscovite inclusions. (3) Lattice impurity of Li exhibited consistently low removal efficiency across all optimized parameter sets, showing no significant variation. In summary, the removal characteristics are directly attributed to the occurrence forms of the impurities. An optimized chemical purification process was established with the following optimal conditions: acid-leaching temperature of 80 °C, mixed acid system of HF-HCl-H2SO4 (volume ratio 1:1:1), 7 wt% acid concentration, 6 h leaching time, and 1:1 solid-to-liquid ratio. As a result, the impurity content of the purified quartz sand was reduced to 795.75 µg/g, with a SiO2 content reaching 99.92%, achieving 3N-grade purity. This study provides a valuable reference for the chemical deep purification of other quartz sand types characterized by high aluminum and low iron content.
Supplementary Materials
The following supporting information can be downloaded at: https://www.mdpi.com/article/10.3390/min15111200/s1, Supplementary Figure S1. Effect of Acid Concentration on the Content and Removal Efficiency of Al Impurities (with Water Washing as Control).
Author Contributions
C.W.: Writing—original draft, Methodology, Investigation, Formal analysis; G.L.: Writing—review and editing, Methodology, Conceptualization; X.L. (Xing Lin): Methodology, Investigation; T.G.: Investigation, Formal analysis; Z.P.: Writing—review and editing, Conceptualization, Financial support; C.S.: Methodology, Formal analysis; W.G.: Project administration; R.Z.: Materials; H.X.: Materials; Q.X.: Supervision; X.Z.: Financial support; X.L. (Xionggang Lu): Financial support, Project administration. All authors have read and agreed to the published version of the manuscript.
Funding
This work was financially supported by the Jiangxi Silicon Ore Utilization Core Technology R & D Investment Co., Ltd. The authors also thank the National Natural Science Foundation of China (Nos. 52574439, 52334009, 52304331, 52374307), the National Key Research and Development Program of China (2023YFB3712401), the Innovation Program of Shanghai Municipal Education Commission (2023ZKZD48), the Science and Technology Commission of Shanghai Municipality (20230545).
Data Availability Statement
Data is contained within the article. The original contributions presented in this study are included in the article/Supplementary Material. Further inquiries can be directed to the corresponding author(s).
Conflicts of Interest
Guangshi Li, Zhongya Pang, Chenteng Sun and Weifan Gao are employees of Jiangxi Silicon Ore Utilization Core Technology R & D Investment Co., Ltd. Ronghua Zhang and Helin Xiao are employees of Jianji High-Tech Silicon Material Co., Ltd. The remaining authors declare that the research was conducted in the absence of any commercial or financial relationships that could be construed as a potential conflict of interest.
References
- Heynke, U.; Leeder, O.; Schulz, H. On distinguishing quartz of hydrothermal or metamorphogenic origin in different monomineralic veins in the eastern part of Germany. Mineral. Petrol. 1992, 46, 315–329. [Google Scholar] [CrossRef]
- Götze, J. Chemistry, textures and physical properties of quartz—Geological interpretation and technical application. Mineral. Mag. 2009, 73, 645–671. [Google Scholar] [CrossRef]
- Ai, G.; Guo, S.; Zhao, J.; Deng, X.; Wei, K.; Ma, W. Hot-pressure acid leaching changes grain boundaries to deeply remove impurities in quartz sand. J. Mater. Res. Technol. 2024, 30, 3705–3713. [Google Scholar] [CrossRef]
- Zhang, Z.; Li, J.; Li, X.; Huang, H.; Zhou, L.; Xiong, T. High efficiency iron removal from quartz sand using phosphoric acid. Int. J. Miner. Process. 2012, 114, 30–34. [Google Scholar] [CrossRef]
- Zhang, H.; Guo, S.; Wu, J.; Wu, D.; Wei, K.; Ma, W. Effect of quartz crystal structure transformations on the removal of iron impurities. Hydrometallurgy 2021, 204, 105715. [Google Scholar] [CrossRef]
- Dapiaggi, M.; Pagliari, L.; Pavese, A.; Sciascia, L.; Merli, M.; Francescon, F. The formation of silica high temperature polymorphs from quartz: Influence of grain size and mineralising agents. J. Eur. Ceram. Soc. 2015, 35, 4547–4555. [Google Scholar] [CrossRef]
- Qu, J.; Chen, Z.; Wu, D.; Ma, W. Study on the Purification Mechanism of Low-Grade Silicon Ore through a Combination of Direct Roasting and Pressure Leaching. Silicon 2024, 16, 5257–5271. [Google Scholar] [CrossRef]
- Lin, M.; Pei, Z.; Lei, S. Mineralogy and processing of hydrothermal vein quartz from Hengche, Hubei Province (China). Minerals 2017, 7, 161. [Google Scholar] [CrossRef]
- Ren, Z.; Liu, Z.; Liu, Y.; Gao, H.; Wu, F.; Song, Y. The effects of calcination-water quenching on quartz purification and its mechanism. Min. Metall. Explor. 2023, 40, 2519–2527. [Google Scholar] [CrossRef]
- Li, Y.; Ma, Q.; Xia, Z.; Li, W.; Lei, S. Influences of Na2CO3 roasting and H3PO4 hot-pressure leaching on the purification of vein quartz to achieve high-purity quartz. Hydrometallurgy 2023, 218, 106065. [Google Scholar] [CrossRef]
- Li, Y.; Li, S.; Pan, X.; Zhao, X.; Guo, P.; Zhao, Z. Recovery and preparation of high-grade silica from iron ore tailings by S-HGMS coupling with acid leaching technology: Description of separation mechanism and leaching kinetics. Powder Technol. 2023, 424, 118523. [Google Scholar] [CrossRef]
- Crundwell, F.K. On the mechanism of the dissolution of quartz and silica in aqueous solutions. ACS Omega 2017, 2, 1116–1127. [Google Scholar] [CrossRef] [PubMed]
- Zhang, Q.D.; Li, X.L.; Song, Y.S.; Zhou, G.Y. Experimental Research on preparation technics of high-purity quartz material. Key Eng. Mater. 2017, 748, 17–21. [Google Scholar] [CrossRef]
- Müller, A.; Koch-Müller, M. Hydrogen speciation and trace element contents of igneous, hydrothermal and metamorphic quartz from Norway. Mineral. Mag. 2009, 73, 569–583. [Google Scholar] [CrossRef]
- Thomas, R.; Davidson, P.; Badanina, E. Water-and boron-rich melt inclusions in quartz from the Malkhan pegmatite, Transbaikalia, Russia. Minerals 2012, 2, 435–458. [Google Scholar] [CrossRef]
- Wang, S.; Yu, D.; Ma, C.; Wei, F.; Zhang, H. A new insight into the influence of fluid inclusions in high-purity quartz sand on the bubble defects in quartz glass: A case study from vein quartz in the dabie mountain. Minerals 2024, 14, 794. [Google Scholar] [CrossRef]
- Mifsud, C.; Fujioka, T.; Fink, D. Extraction and purification of quartz in rock using hot phosphoric acid for in situ cosmogenic exposure dating. Nucl. Instrum. Methods Phys. Res. Sect. B Beam Interact. Mater. At. 2013, 294, 203–207. [Google Scholar] [CrossRef]
- Ambikadevi, V.R.; Lalithambika, M. Effect of organic acids on ferric iron removal from iron-stained kaolinite. Appl. Clay Sci. 2000, 16, 133–145. [Google Scholar] [CrossRef]
- Pan, X.; Li, S.; Li, Y.; Guo, P.; Zhao, X.; Cai, Y. Resource, characteristic, purification and application of quartz: A review. Miner. Eng. 2022, 183, 107600. [Google Scholar] [CrossRef]
- Liu, C.; Wang, W.; Wang, H.; Zhu, C.; Ren, B. A review on removal of iron impurities from quartz mineral. Minerals 2023, 13, 1128. [Google Scholar] [CrossRef]
- Mowla, D.; Karimi, G.; Ostadnezhad, K. Removal of hematite from silica sand ore by reverse flotation technique. Sep. Purif. Technol. 2008, 58, 419–423. [Google Scholar] [CrossRef]
- Martínez-Luévanos, A.; Rodríguez-Delgado, M.G.; Uribe-Salas, A.; Carrillo-Pedroza, F.R.; Osuna-Alarcón, J.G. Leaching kinetics of iron from low grade kaolin by oxalic acid solutions. Appl. Clay Sci. 2011, 51, 473–477. [Google Scholar] [CrossRef]
- Götze, J.; Möckel, R. Quartz: Deposits, Mineralogy and Analytics; Springer: Berlin/Heidelberg, Germany, 2012. [Google Scholar]
- Stegger, P.; Lehmann, G. Dynamic effects in a new substitutional center of trivalent iron in quartz. Phys. Status Solidi (B) 1989, 151, 463–467. [Google Scholar] [CrossRef]
- Miyoshi, N.; Yamaguchi, Y.; Makino, K. Successive zoning of Al and H in hydrothermal vein quartz. Am. Mineral. 2005, 90, 310–315. [Google Scholar] [CrossRef]
- Du, F.; Li, J.; Li, X.; Chang, Z. Improvement of iron removal from silica sand using ultrasound-assisted oxalic acid. Ultrason. Sonochem. 2011, 18, 389–393. [Google Scholar] [CrossRef] [PubMed]
- Kline, W.E.; Fogler, H.S. Dissolution of silicate minerals by hydrofluoric acid. Ind. Eng. Chem. Fundam. 1981, 20, 155–161. [Google Scholar] [CrossRef]
- Knauss, K.G. Muscovite dissolution kinetics as a function of pH and time at 70 °C. Geochim. Cosmochim. Acta 1989, 53, 1493–1501. [Google Scholar] [CrossRef]
- Brantley, S.L. Kinetics of mineral dissolution. In Kinetics of Water-Rock Interaction; Springer: New York, NY, USA, 2008; pp. 151–210. [Google Scholar]
- Guo, H.; Kuang, G.; Wan, H.; Yang, Y.; Yu, H.-Z.; Wang, H.-D. Enhanced acid treatment to extract lithium from lepidolite with a fluorine-based chemical method. Hydrometallurgy 2019, 183, 9–19. [Google Scholar] [CrossRef]
- Lin, M.; Pei, Z.Y.; Lei, S.M.; Liu, Y.Y.; Xia, Z.J.; Xie, F.X. Trace muscovite dissolution separation from vein quartz by elevated temperature and pressure acid leaching using sulphuric acid and ammonia chloride solutions. Physicochem. Probl. Miner. Process. 2018, 54, 448–458. [Google Scholar]
- Yang, C.; Li, S.; Bai, J.; Liu, Y.; Wang, G. Advanced Purification of Industrial Quartz Using Calcination Pretreatment Combined with Ultrasound-Assisted Leaching. Acta Geodyn. Geomater. 2018, 15, 187–195. [Google Scholar] [CrossRef]
- Li, J.; Li, X.; Shen, Q.; Zhang, Y.; Hu, Y. Further Purification of Industrial Quartz by Much Milder Conditions and a Harmless Method. Environ. Sci. Technol. 2010, 44, 7673–7677. [Google Scholar] [CrossRef] [PubMed]
Disclaimer/Publisher’s Note: The statements, opinions and data contained in all publications are solely those of the individual author(s) and contributor(s) and not of MDPI and/or the editor(s). MDPI and/or the editor(s) disclaim responsibility for any injury to people or property resulting from any ideas, methods, instructions or products referred to in the content. |
© 2025 by the authors. Licensee MDPI, Basel, Switzerland. This article is an open access article distributed under the terms and conditions of the Creative Commons Attribution (CC BY) license (https://creativecommons.org/licenses/by/4.0/).