Abstract
The study presents experimental results on the adsorption of endosulfan in new natural zeolite deposits from Mexico. The adsorption of this herbicide was evaluated using inverse gas chromatography with a thermal conductivity detector and helium as the carrier gas. The experimental adsorption data were analyzed using the Langmuir and Freundlich equations in their linear form over a temperature range of 413–573 K. The study also estimated thermodynamic parameters such as the Free Energy of Gibbs (ΔG), isosteric enthalpy of adsorption (ΔH), and entropy change (ΔS) within this temperature range. The results indicated that the zeolites studied had a low adsorption capacity for this herbicide under the experimental conditions. The study also quantitatively determined the presence of starting minerals, with Na-Mordenite and Na-Clinoptilolite being the most prevalent, followed by Ca-Chabazite, Ca-Clinoptilolite, and Montmorillonite, with Quartz being present in low amounts. The NMOR zeolite underwent ion exchanges with AgNO3 to produce the Ag-MOR zeolite and assess its herbicide adsorption capacity. Another mineral, Ca-Stilbite, was present in higher quantities than Ca-Clinoptilolite and Quartz.
1. Introduction
To reduce the concentration of herbicides such as endosulfan to non-toxic levels, various methods have been proposed, including adsorption and heterogeneous catalysis. The materials used for these methods must be highly efficient at adsorbing these compounds, and some suggested materials include activated carbons, certain MCM-41 materials, and zeolites [1]. Natural zeolites, particularly narrow-pore zeolites like clinoptilolite (HEU), mordenite (MOR), erionite (ERI), chabazite (CHA), and stilbite (STI), have been recommended for the treatment of herbicides like endosulfan. Mexico has deposits of these natural zeolites [2]. The MOR zeolite has an orthorhombic unit cell with dimensions a = 1.81 nm, b = 2.05 nm, c = 0.750 nm, and α = β = γ = 90°, and a Si/Al ratio of 4.5–5.5. The MOR channels consist of a dual channel system, with dimensions of 0.65–0.7 nm for channel A and 0.26–0.57 nm for channel B. On the other hand, the STI zeolite has an eight-part channel system with dimensions of 0.45 × 0.37 nm. The suggested application for this zeolite is in the treatment of gases with kinetic diameters less than 0.37 nm. Another recommended zeolite for adsorbing this type of herbicide is the CHA zeolite, which consists of D6R units attached to vertically stacked cancrinite cells, generating 8-membered pores with dimensions of 0.38 nm. Its unit cell formula is Ca6 (H2O)40 [Al12Si24O72] [3]. Inverse gas chromatography (IGC) is an analytical technique used to study the surface and bulk properties of various materials. In IGC, a single standard gas or vapor (the probe molecule) is injected into a column packed with the solid sample under investigation. By measuring how the retention time of the probe molecule changes with varying conditions (such as probe molecule chemistry, size, concentration, column temperature, or carrier gas flow rate), IGC provides insights into a wide range of physicochemical properties of the solid material. One of the primary uses of IGC is to measure the surface energy of solids. Surface energy refers to the amount of energy needed to create a unit area of a solid surface. IGC experiments are usually conducted under “infinite dilution,” where only small amounts of the probe molecule are introduced. This region is also referred to as the Henry’s law region or the linear region of the sorption isotherm. In this state, interactions between probe molecules are considered negligible, and any adsorption is solely attributed to interactions between the probe and the solid [4]. Agriculture in various states of Mexico is considered to be one of the most developed areas in the country, characterized by a large crop area and a modern irrigation system. However, to meet market demands, a significant amount of inputs and agrochemicals are used, leading to soil degradation, environmental contamination, and adverse effects on living beings’ health [5]. Soils used for agriculture can accumulate pesticides due to adsorption processes with organic matter and water retention, which can impact human health [6]. Chlorinated hydrocarbons, such as endosulfan, Figure 1, are widely used in the agricultural sector and are not easily degradable [7]. Endosulfan, in particular, is highly toxic, stable in the environment, and takes a long time to degrade into less toxic forms [8,9,10]. In Mexico, approximately 65% of pesticide use is applied to crops such as corn, sorghum, soybeans, sugar cane, rice, vegetables, and pastures [11]. The highest use of endosulfan in Mexico is found in specific regions including Sinaloa, Chiapas, Veracruz, Jalisco, Nayarit, Colima, Sonora, Baja California, Tamaulipas, Michoacán, Tabasco, State of Mexico, Puebla, and Oaxaca [12].
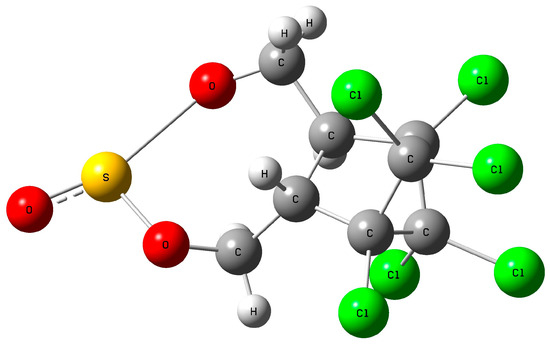
Figure 1.
Endosulfan structure.
This study aims to assess endosulfan’s interaction with natural zeolites in Mexico using dynamic methods (IGC). This work is innovative in its application of natural zeolites (CHA, MOR, and STI types) for the adsorption of the herbicide endosulfan.
2. Materials and Methods
2.1. Materials
This work utilized the natural zeolites MOR, CHA, and STI. The location of the deposit and crystalline phases are reported in Table 1. Additionally, the reactive substances HCl and AgNO3 were purchased from Aldrich. Ultra-high-purity N2 and He gases (>99.999%, INFRA Corp., Naucalpan, Mexico) were used for textural sorption studies of natural and modified zeolites.

Table 1.
Location and mineralogy of natural zeolites from Mexico (XRD).
2.2. Methodology of Chemical Treatment of Mordenite, HMOR, and AgMOR
The samples were initially obtained as rocks, crushed, and sieved with mesh No. 60–80 (mesh 35). They were then washed with deionized water to remove soluble material and impurities. Modified mordenite samples HMOR and AgMOR were prepared from the NMOR precursor. They were treated 1 time with 0.01 N solutions of HCl and then with AgNO3 under stirring for 6 h at 50 °C.
2.3. Experimental Measurement Techniques
- (i)
- X-ray diffraction (XRD) and energy-dispersive X-ray spectroscopy (EDS) (Bruker Corp. Billerica, MA, USA): To identify the crystalline phases present in each sample, a Bruker model D8 Discover diffractometer was used with nickel-filtered Cu Kα (λ = 0.154 nm) radiation operated at 40 kV and 30 mA. The High Score Plus 3.0e computer program was used to quantify the percentages of the phases present in each sample [13]. Chemical analysis by X-ray energy dispersion (XPS) was also performed on each zeolite.
- (ii)
- SEM (JEOL LTD. Tokyo, Japan): The size and shapes of the zeolite crystals under study were obtained with a JEOL model JSM-7800F high-resolution scanning electron microscope at 5 kV. The samples were mounted on aluminum stub holders and subsequently coated with Au using a sputtering coater.
- (iii)
- FT-IR (Perkin-Elmer, Inc., Shelton, CT, USA): Changes in intensities and positions of the bands corresponding to the characteristic ring and Me single-bond O vibrations were observed by FT-IR study of the adsorption of endosulfan on zeolites. These FT-IR study spectra of endosulfan were collected and injected into a 1725X Perkin-Elmer spectrometer by co-adding 100 scans in the wavenumber range 4000–400 cm−1.
- (iv)
- N2 adsorption: All N2 adsorption studies at its boiling temperature were carried out in fully automatic volumetric adsorption equipment. The relevant equations used for the calculation were the Langmuir [14], BET [15], De Boer [16], and BJH [17] equations.
2.4. Adsorption of Endosulfan
Adsorption chromatographic studies were performed on a GC-PerkinElmer AutoSystem XL gas chromatograph (Perkin-Elmer, Inc., Shelton, CT, USA): equipped with a thermal conductivity detector and He as a carrier gas. The gas was injected in its pure form to measure its corresponding properties. Retention time inside the appropriate zeolite column. Inverse gas chromatography (IGC) was followed in this work to obtain the chromatographic peaks [18]. Thermodynamic parameters, Free Energy of Gibbs ∆G, entropy change ∆S, and isosteric enthalpy of adsorption ∆H = qst of endosulfan were calculated from sorption data obtained at these temperatures [19].
The research in this work focuses on the investigation of zeolites. Table 2 lists the adsorption models used, and the data for endosulfan adsorption were analyzed using standard Freundlich and Langmuir adsorption equations through linear regression. The Henry constants (KH) at different temperatures for the adsorbent–adsorptive pairs used in this work were evaluated by using gas adsorption data at low pressure. The Freundlich adsorption equation, which includes a (adsorbed amount in mmol g−1), KF (Freundlich adsorption constant), and n (exponential factor), was utilized. Similarly, the Langmuir equations, which involve a (amount adsorbed on the solid walls at pressure p) and am (monolayer capacity evaluated from the Langmuir equation, where Kam = KH), were also used.
Table 2.
Isotherm models are used in this work.
3. Results
The mordenite zeolite was exchanged with a dilute AgNO3 solution to create an Ag-MOR zeolite. The X-ray diffraction (XRD) and energy-dispersive X-ray spectroscopy (XPS) results confirm that ion exchanges occurred both within the internal structure and on the external surface of the zeolite. Figure 2a displays the diffraction patterns for mordenite (NMOR), mordenite treated with dilute HCl solutions (HMOR), and mordenite chemically modified with AgNO3 solution (AgMOR). Additionally, Figure 2b shows the diffraction patterns of mordenite, chabazite (NCHA), and stilbite (NSTI) zeolites.
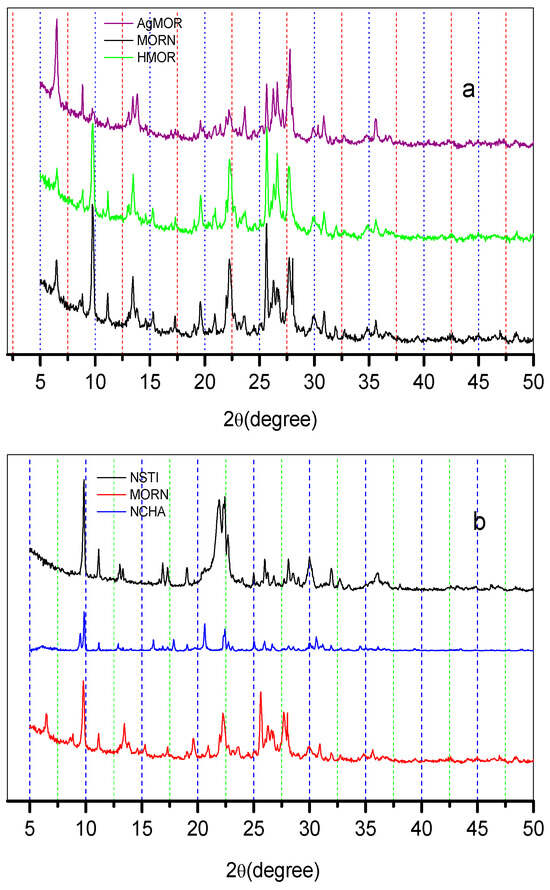
Figure 2.
X-ray diffraction patterns in zeolites used in this work, Rietveld method: (a) mordenite zeolites chemically modified and (b) mordenite, stilbite, and chabazite zeolites.
Chemical composition studies (EDS) confirm the presence of K as the major cation for NMOR zeolites (Table 3).
Table 3.
The chemical composition of the samples (mass %), is based on EDS data.
3.1. SEM
SEM images of mordenite and clinoptilolite zeolites are seen in Figure 3.
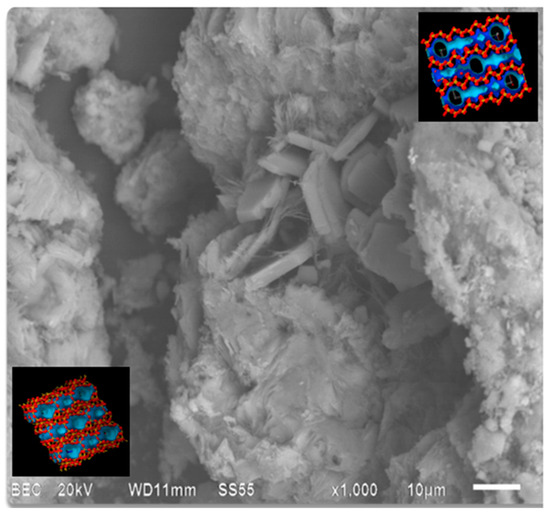
Figure 3.
SEM image of zeolitic tuff at 1000 times magnification.
3.2. FTIR Studies of Natural Zeolites
The FTIR spectra of the NMOR and its modified forms (HMOR and AgHMOR), NCHA, and NSTI zeolites are shown in Figure 4a,b.
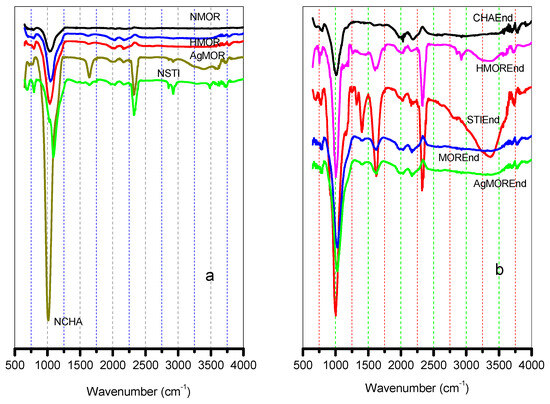
Figure 4.
FTIR spectra of (a) natural zeolites without endosulfan and (b) natural zeolites with endosulfan.
The FT-IR spectrum of the natural zeolite sample is shown in Figure 4a. There is an absorption band at around 440 cm−1, which is attributed to the Silicon Aluminum lattice. The strongest infrared absorption band at 1020 cm−1 is assigned to the valence vibration of (Al, Si)-O bonds. OH- was observed at 3568 cm−1 and H2O was observed at 1645 cm−1. Meanwhile, the IR spectrum of the endosulfan-impregnated zeolite showed two groups of bands (Figure 4b). The first consists of a relatively broad band at 3734 cm−1 and a no-resolved low-resolution band of low intensity at 3745 cm−1. The latter band is attributed to SiOH groups terminating the zeolite crystal, while the band at 3734 is attributed to SiOH groups terminating defects in the inner of the zeolite pores. The other group consisting of OH stretching bands at 3612, 3597, and 3586 cm−1 is attributed to SiOHAl Brønsted acid hydroxyl groups in CHA.
3.3. N2 Adsorption–Desorption
Figure 5a displays the N2 adsorption isotherms at 77 K on mordenite (NMOR), chemically treated with HCl (HMOR) and AgNO3 (AgMOR). In Figure 5b, the isotherms of chabazite (NCHA) and stilbite (NSTI) are also included. The results of the textural studies of the analyzed zeolites are reported in Table 4.
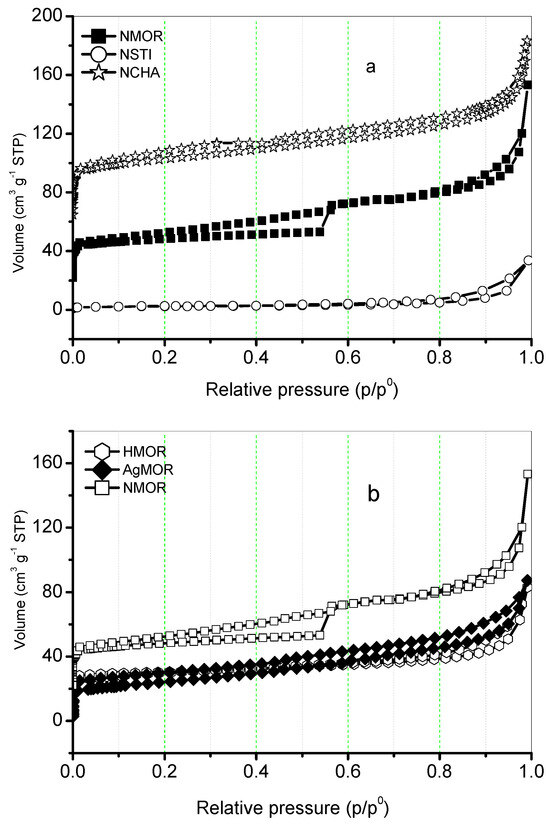
Figure 5.
N2 adsorption-desorption isotherms at 77 K on (a) NMOR, NCHA, and NSTI and (b) NMOR, HMOR, and AgMOR.
Table 4.
Textural parameters of mordenite, chabazite, and stilbite, N2 adsorption.
The Pore Size Distribution was Determined Using the BJH Equation
The results of applying the BJH method to the MOR zeolites are shown in Figure 6.
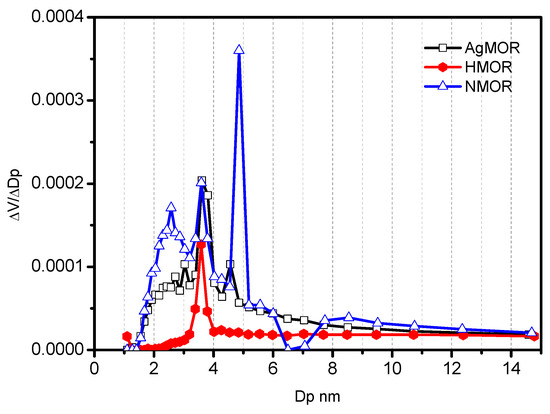
Figure 6.
Pore size distribution of MOR zeolites.
3.4. Adsorption of Endosulfan
The endosulfan adsorption isotherms for the zeolites studied are shown in Figure 7 and Figure 8 at different temperatures (413–573 K). The Freundlich, Henry, and Langmuir constants are listed in Table 4. Additionally, the evolution of the isosteric adsorption enthalpies is depicted in Figure 9. The thermodynamic variables, including the Free Energy of Gibbs, isosteric enthalpy of adsorption, and entropy, can be found in Table 5.
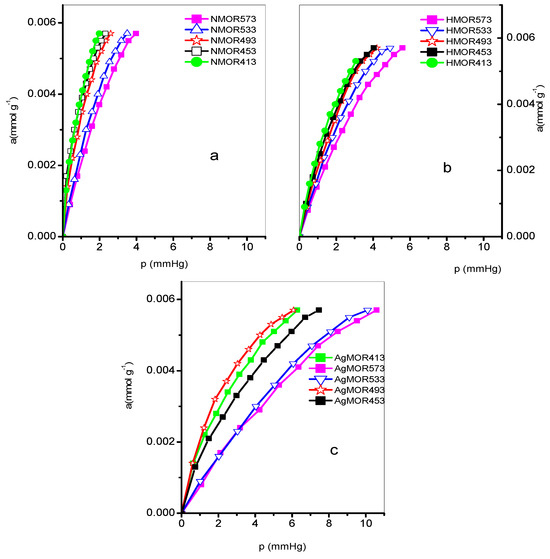
Figure 7.
Adsorption isotherms at different temperatures in mordenite: (a) NMOR, (b) HMOR, and (c) AgHMOR.
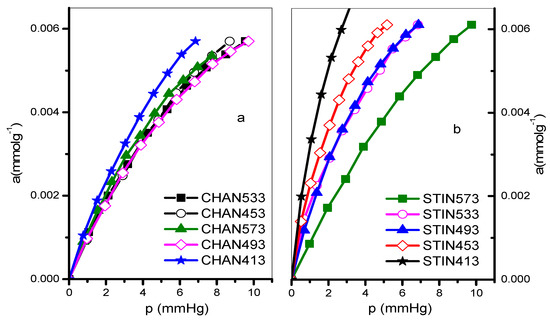
Figure 8.
Adsorption isotherms of endosulfan on (a) CHAN and (b) STIN zeolites at different temperatures.
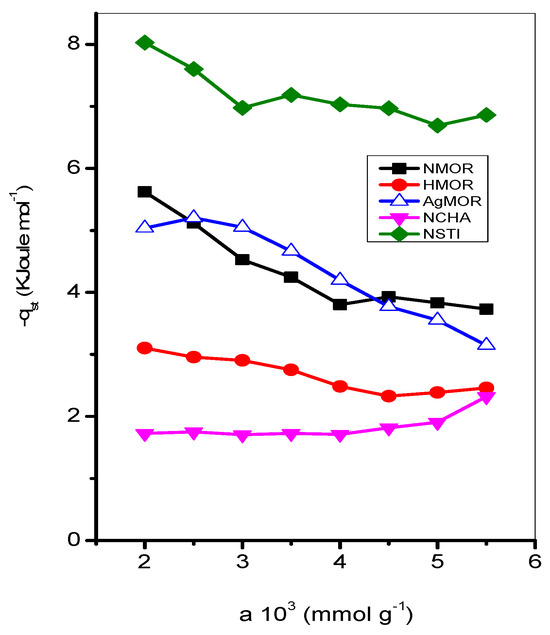
Figure 9.
Isosteric enthalpy of adsorption of endosulfan on samples studied.
Table 5.
Adsorption parameters for zeolites studied, including Henry (KH, mmol g−1 × mmHg−1), Freundlich (KF, mmol g−1 mmHg −1), and Langmuir (am, mmol g−1).
Thermodynamic Parameters
Table 6 presents the values of the thermodynamic parameters (ΔH, ∆G, and ∆S) at temperatures ranging from 573 K to 413 K, calculated using inverse gas chromatography.
Table 6.
Study of the thermodynamic parameters of endosulfan pesticide adsorption on natural zeolites, including Free Energy of Gibbs (ΔG, kJ mol−1), isosteric enthalpy of adsorption (∆H, kJ mol−1), and entropy change (∆S, kJ mol−1 K−1).
4. Discussion
4.1. XRD Analysis
The main phases present in the NMOR zeolite were identified using Rietveld analysis. It was found that the predominant phase in the NMOR zeolite was Na–Clinoptilolite (card 01-086-4509) in similar concentrations, with low concentrations of Quartz (00-005-0490), as shown in Table 2. Additionally, the presence of Ag was detected at 2θ = 6.5°, 14.8°, 22.3°, 28°, and 32° in the AgMOR zeolite, as illustrated in Figure 2a [20]. The average crystal size of the Ag clusters, located in the external area of the NMOR zeolite, was found to be 49.9 nm using the Debye–Scherrer equation. The diffraction pattern of the chabazite zeolite and the stilbite zeolite is also observed in Figure 2b. The X-ray diffraction analysis confirmed the presence of Ca–Stilbite (00-026-0584) and Ca–Clinoptilolite (04-013-6125) as the major phases in the STIN zeolite, as reported in Table 2. The chemical composition results (XPS) of the zeolites studied in this work are listed in Table 3. From this table, it can be seen that then MOR zeolites present the following sequence: K > Na > Fe > Ca > Mg > Ti; HMOR: K > Fe > Ca > Na > Mg. The AgMOR zeolite has the following sequence: Ag > Fe > K > Ca > Mg > Na. It can be observed that in the MOR zeolites, there is a high concentration corresponding to K, and in the AgMOR zeolite, a high concentration of Ag is observed. This effect is attributed to the ion exchange process to which this zeolite was subjected. NSTI zeolite has the ion exchange sequence: Ca > K > Mg > Fe > Na. NCHA zeolite has the ion exchange sequence: Ca > Mg > K > Fe > Na > Ti. Additionally, the Si/Al molar ratio for these zeolites is NMOR > HMOR > AgHMOR > NCHA > NSTI. The increase in Fe concentration is associated with the possible migration towards more favored positions of the MOR zeolite skeleton.
SEM observation (Figure 3) reveals the presence of mordenite zeolite crystals, macropores, dark parts, and a considerable group of mesopores, attributable to the presence of clays. The presence of mordenite is evident, as very fine fibers are observed, accompanied by quartz and cristobalite. The fibers are less than 10 µm in size. Additionally, the presence of crystals in the form of irregular boxes indicates the presence of clinoptilolite zeolite, with sizes greater than 10 µm. This indicates the presence of mordenite and clinoptilolite zeolites in this zeolitic tuff.
The FT-IR spectrum of the natural zeolite sample is shown in Figure 4a. The absorption band at around 440 cm−1 is attributed to the Silicon Aluminum lattice. The strongest infrared absorption band at 1020 cm−1 is assigned to the valence vibration of (Al,Si)-O bonds. OH- is observed at 3568 cm−1 and H2O is observed at 1645 cm−1. Meanwhile, the IR spectrum of the endosulfan-impregnated zeolite shows two groups of bands (Figure 4b). The first consists of a relatively broadband at 3734 cm−1 and a band of low intensity at 3745 cm−1. The latter band is attributed to SiOH groups terminating the zeolite crystal, while the band at 3734 is attributed to SiOH groups terminating defects in the inner of the zeolite pores. The other group consisting of OH stretching bands at 3612, 3597, and 3586 cm−1 is attributed to SiOHAl Brønsted acid hydroxyl groups in CHA [21].
4.2. N2 Adsorption
In the isotherms for NCHA and NMOR shown in Figure 5a, a combination of type Ia and type IV isotherms is observed, according to the IUPAC classification [22]. These isotherms exhibit an H3 hysteresis cycle, which is typical for natural zeolites with various accompanying materials (refer to Table 2). Some distinctive aspects observed in these isotherms are as follows:
- (i)
- At very low relative pressures, there is an increase in adsorption capacity due to the presence of micropores. In the case of MORN, there is a step at p/p0 = 0.56.
- (ii)
- These isotherms also show the effect of low-pressure hysteresis at relative pressures, which is associated with the presence of pores of molecular dimensions and irreversible adsorption [22].
Regarding the adsorption behavior in the MOR zeolites shown in Figure 5b, the treatment with HCl decreases the adsorption capacity of the zeolite by causing dealumination, while treatment with AgNO3 indicates the formation of clusters in the external area of the zeolite, preventing the adsorption of gas in the micropores. The values obtained from the chemical treatments to which the MOR zeolite is subjected indicate a negative impact on its porous structure, leading to a reduction in its adsorption capacity and micropore content (refer to Table 4).
Based on the obtained values, it is recommended to use the Langmuir equation to report the data as the type I isotherm describes them most accurately. The ASL values present the sequence NMOR > HMOR > AgMOR, with a similar trend for V∑, while NCHA > NSTI. From the adsorption isotherms and these values, it is observed that the NCHA zeolite has the maximum values in terms of ASL, V∑, and Wo.
Pore Size Distribution, BJH Equation
In Figure 6, there are three distributions corresponding to the NMOR zeolite: 2579 nm, 3654 nm, and 4867 nm, with the predominant signal at 4867 nm. The zeolite modified with HCl presents a monomodal distribution with a signal at Dp = 3654 nm, while the corresponding distribution for the AgMOR zeolite presents signals in the area Dp = 3654 nm. The distributions obtained in the modified mordenite zeolites indicate substantial changes in the pore structure caused by the chemical treatments [23].
4.3. Endosulfan Adsorption
Endosulfan adsorption isotherms at various temperatures of the zeolites under study are shown in Figure 7 and Figure 8. It is evident from these isotherms that the NSTI zeolite exhibits a better definition. The values of the Freundlich constants KF and n, Henry’s constants KH, and the Langmuir monolayer capacity are presented in Table 5. The monolayer capacity (am, mmol g−1) sequence at the studied temperatures is as follows:
573 K: AgMOR > HMOR > NMOR; NSTI > NCHA.
533 K: HMOR > AgMOR > NMOR; NCHA > HNSTI.
493 K: HMOR > AgMOR > NMOR; NCHA > NSTI,
453 K: HMOR > AgMOR > NMOR; NCHA > NSTI
413 K: NMOR > AgMOR > ATH4 > HMOR > ATH3.
While the lowest values are obtained in the NMOR sample at 453 K, the highest values correspond to the same sample at 413 K. The Langmuir approach works well for all but three cases: adsorption at 533 and 433 K on NSTI, and AgMOR at 453 K. The adsorption capacity values are like those reported for a certain type of clay-enriched soil from part of India [24]. As shown in Figure 9, the isosteric enthalpy of adsorption on NMOR, HMOR, AgHMOR, and NSTI exhibits similar behavior. For all zeolites, the isosteric enthalpy of adsorption decreases with increasing adsorbate loading, except with NCHA. The initial sharp decrease in qst may be due to site heterogeneity. However, a continuous slow decrease in qst is expected at higher adsorbate loadings due to repulsive interactions between adsorbed endosulfan molecules.
Thermodynamics Parameters
The results in Table 6 can be divided into two parts: (i) the values corresponding to the NMOR, HMOR, and AgMOR zeolites and (ii) the values corresponding to the NCHA and NSTI zeolites. For the MOR zeolites, it can be observed that the values for ∆G decrease as the temperature increases, indicating the level of spontaneity for each temperature. On the other hand, the ∆S parameter shows an increase with temperature, associated with the chaotic movement of endosulfan molecules [25]. This behavior is common for all the zeolites studied in this work; however, it is observed that the increases in ∆S are greater for the NCHA and NSTI zeolites.
5. Conclusions
Experimental data on the adsorption of the pesticide endosulfan in three natural zeolites from Mexico were obtained. These natural zeolites were characterized by XRD, IRTF, EDS, SEM, and HRADS adsorption of N2. The quantitative determination showed that natural MOR tuff contains Na–Mordenite (45%) and Na–Clinoptilolite (45%) with very little Quartz (0.13%). Natural NCHA contains a–Chabazite (50%), Ca–Clinoptilolite (40%), and Montmorillonite (5%). NSTI tuff contains Ca–Clinoptilolite (55%), Ca–Stilbite (50%), and some Quartz (5%). SEM images of clinoptilolite and mordenite zeolites showed different crystal sizes and morphologies, with fibers for mordenite and truncated boxes for clinoptilolite. The adsorption of N2 in the zeolites studied resulted in combined type Ia/IV isotherms for NCHA and NMOR, with a hysteresis cycle of the H3 type and an abrupt increase in adsorption capacity at very low relative pressures. The adsorption capacities for endosulfan in these Mexican natural zeolites were calculated using the Henry, Freundlich, and Langmuir models. It was observed that the Langmuir model worked reasonably well at the temperatures studied, except for adsorption at 533 and 433 K on NSTI, and 453 K on AgMOR. The isosteric enthalpy of adsorption decreases with increasing adsorbate loading for all zeolites, except for NCHA. The values corresponding to ∆G show a decrease as the temperature increases, indicating the level of spontaneity for each temperature. Additionally, the ∆S parameter increases with temperature, associated with the chaotic movement of endosulfan molecules, with greater increases observed for the NCHA and NSTI zeolites.
Author Contributions
Conceptualization, M.Á.H., R.P. and V.P.; methodology, V.P. and K.M.Á.; validation, M.Á.H., V.P. and E.R.; formal analysis, R.P.; investigation, M.d.l.Á.V. and J.F.A.; resources, G.I.H.; review and editing, V.P.; visualization, G.I.H.; supervision, M.Á.H.; project administration, J.D.S.-J.; funding acquisition, J.D.S.-J. All authors have read and agreed to the published version of the manuscript.
Funding
This work was funded by VIEP and the Academic Body “Investigación en Zeolitas”, CA-95 (PROMEP-SEP).
Data Availability Statement
Data is contained within the article.
Acknowledgments
We appreciate the methodological support from the supercomputing laboratory, LNS.
Conflicts of Interest
The authors declare no conflicts of interest.
References
- Mudhoo Amit, M.; Amit, B.; Rantalankila, B.M.; Sillanpää, M.; Sillanpää, M. Endosulfan removal through bioremediation, photocatalytic degradation, adsorption and membrane separation processes: A review. Chem. Eng. J. 2019, 360, 912–928. [Google Scholar] [CrossRef]
- Hernandez, M.A. El ABC de las Zeolitas Naturales en México; Sextil Online; Publica por Gandhi: México City, México, 2020; pp. 26–39. [Google Scholar]
- Database of Zeolite Structures. Available online: http://www.iza-structure.org/databases/ (accessed on 4 November 2022).
- Gürkan, R.; Ceylan, H.; Şahan, T.; Savran, A.; Kubilay, S. Evaluation of the Thermodynamic Parameters for the Adsorption of Some Hydrocarbons on Chemically Treated-Bentonites by Inverse Gas Chromatography. Adsorption 2005, 11, 603–612. [Google Scholar] [CrossRef]
- Patočka, J.; Wu, Q.; França, T.C.C.; Pitah, R.; Kuča, K. Clinical LINICAL Aspects of the poisoning by the pesticide endosulfan, Quim. Nova 2016, 39, 987–994. [Google Scholar] [CrossRef]
- Singh, G.; Ramadass, K.; Sooriyakumar, P.; Hettithanthri, O.; Vithange, M.; Bolan, N.; Tavakkoli, E.; Van Zwieten, L.; Vinu, A. Nanoporous materials for pesticide formulation and delivery in the agricultural sector. J. Control. Release 2022, 343, 187–206. [Google Scholar] [CrossRef] [PubMed]
- Hernandez, M.A.; Corona, L.; Gonzalez, A.I.; Rojas, F.; Lara, V.H.; Silva, F. Quantitative Study of the Adsorption of Aromatic Hydrocarbons (Benzene, Toluene, and p-Xylene) on Dealuminated Clinoptilolites. Ind. Eng. Chem. Res. 2005, 44, 2908–2916. [Google Scholar] [CrossRef]
- Sathishkumar, P.; Mohan, K.; Ganesan, A.R.; Govarthanan, M.; Yusoff, A.R.M.; Gu, F.L. Persistence, toxicological effect and ecological issues of endosulfan—A review. J. Hazard. Mater. 2021, 416, 125779. [Google Scholar] [CrossRef]
- Mohan, B.; Kamboj, A.; Singh, K.; Singh, G.; Pombeiro, A.J.; Ren, P. Metal-organic frameworks (MOFs) materials for pesticides, heavy metals, drugs removal: Environmental safety. Sep. Purif. Technol. 2023, 310, 123175. [Google Scholar] [CrossRef]
- Ponce-Velez, G.; Botello, A.V. Organochlorine pesticides in coastal and marine organisms of the Mexican coasts, a review. Rev. Int. Contam. Ambie. 2018, 34, 81–98. [Google Scholar]
- Romero, J.A.; Amaya, A.; Miranda, M.G.; García, M.M. Chromatographic methods for the determination of endosulfan in foods. Rev. Int. Contam. Ambie. 2018, 34, 81–94. [Google Scholar]
- González, F.B.; Casadinho, C.J.; Weber, J.M.; Zugasti, C.G.; Prado, E.E.; Ruiz, B.B.; Acosta, M.; Cárcamo, M.I.; Muñoz, F.R. El Endosulfán y sus Alternativas en América Latina; Resumen, Capitulo 8.-Alternativas al Endosulfán en México; Centro Regional Universitario Oriente de la Universidad Autónoma Chapingo (UACH): Valdivia, Chile; Fernando Bejarano (RAPAM): Santiago, Chile, 2009; pp. 21–23. [Google Scholar]
- Hernandez, M.A.; Salgado, M.A.; Portillo, R.; Petranovskii, V.; Hernández, G.I.; Santamaria, D.; Rubio, E. γ-sitoesteroal Ag Nanoparticles of γ-Sitoesterol and Ag on Clinoptilolite Zeolites. J. Nanomater. 2021, 2021, 9959552. [Google Scholar] [CrossRef]
- Lee, S.Y.; Park, S.J. A review on solid adsorbents for carbon dioxide capture. J. Ind. Eng. Chem. 2015, 23, 1–11. [Google Scholar] [CrossRef]
- Lastoskie, C.; Gubbins, K.E.; Quirke, N. Pore Size Distribution Analysis of Microporous Carbons: A Density Functional Theory Approach. J. Phys. Chem. 1993, 97, 4786–4796. [Google Scholar] [CrossRef]
- Park, H.J.; Suh, M.P. Enhanced isosteric heat, selectivity, and uptake capacity of CO2 adsorption in a metal-organic framework by impregnated metal ions. Chem. Sci. 2013, 2013, 685–690. [Google Scholar] [CrossRef]
- Schlumberger, C.; Thommes, M. Characterization of Hierarchically Ordered Porous Materials by Physisorption and Mercury Porosimetry—A Tutorial Review. J. Ind. Eng. Chem. 2015, 23, 2002181. [Google Scholar] [CrossRef]
- Diaz, E.; Ordoñez, S.; Vega, A.; Coca, L. Adsorption characterization of different volatile organic compounds over alumina, zeolites and activated carbon using gas chromatography. J. Chromatogr. A 2009, 1049, 139–146. [Google Scholar] [CrossRef] [PubMed]
- Jagiello, J.; Bandosz, T.J.; Schwarz, J.A. Application of inverse gas chromatography at infinite dilution to study the effects of oxidation of activated carbons. Carbon 2002, 30, 63–69. [Google Scholar] [CrossRef]
- Young, R.A. Introduction to the Rietveld Method. In The Rietveld Method; Young, R.A., Ed.; Oxford University Press: Oxford, UK; New York, NY, USA, 1993; p. 298. [Google Scholar]
- Król, M.; Mozgawa, W.; Jastrzębski, W.; Barczyk, K. Application of IR spectra in the studies of zeolites from D4R and D6R structural groups. Microporous Mesoporous Mater. 2012, 156, 181–188. [Google Scholar] [CrossRef]
- Thommes, M.; Kaneko, K.; Neimark, A.V.; Olivier, J.P.; Rodriguez-Reinoso, F.; Rouquerol, J.; Sing, K.S. Physisorption of gases, with special reference to the evaluation of surface area and pore size distribution (IUPAC technical report). Pure Appl. Chem. 2015, 87, 1051–1069. [Google Scholar] [CrossRef]
- Tzabar, N.; Brake, H.J.M.T. Adsorption isotherms and Sips models of nitrogen, methane, ethane, and propane on commercial activated carbons and polyvinylidene chloride. Adsorption 2016, 22, 901–914. [Google Scholar] [CrossRef]
- Kumar, M.; Phillip, L. Adsorption and desorption characteristics of hydrophobic pesticide endosulfan in four Indian soils. Chemosphere 2006, 62, 1064–1077. [Google Scholar] [CrossRef]
- Yakimov, A.V.; Ravi, M.; Verel, R.; Sushkevich, V.L.; van Bokhoven, J.A.; Coperet, C. Structure and Framework Association of Lewis Acid Sites in MOR Zeolite. J. Am. Chem. Soc. 2022, 144, 10377–10385. [Google Scholar] [CrossRef] [PubMed]
Disclaimer/Publisher’s Note: The statements, opinions and data contained in all publications are solely those of the individual author(s) and contributor(s) and not of MDPI and/or the editor(s). MDPI and/or the editor(s) disclaim responsibility for any injury to people or property resulting from any ideas, methods, instructions or products referred to in the content. |
© 2024 by the authors. Licensee MDPI, Basel, Switzerland. This article is an open access article distributed under the terms and conditions of the Creative Commons Attribution (CC BY) license (https://creativecommons.org/licenses/by/4.0/).