Abstract
In open-pit mines, the blast operation should be effectively optimized, leading to minimization of production costs through the application of specific technical specifications. However, there is inadequate information in the literature to link blasting to comminution stages. To this end, the effective parameters for the performance of mining unit operations were scrutinized in this work. In this regard, the rock fragmentation distribution (RFD) caused by blasting was considered the main determinative criterion for providing the optimum conditions for the blasting operation at Sarcheshmeh copper mine. By carrying out a statistical analysis of the experimental data, operational parameters affecting the blasting were optimized. The relationship between parameters was obtained using the technique of regression and in accordance with the evaluation criterion under which correlation coefficient (R2) was used to determine the best fitting model. A high correlation coefficient of the loading cycle of the machine’s bucket with the independent variables showed that the C1 was more affected by the RFD, as well as the dimensions of the blast block. Because of the wide variations in the nature and structure of rock mass in different mines, in each case, sufficient data should be collected, and these relationships should be analyzed statistically for each individual mine showing wide ranges of fractures and cracks. Therefore, due to these wide variations of ore characteristics, with the current data it seems very difficult to quickly find a significant operational relationship between downstream processes such as crushing efficiency and blasting operations. Therefore, the focus of this research was limited to the effective parameters for blast efficiency. According to the analysis of the data obtained from 20 blasts under different operating conditions, the diameter of the hole was 241.3 mm (such as blast number 20), the ratio of length to width of the explosive block was about 6 (average blasts with high fragmentation efficiency), and the best index of mining operations was 0.22 (such as blast number 20).
1. Introduction
As an integrated system from mine to mill, optimizing drilling patterns and blasting operations is a systematic strategy for mining activities to increase the efficiency of mining and downstream processes by reducing energy consumption. This optimization activity should be performed on the mining site, and each operation should determine which of the variables are tailored to the needs of the same site. The extraction stages of open-pit metal mining ores include drilling, blasting, loading, and haulage. The appropriate implementation of this process has a significant impact on production costs, the quality of the product, and the production rate. Many research studies have investigated the impact of fragmentation caused by blasting operations on production performance in the extraction stage. On one hand, increasing the amount of fragmentation increases drilling costs; on the other hand, it also reduces loading and haulage costs. In some cases, a boulder creates a side stage of secondary blasting in the extraction cycle. Thus, a suitable level of fragmentation increases the performance of the loading–haulage system and improves the quality and uniformity of materials transferred to the processing plant. Controlling the fragmentation caused by the effective blasting pattern and its effectiveness on the productivity of rock fragmentation is a challenging task for the blasting engineers [1]. Optimal fragmentation minimizes any negative impact on the mixing (ore and waste) with the maximum integrity of the wall and the floor of the bench. In spite of this, the output of the blasting directly affects not only the drilling, displacement, and the ore control needed but also the needs and requirements of the crushing and grinding, i.e., mine to mill. There is a range of fragmentation in which the total production costs are the lowest (optimal range of fragmentation). It has also been proven that an optimal blasting operation has had a significant positive impact on the entire economy of mining operations. To achieve this, it first requires precise and systematic execution of blasting operations [2].
Simulation offers a quick and cost-effective way to reach a successful and comprehensive result from the high number of steps, complexity, and excessive interactions in the efficiency of mining operations [3,4]. For example, the effect of ore crushing on the shovels of the Gol-e-Gohar iron ore mine was presented with a mathematical model to determine their production levels. This model was obtained using data that differed from the shovels’ production levels in different blasting patterns with different fragmentation results. This model concluded that large pieces of the rock greatly reduced the production power and performance of the shovel. By applying this model, the optimum slope of crushing for the proper performance of the shovel was obtained (20 to 40 cm) [5]. Since the efficiency of each crusher depends on the specific characteristics of its feed in terms of particle size distribution, the time and energy consumed per ton of the product can be used as a crushing index in the evaluation of blasting fragmentation [6].
Effective parameters for the blast cycle for each particular mine should be identified and evaluated. In this regard, the ease of penetration index for the loading machine is introduced as the ratio of the number of loaded buckets to the total number of penetration activities in the fragmented ore, whose primary function is the rigidity and cross section of the mining face. Its strong point is its ability to investigate the diggability index on the crushing of the blasted muck pile and its effect on the mining operation [7]. However, this is only effective if the interaction of other parameters is also investigated. A model is presented to determine the loading capacity as a method of crushing the rock caused by the blasting. In this model, parameters leading to re-operating costs are predicted. However, its main weakness is parameters leading to reduction of operating costs, which are only predicted from a loading point of view [8].
An investigation into the details of several blasting cases shows the relationship between the desired blasting and the efficiency of the crusher. However, only crusher efficiency has been investigated [9]. An investigation into the results of the output parameters for the blast showed the effect of the blasting design on the loading and hauling process. With this data, it is possible to evaluate the cycle time of loading and transporting devices based on the physical characteristics of the fragmented pile of blast [10].
Prediction of plucking performance (penetration and production) is possible by investigating the blasting fragmentation, parameters involved in plucking, and open harvesting of piles. In this way, the efficiency of the loading machine can be predicted by measuring the penetration and production of crushed piles [11]. With emphasis on the parameters involved in loading, investigating the interaction between the rock size distribution (RSD) of the blast pile and the loading equipment, as well as the role of muck-pile profiles in the loading efficiency, showed that the angles of the pile, its geometry, the implementation of the loading in operational conditions, and the type of loader design are the index parameters [12]. Optimization of the drilling process focused on the type and effectiveness of the drilling rig as the basis for evaluation [13].
Optimization of blast operations with the most effective parameters, i.e., crushed rock status, retardation or delay timing, coarse parts, floor and toe conditions of the bench, environmental considerations, and stolen holes, leads to a demand value model being presented. According to this model, output of blast operations is ranked in five situational categories without examining the effect of these parameters in any of the manufacturing down sectors. However, this model did not take into account the RSD of the blast fragmentation [4]. These optimizations can ultimately lead to a decrease in the RSD of the ore resulting from the blasting, a reduction in loading time, and, consequently, a reduction in the costs of this process, in which the mathematical relationships between the parameters of the blasting design can be of considerable help [14]. Table 1 shows the most important studies conducted in optimizing blasting operations. As can be seen, the most attention in technical literature is devoted to the parameters DF, Sc, and Oc.

Table 1.
The most important studies performed to evaluate blast operations.
As specified in Table 1, the degree of fragmentation (DF) as a blasting rate index has attracted the most attention. The particular charging index (Sc) and mining operation costs (OC) have also been widely evaluated. However, less attention has been paid to the dilution index (Di), environmental evaluations (EE), and Blast Safety Index (BS). Other interesting aspects of blasting using the technique of modeling and optimizing the process from technological and economical points of view can be found in many works. The issues of millisecond delays as well vibration structure are discussed in [59,60,61,62,63,64,65].
This research aimed to evaluate the production performance regarding the outputs of blasting operations. Because of the wide variations in the nature and structure of rock mass in different mines, it seemed difficult to quickly find a significant operational relationship between downstream processes such as crushing efficiency and blasting operations. For example, the effect of the efficiency of the crushing in the mining operations index was statistically analyzed before creating the prediction model for the crushing stage. However, due to significant changes in rock mass in the mine, there was no suitable correlation coefficient between independent parameters and the efficiency of the crushing. Therefore, it is emphasized again that, although the properties of rock mass have a significant effect on both blast stages and downstream processes such as crushing, due to these vast changes in the properties of rock mass in metallic open-pit mines, the extracted benches have a wide variety of rock units. Even in an extracted bench, there are rock units with different compressive strengths and characteristics. Therefore, despite their high level of reliability, these models cannot be used to predict the correlation between blasting operation and the efficiency of the downstream processes. Therefore, as mentioned above, the focus of this research was limited to effective parameters for the blast operation efficiency.
This work aimed at determining key parameters affecting the different units of extractive operations at the Sarcheshmeh open-pit mine. In this way, the recognition and ranking of practical components in the distribution of fragmented rock dimensions due to blasting may be obtained. In addition, effective indicators for mining operations were introduced, and the parameters affecting this index were ranked. For this purpose, the parameters of the ratio (R) of length (L) to width (W) of the explosive block (RLW) and the operating parameters (Ol), failure (Fl), readiness (Rl), and displacement of loading machines (Ml) as well as a special crushing parameter (Scr) were measured.
2. Materials and Methods
2.1. Mining Performance
Recording and extracting operational indicators for each production unit of mining operations make it possible to monitor the optimization process. Therefore, it is necessary to prepare a database of mining production operations. Suitable rock fragmentation distribution (RFD) in each blasting cycle directly contributes to reduced costs, improved performance, and an increase in the efficiency of the post-blasting stages, i.e., loading and hauling equipment.
The knowledge of the performance status and the output of the blast operation according to various fragmentation conditions (the RFD) and an accurate analysis of the information obtained using image analysis may result in a proportional and optimal blasting pattern design and implementation.
First, a database including extraction operations and the primary crushing of 20 blast blocks at Sarcheshmeh Copper Mine was prepared, as shown in the flowsheet in Figure 1.
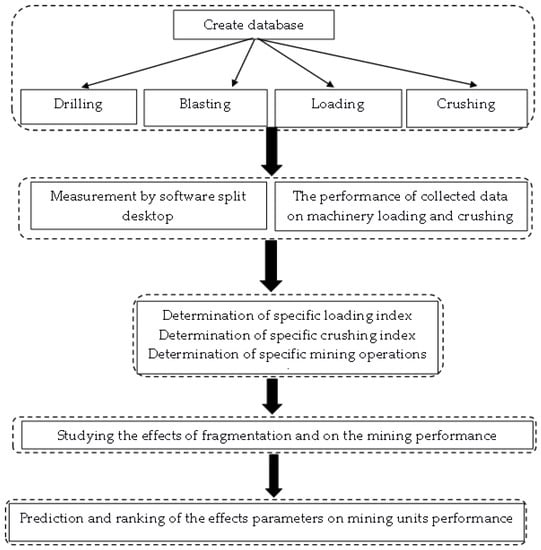
Figure 1.
The algorithm used to evaluate the impacts of the RFD on mining performance.
2.2. Structure of the Database
The database was composed of the four nodes listed below.
(1) Drilling included the length, angle, and diameter of each hole; drilling time per meter and drilling time per hole; total drilled length and number of the hole; type of drilling machine; movement time, failure, and performance; and total drilling time in any blast block or rock type of blast block.
(2) Blasting included the burden, spacing, height of the bench, specific drilling, specific charge ( and in each blast block, explosive type, fragmentation efficiency index, percentage of over-fragment rock, percentage of boulder, and length to width of blast block.
(3) The loading unit included a loading cycle for the machine’s bucket, cycle of filling a truck, performance, failure, ready and movement loading machine, type, fuel of specific loading, and haulage machine. Specific loading, with the symbol is the specific loading of jth blast blocks (hour per cubic meter) obtained by dividing the total available time of the loading machinery of the jth blast block (in an hour) by the total volume of the jth blast block (in cubic meters) [4].
(4) Mine crusher included input rock tonnage to the crusher, the performance and failure of the crusher in blasting, and specific crushing of each blasting. Specific crushing, with the symbol , is the specific crushing of the jth blast block (kW per cubic meter) obtained by dividing the total consumption energy of the jth blast block (in kW) by the total tonnage of input rock into the crusher of the jth blast block (in cubic meter) [66]. The specific fixed gravity as well as the specific gravity of fragmented rock resulting from the blasting operation were 2.57 and 1.8 t/cm3, respectively.
2.3. Specific Unit Operation Index
The specific unit operation index (Su0j) represents mining operations in blast block in and is obtained using Equation (1) [4].
where is the specific drilling of the jth blast block (m/m3), is the specific charge of the jth blast block (kg/m3), is the specific loading of the jth blast block (m3), and is the specific crushing of the jth blast block (kW/m3).
2.4. Sarcheshmeh Copper Mine
Sarcheshmeh Copper Mine (Kerman, Iran) contains about 1.7 billion tons of copper with a cutoff grade of 0.25% and an average grade of 0.60% [66]. Annual extraction is determined by 25 million tons of ores and 35 million tons of wastes. The height of the benches used is 12.5 m, and the width is 8.75 m. A wide bench with a width of 23.75 m is periodically placed for each of the four benches. The final slope of the wall of the mine is currently equal to 34 to 36°. Additionally, the width of the mine roads is estimated at 30 m and the slope is estimated at 8% [67].
2.5. Database from Unit Operation
Table 2 shows the descriptive parameters for the database. To evaluate the impact of rock fragmentation by blasting on mining performance at the Sarcheshmeh copper mine, drilling unit database, blast, loading, and crusher units were created (Table 3, Table 4, Table 5, Table 6, Table 7 and Table 8).
Table 2.
Description of collected parameters to create the database.
Table 3.
Evaluation of fragmentation due to blasting on the production levels of loading machines and mining operations.
Table 4.
Classification of blast ratings (j) and their analyses [4].
Table 5.
Reasons for low production levels of loading machine in contrast to good crushing caused by blasting operations.
Table 6.
The relation of regression and the results of the obtained variance analysis and with production performance.
Table 7.
The relation of regression and the results of variance analysis obtained, with production performance.
Table 8.
The relation of regression and the results of variance analysis obtained, and with production performance.
In this study, the selection of variables was based on the experts’ opinions and the operational experience of the reasoned relationship between model variables and dependent parameters. Additionally, based on the design of drilling and blasting patterns, the mechanism of blasting operations, and the interaction of the parameters on the production performance, a suitable model was proposed. In addition, software capability in the proposed models was based on independent variables of one to four parameters. In selecting the models, the coefficient of variance was used so that the variables in the model did not correlate if their variance coefficient was less than 10. This meant that there was no correlation between the input of independent variables calculated for each model. It is worth noting that in some mines, due to the imposition of operational conditions, the blasting circuit changes so that B and S may be moved in relation to the free surface of the blasting face.
Drilling: The holes produced were drilled with diameters of 15.24, 22.86, 24.13, and 25.4 cm. Paying attention to ore and waste of the drilling, patterns of 5 × 6, 5 × 6.5, 6 × 7, 7 × 8, 7 × 8.5, 7 × 9, 7.5 × 9, 7 × 9.5, 7.5 × 10 m2 were designed and implemented. Sub-drilling was estimated at 2.5 m and the mean length of holes was 14.5–15 m. [68].
Blasting: A Nonel and Detonating Cord were applied for the initiation system, and Pentolite booster and Emuline (depending on hole diameter) were used as a booster. In dry mining conditions, ANFO or a combination of ANFO with Emuline (Emulan) in wet conditions was used as the main charge [61]. The largest and smallest volumes of blasting blocks were taken as 105,525.29 and 7875.02 m3, respectively. Moreover, the average volume of the blasting block was equal to 47,132.87 m3. An image analysis method was employed to obtain the passing distribution curve of blasting patterns, and Split Desktop software (Version 4.0) was used to measure fragmentation at the Sarcheshmeh copper mine.
Loading: In the loading and haulage operations, loading by electric rope shovel and hydraulic excavator (Hydraulic) with bucket volumes of 18, 16.5, 15, 12, 4.5, and 2.15 m3 was used. The average volume of the bucket of the shovel was about 12 m3. Additionally, haulage was performed using 218-, 136-, 100-, 60-, and 35-ton trucks [67].
Specific loading with the symbol (SLj): Specific loading of the jth blasting block (h/m3) was calculated by dividing the total time available for the loading machineries of the jth blasting block (per hour) to the total volume of the jth blasting block (per m3) [4].
Crushing: Rock fragmentation in the first stage was calculated based on the feed for the primary gyratory crusher, with d80 range of the feed equal to 1524–2260 mm [67]. There are multiple methods used to determine the dimensions of over-fragment rock and boulder. The most common methods calculate the suitable size by considering the dimensions of the feed to the primary crusher. In this way, boulders are estimated at 80% entrance of primary crusher, and the size of over-fragment rock is estimated at one-sixteenth of boulder dimensions. Since the shovel machine is not capable of loading boulders greater than around 100 cm, in a practical operating project, this size range (about 100 cm) applies to boulder rock used in the machine [58]. The specific energy level of the jth blasting block used in the crusher () is calculated by dividing the total energy consumption of the jth blasting block (per kW) to the total tonnage of rock fed into the crusher at the jth blasting block (per m3) [66]. The specific fixed gravity and specific gravity of fragmented rock resulting from the blasting operation were 2.57 and 1.8 tons per cubic meter, respectively.
2.6. Measurement of Blast Fragmentation
2.6.1. Stages of Image Analysis
In image analysis, to achieve the RFD, three steps should be performed: sampling, imaging, and image analysis. Split-Desktop software (Version 4.0) is a tool for analyzing the digital images to measure the RFD resulting from the blast. In order to analyze each image with this software, five steps must be taken: (1) image scaling, (2) automatic or manual bordering of the fragmented rock parts in the image, (3) estimating the amounts of fines in the image, (4) evaluating the result of the work, and (5) reporting the output of the image analysis result in Excel as the RFD curve.
With the help of this software, images can be bordered in two manual and automatic ways. In the first, the boundary between the pieces of the fragmented rock is determined by the user, while in the second, the software itself performs finding the boundaries according to the contrast in the image. The speed of work in the second is higher, while the accuracy of the first one is higher.
What distinguishes this software from other similar software is the existence of features that make it easier for the user to work with and significantly reduce the amount of some errors. The features include working with various and common image extensions such as .bmp, .jpg, and .tiff, changing the resolution of the image by the software itself, using up to three scales in one image, having the ability to extremely zoom in on the image, drawing automatically the crushed materials, determining the range of the fines as well as the ranges that do not need to be analyzed, and combining the various RFD curves related to each image in a blast pattern. Additionally, presenting the result of the RFD curves for that pattern and also the possibility of presenting the final results in the form of an Excel file with the help of a shortcut key are the other great features of the software.
2.6.2. Working Algorithm of This Project
In this project, due to time and safety limitations, a random sampling method was used to select the sampling location. In this regard, in different times, if the conditions were favorable, the crushed rock pile was photographed. In general, the image was obtained from three sections of the top, the middle, and end of the crushed rock pile. The images were mostly produced between 9:00 a.m. and 12:00 a.m. and the hours of the day when the weather was cloudy, due to which the environment was in full shade. Attempts were made to reduce the numbers of errors in imaging by using different methods such as using two balls, not taking images under direct sunlight, and so on. In order to investigate and determine the RFD analysis after the blast operation, a total of 30 blast blocks was considered for the study, 10 blocks of which were specific to tailings’ investigation and the rest to the ore blocks. For the purpose of the software calibration, the number of analyzed images was 755, with an average of about 25 for each blast pattern. Then, all images were analyzed manually using Split-Desktop image analysis software, and the RFD curve of each pattern was obtained separately.
As mentioned earlier, the determination of the rock fragmentation distribution (RFD) of blasted block is the main criterion by which the fragmentation of the different blasts can be compared. Because the process of obtaining the RFD curve is costly and time consuming, indirect methods, including qualitative observational analysis, visual analysis, photogrammetry method, and high-speed photography, were used to evaluate the RFD. Finally, this RFD can serve as a basis for studying the efficiency of the loading machines, secondary blast, failure, fragmentation efficiency index, over-breaking percentage, and burden.
Split-Desktop software was used as an image analysis tool for analyzing the digital images needed to find the RFD caused by blasting. To analyze each image, five steps were undertaken: (1) scaling the image, (2) automatically or manually limiting the fragments of the rock, (3) estimating the fines, (4) evaluating the results, and (5) exporting the image analysis result to Excel and plotting the curve. Figure 2 shows the analysis of the RFD using this software package. The RFD analyses showed that 80% (d80) and 50% (d50) of the passing sizes were about 13.06 cm and 6.48 cm at the current conditions of blasting design. Table 5 shows the distribution of and given for 20 studied blast blocks.
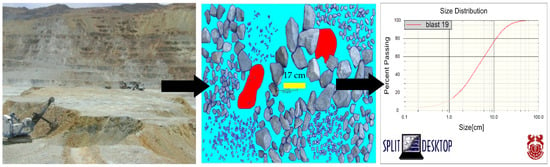
Figure 2.
Process of image analysis in Split-Desktop software.
2.7. Evaluation of Fragmentation
To evaluate the fragmentation results for the registered blasting operation, the fragmentation efficiency (FE) index was used. This index for the ore used in the investigation was calculated according to Equation (2) [58].
where FE denotes the fragmentation efficiency index (%), F is the percentage of over-fragmented rock, and B represents the percentage of boulder. Based on this index, fragmentation was divided into six categories, whose quality of fragmentation for each blasting block can be obtained with the help of tables presented in Appendix A (Table A1, Table A2, Table A3, Table A4, Table A5 and Table A6).
2.8. Data Analysis
To optimize mining operations, effective parameters and the range of their impact on fragmentation should be identified so that they can be used in the design phase of the blast pattern. Linear or nonlinear regression analyses were used to study the relationships between variables to ascertain, above all, how one variable depends on the others. This analysis, performed using the Statistical Package for the Social Sciences (SPSS) software (IBM SPSS Statistics, 2016), showed precision, accuracy, and trend of changes in theories used to predict the effects of the RFD on production performance.
3. Results and Discussion
3.1. Blasting and Mining Performance
Drilling and blasting parameters have a direct impact on mine production levels. Accordingly, one of the parameters that should be optimized is the diameter of the hole (D), whose suitable range for a 12.5-m-high bench used in open-pit mines is at least 200 mm (8 inches) [9]. The blast data for the Sarcheshmeh mine in Table 3 show that the D is not optimal for the benches in some blasts. The best diameter in the blasts was 200 mm fitted with the benches. Accordingly, the drilling pattern should be also modified (the diameter of the hole in blast nos. 3, 4, 5, 6, 7, 8, and 10 (Table A1) was changed from 152 mm to 200 mm because, by increasing the diameter of the hole proportional to the height of the benches, the mining costs may decrease from economic viewpoints). Thus, it should be modified according to the diameter of the 200-mm drilling hole.
The amount of special drilling in blast no. 1 was higher than others because, with the first blast, the crushed rock suffered from severe muck-pile locking and, therefore, did not reach the desired height for the loaded code. For this reason, to create a new surface on the bottom of the bench, drilling operations and block reblasting were conducted mainly due to a lack of the continuity in the rock, according to the appropriate drilling pattern. Additionally, reblasting may resolve the problem of holes falling out of the bottom due to the highly moisturized blast block, as well as a lack of free surface in the primary blast. Fragmentation efficiency in blast no. 1 was 92.50%, which was due to a higher amount of powdering and fine production for reblasting the block. The efficiency of machinery in mining operations is directly related to blast fragmentation; so, the loading rate is adversely affected by the coarseness of the rock fragments, but directly depends on the swelling of the muck pile. As such, the presence of boulders, as well as low swelling in poor bench toe conditions, directly affects the efficiency of the loading machines.
Although the RFD and the FE resulting from the blast were classified as perfect, in some cases, the production level of the loading machine per hour was low compared to the RFD. To ascertain the causes of this, in addition to the RFD, the effective results of explosion operations in the production levels of the loading machine and specifications of the loading and hauling machines were investigated (Table 3).
The overall result of the blast rating (ξj) was based on output figures for various blasting blocks. Considering seven main outcomes of the blast, including fragmentation (ξFR), muck pile position (ξMU), overbreak status (ξOV), conditions of toe and bench floor (ξFL), boulder (ξBO) and environmental considerations (ξEN), the status of the misfired hole (ξMI), and the points corresponding to each parameter, the overall score was calculated with Equation (3) [4]. Accordingly, the results were divided into five categories (Table 4).
To evaluate the low production of the loading machine against the good FEs, the overall results of the blasts were calculated using Equation (3). Then, in addition to the RFD, other factors involved in the production per hour of the loading machine, including the efficiency of the loading device in the muck pile and penetration conditions in the muck pile, were investigated. According to the results of the RFD and efficiency of the loading machine in conditions where crushing was good, the cable shovel showed a higher level of efficiency than other loading machines in proportion to the capacity of the loading machine.
By studying the production subsystem, including drilling, blasting, loading, hauling and crushing, it is possible to know which part needs to be optimized. For example, in blast no. 1, the main drawbacks were drilling and reblasting, undesirable blast outputs, and disproportionate capacity of the loading and hauling machines. Additionally, in blast nos. 6 and 8, despite the appropriate RFD, due to the disproportionate capacity of the loading and hauling machines, they were ultimately not desirable (Table 5).
3.2. Statistical Analysis
Table 6, Table 7 and Table 8 summarize the multi-parametric linear fitting on the data. This fitting may determine the most effective parameters. In this analysis, parameters including and , a loading cycle, loading bucket, specific loading, specific crushing, and specific mine unit operation were the indexes regarded as the main dependent and/or independent parameters. Variations between the dependent and independent parameters can be deduced from the relationship between each other. Thus, different linear models were tested to select the best model with the highest coefficient of determination (R2) and the simplest mode.
Comparing statistical models, the F-distribution model is the most commonly used statistical test under the hypotheses applicable to a data set, in order to identify the suitability of the model to the population from which the data were sampled. Since F-test > F-tab = 4.38 and the significance of F-test was smaller than p-value = 0.05 at 95% confidence level, the zero hypothesis was rejected. Therefore, it can be inferred that the proposed model was statistically significant. This compared the new model with the proposed model (Table 6).
3.2.1. Relation of and with Production Performance
Both and may be functions of the B, S, D, hole length, RLW, and Vb. Based on the statistical analysis, the prediction model of and and an analysis of variance were conducted by using multiple linear and nonlinear analysis (prediction models 1 and 2, shown in Table 7).
The yield of fragment and the percentage of over-fragmentation of harvested blast blocks were 81.98 and 51.23%, which showed high potential for fine particles in the mine, i.e., 58.23% of ore caused by blasting operations into the crusher was less than 203 mm in size. This is why the required feed of the condensation factor was 203 mm. In an analysis of fragment data with production performance, in comparison with showed better significant relations with the independent variables. In Figure 3, the comparison of frequency and is as shown in blast blocks.
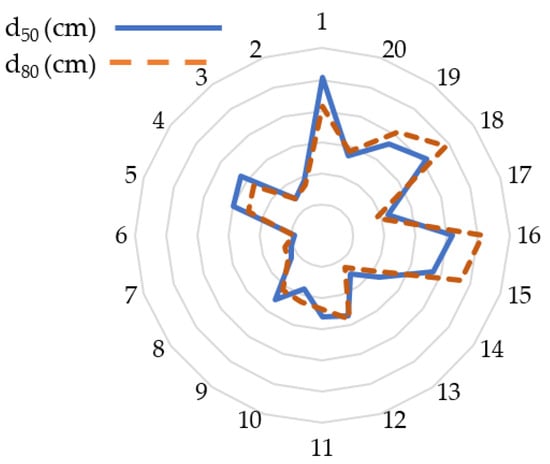
Figure 3.
Radar chart of and in 20 blast blocks of Sarcheshmeh Copper Mine.
3.2.2. Loading and Production Performance
For multiple logarithmic linear and nonlinear regression analysis, an exponential was used. Hole diameter, the ratio of length to width of blast block, and were regarded as independent variables and as a dependent variable. The results of this analysis and variance analysis with the aforementioned methods are shown in Table 7 (prediction models 3, 4, 5, 6, and 7). In the proposed models, the correlation coefficient value was high, which indicates a significant relation between independent variables with a loading cycle and . Additionally, based on the F test, the obtained models were acceptable to such an extent that the variable of a loading cycle, , was more affected by fragmentation caused by blasting and the dimensions of the blast block. The best and worst of a loading cycle, loading bucket, at the Sarcheshmeh Copper Mine were 14.38 and 51.15, respectively, in which was 3.02 and 10.39 cm, respectively, and was 6.69 and 24.49 cm. Figure 4 shows the relation between measured and predicted for each of the models.
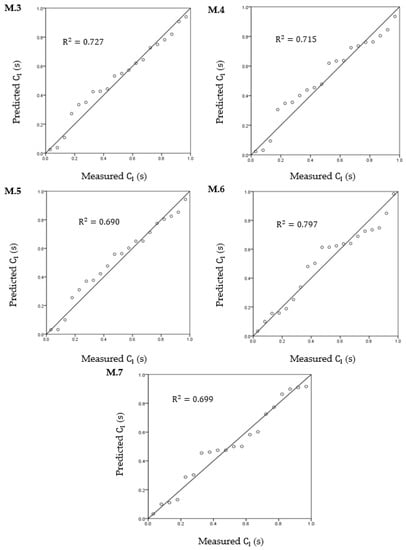
Figure 4.
Comparison relation between measured and predicted for models (3, 4, 5, 6, and 7).
3.2.3. Specific Loading and Specific Mine Unit Operation Index
To predict the relation of specific loading , dependent variable and independent variables including sleep and handling the loading device were performed using the logarithmic regression method. Accordingly, a correlation coefficient of 0.8 was obtained for specific loading in all blast blocks. Correlation and determination coefficients are shown in Table 8. Two models, 9 and 10, showed the relation of index-specific mining operations with independent parameters (Table 9). The correlation coefficient of models 9 and 10 was equal to 0.658 and 0.642, respectively, showing the great influence of the desired independent variables on index-specific mining operations . The ratio of length to width of the blast block was one of the important parameters closely associated with the various mining units and should be prioritized in the optimization. Hole diameter, as in previous studies, also showed that blasting is another very important parameter in improving the conditions of fragmentation, which results from hole diameter leading to an increase or decrease in the cost per ton of crushed rock.
Table 9.
Multivariate nonlinear regression coefficients and statistical parameters of coefficients for models 1 and 10.
3.2.4. Ranking the Most Effective Parameters for Mining Performance
By analyzing the output of the drilling and blasting process and identifying the most effective parameters, the effect of extractive parameters in different parts of production was ranked. Moreover, interaction between blasting and mining operations was achieved by evaluating each unit of mining from a theoretical point of view, under continuous control until the end of each process, and also from operational experience. Finally, with this knowledge base, the results of different theoretical and experimental results were determined as a coherent and comprehensive method for optimal operation. A standardized coefficient column test was used to rank these effective parameters based on the models predicted. The test may evaluate the parameters based on their positive or negative effect through the standardized coefficients of applied regression. Accordingly, the effective parameters on d50 were D and RLW, while in d80, the main positive parameter was only RLW. Therefore, the positive impact of d50 on the specific mine operations’ index was more than that of d80. The most effective components in the loading machine cycle were RLW, D, and d80. Additionally, a strong relationship was revealed between the readiness and the special loading parameters of the loading device.
One of the factors affecting the performance was the explosive loading diameter. Therefore, in the results obtained (Table 9), D was a key parameter affecting the blasting. However, according to the results of the ranking, the most influential component in the different parts of the production was the RLW. This could be because, as a general rule, the dimensions of the blast block in the open-pit extraction should be considered as large as possible. In this condition, the number of rows of blast holes may be generally affected by the W of the benches and the effective burden. In this way, productivity could increase due to the reduced movement time, as well as the total increase in hauling units used. In addition, drilling and loading machines may require more time for operations to be performed in a working bench. The cost of the holes could also be more efficient, which shortens the blast cycle and consequently reduces the time needed to change the position of the equipment. With an increase in volume in the blast block, the level of safety increases due to integrated production operations and more effective process management, meaning a reduced number of misfired holes as well as human errors.
These optimal results were used in the Sarcheshmeh mine. In SP + Dike stones, a 241.3-mm hole diameter was used. For this type of stone, RLW was observed at about 6. Currently, with the aim of continuous RFD analysis, fixed and quadcopter cameras are active in the mine and constantly report high-quality images to downstream units for online image analysis. Additionally, the monthly statistics of this image analysis (the RFDs) are dictated as feedback to the operational conditions of the blasting to be used based on the parameters specified to change them to achieve the desired fragmentation efficiency (FE).
4. Conclusions
The present work comprehensively investigated the interaction and effectiveness of extractive units and parameters in the process of mining operations. Additionally, by combining the data from different units and monitoring them, the main and key parameters were identified, measured, and introduced so that they can finally be used for optimization. Identifying and ranking the effective components in the distribution of fragmented rock dimensions due to blasting were conducted. In addition, effective indicators in mining operations were introduced and the parameters affecting these indexes were ranked. The relation between the most effective parameters for the performance of rock fragmentation distribution caused by blasting operations was investigated. The ratio of length to width of the blast block and loading parameters such as operation, failure, readiness, movement loading machine, and specific crushing were studied. The parameter of the blast block proved significant for the proposed models. Some models were proposed for different aspects of production performance at the Sarcheshmeh Copper Mine to such an extent that, in and , the highest correlation coefficients were 0.658 and 0.581, respectively, meaning a superior result for of because of the high potential production of fine parts in the process of blasting. Additionally, there was a high correlation coefficient for the loading cycle of the bucket (0.727). A correlation coefficient of 0.8 for specific loading in all blast blocks showed a strong influence on specific loading of the RFD of the blasting. The positive effect of the hole diameter parameter was more than that of the blast block length-to-width ratio on . However, at the positive effect of the parameter of the blast block length-to-width ratio was more than that of the hole diameter. In the loading cycle, the ratio length to width of the blast block was the most effective parameter. The correlation coefficient of prediction models for the specific mine unit operations index equaled 0.658 and 0.642, showing the critical role of the desired independent variables in the specific mine unit operations’ index. The effective parameters in the performance of mining operations were ranked using SPSS software. Experiment methods such as Taguchi design can be used for sensitivity analysis to ascertain in what ranges each production parameter will be effective for production performance in ideal conditions. Given the extensiveness of the article, the addition of this part of the analysis requires a comprehensive investigation of the data for future research.
5. Future Works
This research work was a great opportunity to examine the operational realities in the Sarcheshmeh copper mine to determine the main effective parameters on the efficiency of the blasting. In the first step, we tried to obtain the relationship between parameters using conventional mathematical regression methods. In the following work, due to the complexities in terms of anisotropy and heterogeneity of the ore mass, we are building on methods based on intelligent computations or soft calculations (such as ANFIS) that are based on the operational realities to have the best adaptation of experimental data in the built intelligent model.
Author Contributions
Conceptualization: A.N. and A.B.V.; methodology, investigation, writing—original draft: A.N., A.B.V. and A.H.; validation, formal analysis, visualization, writing—review and editing: A.N., A.B.V., A.H. and T.N.: writing—review and editing, Supervision: T.N., A.S. and A.H.; Data curation. A.B.V. All authors have read and agreed to the published version of the manuscript.
Funding
This research received no external funding.
Data Availability Statement
Not applicable.
Acknowledgments
The authors would like to thank the National Iranian Copper Industry Company (NICICo., Tehran, Iran). We are also very thankful to Hakan Basarir (from NTNU) for his comments and fruitful discussions.
Conflicts of Interest
The authors declare no conflict of interest.
Appendix A
Table A1.
Collected database relating to drilling unit.
Table A1.
Collected database relating to drilling unit.
| No. | Rock Type | Zone | Alteration | Ucs (MPa) | Hardness Level | D (mm) | B (m) | S (m) | |
|---|---|---|---|---|---|---|---|---|---|
| 1 | SP+ Dike | Hypogene | QS and Clay | 38.25 | Medium hard to hard | 152.4 | 5 | 6 | 0.054 |
| 2 | Dike +AN | Hypogene | QS and Clay | 41.13 | Medium hard to hard | 241.3 | 7 | 9.5 | 0.018 |
| 3 | GR | Hypogene | SQ and Clay | 38.63 | Medium hard to hard | 152.4 | 6 | 7 | 0.029 |
| 4 | Dike +SP | Hypogene | QS and Clay | 44.75 | Medium hard to hard | 152.4 | 7 | 9.5 | 0.04 |
| 5 | AN+ Dike | Hypogene | QS and Clay | 46.25 | Medium hard to hard | 152.4 | 5 | 6 | 0.041 |
| 6 | QI | Hypogene | QS, Bio, and Clay | 39.88 | Medium hard to hard | 152.4 | 5 | 6 | 0.04 |
| 7 | AN | Hypogene | QS and Clay | 35.38 | Medium hard to hard | 152.4 | 5 | 6 | 0.037 |
| 8 | LF+ Dike | Hypogene & supergene | QS, Bio, and Clay | 38.88 | Medium hard to hard | 152.4 | 5 | 6 | 0.04 |
| 9 | AN | Hypogene | QS and K-Feldspar | 39.13 | Medium hard to hard | 152.4 | 7 | 9 | 0.019 |
| 10 | LF+ Dike | Hypogene | QS, Bio, and Clay | 43.88 | Medium hard to hard | 152.4 | 5 | 6 | 0.04 |
| 11 | SP+ Dike +BD | Hypogene | QS, K-Feldspar, and Clay | 45.00 | Medium hard to hard | 25.4 | 7 | 9 | 0.019 |
| 12 | AN+ Dike | Hypogene | QS and Clay | 43.25 | Medium hard to hard | 241.3 | 7 | 9 | 0.019 |
| 13 | LF+ Dike | Hypogene | SQ and Clay | 43.38 | Medium hard to hard | 228.6 | 7 | 9 | 0.019 |
| 14 | SP+BD+ Dike | Hypogene | QS, Bio, and Clay | 43.38 | Medium hard to hard | 25.4 | 7 | 9 | 0.019 |
| 15 | AN+ Dike | Hypogene | SQ and Clay | 39.75 | Medium hard to hard | 24.13 | 7 | 9 | 0.019 |
| 16 | SP+ Dike | Hypogene | SQ and Clay | 38.63 | Medium hard to hard | 152.4 | 5 | 6 | 0.024 |
| 17 | SP+ Dike | Hypogene | QS, Bio, and Clay | 41.13 | Medium hard to hard | 241.3 | 7 | 9 | 0.04 |
| 18 | SP+ Dike | Hypogene | QS and Clay | 41.25 | Medium hard to hard | 241.3 | 7 | 9 | 0.019 |
| 19 | SP+ Dike | Hypogene | QS and Clay | 39.75 | Medium hard to hard | 241.3 | 7 | 9 | 0.019 |
| 20 | LF+ Dike | Hypogene | QS, K-Feldspar, and Clay | 45.00 | Medium hard to hard | 241.3 | 7 | 9 | 0.019 |
The average height of length blast holes was 14.5 to 15 m. S.c.Porph: Sarcheshmeh Porphyry, AN: Andesite, L.F.Porph: Late Fine Porphyry, QS: Quartz Sericite, Bio: Biotite, SQ: Sericiti Quartz, and GR: Granite [67,68].
Table A2.
The degree of fragmentation [4].
Table A2.
The degree of fragmentation [4].
| VI | V | IV | III | II | I | Class |
|---|---|---|---|---|---|---|
| >50 | 50–65 | 65–75 | 75–85 | 85–95 | <95 | Efficiency (%) |
| Very poor | Unsuitable | Moderate | Good | Very good | Excellent | Qualitative |
Table A3.
Collected data related to blasting.
Table A3.
Collected data related to blasting.
| Rock Type | Explosive Type | Fine Fragmentation (%) | Fragmentation Efficiency (%) | ||||
|---|---|---|---|---|---|---|---|
| SP+ Dike | * Emulan | 5.28 | 0.352 | 12.69 | 20.64 | 25 | 92.50 |
| Dike +AN | Emulan | 1.36 | 0.322 | 4.68 | 8.59 | 70 | 79 |
| GR | ANFO | 2.65 | 0.293 | 3.62 | 7.31 | 75 | 77.50 |
| Dike +SP | Emulan | 3.74 | 0.308 | 8.1 | 13.6 | 75 | 77.50 |
| AN+ Dike | Emulan | 3.36 | 0.457 | 7.52 | 12.42 | 42 | 86.50 |
| QI | Emulan | 0.96 | 0.399 | 2.2 | 4.56 | 90 | 73 |
| AN | EM and AN | 2.34 | 0.256 | 2.6 | 6.2 | 82.5 | 75.25 |
| LF+ Dike | ANFO | 2.96 | 0.256 | 3.02 | 6.69 | 80 | 76 |
| AN | Emulan | 3.25 | 0.317 | 6.34 | 10.77 | 55 | 83.50 |
| LF+ Dike | ANFO | 5.28 | 0.424 | 4.52 | 11.21 | 65 | 80.50 |
| SP+ Dike +BD | Emulan | 6.39 | 0.369 | 6.55 | 11.85 | 53 | 84.10 |
| AN+ Dike | Emulan | 4.72 | 0.343 | 6.72 | 14.13 | 46.5 | 86.05 |
| LF+ Dike | EM and ANFO | 1.39 | 0.334 | 3.82 | 6.28 | 80 | 76 |
| SP+BD+ Dike | Emulan | 6.07 | 0.398 | 5.68 | 9.62 | 60 | 82 |
| AN+ Dike | Emulan | 3.00 | 0.469 | 9.39 | 23.32 | 40 | 88 |
| SP+ Dike | ANFO | 1.20 | 0.381 | 10.46 | 25.73 | 35 | 78.5 |
| SP+ Dike | ANFO | 4.89 | 0.457 | 5.51 | 9.08 | 62.5 | 81.25 |
| SP+ Dike | Emulan | 7.04 | 0.436 | 10.39 | 24.49 | 35 | 89.50 |
| SP+ Dike | Emulan | 5.14 | 0.453 | 9.11 | 20.58 | 40 | 88 |
| LF+ Dike | Emulan | 2.07 | 0.329 | 6.72 | 14.13 | 50 | 85 |
* Combination of 80% ANFO and 20% bulk Emuline. S.c. Porgh: Sarcheshmeh Porphyry, AN: Andesite, L.F.Porph: Late Fine Porphyry, QS: Quartz Sericite, Bio: Biotite, SQ: Sericiti Quartz.
Table A4.
Collected data relating to loading.
Table A4.
Collected data relating to loading.
| Type Shovel Loading | Bucket Volume () | Fuel Shovel | ||||||||
|---|---|---|---|---|---|---|---|---|---|---|
| Hydraulic | 16.5 | Diesel | 33.0 | 2.07 | 0.005 | 0.353 | 0.180 | 0.009 | 476.34 | 0.008 |
| Hydraulic | 4.5 | Diesel | 48.23 | 3.04 | 0.005 | 0.038 | 0.050 | 0.005 | 556.3 | 0.005 |
| Hydraulic | 16.5 | Diesel | 18.40 | 3.08 | 0.005 | 0.061 | 0.097 | 0.015 | 533.6 | 0.006 |
| Rope | 12 | Electricity | 30.91 | 1.87 | 0.002 | 0.004 | 0.047 | 0.004 | 1552.35 | 0.003 |
| Rope | 12 | Electricity | 32.1 | 1.94 | 0.001 | 0.009 | 0.035 | 0.004 | 2179.1 | 0.001 |
| Hydraulic | 4.5 | Diesel | 20.8 | 2.73 | 0.004 | 0.024 | 0.071 | 0.013 | 602.8 | 0.005 |
| Rope | 18 | Electricity | 32.92 | 1.71 | 0.002 | 0.012 | 0.059 | 0.003 | 1663.86 | 0.002 |
| Hydraulic | 2.15 | Diesel | 14.38 | 5.25 | 0.005 | 0.079 | 0.204 | 0.008 | 471.2 | 0.009 |
| Rope | 12 | Electricity | 39.50 | 2.08 | 0.002 | 0.011 | 0.034 | 0.003 | 1480.15 | 0.002 |
| Rope | 12 | Electricity | 35.38 | 1.90 | 0.002 | 0.041 | 0.054 | 0.004 | 1197.88 | 0.003 |
| Rope | 12 | Electricity | 33.0 | 1.67 | 0.002 | 0.014 | 0.058 | 0.005 | 1563.6 | 0.003 |
| Hydraulic | 15 | Diesel | 48.2 | 2.61 | 0.005 | 0.324 | 0.177 | 0.011 | 566.0 | 0.007 |
| Rope | 12 | Electricity | 35.29 | 2.00 | 0.002 | 0.021 | 0.067 | 0.004 | 1185.02 | 0.003 |
| Rope | 12 | Electricity | 39.19 | 3.15 | 0.004 | 0.031 | 0.056 | 0.005 | 703.6 | 0.005 |
| Hydraulic | 11 | Diesel | 45.67 | 1.78 | 0.006 | 0.212 | 0.114 | 0.020 | 451.7 | 0.008 |
| Hydraulic | 18 | Electricity | 30.30 | 1.79 | 0.007 | 0.044 | 0.218 | 0.005 | 394.7 | 0.006 |
| Rope | 12 | Electricity | 33.0 | 1.69 | 0.001 | 0.015 | 0.056 | 0.002 | 1744.7 | 0.002 |
| Hydraulic | 16.5 | Diesel | 51.5 | 3.16 | 0.004 | 0.014 | 0.093 | 0.005 | 653.3 | 0.005 |
| Hydraulic | 16.5 | Diesel | 43.80 | 2.64 | 0.004 | 0.000 | 0.084 | 0.006 | 620.3 | 0.005 |
| Rope | 12 | Electricity | 37.15 | 1.86 | 0.001 | 0.004 | 0.022 | 0.001 | 1982.29 | 0.002 |
Table A5.
Fragmentation efficiency of a blasting block.
Table A5.
Fragmentation efficiency of a blasting block.
| Rock Type | Fine Fragmentation (%) | Boulder (%) | Efficiency (%) |
|---|---|---|---|
| Ore | 58.23 | 0.55 | 81.98 |
Table A6.
Collected data relating to crushing and specific mine unit operation index.
Table A6.
Collected data relating to crushing and specific mine unit operation index.
| Total Energy Consumption Blast Block (kw) | |||||
|---|---|---|---|---|---|
| 3.74 | 0.33 | 1516.05 | 1384.34 | 0.171 | 2.60 |
| 68.89 | 1.45 | 1531.79 | 25,221.60 | 0.167 | 0.49 |
| 13.97 | 0.32 | 1465.65 | 4999.00 | 0.171 | 0.87 |
| 13.31 | 0.3 | 1465.06 | 4760.93 | 0.171 | 0.63 |
| 17.92 | 0.4 | 1464.85 | 6408.98 | 0.171 | 0.32 |
| 12.8 | 0.29 | 1462.73 | 4577.86 | 0.171 | 1.36 |
| 24.22 | 0.51 | 1499.15 | 8864.29 | 0.167 | 0.32 |
| 29.27 | 0.9 | 1537.41 | 10,408.50 | 0.162 | 1.49 |
| 31.8 | 0.98 | 1535.37 | 11293.2 | 0.162 | 0.20 |
| 11.51 | 0.79 | 1433.54 | 4198.09 | 0.178 | 0.91 |
| 42.27 | 3.21 | 1602.20 | 17,231.25 | 0.178 | 0.37 |
| 20.89 | 1.42 | 1432.50 | 7613.79 | 0.178 | 0.81 |
| 30.23 | 2.05 | 1432.76 | 11,019.98 | 0.178 | 0.34 |
| 45.62 | 3.1 | 1432.76 | 16,630.22 | 0.178 | 0.67 |
| 12.64 | 0.86 | 1432.95 | 4608.35 | 0.178 | 1.27 |
| 9.16 | 0.62 | 859.72 | 3339.37 | 0.178 | 0.98 |
| 9.89 | 0.67 | 1327.09 | 3606.57 | 0.178 | 0.65 |
| 30.78 | 2.09 | 1432.75 | 11,220.36 | 0.178 | 0.74 |
| 19.79 | 1.35 | 1432.54 | 7213.09 | 0.178 | 0.77 |
| 14.84 | 1.01 | 1432.79 | 5409.86 | 0.178 | 0.22 |
References
- Roy, M.P.; Singh, P. Blast Design and Fragmentation Control–Key to Productivity; CSIR-Central Institute of Mining and Fuel Research: Dhanbad, India, 2012; pp. 1–18. [Google Scholar]
- Janković, A.; Valery, W. Mine to mill optimisation for conventional grinding circuits: A scoping study. J. Min. Metall. A 2002, 38, 49–66. [Google Scholar]
- Adel, G.; Kojovic, T.; Thornton, D. Mine-to-Mill Optimization of Aggregate Production; Virginia Polytechnic Inst. and State Univ. (Virginia Tech): Blacksburg, VA, USA, 2006. [Google Scholar]
- Taji, M.; Ataei, M.; Goshtasbi, A.; Osanloo, M. ODM: A new approach for open pit mine blasting evaluation. J. Vib. Control 2013, 19, 1738–1752. [Google Scholar] [CrossRef]
- Osanloo, M.; Hekmat, A. Prediction of shovel productivity in the Gol-e-Gohar iron mine. J. Min. Sci. 2005, 41, 177–184. [Google Scholar] [CrossRef]
- Lopez Jimeno, C.; Lopez Jimeno, A.; Ayala Carcedo, F.J.; Visser de Ramiro, Y. Drilling and Blasting of Rocks; Balkema, A.A., Ed.; Brookfield: Rotterdam, The Netherlands, 1995. [Google Scholar]
- Blanco, J.A.S.; Singh, A.K. Measurement and Analysis of Blast Fragmentation; CRC Press: London, UK, 2012. [Google Scholar]
- Tatiya, R.R. Surface and Underground Excavations: Methods, Techniques and Equipment; CRC Press: London, UK, 2005. [Google Scholar]
- Gokhale, B.V. Rotary Drilling and Blasting in Large Surface Mines; CRC Press: London, UK, 2010. [Google Scholar]
- Bise, C.J. Mining Engineering Analysis; SME: Littleton, CO, USA, 2003. [Google Scholar]
- Frimpong, M.; Kabongo, K.; Davies, C.-W. Diggability, a Measure of Dragline Effectiveness and Productivity; International Society of Explosives Engineers: Cleveland, OH, USA, 1996. [Google Scholar]
- Singh, S.; Yalcin, T.; Glogger, M.; Narendrula, M. Interaction between the size distribution of the muck and the loading equipment. In Proceedings of the 4th International Conference on Computer Applications in Mineral Industries, Calgary, AB, Canada, 8–10 September 2003. [Google Scholar]
- Afeni, T.B. Optimization of drilling and blasting operations in an open pit mine—The SOMAIR experience. Min. Sci. Technol. 2009, 19, 736–739. [Google Scholar] [CrossRef]
- Bowa, V.M. Optimization of blasting design parameters on open pit bench a case study of Nchanga open pits. Int. J. Sci. Technol. Res. 2015, 4, 45–51. [Google Scholar]
- Mackenzie, A.S. Optimum blasting. In Proceedings of the 28th Annual Minnesota Mining Symposium, Duluth, MN, USA, 14–16 January 1967. [Google Scholar]
- Eloranta, J. The efficiency of blasting versus crushing and grinding. In Proceedings of the 23rd Conference of Explosives and Blasting Technique, Orlando, FA, USA, 19–23 January 1997. [Google Scholar]
- Fuerstenau, M.; Chi, G.; Bradt, R. Optimization of Energy Utilization and Production Costs in Mining and Ore Preparation Processes; Society for Mining, Metallurgy and Exploration: Littleton, CO, USA, 1995. [Google Scholar]
- Eloranta, J. Downstream costs and their relationship to blasting. In Proceedings of the Mineblast 99, Duluth, MN, USA, 7–11 June 1999. [Google Scholar]
- Morin, M.A.; Ficarazzo, F. Monte Carlo simulation as a tool to predict blasting fragmentation based on the Kuz–Ram model. Comput. Geosci. 2006, 32, 352–359. [Google Scholar] [CrossRef]
- Bremer, D.; Ethier, R.; Lilly, D. Factors driving continuous blasting improvement at the Lafarge Ravena Plant. In Proceedings of the 33rd Conference on Explosives and Blasting Technique, Nashville, TN, USA, 28–31 January 2007. [Google Scholar]
- Kanchibotla, S.S. Optimum blasting? Is it minimum cost per broken rock or maximum value per broken rock? Fragblast 2003, 7, 35–48. [Google Scholar] [CrossRef]
- Eshun, P.; Affum, B.; Boakye, A. Drill and Blast Performance Evaluation at the Obra Pit of Chirano Gold Mines Ltd, Ghana. Ghana Min. J. 2016, 16, 28–35. [Google Scholar] [CrossRef]
- Bilim, N.; Çelik, A.; Kekeç, B. A study in cost analysis of aggregate production as depending on drilling and blasting design. J. Afr. Earth Sci. 2017, 134, 564–572. [Google Scholar] [CrossRef]
- Sun, X.; Wang, L.; Lu, Y.; Jiang, B.; Li, Z.; Zhang, J. A yielding bolt-grouting support design for a soft-rock roadway under high stress: A case study of the Yuandian No. 2 coal mine in China. J. S. Afr. Inst. Min. Metall. 2018, 118, 71–82. [Google Scholar] [CrossRef]
- Abbaspour, H.; Drebenstedt, C.; Badroddin, M.; Maghaminik, A. Optimized design of drilling and blasting operations in open pit mines under technical and economic uncertainties by system dynamic modelling. Int. J. Min. Sci. Technol. 2018, 28, 839–848. [Google Scholar] [CrossRef]
- Rocha Gil, M.; Flores, D.; Cebrian, D. Digitization for Optimization: Easier and Cheaper. In Proceedings of the 10th World Conference on Explosives and Blasting, Helsinki, Finland, 15–17 September 2019. [Google Scholar]
- Dinis da Gama, C.; Lopez Jimeno, C. Rock fragmentation control for blasting cost minimization and environmental impact abatement. In Proceedings of the International Symposium on Rock Fragmentation by Blasting, Vienna, Austria, 5–8 July 1993. [Google Scholar]
- Nielsen, K.; Malvik, T. Grindability enhancement by blast-induced microcracks. Powder Technol. 1999, 105, 52–56. [Google Scholar] [CrossRef]
- Taqieddin, S.A. Evaluation of the efficiency of a blasting operation designed for a dragline strip mining process. Min. Sci. Technol. 1989, 8, 59–64. [Google Scholar] [CrossRef]
- Aler, J.; Du Mouza, J.; Arnould, M. Measurement of the fragmentation efficiency of rock mass blasting and its mining applications. Int. J. Rock Mech. Min. 1996, 33, 125–139. [Google Scholar] [CrossRef]
- Schleifer, J.; Tessier, B. Fragmentation assessment using the FragScan system: Quality of a blast. Fragblast 2002, 6, 321–331. [Google Scholar] [CrossRef]
- Shim, H.-J.; Ryu, D.-W.; Chung, S.-K.; Synn, J.-H.; Song, J.-J. Optimized blasting design for large-scale quarrying based on a 3-D spatial distribution of rock factor. Int. J. Rock Mech. Min. Sci. 2009, 46, 326–332. [Google Scholar] [CrossRef]
- Jahani, M.; Taji, M. Comparison of empirical fragmentation models at the Gol-Gohar iron ore mine. In Proceedings of the 11th International Symposium on Rock Fragmentation by Blasting, Sydney, Australia, 24–26 August 2015. [Google Scholar]
- Gaunt, J.; Symonds, D.; McNamara, G.; Adiyansyah, B.; Kennelly, L.; Sellers, E.A.J.A.; Kanchibotla, S.S. Optimisation of drill and blast for mill throughput improvement at Ban Houayxai Mine. In Proceedings of the 11th International Symposium on Rock Fragmentation by Blasting, Sydney, Australia, 24–26 August 2015. [Google Scholar]
- Hakami, A.; Mansouri, H.; Farsangi, E.; Dehghan, M.R.; Faramarzi, F. Study of the effect of blast pattern design on autogenous and semi-autogenous mill throughput at gol-e-gohar iron ore mine. In Proceedings of the 11th International Symposium on Rock Fragmentation by Blasting, Sydney, Australia, 24–26 August 2015. [Google Scholar]
- Nikkhah, A.; Taji, M. Investigating the impacts of fragmentation due to blasting operation on machinary efficiency of Sarcheshmeh Copper Mine. J. Miner. Res. Eng. 2017, 2, 25–36. [Google Scholar]
- La Rosa, D.; Caron, K.; Valery, W.; Diaz, R.; Mamani, H. Blast fragmentation impacts on downstream processing at Goldfields Cerro Corona. In Proceedings of the 11th International Symposium on Rock Fragmentation by Blasting, Sydney, Australia, 24–26 August 2015. [Google Scholar]
- Silva, A.C.; Martins, P.A.A.; Silva, E.M.S.; Fonseca, A.L.S.; Ferrari, A.J.D.; Cunha, E.B.; Silva, V.M.; Matthew, V.O.; Vilela, D.R.T. Fragmentation optimisation–adopting mine to mill for reducing costs and increasing productivity. In Proceedings of the 11th International Symposium on Rock Fragmentation by Blasting, Sydney, Australia, 24–26 August 2015. [Google Scholar]
- Kanchibotla, S.S.; Valery, W.; Morrell, S. Modelling fines in blast fragmentation and its impact on crushing and grinding. In Proceedings of the Explo ‘99–A conference on rock breaking, The Australasian Institute of Mining and Metallurgy, Kalgoorlie, Australia, 7–11 November 1999. [Google Scholar]
- Janković, A.; Grundstrom, C.; Kanchibotla, S.; Thornton, D. Blast fragmentation for maximising the sag mill throughput at Porgera Gold Mine. In Proceedings of the Annual Conference on Explosives and Blasting Technique, Orlando, FL, USA, 28–31 January 2001. [Google Scholar]
- Workman, L.; Eloranta, J. The effects of blasting on crushing and grinding efficiency and energy consumption. In Proceedings of the 29th Conference on Explosives and Blasting Techniques, Nashville, TN, USA, 2–5 February 2003. [Google Scholar]
- Khademian, A.; Bagherpour, R. Alteration of grindability of minerals due to applying different explosives in blasting operation. Miner. Eng. 2017, 111, 174–181. [Google Scholar] [CrossRef]
- Beyglou, A.H. Improvement of Blast-Induced Fragmentation and Crusher Efficiency by Means of Optimized Drilling and Blasting in Aitik. Master’s Thesis, Lulea University of Technology, Luleå, Sweden, 2012. [Google Scholar]
- Stagg, M.; Ottemess, R.; Siskind, D. Effects of blasting practices on fragmentation. In Proceedings of the 33rd US Symposium on Rock Mechanics (USRMS), Santa Fe, NM, USA, 3–5 June 1992. [Google Scholar]
- Strelec, S.; Gazdek, M.; Mesec, J. Blasting design for obtaining desired fragmentation. Teh. Vjesn. 2011, 18, 79–96. [Google Scholar]
- Kim, K. Blasting Design Using Fracture Toughness and Image Analysis of the Bench Face and Muckpile. Master’s Thesis, Virginia Polytechnic Institute and State University, Blacksburg, VA, USA, 2006. [Google Scholar]
- Sharma, A.; Mishra, A.K.; Choudhary, B.S. Impact of blast design parameters on blasted muckpile profile in building stone quarries. Ann. Chim.-Sci. Mater. 2019, 43, 29–36. [Google Scholar] [CrossRef]
- Esen, S.; Nagarajan, M. Muck pile shaping for draglines and dozers at surface coalmines. In Proceedings of the 11th International Symposium on Rock Fragmentation by Blasting Sydney, Sydney, Australia, 24–26 August 2015. [Google Scholar]
- Tittarelli, F.; Mobili, A.; Bellezze, T. The use of a Phosphate-based migrating corrosion inhibitor to repair reinforced concrete elements contaminated by chlorides. IOP Conf. Ser: Mater. Sci. Eng. 2017, 225, 012106. [Google Scholar] [CrossRef]
- Rafeeian, N.; Taji, M.; Nikkhah, A. Mine to mill optimisation in Sarcheshmeh copper mine. In Proceedings of the 10th World Conference on Explosives and Blasting, Helsinki, Finland, 15–17 September 2019. [Google Scholar]
- Hamdi, E.; Du Mouza, J. A methodology for rock mass characterisation and classification to improve blast results. Int. J. Rock Mech. Min. Sci. 2005, 42, 177–194. [Google Scholar] [CrossRef]
- Singh, S.; Yalcin, T. Effects of muck size distribution on scooping operations. In Proceedings of the Annual Conference on Explosives and Blasting Technique, Las Vegas, NV, USA, 10–13 February 2002. [Google Scholar]
- Singh, S.; Narendrula, R. Factors affecting the productivity of loaders in surface mines. Int. J. Surf. Min. Reclam. Environ. 2006, 20, 20–32. [Google Scholar] [CrossRef]
- Mosher, J. Comminution circuits for gold ore processing. In Gold Ore Processing; Adams, M., Ed.; Elsevier: Amsterdam, The Netherlands, 2016; pp. 259–277. [Google Scholar]
- Kojovic, T. Influence of aggregate stemming in blasting on the SAG mill performance. Miner. Eng. 2005, 18, 1398–1404. [Google Scholar] [CrossRef]
- Cunningham, C. The Kuz-Ram fragmentation model–20 years on. In Proceedings of the European Federation of Explosives Engineers Brighton Conference Proceedings, Brighton, UK, 13–16 September 2005. [Google Scholar]
- Moodley, L.; Cunningham, C.; Lourens, H. Measuring the effect of blasting fragmentation on hard rock quarrying operations. In Rock Fragmentation by Blasting; Mohanty, B., Ed.; CRC Press: London, UK, 1996; pp. 353–359. [Google Scholar]
- Babanouri, N.; Mansouri, H.; Nasab, S.K.; Bahaadini, M. A coupled method to study blast wave propagation in fractured rock masses and estimate unknown properties. Comput. Geotech. 2013, 49, 134–142. [Google Scholar] [CrossRef]
- Sołtys, A.; Pyra, J.; Winzer, J. Analysis of blast-induced vibration structure in open-cast mines. J. Vibroeng. 2017, 19, 409–418. [Google Scholar]
- Sołtys, A. Assessment of the impact of blasting works on buildings located in the vicinity of open-pit mines using matching pursuit algorithm. Arch. Min. Sci. 2020, 65, 199–212. [Google Scholar]
- Sołtys, A. Firing explosive charges with millisecond delay in surface mining—Historical outline. Inz. Miner. 2018, 20, 177–190. [Google Scholar]
- Pyra, J.; Sołtys, A. Method for studying the structure of blast-induced vibrations in open-cast mines. J. Vibroeng. 2016, 18, 3829–3840. [Google Scholar] [CrossRef][Green Version]
- Miao, Y.; Zhang, Y.; Wu, D.; Li, K.; Yan, X.; Lin, J. Rock fragmentation size distribution prediction and blasting parameter optimization based on the muck-pile model. Min. Metall. Explor. 2021, 38, 1071–1080. [Google Scholar] [CrossRef]
- Kirsanov, A.K.; Vokhmin, S.A.; Kurchin, G.S.; Zaitseva, E.V.; Volkov, E.P. Grain-size composition predicting models after explosion in open-pit mining. J. Degrade. Min. Land. Manage. 2019, 7, 1915–1919. [Google Scholar] [CrossRef]
- Man, K.; Liu, X.; Song, Z. Blasting vibration monitoring scheme and its application. J. Vibroeng. 2021, 23, 1640–1651. [Google Scholar]
- Nikkhah, A.; Taji, M. The effect of the underground water on production costs and mining operation in open-pit mines, case study: Sarcheshmeh copper mine. J. Geosci. 2019, 28, 267–272. [Google Scholar]
- National Iranian Copper Industies Company, NICICo., Tehran, Iran. Technical reports of Sarcheshmeh Copper Complex—Computer and technical services department of Sarcheshmeh Copper Mine. 2021; (not published work). [Google Scholar]
- National Iranian Copper Industies Company, NICICo., Tehran, Iran. Blasting reports of Sarcheshmeh Copper Complex—The drilling and blasting department of Sarcheshmeh Copper Mine. 2021; (not published work). [Google Scholar]


Publisher’s Note: MDPI stays neutral with regard to jurisdictional claims in published maps and institutional affiliations. |
© 2022 by the authors. Licensee MDPI, Basel, Switzerland. This article is an open access article distributed under the terms and conditions of the Creative Commons Attribution (CC BY) license (https://creativecommons.org/licenses/by/4.0/).