Abstract
The San Francisco de los Andes breccia-hosted deposit (Frontal Cordillera, Argentina) is characterized by complex Bi–Cu–Pb–Zn–Mo–As–Fe–Ag–Au mineralization. After magmatic-hydrothermal brecciation, tourmaline and quartz partially cemented open spaces, followed by quiescent periods where Bi–Cu–Pb–Zn ore formed. Bismuth ore precipitation is characterized by Bi-sulfides, sulfosalts, and tellurosulfide inclusions, which temporally co-exist with Ag-telluride inclusions and chalcopyrite. Three distinct Bi mineralizing stages have been defined based on the following mineral assemblages: (1) Bismuthinite (tetradymite–hessite inclusions); (2) Bismuthinite (tetradymite–hessite inclusions) + cosalite (tetradymite inclusions) + chalcopyrite; and (3) Cosalite (tetradymite inclusions) + chalcopyrite. Overall, Ag-poor bismuthinite hosts both Bi-tellurosulfide and Ag-telluride inclusions, whereas Ag-rich cosalite only hosts tetradymite inclusions.
In this study, we discuss the effects of temperature, pressure, vapor saturation, salinity, acidity/alkalinity, and redox conditions on Bi-rich mineralizing fluids. Evolving hydrothermal fluid compositions are derived from detailed paragenetic, analytical, and previous fluid inclusion studies. Based on trace minerals that co-precipitated during Bi ore formation, mineral chemistry, and quartz geothermobarometry, a thermodynamic model for bismuth species was constructed. Sulfur and tellurium fugacities during Bi-ore precipitation were constrained for the three mineralizing stages at a constant pressure of 1 kbar under minimum and maximum temperatures of 230 and 400 °C, respectively. We infer that Te was transported preferentially in a volatile-rich phase. Given that Te solubility is expected to be low in chloride-rich hydrothermal fluids, telluride and tellurosulfide inclusions are interpreted to have condensed from magmatically-derived volatile tellurium (e.g., Te2(g) or H2Te(g)) into deep-seated, dense, metal-rich brines. Tellurium minerals in the hydrothermal breccia cement provide a direct genetic link with the underlying magmatic system. Though the vertical extent of the breccia complex is unknown, the abundance of Te-bearing minerals could potentially increase with depth and not only occur as small telluride inclusions in Bi-minerals. A vertical zoning of Te-minerals could prove to be important for exploration of similar magmatic-hydrothermal breccia pipes and/or dikes.
1. Introduction
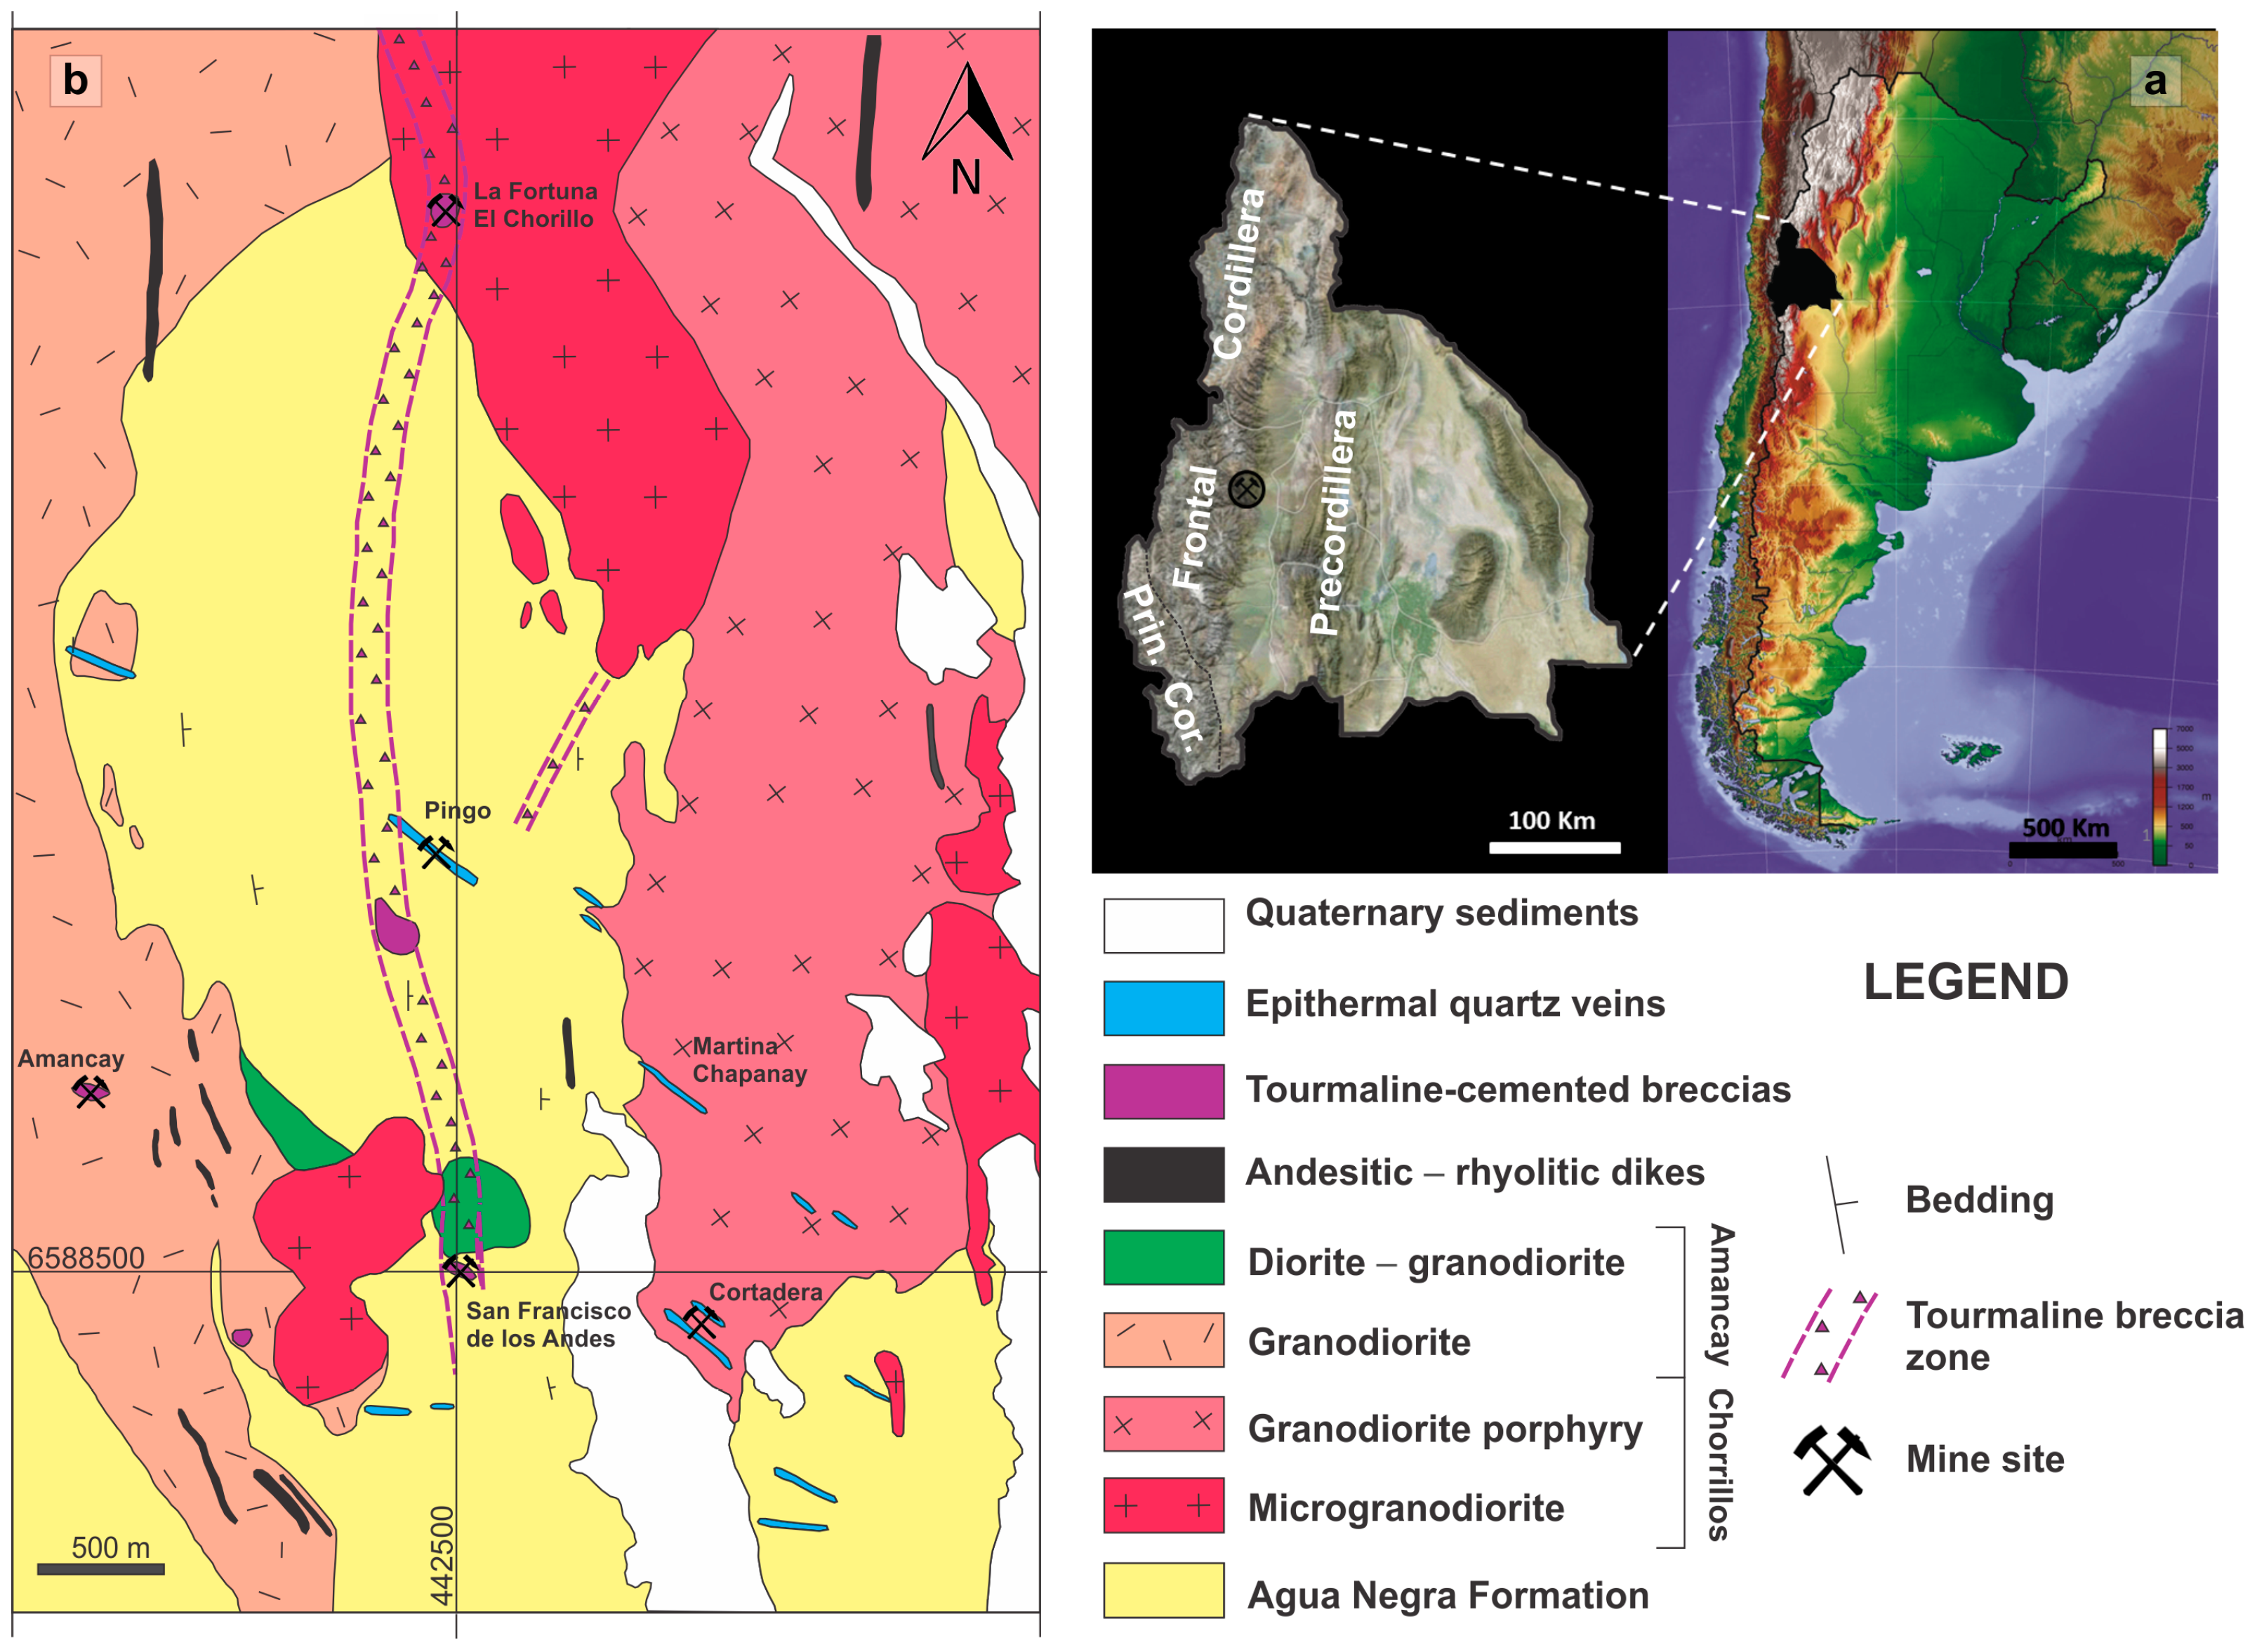
The San Francisco de los Andes breccia complex (30°50′08′′ S; 69°35′58′′ W) is located on the eastern flank of the Frontal Cordillera, San Juan province, Argentina ([1,2]; Figure 1). The Frontal Cordillera is a N-oriented mountain range that forms part of the Andes and extends from La Rioja to Mendoza province, and it is limited to the west by the Principal Cordillera (Figure 1). The San Francisco de los Andes deposit hosts the largest bismuth concentration in a hydrothermal breccia system in Argentina [3]. It is the most important breccia complex in the mineralized district, characterized by Bi–Cu–Au–As-rich tourmaline-cemented breccias and veins. This district extends up to 30 km north along the Frontal Cordillera, and also contains the Amancay, Cortadera, La Fortuna-El Chorrillo, Mirkokleia, Rodophis, Tres Magos, and Flor de los Andes deposits, among others ([2,3]; Figure 1).
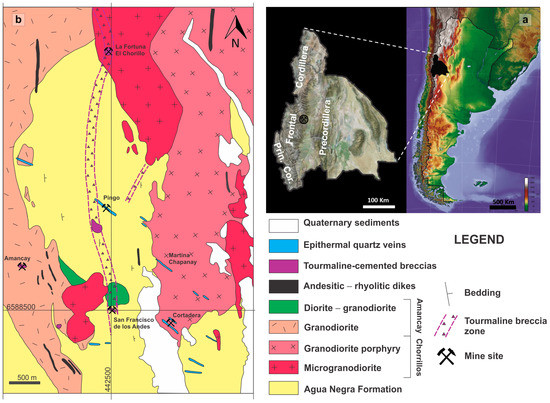
Figure 1.
(a) Map of Argentina (right) and San Juan province (left). Location of Frontal Cordillera and San Francisco de los Andes mine. (b) Geological maps of the southern domain of the San Francisco de los Andes district. Figure based on Llambías and Malvicini (1969), Testa (2017), Testa et al. (2016), and Testa et al. (2018) [1,2,4,5]. Abbreviation: Prin. Cor. = Principal Cordillera.
At a district scale, the study area is characterized by marine sedimentary rocks and granitoids (Figure 1). The oldest unit is the Carboniferous Agua Negra Formation, a sequence of marine sandstones, shales, and siltstones striking north, and dipping steeply eastward ([1,2]; Figure 1). Sedimentary rocks have been intruded by the Tocota Pluton, a Permian intrusive complex that ranges from tonalite to granite in composition ([1,2]; Figure 1). Geological units and hydrothermal alteration assemblages in the San Francisco de los Andes district, along with adjacent epithermal and porphyry districts, have been previously mapped using ASTER Imagery by Testa et al. (2018) [4].
At a deposit scale, the San Francisco de los Andes tourmaline–quartz-cemented breccia complex is spatially and genetically associated with the Tocota Pluton, and has cut the Carboniferous sedimentary host rocks (e.g., [2]; Figure 1). The breccia-hosted deposit is characterized by a complex Bi–Cu–Au–As–Fe–Zn–Pb–Ag mineral assemblage, which includes hypogene sulfides, sulfosalts, tellurides, and native elements, as well as supergene oxides, hydroxides, arsenates, sulfates, carbonates, and secondary sulfides and sulfosalts [5].
The deposit was mined sporadically between the 1940s and 1980s. A total of 112 tons of bismuth concentrate and 2420 tons of ore with 3–6% Cu and 1.2–4.5% Bi were produced [3,6]. In 1990, the Aguilar Mining Company S.A. conducted geologic studies, including surface, sub-surface, and diamond drill core sampling. Based on a detailed geochemical reconnaissance sampling program of surface exposures and sub-surface samples, resource estimations were generated for ores within 200 m of the surface [7]. Aguilar Mining Company estimated a resource of >0.16 Mt. with 5.4 g/t Au, 77 g/t Ag, 0.9% Cu, 0.15% Bi, 0.4% Pb, and 0.1% Zn for the 35 m thick ‘enriched zone’. Although the vertical extent of the breccia complex is unknown, Aguilar Mining Company identified a shallow (20–25 m) hypogene zone comprising sulfide and sulfosalt minerals with average grades of 1.32 g/t Au, 65.5 g/t Ag, 0.55% Cu, 0.02% Bi, 0.38% Pb, and 0.61% Zn [7].
Early comprehensive research of the San Francisco de los Andes deposit was conducted by Llambías and Malvicini (1969) [1]. Supergene arsenate mineral species and supergene luzonite were documented by Bedlivy and Llambías (1969), Malvicini (1969), Bedlivy et al. (1972), and Bedlivy and Mereiter (1982) [8,9,10,11]. Preisingerite (Bi3(AsO4)2O(OH)) was first documented in the San Francisco de los Andes deposit (type locality), and its crystal structure first described by Bedlivy and Mereiter (1982) [11]. The first occurrence of bismoclite (BiOCl) in a magmatic–hydrothermal breccia complex, and its use as an indicator phase in mineral exploration was reported by Testa et al. (2016) [5]. Bismoclite rarely occurs as a pure phase, but is intimately associated with traces of preisingerite [5].
Despite the available research articles and mining reports focused on the San Francisco de los Andes mine, the evolution of hydrothermal fluids responsible for Bi ore deposition remain mostly undocumented. The current study aimed to resolve that issue through field work, macroscopic sample descriptions, and transmitted–reflected light microscopy, along with detailed analytical work based on Testa (2017) [2]. These data are used to further document an alternative paragenetic sequence of the San Francisco de los Andes breccia complex. Special care has been taken to detect any difference between the NW and SE domain of the figure-8-shaped breccia complex. The major aim of this article is to document the Bi ore and characterize the evolution of hydrothermal fluids responsible for its formation. Based on detailed descriptive and analytical studies of ore minerals and quartz geothermobarometry, a thermodynamic model for bismuth species and co-existing mineral phases was constructed. It constrains S2 and Te2 fugacity values for the mineralizing solutions at a constant pressure of 1 kbar under a minimum temperature of 230 °C, and maximum of 400 °C. Along with our thermodynamic model, further genetic implications are proposed for the San Francisco de los Andes magmatic-hydrothermal breccia complex, which aid linking the hydrothermal system with its deep-seated magmatic source.
2. Methods
Eighty-three samples of ore-bearing breccias and host rocks were collected from surface and the main underground mining level at San Francisco de los Andes to represent variations across the breccia complex.
Mineral species were initially determined by macroscopic and microscopic analysis. Mineral percentages, phase relationships, and characteristic textures were recorded using both hand specimens and thin sections. A Nikon E600 POL binocular transmitted/reflected light microscope (Nikon Instruments Inc., Tokyo, Japan) with ×5, ×10, ×20, and ×50 objective lenses, as well as ×10 ocular lenses, was used to identify transparent and opaque minerals. Mineral species were later confirmed by X-ray-diffraction (XRD) analysis. Powder XRD analyses were conducted at the Geology Department, Universidad Nacional del Sur, Argentina, on a Rigaku D-Max III-C automatic powder diffractometer with Cu Kα radiation and graphite monochromator to strip the Kα2 contribution.
Electron microprobe analysis (EMPA) and laser ablation inductively coupled plasma mass spectrometry (LA-ICP-MS) were used for mineral chemical analysis, and to identify microscopic mineral phases in fine-grained intergrowth textures and mineral inclusions. Major element chemical compositions of sulfides, sulfosalts, and tellurides were acquired by EMPA. Carbon-coated mounts were analyzed on a Cameca SX100 electron microprobe housed at the Central Science Laboratory, University of Tasmania, outfitted with five tunable wavelength-dispersive spectrometers (WDS). Backscattered electron images (BSEI) aided further differentiation of mineral species prior to EMP analysis. Minor and trace element compositions of mineral phases were acquired by LA-ICP-MS. Samples were analyzed on a New Wave 213-nm solid-state laser microprobe coupled to an Agilent 4500 quadrupole ICP-MS. All LA-ICP-MS studies were conducted at the CODES LA-ICP-MS analytical facility, University of Tasmania.
Sulfur and Te fugacities during Bi ore deposition were reconstructed based on mineralogical and thermodynamic analysis. Log fS2 vs. log fTe2 diagrams were calculated for Bi-mineralization and co-existing mineral phases from the San Francisco de los Andes breccia complex using available thermodynamic properties for mineral assemblages in equilibrium. Stability limits were calculated using thermodynamic data of minerals from Garrels and Christ (1965), Meyer and Hemley (1967), Robie and Waldbaum (1968), Craig and Barton (1973), Robie et al. (1978), Barton and Skinner (1979), Afifi et al. (1988a,b), Robie and Hemingway (1995), and Krauskopf and Bird (1995) [12,13,14,15,16,17,18,19,20,21]. All chemical reactions, log K values, and related thermodynamic properties were based on the aforementioned sources.
3. Results
3.1. Morphology and Spatial Dimensions of the Breccia Complex
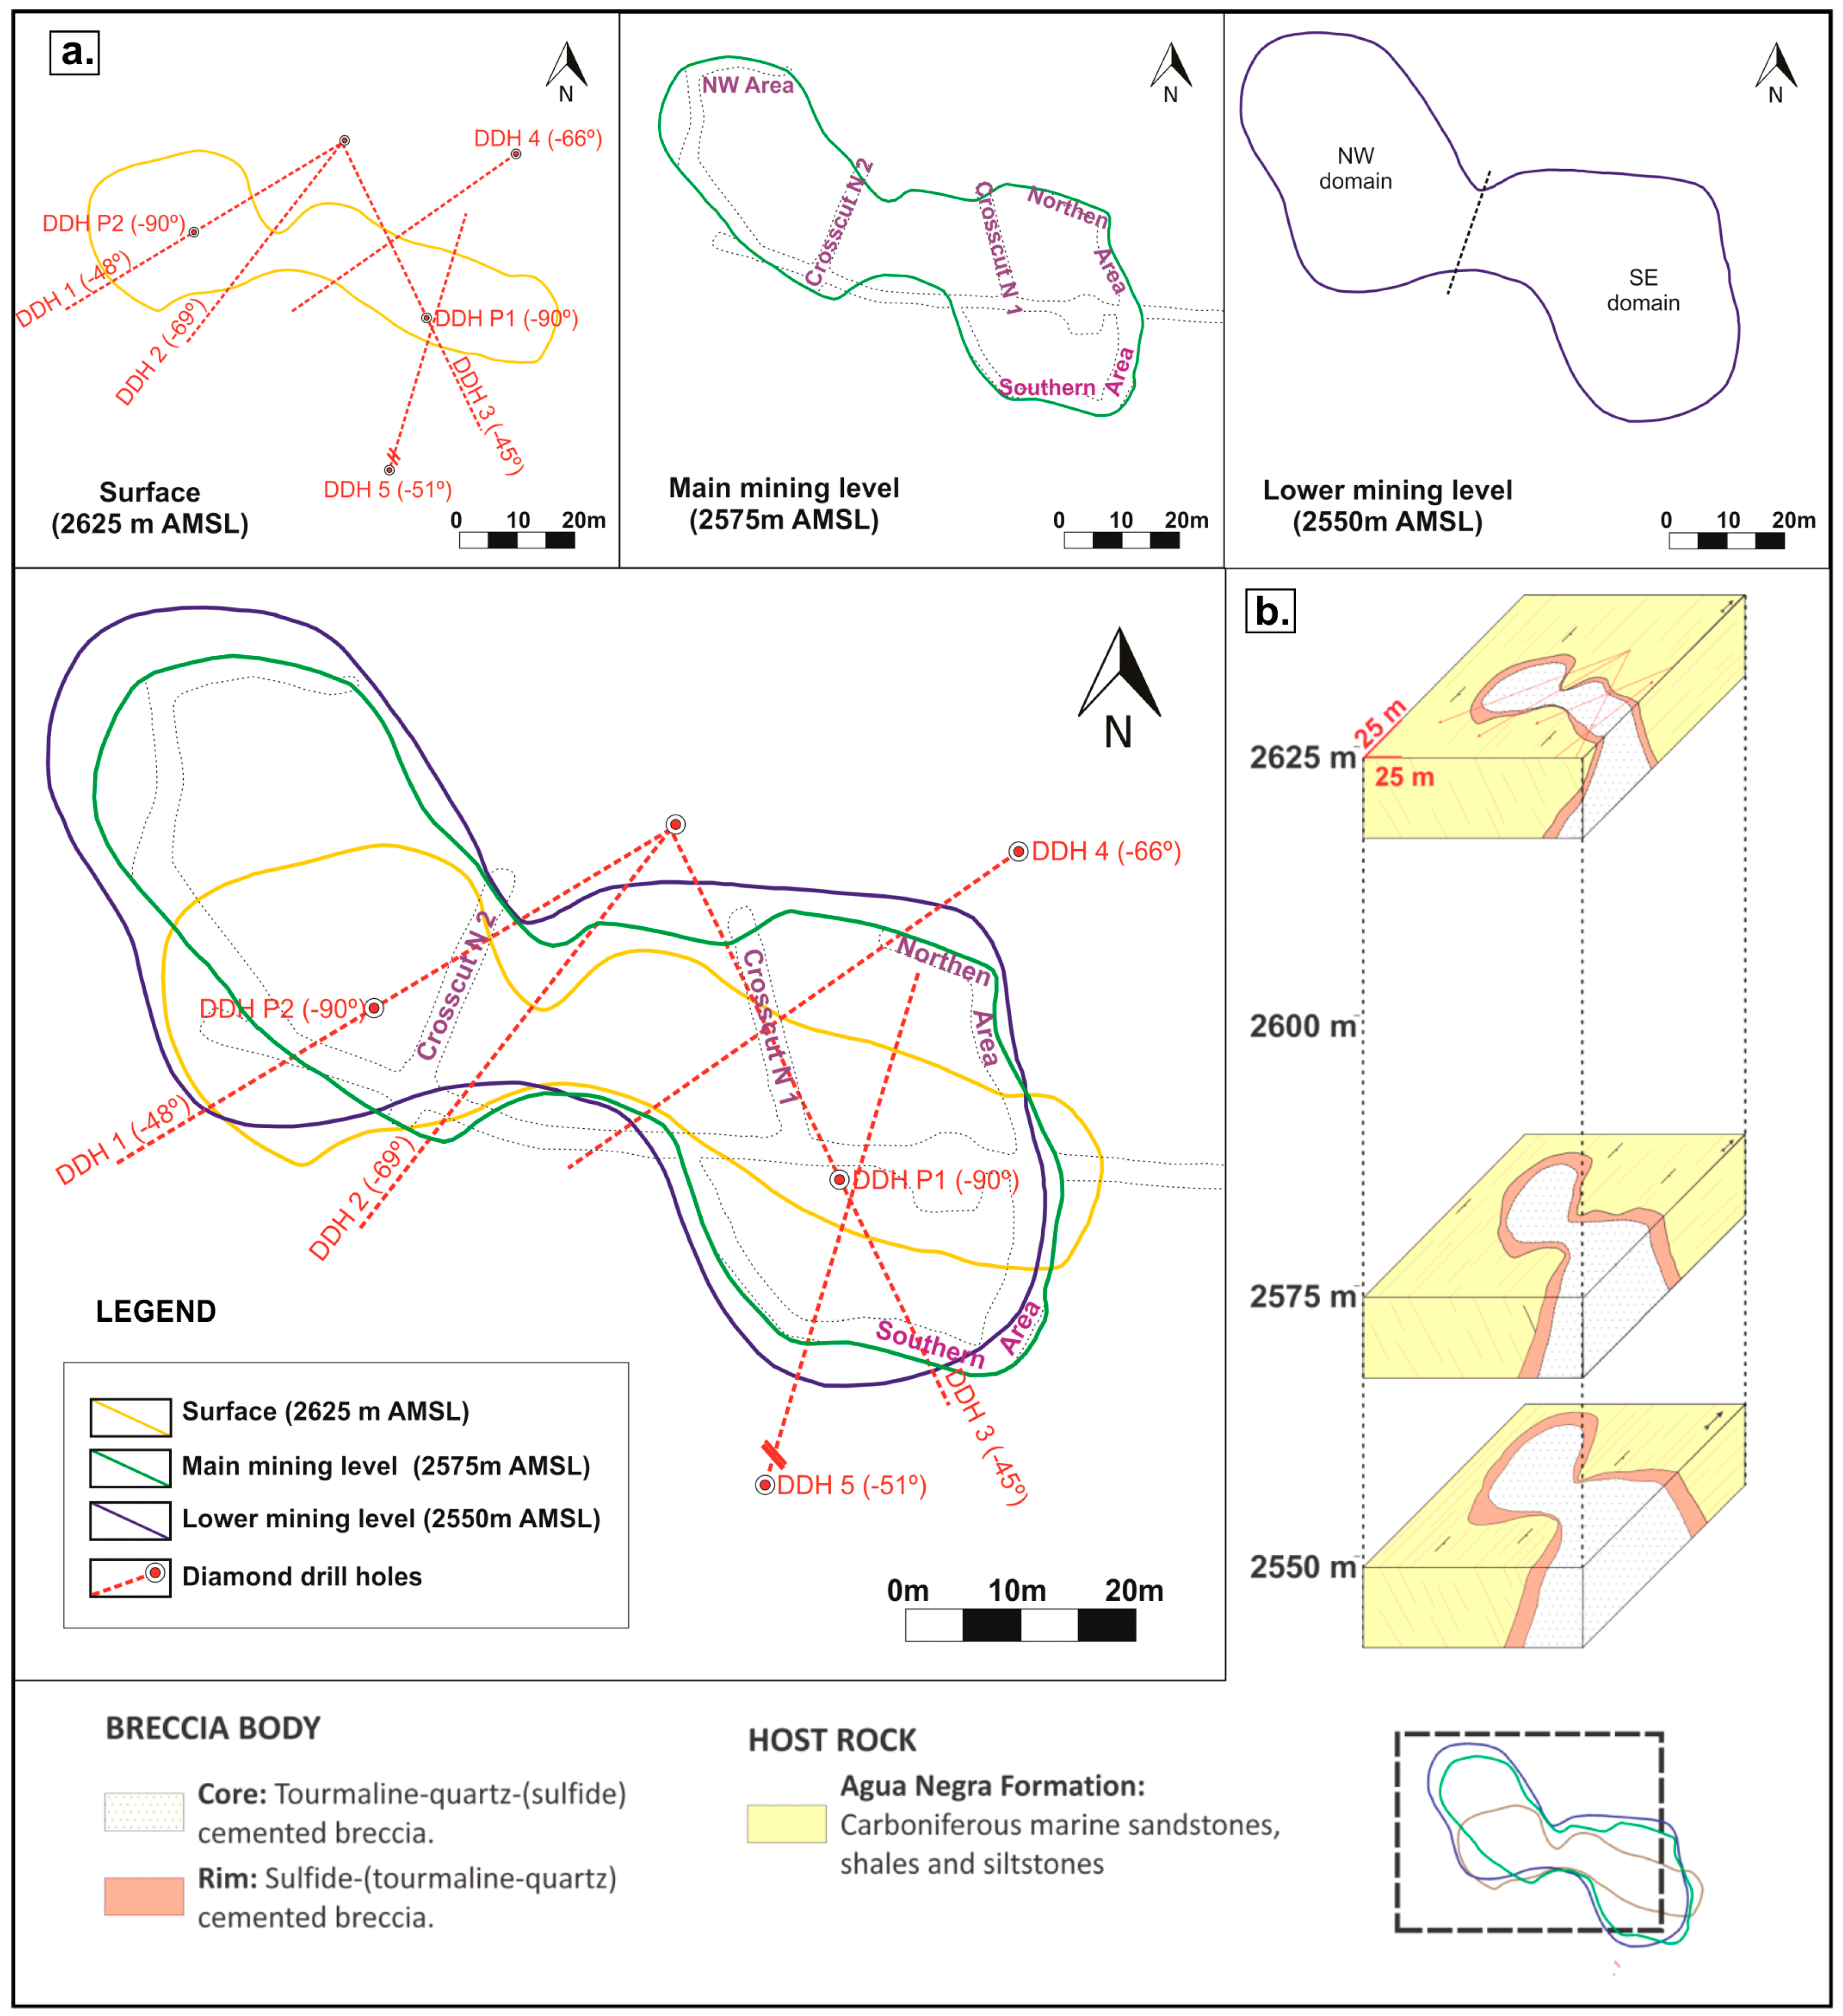
The San Francisco de los Andes breccia complex has an elongated NW-trending elliptical shape with a constriction in the middle (Figure 2). Based on underground working, the ‘figure 8’-shaped outline in the plan view can be traced for up to 75 m below the surface. The consistent neck in the middle of the structure divides the breccia complex into two domains: the SE and NW domains (Figure 2).
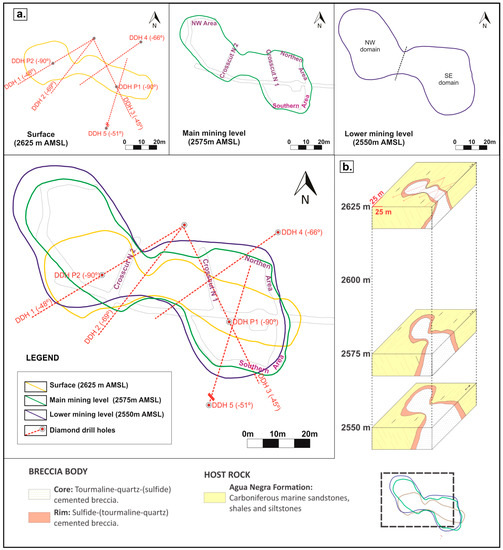
Figure 2.
(a). Plan view of the San Francisco de los Andes breccia complex at surface, main, and lower mining levels. A fourth panel shows the resulting composite overlay plan view. Locations of drill collars and projected drill holes are shown in red. (b). Block diagram of the breccia complex, note the consistent constriction in the middle of the breccia complex. Figure based on Lencinas (1990), Testa et al. (2016), Testa (2017) [2,5,7].
The horizontal dimensions of the breccia body at three levels in the mine can be seen in Figure 2a. The elliptical contour at the surface is markedly elongated WNW, with a maximum length of 67 m (Figure 2a). Fifty meters underground, the SE and NW domains are distinctly larger, and double the area mapped on surface. The ‘figure 8’-shaped outline is enhanced, and the maximum axis is 77 m long NW (Figure 2a). Twenty-five meters under the main level, the maximum length of the breccia column is slightly longer (80 m NW), and the area of both domains is wider (Figure 2a). This is the deepest mining level where the outline of the breccia body can be fully documented. A block diagram has been drawn to show three-dimensional variations in the morphology of the breccia complex with depth; Figure 2b is based on the outline of the breccia complex at surface and underground plan views.
Information available from the <200-m-long diamond drill holes also document a gradual increase in length and width with increasing depth, with clear steeply dipping contacts with the host rock (Figure 2b). These features, along with the slightly tilted inwards contacts, are consistent with the upper level of a magmatic-hydrothermal breccia conduit or pipe (e.g., Sillitoe, 1985; 2010 [22,23]). None of the <200-m-long drill holes reached the root of the breccia complex, and the full vertical extent of the breccia column is unknown.
3.2. Paragenetic Sequence
3.2.1. Hydrothermal Cement in the SE Domain
Brecciation was followed by precipitation of silicate minerals from hydrothermal fluids, which partially cemented breccia clasts (Figure 3). Tourmaline, and to a lesser extent quartz, define the earliest cockade banding in the breccia complex (stage SE-a; Figure 3). A second phase of infill followed, which produced major sulfide and sulfosalt deposition (stage SE-b; Figure 3). Based on textural relationship, this stage was subdivided into an early (stage SE-b-I) and late sulfide–sulfosalt phase (stage SE-b-II; Figure 3).
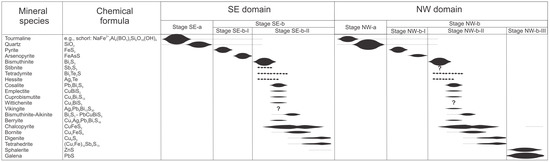
Figure 3.
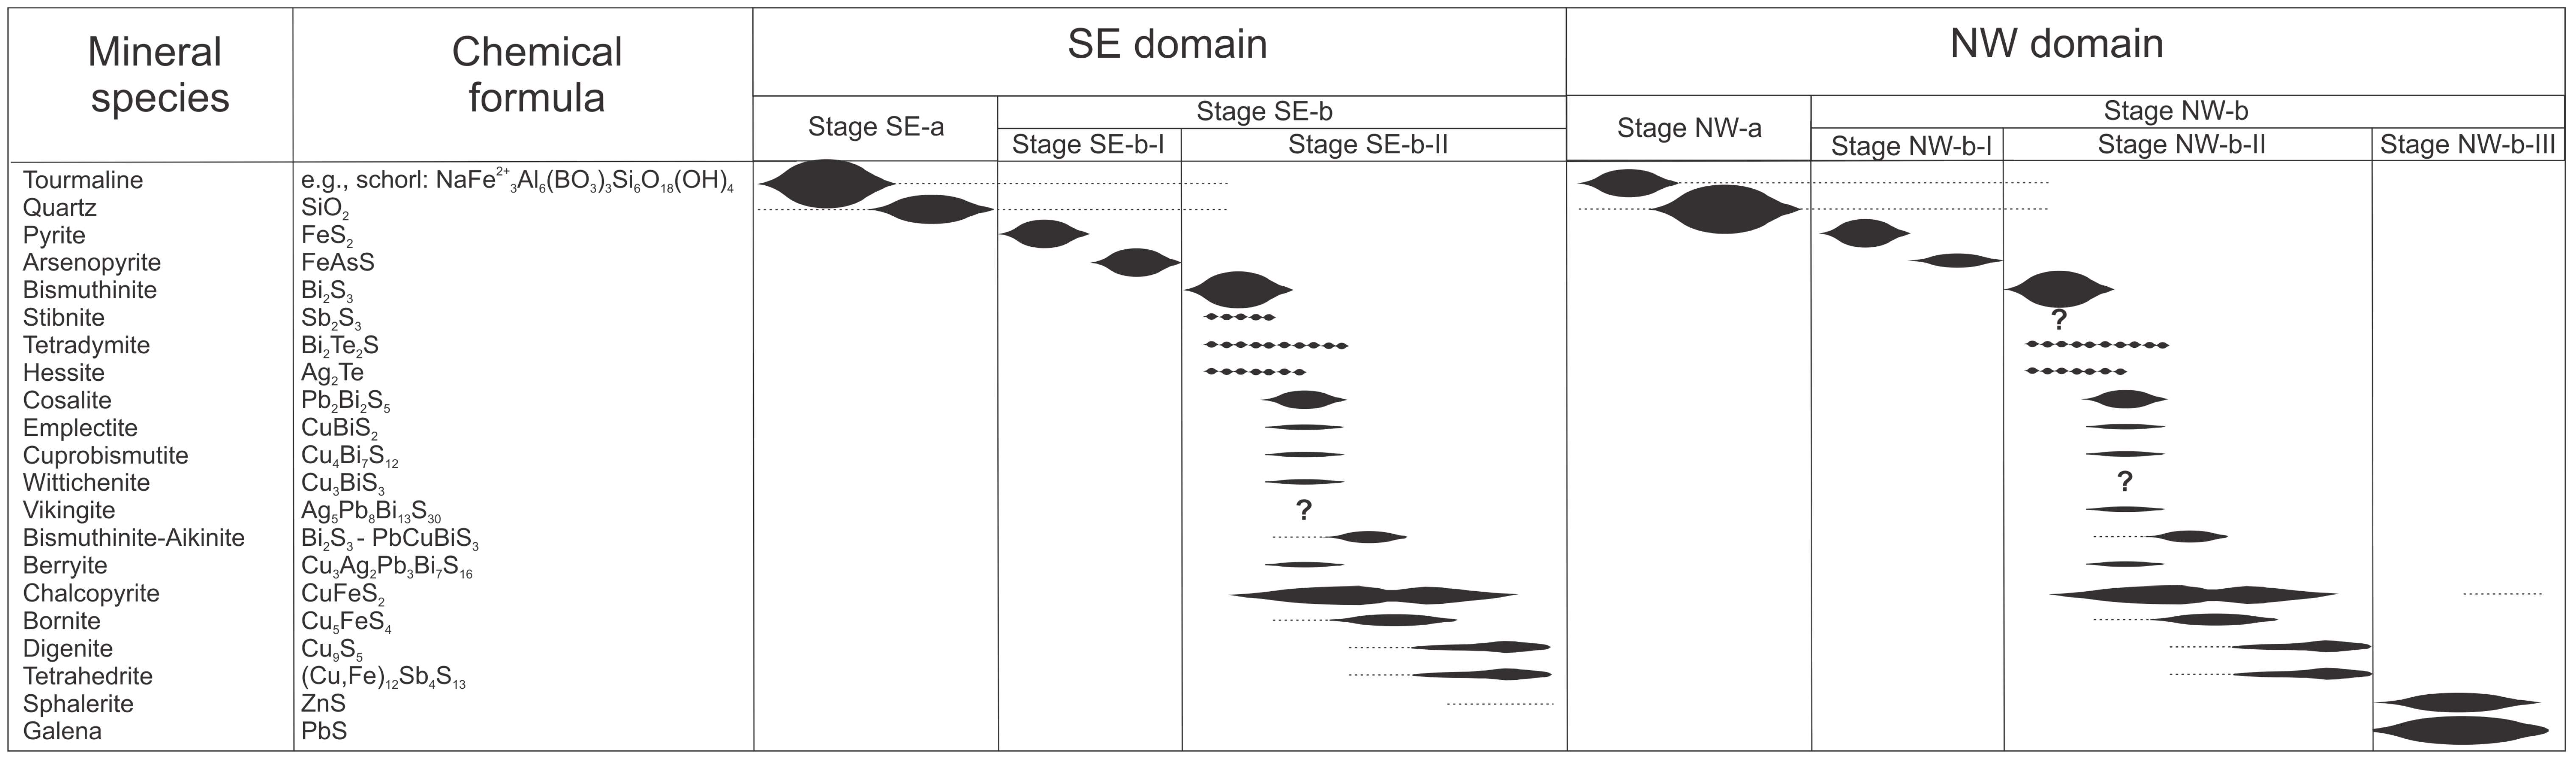
Paragenetic diagram for the SE and NW domains of the San Francisco de los Andes breccia complex. Only the most abundant and distinctive hypogene mineral species are shown.
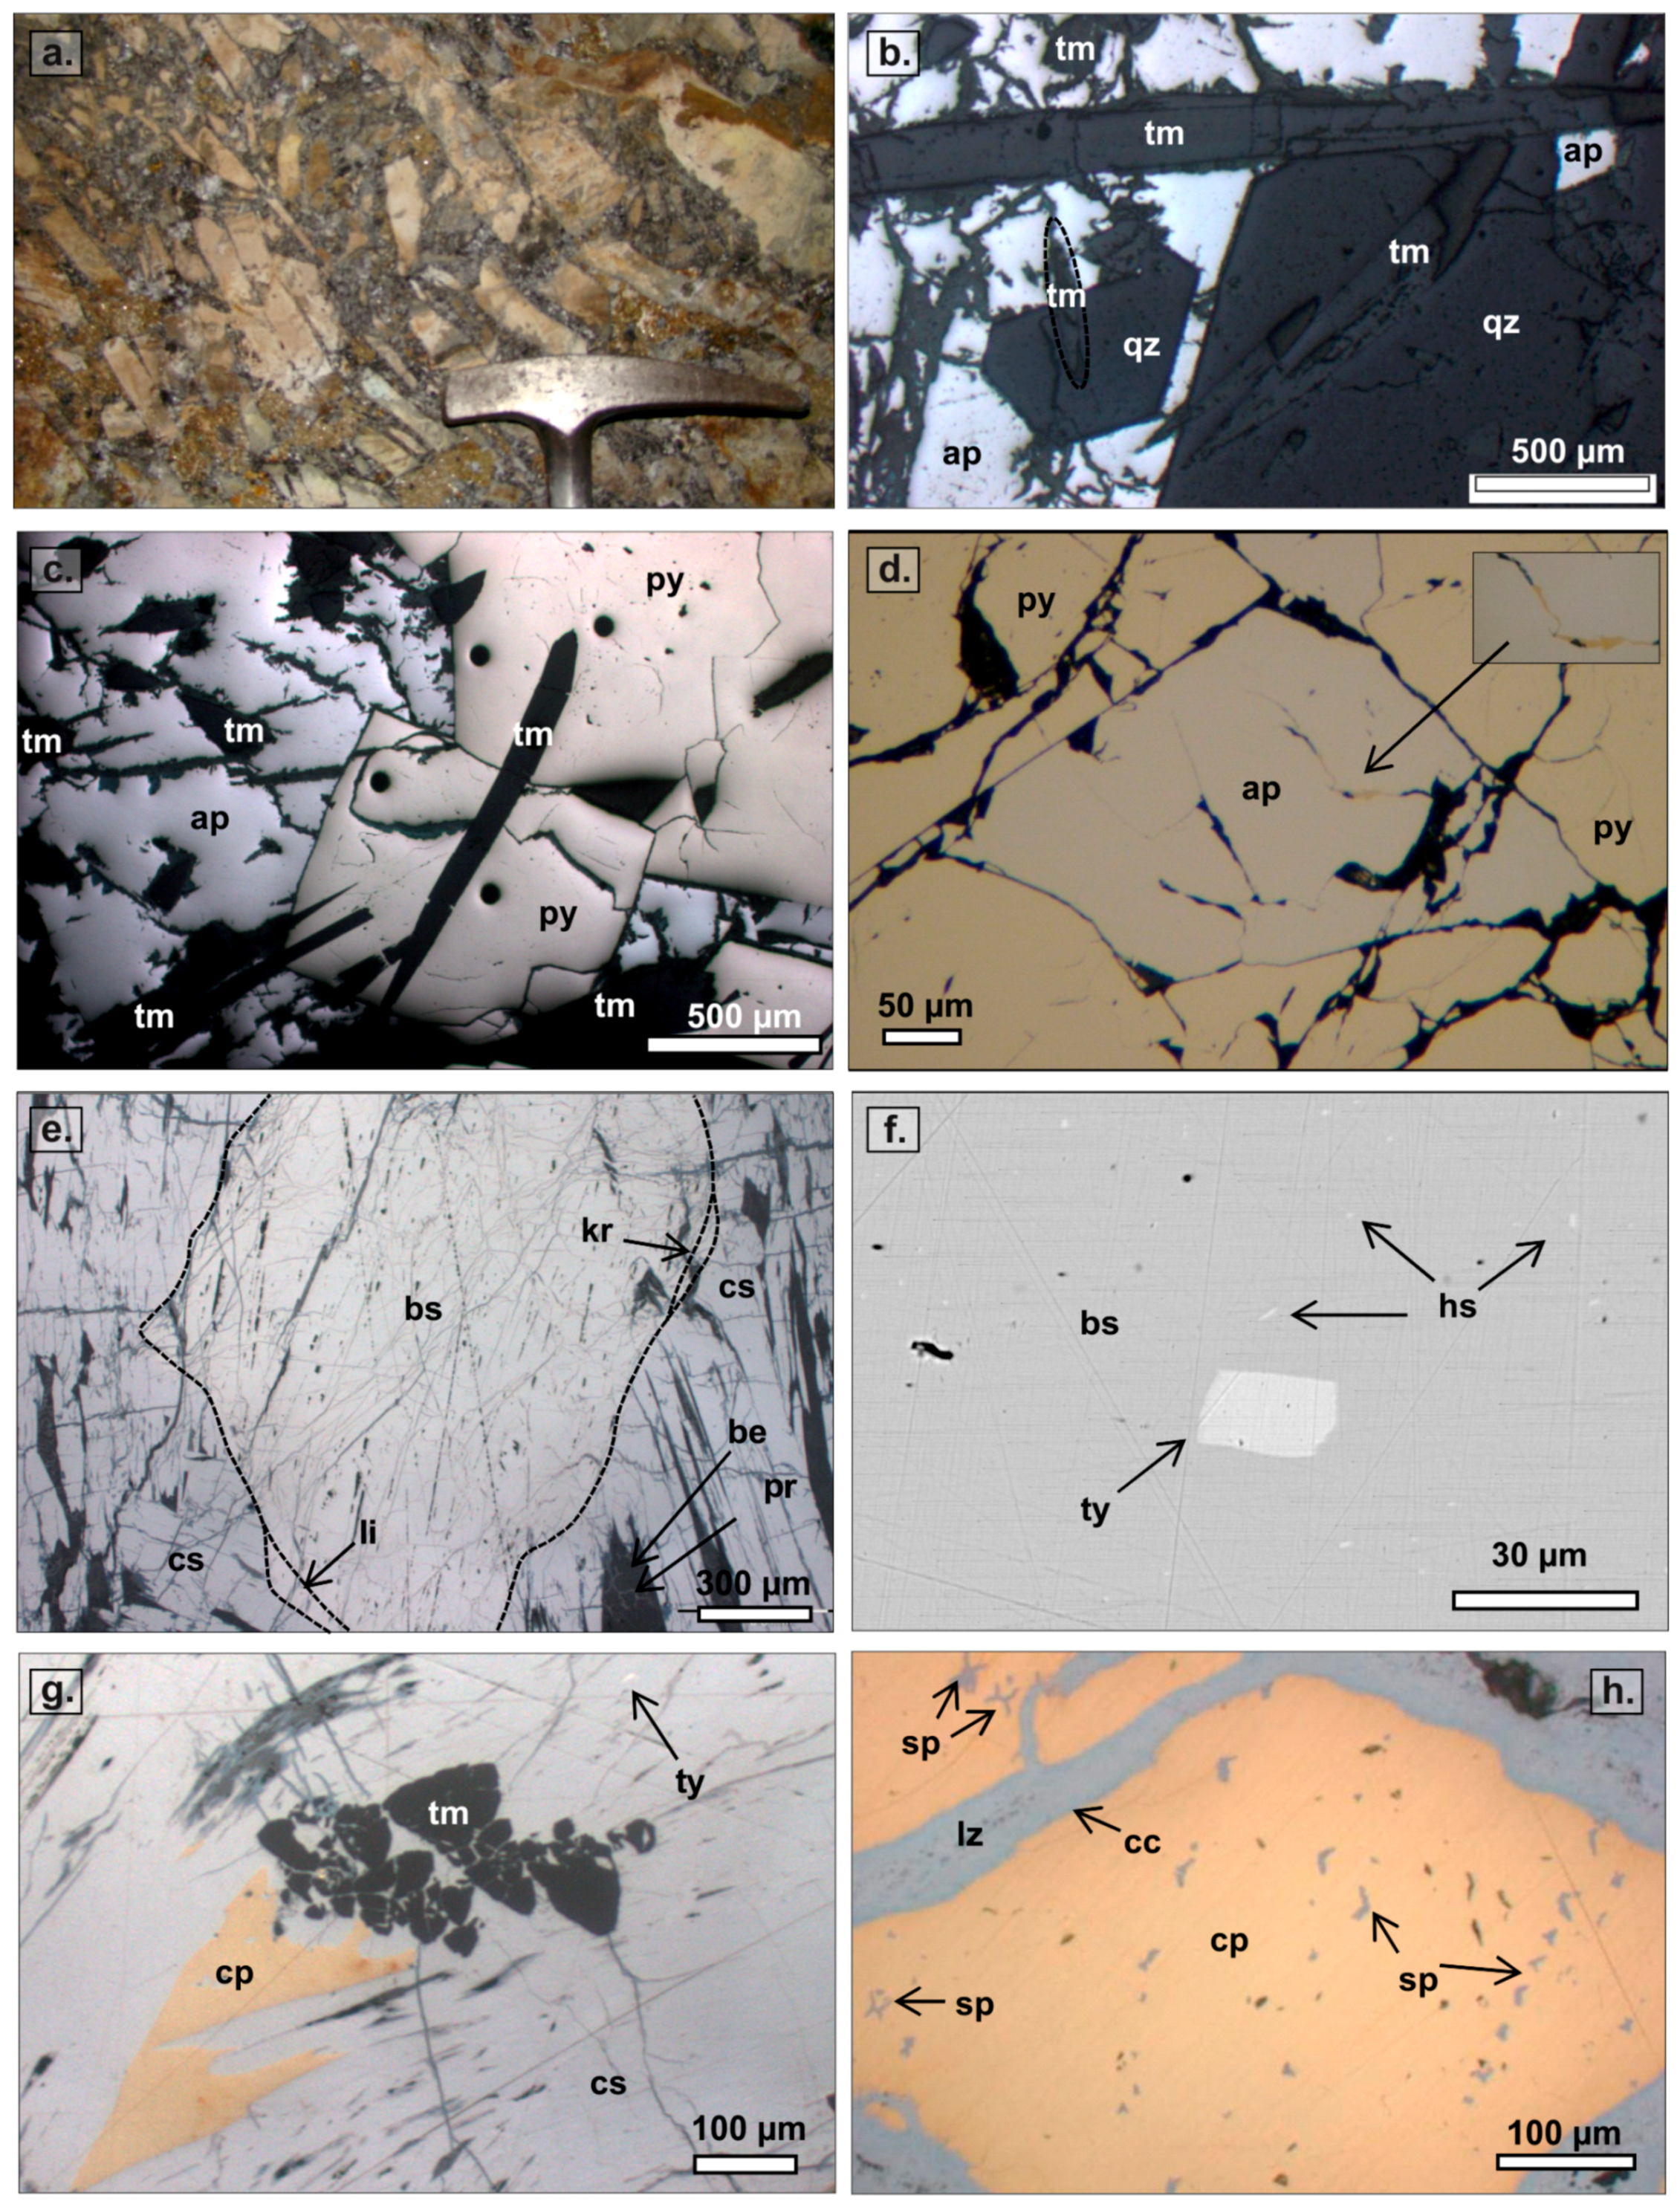
Coarse- to medium-grained, euhedral tourmaline was the first mineral to precipitate during stage SE-a. It was followed by coarse- to medium-grained euhedral to subhedral quartz, which is intergrown with younger tourmaline (Figure 3 and Figure 4a,b). The abundance of tourmaline and quartz varied during stage SE-a, where abundant tourmaline co-precipitated with minor quartz and vice versa, but in general, abundant tourmaline co-precipitated with minor quartz. Euhedral tourmaline and quartz tended to grow perpendicular to tabular breccia fragments, resulting in cockade textures.
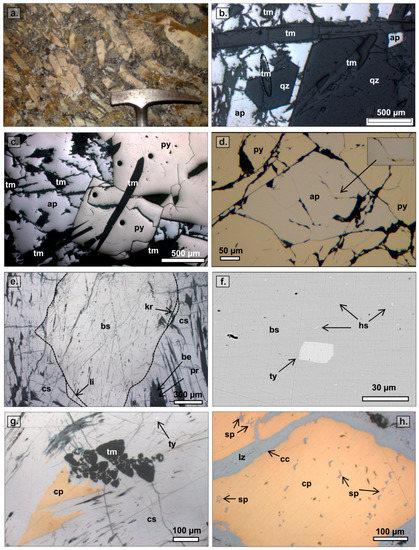
Figure 4.
Key mineral phases and assemblages documented in the SE domain. (a) Tourmaline > quartz-cemented breccias. (b) Stage SE-a tourmaline prisms overgrown by SE-a quartz (hexagonal cross section). Stage SE-b-I arsenopyrite encloses younger silicates (reflected light, parallel nicols). (c) Stage SE-a tourmaline overgrown by stage SE-b-I pyrite and younger SE-b-I arsenopyrite (reflected light, parallel nicols). (d) Stage SE-b-I arsenopyrite filling fractures in euhedral pyrite. Note that both sulfides are affected by younger fractures, locally cemented by stage NW-b-II chalcopyrite and supergene chalcocite (reflected light, parallel nicols). (e) Stage SE-b-II bismuthinite and cosalite. Intermediate members of the bismuthinite–aikinite series formed along the contacts. Cosalite exhibits evident cleavage and parting where the arsenate beudantite and preisingerite, preferentially formed (reflected light, parallel nicols). (f) Very fine-grained hessite inclusions are only hosted in bismuthinite, whereas tetradymite inclusions are more abundant and larger (BSEI). (g) Stage SE-a tourmaline trigonal prisms overgrown by stage SE-b-II cosalite. Younger SE-b-II chalcopyrite formed along cosalite parting and cleavage (reflected light, parallel nicols). (h) Sphalerite stars and incomplete skeletal sphalerite crystal inclusions in stage SE-b-II chalcopyrite. Supergene chalcocite and luzonite formed along fractures (reflected light, parallel nicols). Abbreviations: ap = arsenopyrite, be = beudantite, bs = bismuthinite, cc = chalcocite, cp = chalcopyrite, cs = cosalite, hs = hessite, kr = krupkaite, li = lindstromite, lz = luzonite, pr = preisingerite, py = pyrite, qz = quartz, sp = sphalerite, tm = tourmaline, and ty = tetradymite.
Stage SE-b-I is characterized by euhedral pyrite followed by arsenopyrite (Figure 3). Stage SE-b-I produced more than 95% of pyrite and arsenopyrite in the SE domain of the breccia complex. Pyrite formed euhedral crystals, which now show different degrees of cataclasis (Figure 4c,d). Arsenopyrite exhibits less fractures than pyrite, and it commonly fills fractures in earlier-formed pyrite crystals (Figure 4c,d). Stage SE-b-I pyrite–arsenopyrite is crosscut and overprinted by stage SE-b-II Bi–Cu ore minerals (Figure 3 and Figure 4d).
Stage SE-b-II sulfides and sulfosalts are the main Bi and Cu ores in the SE domain. Bismuthinite was the first Bi mineral to precipitate and was followed by cosalite (Figure 3 and Figure 4e–g). Cosalite co-precipitated and continued to form after bismuthinite stopped (Figure 3). Minor to trace amounts of stibnite formed simultaneously with bismuthinite, whereas minor emplectite, cuprobismutite, wittichenite, and berryite formed synchronous with cosalite (Figure 3). Younger mineral species of the bismuthinite–aikinite series commonly occur at contacts between bismuthinite and cosalite (Figure 3 and Figure 4e), but they are also locally hosted in bismuthinite crystals. Minor amounts of tellurosulfides and tellurides accompanied precipitation of bismuth sulfides and sulfosalts (Figure 3); tetradymite inclusions are hosted in both bismuthinite and cosalite, whereas hessite inclusions are rarer and were only found in bismuthinite (Figure 3 and Figure 4f,g). Stage SE-b-II chalcopyrite crystalized after bismuthinite started to precipitate and began to form before cosalite. Chalcopyrite continued to precipitate well after cosalite stopped (Figure 3; e.g., Figure 4g). Stage SE-b-II paragenetic relationships documented during this study were consistent with the observations of Llambías and Malvicini (1969) [1]. Bornite is a common phase but is less abundant than chalcopyrite. Bornite, together with minor digenite and tetrahedrite formed synchronous with and after stage SE-b-II chalcopyrite began to precipitate (Figure 3). Only minor sphalerite stars and incomplete sphalerite skeletal crystal inclusions occur in stage SE-b-II chalcopyrite crystals (Figure 3 and Figure 4h).
3.2.2. Hydrothermal Cement in the NW Domain
The paragenetic sequence in the NW domain is similar to that in the SE domain, in that silicate minerals (stage NW-a) were followed by sulfides and sulfosalts (stage NW-b; Figure 3). Stage NW-b mineralization can be further subdivided into an early (stage NW-b-I), intermediate (stage NW-b-II) and late phase (stage NW-b-III; Figure 3).
Stage NW-a contains more quartz than tourmaline, which contrasts with stage SE-a (Figure 3). Cockade and comb textures are also common, but the most distinctive textural feature in stage NW-a is the clear to milky cockade quartz, which is not present in stage SE-a (Figure 5a).
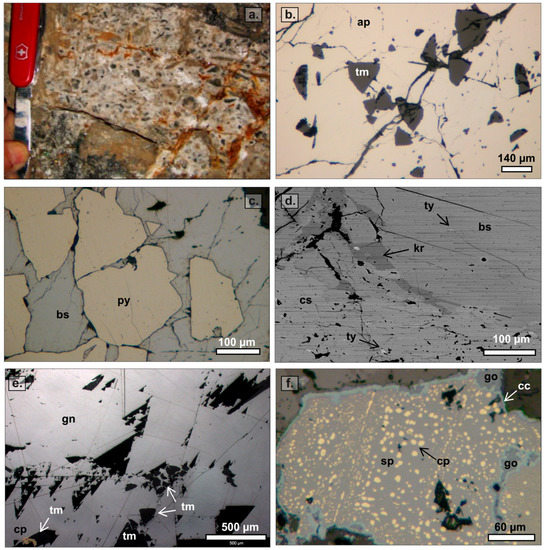
Figure 5.
Key mineral phases and assemblages documented in the NW domain. (a) Characteristic milky quartz with cockade texture from the NW domain breccias. (b) Stage NW-a tourmaline trigonal prisms overgrown by stage NW-b-I arsenopyrite (reflected light, parallel nicols). (c) Stage NW-b-I pyrite moderately fractured and cemented by stage NW-b-II bismuthinite (reflected light, parallel nicols). (d) Backscattered electron image of stage NW-b-II bismuthinite and cosalite. Note the presence of tetradymite inclusions hosted in both Bi-bearing minerals, whereas krupkaite formed only along the contacts. (e) Stage NW-b-III galena crystal with its characteristic triangular cleavage pits. Stage NW-a tourmaline prisms and NW-b-II chalcopyrite grains are enclosed in the galena crystal (reflected light, parallel nicols). (f) Stage NW-b-III sphalerite with chalcopyrite disease texture and supergene chalcocite rims (reflected light, parallel nicols). The different sizes of the chalcopyrite blebs in sphalerite are grouped and aligned along crystallographic planes in sphalerite. Abbreviations: ap = arsenopyrite, bs = bismuthinite, cc = chalcocite, cp = chalcopyrite, cs = cosalite, gn = galena, go = goethite, kr = krupkaite, py = pyrite, sp = sphalerite, tm = tourmaline, and ty = tetradymite.
Stage NW-b-I is similar to stage SE-b-I in that it is characterized by euhedral pyrite, followed by arsenopyrite (Figure 5b,c). However, arsenopyrite is significantly less abundant in stage NW-b-I than stage SE-b-I (Figure 3).
Identical to the SE domain, stage NW-b-II is characterized by Bi and Cu mineralization (Figure 3). Bismuthinite, cosalite, chalcopyrite, and associated sulfides, sulfosalts, and tellurides are common, but they are less abundant than in stage SE-b-II (Figure 5c,d). Another difference between stages SE-b-II and NW-b-II is the presence of minor vikingite and lack of wittichenite and stibnite from stage NW-b-II (Figure 3).
Stage NW-b-III mineral assemblage is the most distinctive feature of the NW domain of the breccia complex, because it is characterized by abundant galena and sphalerite (Figure 3 and Figure 5e,f). These sulfides are not present in the SE domain, expect for traces of sphalerite as star-like inclusions in stage SE-b-II chalcopyrite (Figure 4h). Stage NW-b-III sphalerite hosts very fine- to medium-grained blebs of chalcopyrite, defining the characteristic chalcopyrite disease texture (Figure 5f; cf., [24]).
3.3. Bismuth Mineral Species and Related Phases
In this section, we present two representative samples from our Bi-bearing mineral chemical composition dataset. These samples were selected as they show major chemical variations for each domain. Table 1 lists the average major chemical composition of each species, per domain, analyzed by EMPA. Figure 6 illustrates the theoretical chemical composition for the most relevant species in the Bi–Sb–Cu–Ag–Pb–S system. Only sulfides and sulfosalts were plotted on this ternary diagram.

Table 1.
Mean major chemical composition of each Bi-bearing species detected in the NW and SE domains. Average major chemical compositions are based on EMP analyses collected from two samples from opposite domains of the breccia complex: 29-2010 (NW) and 15-2010 (SE).
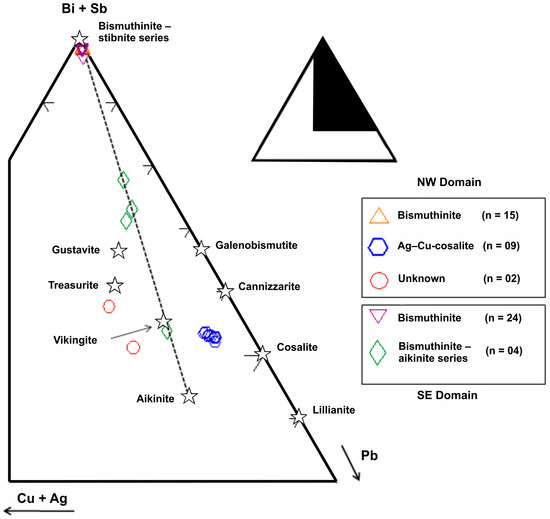
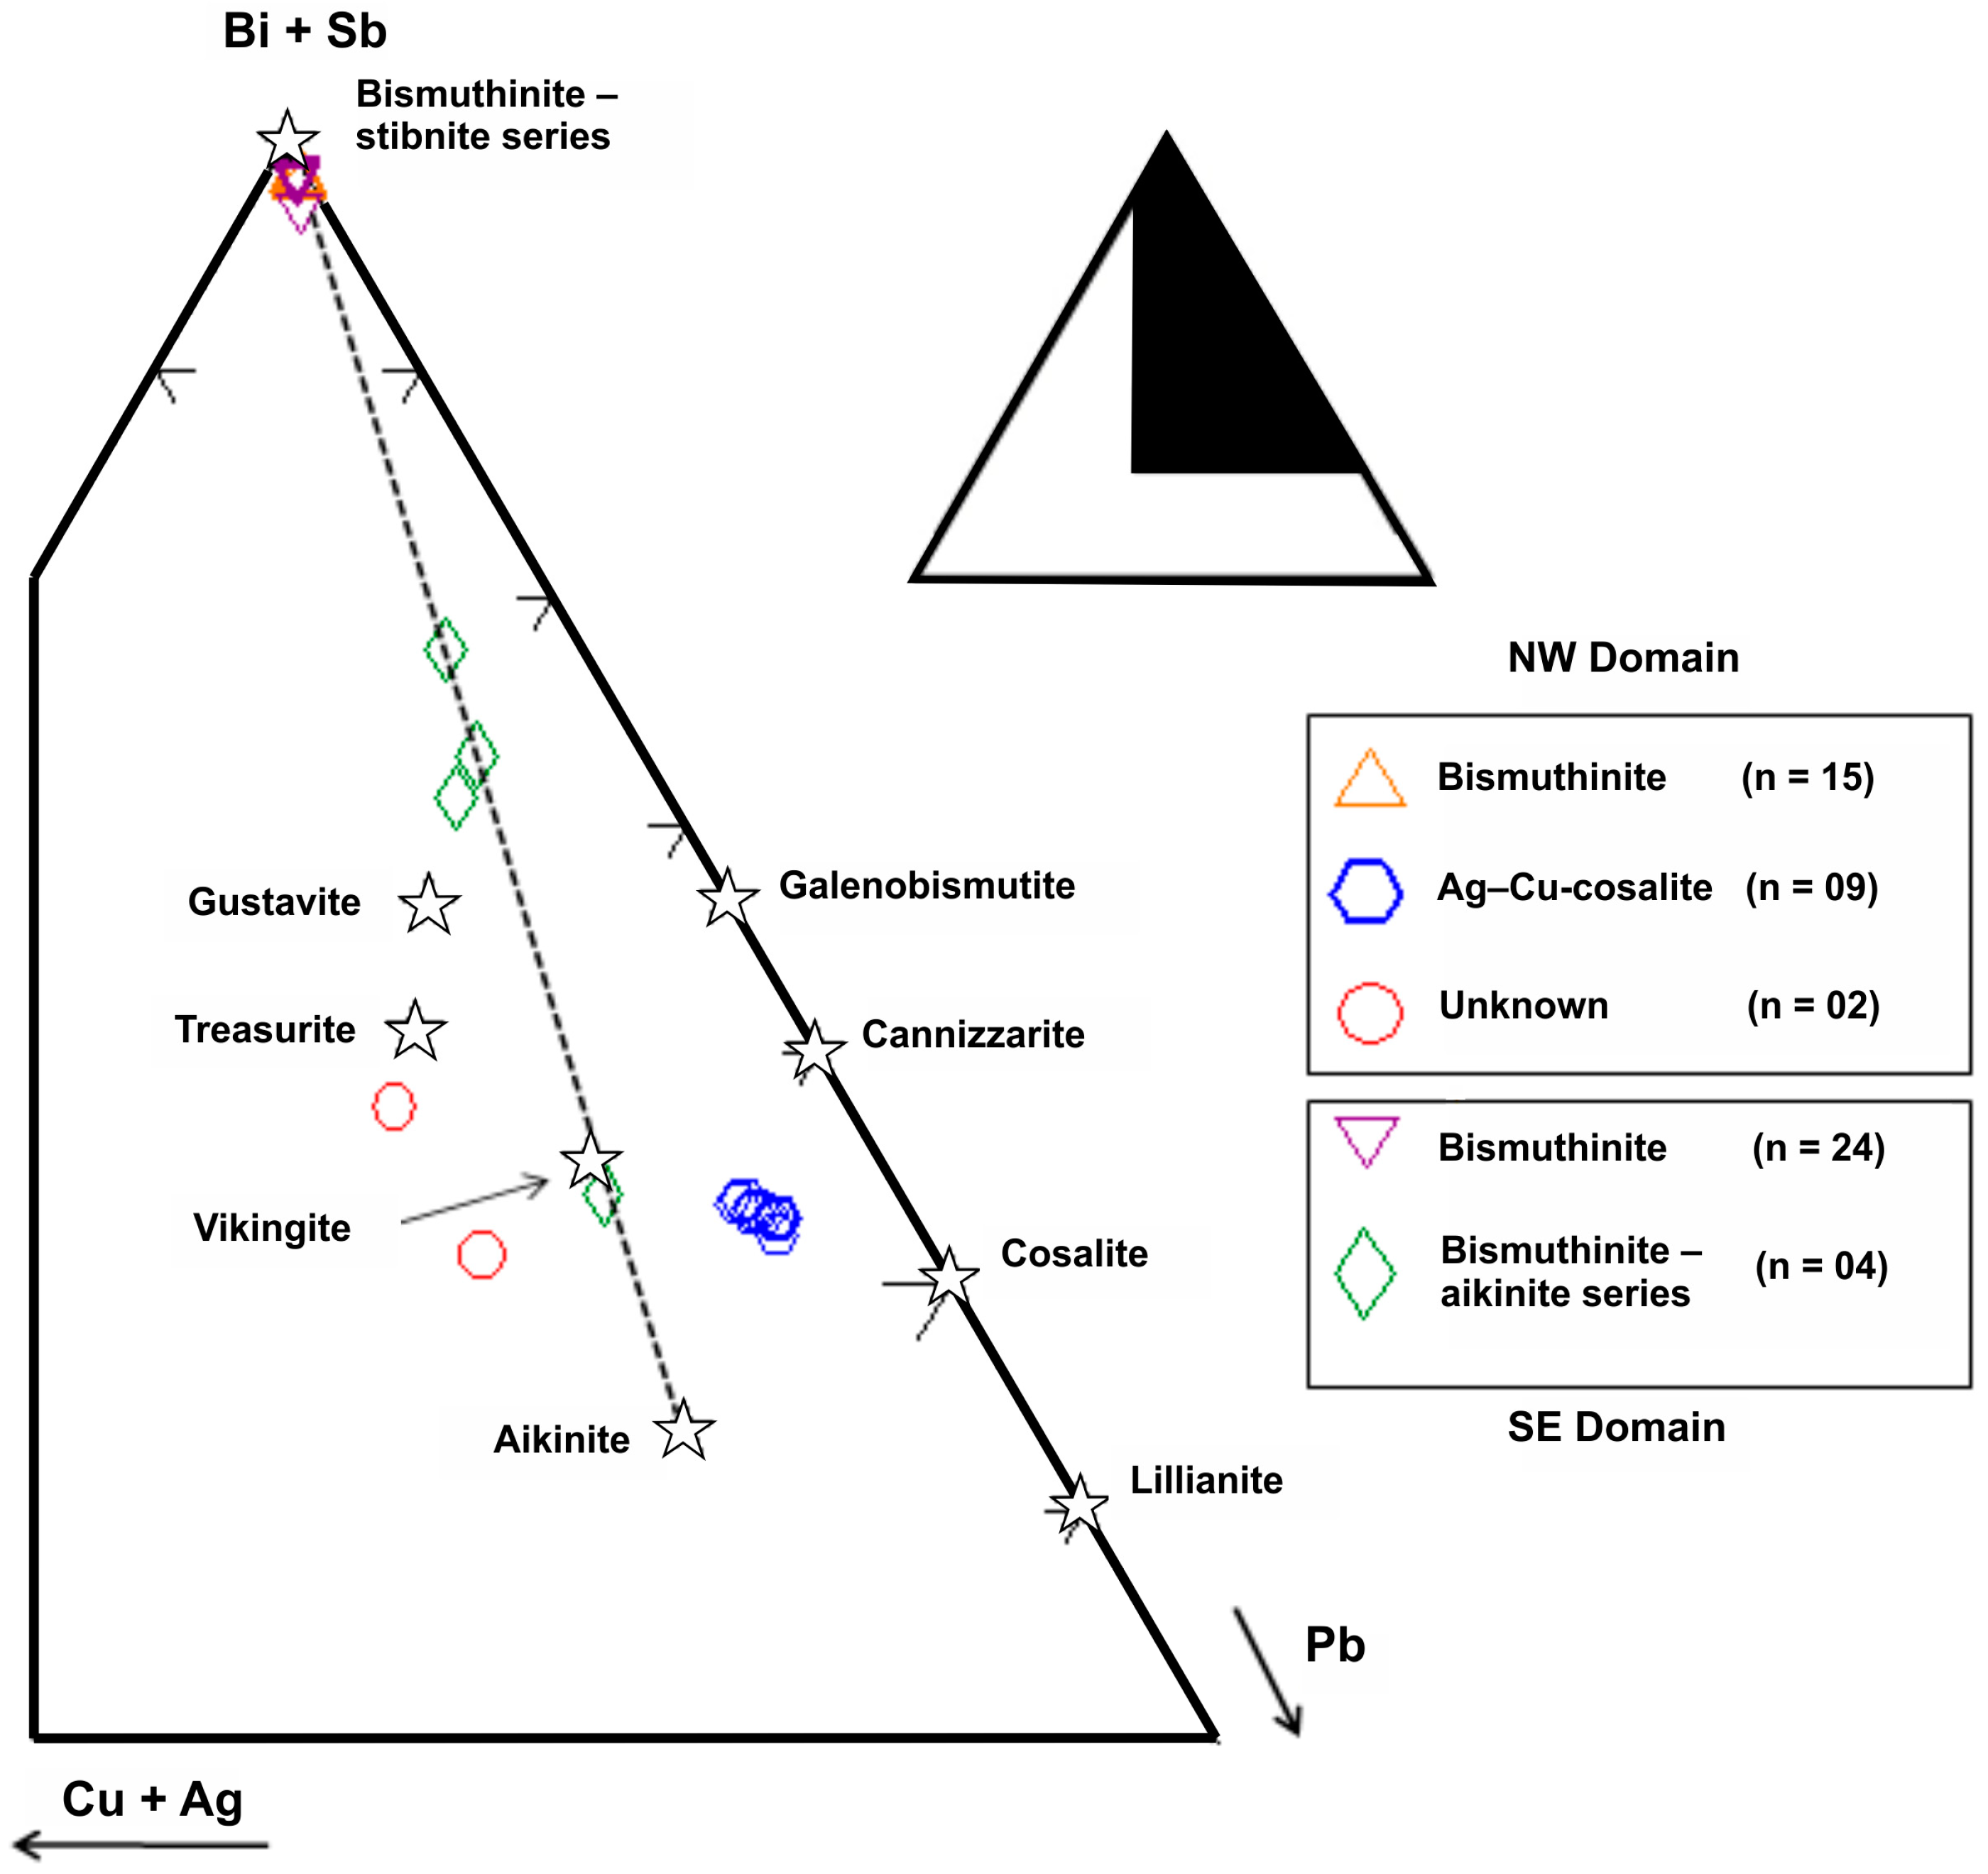
Figure 6.
Bismuth-bearing sulfides and sulfosalts plotted on a (Cu + Ag)–(Bi + Sb)–Pb ternary diagram. Major chemical compositions are based on EMP analyses collected from two samples selected from opposite domains of the breccia complex: 29–2010 (NW) and 15–2010 (SE). Abbreviation: n = number of analyses.
Bismuthinite and cosalite are the two major Bi-mineral species identified from the 26 EMP and LA-ICP-MS spots analyzed in the NW domain. Fifteen out of the twenty-six analyses correspond to bismuthinite. Its average chemical composition is listed in Table 1 and can be expressed as Bi1.981Sb0.040Pb0.025Cu0.028Ag0.001(S2.986Se0.012Te0.002). No apparent chemical variations within the bismuthinite–aikinite solid solution series were detected. Silver telluride inclusions are regularly spread in bismuthinite crystals and can be detected using BSE imagery, and Ag and Te spiky signals in LA-ICP-MS profiles (e.g., Figure 7a). Cosalite was detected from nine analyses along the twenty-six-spot-profile. Its average chemical formula can be expressed as Pb1.663Cu0.326Ag0.240Bi2.057Sb0.092(S4.976Se0.013Te0.011) based on Table 1. The term ‘argentocuprocosalite’ can be applied here to refer to Ag- + Cu-bearing cosalite, to explain the shift away from pure end-member cosalite as plotted on Figure 6. No silver telluride inclusion was detected in cosalite in BSE images or in the flat signal of both Ag and Te in LA-ICP-MS profiles (e.g., Figure 7b). The two remaining analyses from the NW domain sample revealed two unknown species (Table 1; Figure 6).
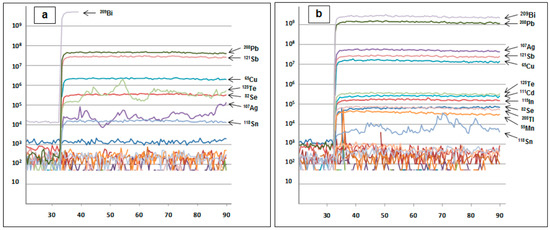
Figure 7.
LA-ICP-MS spectra of bismuthinite and cosalite from the NW domain. (a) Major and trace elements hosted in the bismuthinite lattice exhibit a flat and smooth LA signal, whereas the Te signal is spiky and mimics the Ag signal as both elements are hosted in tetradymite inclusions. (b) Pure cosalite’s LA-ICP-MS spectrum with no silver telluride inclusions.
Two mineral phases were found commonly from the 35 EMP and LA-ICP-MS spots analyzed in the SE domain. Twenty-four analyses yielded bismuthinite, with no apparent chemical variations in the bismuthinite–aikinite solid solution series (Table 1; Figure 6). Its average major chemical composition can be expressed as Bi2.023Sb0.024Pb0.022Cu0.026Ag0.001(S2.972Se0.015Te0.012). Seven out of thirty-five EMPA analyses correspond to tetradymite inclusions, which are easily detected by means of BSE imagery and consistent Te and Bi spikes in bismuthinite LA-ICP-MS profiles. Tetradymite’s average chemical composition is listed in Table 1 and can be expressed as Bi2.037Sb0.016Pb0.001Cu0.009Ag0.011(Te1.876S1.096Se0.028). The remaining four EMP and LA-ICP-MS spots were four different members of the bismuthinite–aikinite solid solution series: (1) Friedrichite Pb4.802Cu4.939Ag0.032Bi7.166Sb0.305(S17.961Se0.026Te0.013); (2) two species between the krupkaite–paarite members with the following chemical composition: Pb0.911Cu1.135Ag0.013Bi3.094Sb0.012(S5.969Se0.025Te0.006), and Pb0.891Cu0.894Ag0Bi3.121Sb0.045(S5.975Se0.019Te0.006); and (3) a mineral phase between the salzburgite–gladite members, Pb1.482Cu1.475Ag0Bi6.624Sb0.096(S11.945Se0.047Te0.008).
4. Discussion
4.1. Physicochemical Conditions during Bi Ore Deposition
Many physicochemical variables are fundamental to hydrothermal ore transport and deposition; they include temperature, pressure, salinity, acidity/alkalinity, redox, concentrations of sulfur species, and activities of metal species (e.g., Cooke et al., 1996 [25]). Changes in any of these variables can trigger ore deposition. The purpose of this section is to discuss the thermochemical environment during bismuth ore deposition at San Francisco de los Andes, and to constrain fluid physicochemical conditions based on observed bismuth minerals and co-existing minor phases.
4.1.1. Temperature and Pressure
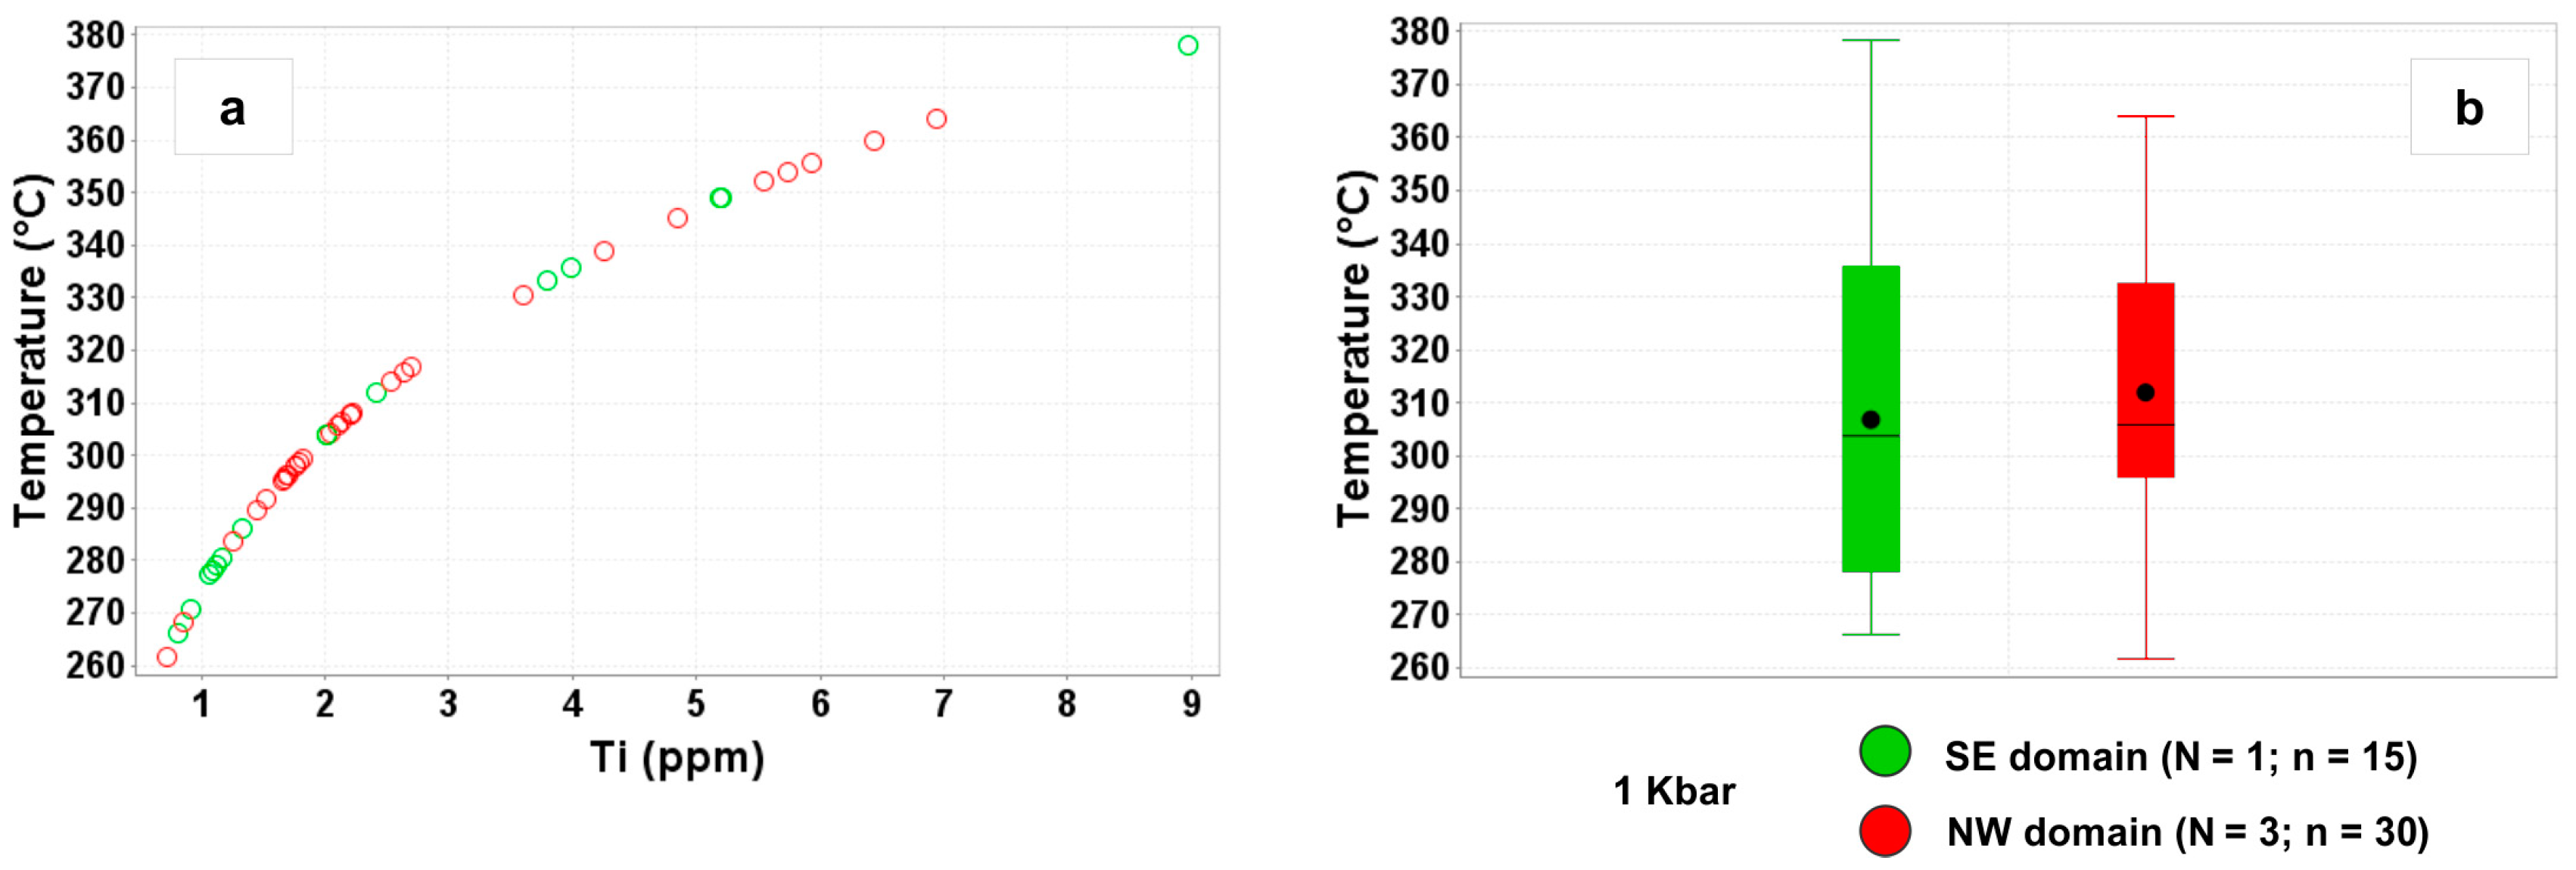
Hydrothermal quartz that cemented the breccias before ore deposition provides an opportunity to constrain temperature and pressure conditions at San Francisco de los Andes. Titanium-in-quartz (TitaniQ) temperatures based on the Thomas et al. (2010) [26] geothermobarometer, calculated for pressure of 1 kbar yielded a temperature ranges of 262–378 °C ([2]; Figure 8). The presence of rutile as an equilibrium phase in the system indicated TiO2 saturation and allowed Ti activity to be fixed at 1. Titanium-in-quartz geothermobarometry yielded similar T ranges for hydrothermal quartz in the SE domain (i.e., T = 266–378 °C; 1 kbar) and NW domain (i.e., T = 262–364 °C; 1 kbar) of the breccia complex (Figure 8). The lowest limit is based on Ti concentration very close to the detection limit (0.72 ppm; Figure 8a). As seen on the paragenetic diagram in Figure 3, stages SE-a and NW-a quartz are temporally related but earlier than Bi mineralization, which suggests the interval 262–378 °C is the maximum temperature for ore precipitation.

Figure 8.
Titanium-in-quartz temperature calculated at 1 kbars after Thomas et al. (2010) [26]. (a) Binary plots of Ti contents versus calculated TitaniQ temperatures in quartz from stages SE-a and NW-a. (b) Box-and-whisker plot of Ti contents in quartz from stages SE-a and NW-a. Abbreviations: N = number of samples, n = number of analyses.
If fluid/rock ratios are low, minor and trace element contents in minerals can be largely controlled by host rock composition; whereas at high fluid/rock ratios, it is mainly controlled by the composition of hydrothermal fluids. Conduits such as breccia pipes or dikes are a preferred pathway with high fluid fluxes where only minor wall rock interaction occurs; thus it is safe to assume Ti contents in quartz are temperature dependent, where its concentration systematically increases with increasing temperature (e.g., Thomas et al., 2010; Wark and Watson, 2006 [26,27]; Figure 8).
Little has been published on the conditions of formation of the San Francisco de los Andes deposit. The only temperatures based on fluid inclusions were reported by Cardo et al. (2008) [3]. They documented an average homogenization temperature of 228 °C for two-phase, liquid-rich inclusions, and temperatures between 286 and 299 °C for three-phase (liquid + vapor + halite) inclusions hosted in quartz. These homogenization temperatures are comparable with those from hydrothermal quartz in magmatic-hydrothermal tourmaline breccias at Rio Blanco-Los Bronces, Chile [2]. Particularly, in the Sur-Sur breccia, measured homogenization temperature for type ia (two-phase, liquid-rich fluid inclusions) and type iia (three-phases, salt saturated, halite-bearing fluid inclusions) in quartz, range between less than 200 °C and more than 400 °C [28].
Fluid inclusion microthermometry yields a set of homogenization temperatures that provide minimum temperatures of entrapment of a fluid in a mineral. These data are collected in a laboratory under atmospheric pressure, thus pressure corrections should be considered to obtain the real temperatures of entrapment. The temperature of formation of hydrothermal quartz from the San Francisco de los Andes breccia complex can be calculated at 1 kbar based on homogenization temperatures, and ice melting or halite dissolution temperatures provided by Cardo et al. (2008) [3]. Two-phase, liquid-rich fluid inclusions yielded homogenization temperatures between 227 and 229 °C, melting temperature of ice of −10.6 °C (i.e., 14.57% NaCl equivalent) and temperatures of entrapment or formation between 287 and 289 °C. Three-phase (liquid + vapor + halite) fluid inclusions yielded homogenization temperatures between 286 and 299 °C, total homogenization due to dissolution of halite between 367 and 388 °C (i.e., 44.73% and 46.75% NaCl eq.), and temperatures of formation between 359 and 376 °C [29,30]. The estimated temperatures of formation of fluid inclusions in quartz for the pressure prevailing at the time of entrapment were consistent with, and fall in the TitaniQ temperature range under 1 kbar estimated by Testa (2017) [2].
The pressure value of 1 kbar is similar to the conditions of formation of other magmatic-hydrothermal breccia in the Andes, such as Donoso at the Rio Blanco-Los Bronces district (e.g., Skewes et al., 2003 [31]). A previous fluid inclusion study showed that different magmatic fluids were involved in formation of the Donoso breccia: magmatic-hydrothermal fluids cooling under relatively high (>1 kbar) lithostatic pressure (consistent with geologic constraints), and magmatic-hydrothermal fluids cooling at hydrostatic pressure conditions [31]. Both fluids occurred intermittently, as pressure fluctuated between lithostatic and hydrostatic conditions due to sealing and rebrecciation episodes [31].
4.1.2. Phase Separation: Vapor-Rich Phase and Dense Brine Phase
The existence of a vapor-rich phase derived from magmatic-hydrothermal fluids can be inferred from fluid inclusion studies of hydrothermal quartz from San Francisco de los Andes. Testa (2017) [2] documented four types of fluid inclusions in stages SE-a and NW-a quartz from San Francisco de los Andes (Figure 9). He recorded the coexistence of primary type ia (two-phase, liquid-rich) and type ib (two-phase, vapor-rich) fluid inclusions (Figure 9), which traditionally implies boiling. No evidence of leakage, necking or post-entrapment deformation was observed based on detailed petrographic analysis of fluid inclusions. None of these processes have been documented, thus the coexistence of type ia and type ib fluid inclusions cannot be explained by disruption of the original liquid–vapor proportion in individual fluid inclusions. The coexistence of primary type ia and ib fluid inclusions is therefore interpreted to be the product of phase separation, which probably produced a vapor phase and a dense liquid phase during brecciation.
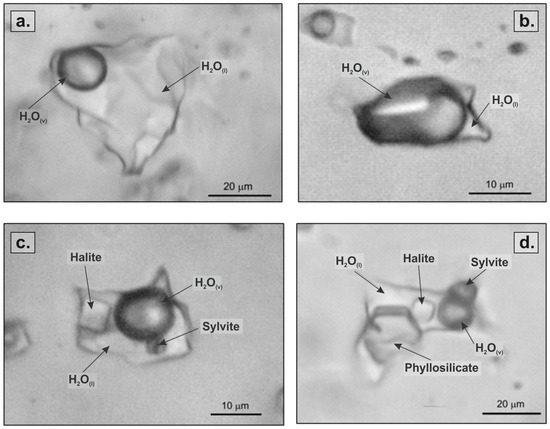
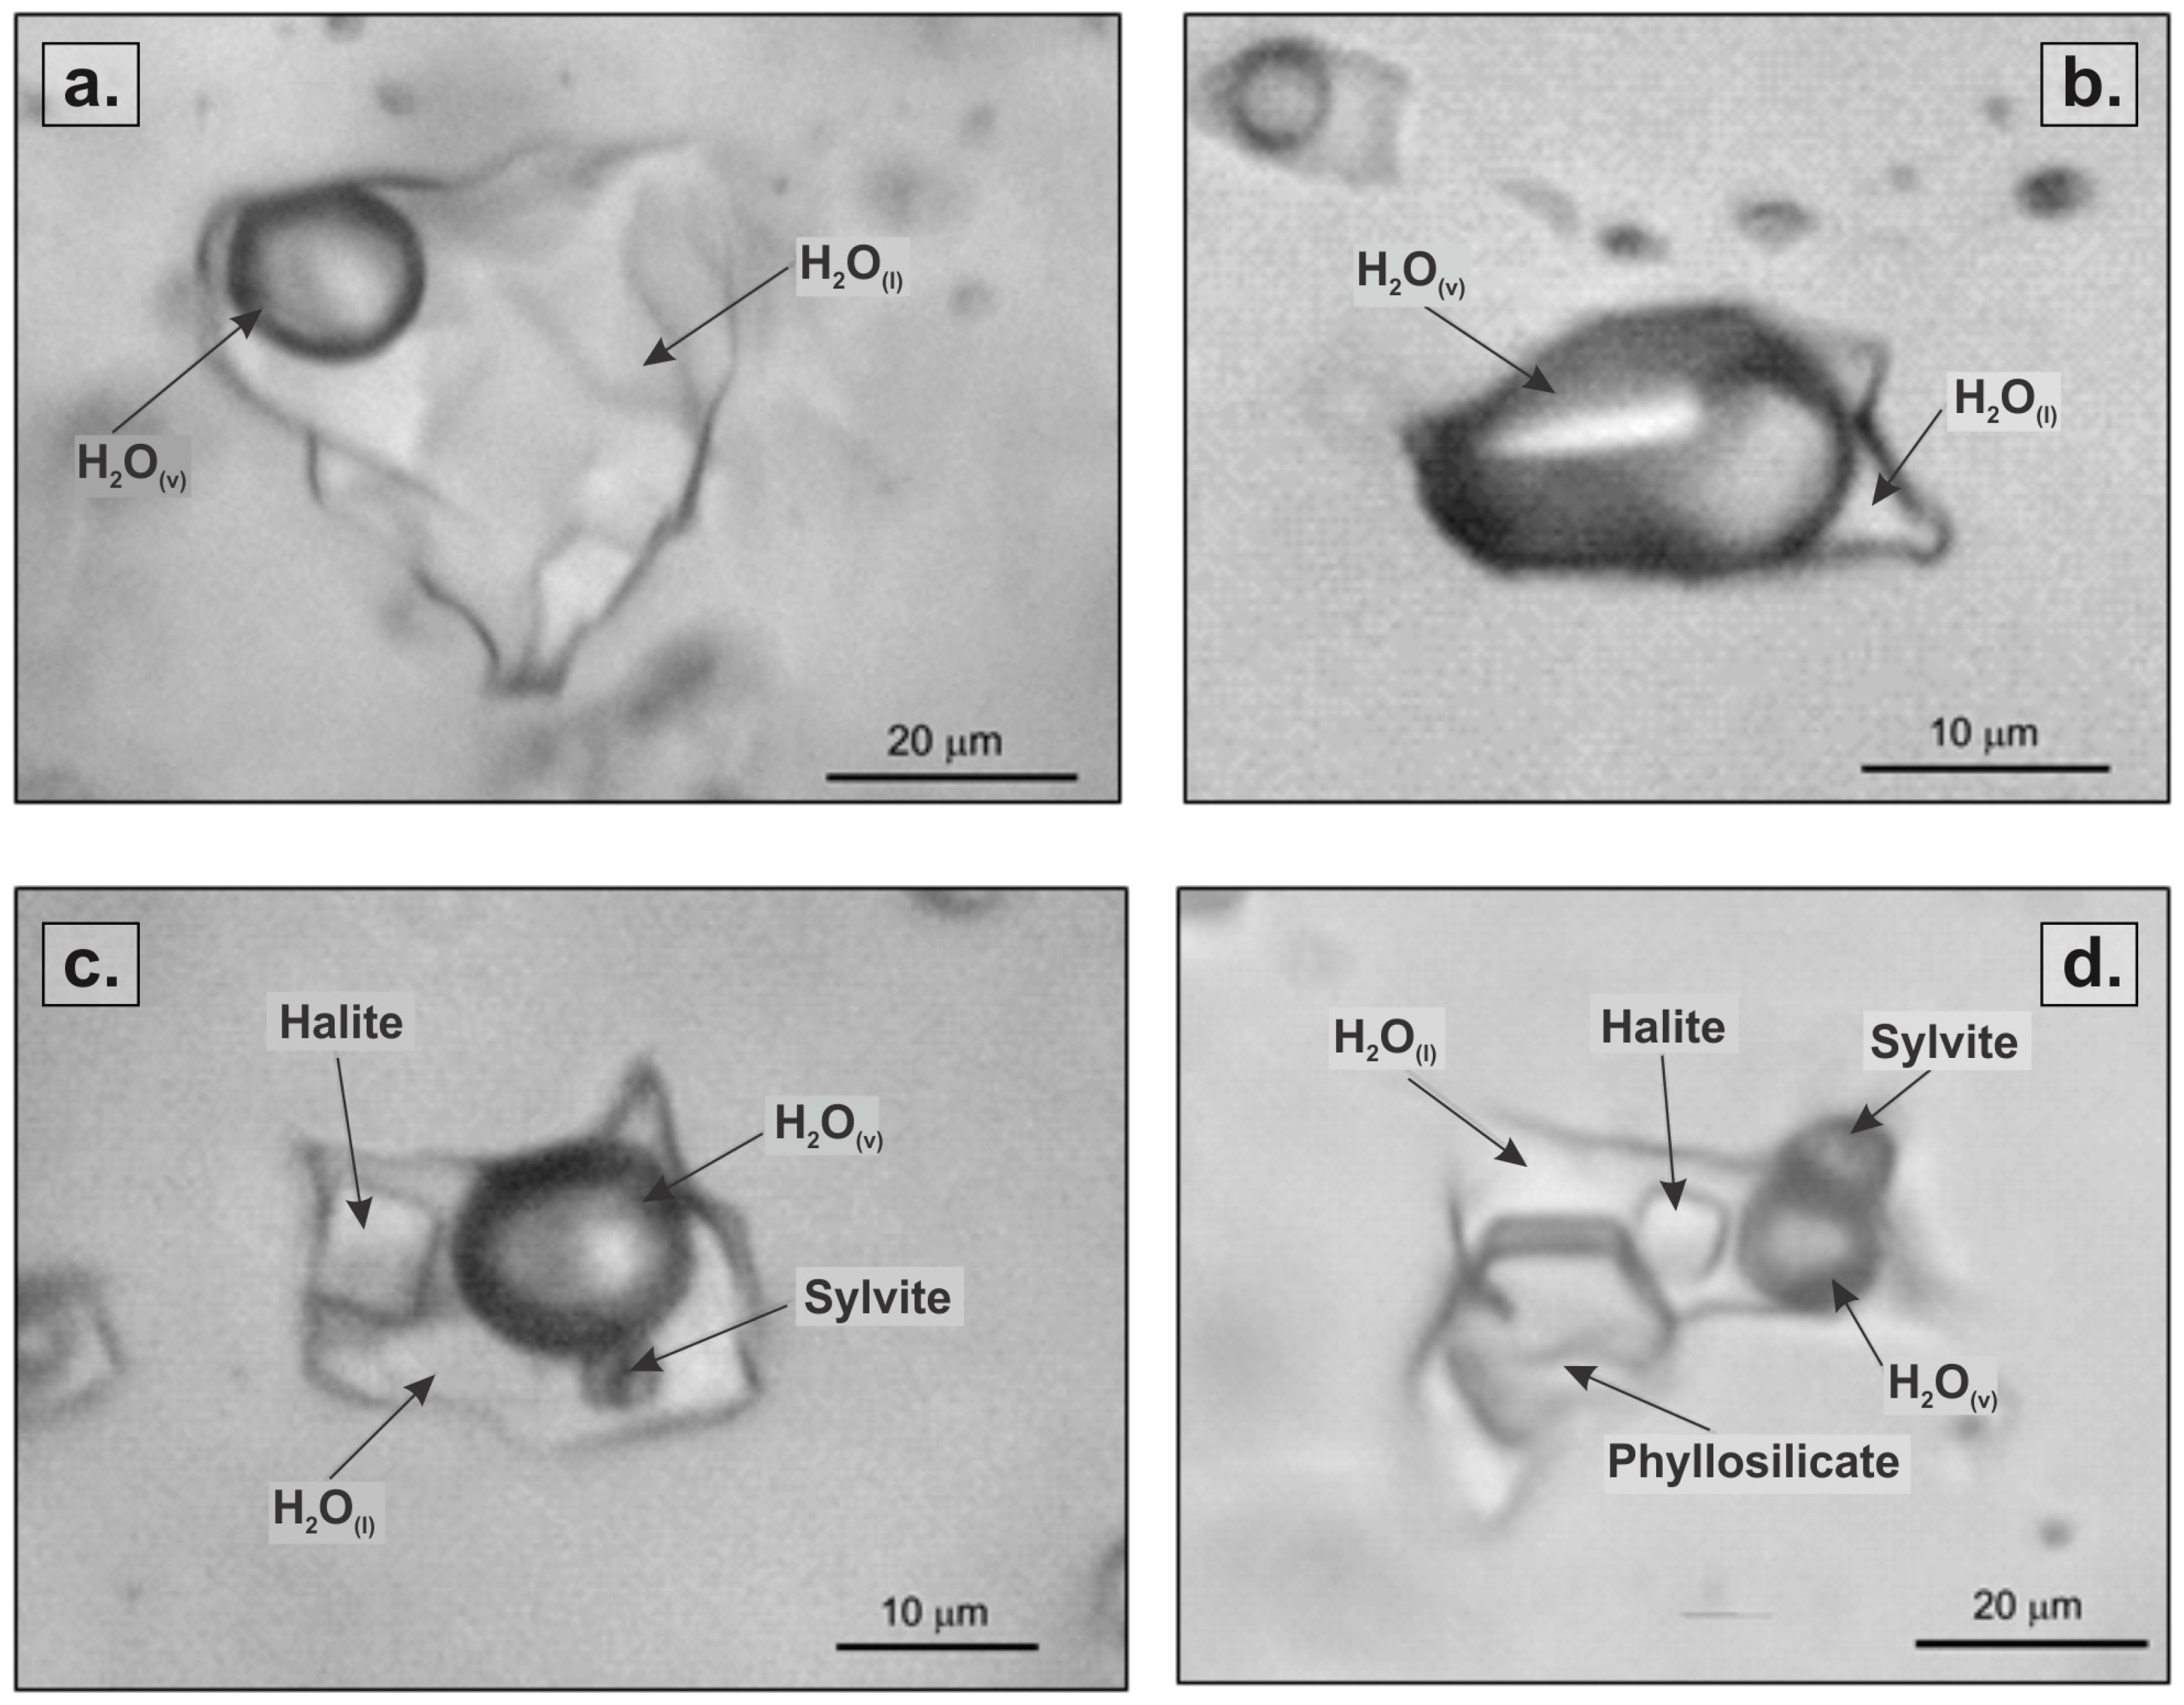
Figure 9.
Four types of fluid inclusions hosted in stage SE-a and NW-a quartz from the San Francisco de los Andes Breccia complex. (a) Type ia are two-phase, liquid-rich fluid inclusions. (b) Type ib are two-phase, vapor-rich fluid inclusions. (c) Type iia are four-phase, halite–sylvite-bearing fluid inclusions. (d) Type iib are polyphase, halite–sylvite–phyllosilicate-bearing fluid inclusions.
As previously discussed, salinities of 14.57% and 44.73–46.75% NaCl eq. were documented in two-phase and three-phase fluid inclusions, respectively [3]. Testa (2017) [2] documented type iia (four-phase, salt saturated, halite–sylvite-bearing) fluid inclusions and type iib (polyphase, salt saturated, halite–sylvite–mica?-bearing) fluid inclusions from San Francisco de los Andes (Figure 9). Although no microthermometric analyses were conducted, based on the coexistence of large halite (cubic crystals with sharp corners), sylvite (cubic crystals with rounded edges), and unspecified mica (hexagonal sheet-like crystals) in fluid inclusions, salinities above 45 wt % NaCl equivalent are considered likely (Figure 9). Type iia and iib fluid inclusions indicate salinities higher than those reported by Cardo et al. (2008) [3], and evidence that hydrothermal fluids trapped probably contained salts other than NaCl (e.g., KCl, CaCl2, and MgCl2). The elevated salinities in these fluid inclusions were interpreted as evidence of the coexistence of a brine-phase. Stages SE-a and NW-a quartz formed before ore deposition. A deep-seated brine is believed to be the main ore-forming fluid responsible for stage SE-b and NW-b mineralization.
Some of the phase boundaries between liquid and vapor in fluid inclusions hosted in quartz from San Francisco de los Andes appear thick or show apparent concentric patterns (e.g., Figure 9d). These features are artifacts produced by microphotography; no petrographic evidence of non-condensable gas species, such as CO2, was reported in fluid inclusions by Cardo et al. (2008) [3] or Testa (2017) [2]. Furthermore, no hypogene, C-bearing mineral phases (e.g., carbonates) have been documented from San Francisco de los Andes. The CO2(g) contents of the ore-forming hydrothermal fluids were therefore considered to be significantly lower than 4.4 wt % CO2, the minimum concentration required to observe visible CO2 in fluid inclusions at room temperature [32].
4.1.3. Acidity/Alkalinity
pH values are not always simple to determine and their significance is questionable as the pH of neutral fluids varies with temperature, salinity, etc. pH decreases with increase in temperature, which does not imply that a fluid becomes more acidic at higher temperatures. By definition, a solution is acidic if there is an excess of hydrogen ions over hydroxide ions. At high temperature, pure water is still neutral as the concentration of hydrogen ions is the same as hydroxide ions but pH values are <7. For this reason in this section we prefer to discuss whether fluids were acidic or alkaline, rather than pH values.
The acidity/alkalinity of ore-forming fluids at San Francisco de los Andes can be inferred based on hydrothermal alteration assemblages in the sedimentary host rocks and breccia clasts. Sericite–quartz–tourmaline is the characteristic hydrothermal alteration assemblage adjacent to the breccia complex, whereas epidote–chlorite ± calcite veins are commonly observed distal to the deposit [2]. Based on the presence of illite–quartz, the mineralizing solutions must have been weakly to moderately acidic, evolving outwards from the breccia complex to near-neutral or alkaline conditions by water–rock interaction (epidote–chlorite ± calcite stable; e.g., Cooke et al., 1996; Corbett, and Leach, 1998 [25,33]). The stability of mineral phases in the phyllic alteration assemblage can be constrained as a function of temperature and K+ and H+ activities (i.e., <500 °C and intermediate log (aK+/aH+) values), with decreasing H+ metasomatism associated with the propylitic assemblage [34,35,36,37,38]. The absence of potassic alteration associated with the breccia complex indicates that high temperature, alkaline conditions were not attained at the level of exposure of the breccia complex (i.e., K-feldspar stable; >500 °C and high log (aK+/aH+); [34,35,36,37,38]). A potassic-altered root is predicted to occur below the current level of exposure, based on comparisons with other well-drilled tourmaline breccia complexes (e.g., Sur-Sur; [28]). The lack of diagnostic minerals characteristic of advanced argillic alteration (e.g., alunite, kaolinite, dickite, pyrophyllite) provides evidence that hydrothermal fluids at the level exposed were only weakly acidic (i.e., moderate log (aK+/aH+); [36,37]), preventing formation of hypogene clay minerals; they may have occurred at higher elevations but, if they did, they have been removed by erosion. Scarce clay minerals from intermediate argillic alteration assemblage were locally documented; both chlorite and illite imply weakly acidic conditions of alteration.
4.1.4. Redox Conditions
Magmatic-hydrothermal breccias from the Rio Blanco-Los Bronces district have similarities to the San Francisco de los Andes breccia complex (e.g., pyrite and Cu-sulfide cement), but are different in that oxidized phases (i.e., anhydrite and specularite) were formed at distinctive stages in the Donoso, Sur-Sur, and La Americana magmatic-hydrothermal breccias [2,28,31]. The precipitation of anhydrite during late-stage fluid evolution was interpreted to indicate that hydrothermal fluids evolved to higher oxygen fugacity (i.e., sulfate-stable), and/or higher aCa2+ [28]. The presence of specularite at Rio Blanco-Los Bronces was also consistent with higher oxygen fugacity conditions [28]. At San Francisco de los Andes, the abundance of hypogene sulfide and sulfosalt phases, coupled with an absence of hypogene oxides, sulfates, carbonates or arsenates implies consistently reduced conditions (i.e., H2S-predominant) and high sulfur fugacities during ore transport and deposition.
4.2. Fluid Evolution and Metal Transport: S and Te Fugacities
Titanium-in-quartz geothermobarometry from San Francisco de los Andes has constrained a temperature range of 262–378 °C at 1 kbar. This temperature probably prevailed during ore deposition. The proposed P–T ranges are comparable with previous studies of fluid inclusions in quartz from magmatic-hydrothermal breccia complexes [3,28,31]. Based on these data and detailed mineralogical observations, two fTe2 vs. fS2 diagrams were calculated (Figure 10).
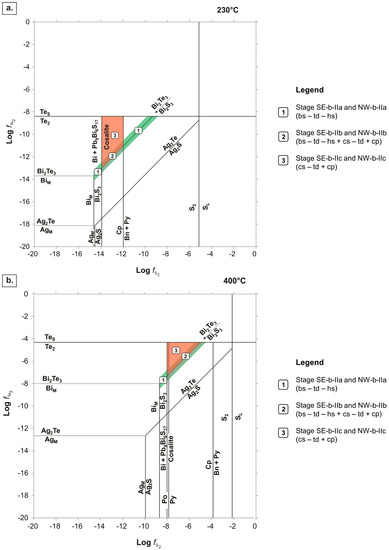
Figure 10.
fS2 vs fTe2 diagrams calculated at 230 °C (a), and 400 °C (b), at 1 kbar pressure. The pyrrhotite–pyrite (po–py) monovariant line was plotted at the higher temperature, but not at 230 °C, as it falls in the stability field of BiM. Model abbreviations: Cp = chalcopyrite, Bn = bornite, Py = pyrite, Po = pyrrhotite, L = liquid, S = solid, and M = metallic. Legend abbreviations: bs = bismuthinite, cs = cosalite, cp = chalcopyrite, td = tetradymite, hs = hessite.
Thermodynamic models for selected bismuth sulfides, sulfosalts, and tellurides have been proposed for different mineralizing systems, such as orogenic and epithermal deposits (e.g., Cooke et al., 1996; Voicu et al., 1999; Cook and Ciobanu, 2004; Voudouris, 2006 [25,39,40,41]). Thermodynamic modelling of the San Francisco de los Andes magmatic-hydrothermal breccia complex has been undertaken by assuming a minimum temperature of 230 °C, and a maximum temperature of 400 °C at a constant pressure of 1 kbar. Key mineralogical assemblages in stages SE-b-II and NW-b-II are Bi- and Cu-bearing sulfides and sulfosalts that co-precipitated with tellurides and tellurosulfides, which are used here to constrain both fS2 and fTe2 (Figure 3). The stability fields for Bi sulfides, sulfosalts, tellurosulfides, and co-existing phases have been plotted on fS2–fTe2 diagrams (Figure 10).
For thermodynamic modeling, paragenetic stages SE-b-II and NW-b-II were divided into three sub-stages. The first stage (SE-b-IIa, NW-b-IIa) was the early phase of bismuthinite (bs) deposition (Figure 3 and Figure 10). During the second stage (SE-b-IIb, NW-b-IIb) bismuthinite–cosalite–chalcopyrite (bs–cs–cp) assemblages were precipitated (Figure 3 and Figure 10). During the third stage (SE-b-IIc, NW-b-IIc), the cosalite–chalcopyrite (cs–cp) assemblage precipitated (Figure 3 and Figure 10).
The chemical behavior of tellurium is one of the keys to understanding the evolution of hydrothermal fluids and ore precipitation at San Francisco de los Andes. Bismuth and Ag tellurosulfides/telluride species occur as inclusions in bismuthinite and cosalite in both domains of the breccia complex (Figure 3). The presence of tellurium-bearing phases may be a key indication of ingress of magmatic volatiles during brecciation and mineralization (e.g., Cooke et al., 1996; Cooke and McPhail, 2001 [25,42]).
Tetradymite (Bi2Te2S; td) inclusions are common and are homogeneously distributed in both stage SE-b-II and NW-b-II bismuthinite and cosalite. Hessite (Ag2Te; hs) inclusions are rare; they were only documented in stage SE-b-II and NW-b-II bismuthinite. Tetradymite (Bi2Te2S; td) can form from tellurobismuthite (Bi2Te3) according to the following reaction:
2 Bi2Te3(Tellurobismuthite) + S2(g) ⇄ 2 Bi2Te2S(Tetradymite) + Te2(g)
Tetradymite can therefore precipitate due to either a slight fS2 increase or a subtle fTe2 decrease. The tetradymite stability space is likely to be similar to that of tellurobismuthite (e.g., Cook and Ciobanu, 2006 [40]). The stability field for the bismuthinite (Bi2S3)–tetradymite (Bi2Te2S) assemblage in Figure 10 is defined in part by the chemical reaction:
Bi2S3(Bismuthinite) + 3/2 Te2(g) ⇄ Bi2Te3(Tellurobismuthite) + 3/2 S2(g)
At the minimum temperature of 230 °C, fS2 and fTe2 values for stage SE-b-IIa + NW-b-IIa (bs–td–hs), and stage SE-b-IIb + NW-b-IIb (bs–td–hs + cs–td + cp) are constrained by the equilibrium line defined by the equation log fTe2 = log fS2 + 0.93; between log fS2 values of −14.63 and −9.5 (stage SE-b-IIa + NW-b-IIa) and −13.92 and −11.97 (stage SE-b-IIb + NW-b-IIb; Figure 10a). Stage SE-b-IIc + NW-b-IIc (cs − td + cp) stability field is constrained between the line defined by log fTe2 = log fS2 + 0.93, and log fTe2 = −8.3; and between log fS2 values of −13.92 and −11.97 (Figure 10a).
For the maximum temperature of 400 °C, stages SE-b-IIa + NW-b-IIa, and SE-b-IIb + NW-b-IIb plot along the equilibrium line log fTe2 = log fS2 + 0.68, between log fS2 values of −8.9 and −5 (stage SE-b-IIa + NW-b-IIa), and −8 and −5 (stage SE-b-IIb + NW-b-IIb; Figure 4 and Figure 10b). Stage SE-b-IIc + NW-b-IIc occurs between log fTe2 = log fS2 + 0.68 and log fTe2 = −4.2 for log fS2 values between −8 and −5 (Figure 10b).
The position of the bismuthinite–tellurobismuthite monovariant line does not change significantly in the 230–400 °C range. As a result, the fS2 and fTe2 values for stages SE-b-II and NW-b-II a, b, and c markedly depend on the position of the BiM–Bi2S3, cosalite and cp–(bn + py) monovariant lines and Tes–Te2 equilibrium line (Figure 10). The current model indicates that the stability fields for minerals from the three stages at a given temperature are rather similar, particularly at higher temperatures (Figure 10b).
Tetradymite occurs as inclusions in bismuthinite and cosalite (e.g., Figure 4f,g and Figure 5d). It is inferred to have formed in equilibrium with both the Bi-sulfide and sulfosalt. Conversely, hessite inclusions are only hosted in bismuthinite (e.g., Figure 4f). Bismuthinite has little to no silver in its crystal lattice (Table 1), thus available Ag from hydrothermal fluids has probably bonded with Te to produce the hessite inclusions hosted in bismuthinite. Conversely, cosalite scavenged silver from its surroundings and preferentially partitioned high concentrations of Ag into its crystal structure (Table 1), so pulses of Te-rich fluids could not form hessite inclusions in cosalite. As the hydrothermal fluid evolved, particularly during stages SE-b-IIc and NW-b-IIc, silver concentrations decreased sharply as silver strongly partitioned into cosalite, precluding hessite formation. Tellurium was still available in hydrothermal fluids during stages SE-b-IIc and NW-b-IIc, indicated by the presence of tetradymite inclusions in cosalite (Figure 10). The tetradymite–cosalite assemblage invalidates the possibility of a decrease in fTe2 to explain the lack of hessite inclusions hosted in cosalite (Figure 10).
During stages SE-b-II and NW-b-II, log fS2 and log fTe2 were high (log fS2 = −14.6–−9.5; log fTe2 = −13.7–−8.3; at 230 °C; Figure 10a; and log fS2 = −8.9–−5; log fTe2 = −8–−4.2; at 400 °C; Figure 10b). Hydrothermal fluids must have had elevated bismuth concentrations to stabilize Bi-sulfosalts as high aBi is required to form the bismuthinite–cosalite–tetradymite assemblage. Similarly, the aAg is also interpreted to have been high, based on hessite inclusions hosted in bismuthinite, and silver partitioning into the cosalite structure. Hessite inclusions have not been detected in Ag-rich cosalite, and acanthite has not been documented at San Francisco de los Andes.
At San Francisco de los Andes, formation of bismuth and silver tellurosulfide/telluride inclusions may have been triggered by an increase in tellurium concentrations in the mineralizing fluids (e.g., tellurium-rich magmatic vapor plumes), or less likely, by a slight fS2 decrease. High Te fugacities are interpreted to have been caused by intermittent contributions of magmatic Te2(g) to the mineralizing fluids during stages SE-b-II and NW-b-II. Similar to the mechanism proposed by Cooke et al. (1996) and Cooke and McPhail (2001) [25,42] at Acupan (Philippines), sporadic bursts of Te2(g) and other magmatic volatiles from a deep-seated crystalizing pluton are interpreted to have risen through the breccia column. This process accounts for the local and episodic distribution of tellurosulfide/telluride hosted in Bi sulfides and sulfosalts in the San Francisco de los Andes breccia complex, consistent with a magmatic-hydrothermal origin for the breccia complex. Contemporary viewpoints on the formation of Au and Bi tellurides favor their being magmatically-derived from a Te-rich source (e.g., Cook and Ciobanu, 2006; Cook, 2007 [40,43]). Tellurium is transported either as aqueous or vapor species in hydrothermal fluids, and precipitates as tellurides, triggered by a variety of possible mechanisms (e.g., boiling, mixing, temperature decrease, fluid-rock interaction, etc.; [40,43]). This model explained the formation of most telluride-bearing gold-rich deposits, including epithermal, orogenic, intrusion-related, volcanic-hosted massive sulfide, porphyry Au–(Cu), and skarns [40,43]. Based on literature, the most likely incorporation of tellurium into the breccia column is due to Te-rich magmatic vapor (e.g., Voudouris, 2006; Cooke and McPhail, 2001; Jensen and Barton, 2000 [41,42,44]).
During the very last stage of mineralization in the NW domain at San Francisco de los Andes (i.e., stage NW-b-III), galena and sphalerite are the dominant mineral phases that cement the breccia. The lack of altaite (PbTe), and Pb or Zn-bearing sulfosalts implies low Te2 and S2 fugacities throughout stage NW-b-III. A drastic drop in fS2 and particularly fTe2 is consistent with the proposed mechanism of intermittent incorporation of tellurium via magmatic Te2(g)-rich plumes.
5. Conclusions
Sulfur and tellurium fugacities during Bi-ore precipitation were constrained by key mineral assemblages formed in equilibrium at a constant pressure of 1 kbar and a minimum temperature of 230 °C, and a maximum temperature of 400 °C. Three mineral assemblages characterize the three main Bi mineralizing stages that provide evidence for S2 and Te2 fugacity fluctuations:
- Bismuthinite (with tetradymite–hessite inclusions): This mineral assemblage formed in equilibrium along the bismuthinite–tellurobismuthite monovariant line. This equilibrium line finishes where it meets the stability fields of BiM and TeS at opposite ends (Figure 10).
- Bismuthinite (with tetradymite–hessite inclusions) + cosalite (with tetradymite inclusions) + chalcopyrite: This mineral assemblage formed under much more restricted conditions than the previous assemblage (i.e., bismuthinite–tetradymite–hessite); along the bismuthinite–tellurobismuthite equilibrium line where it is constrained in the stability field where cosalite and chalcopyrite co-precipitate (at 230 °C), and where cosalite and Te2 coexist (at 400 °C; Figure 10).
- Cosalite (with tetradymite inclusions) + chalcopyrite: This mineral assemblage formed in the stability field constrained by the bismuthinite–tellurobismuthite monovariant line, and the equilibrium lines where cosalite, chalcopyrite, and Te2 are stable (at 230 °C; Figure 10). At 400 °C, the stability field for the cosalite–tetradymite–chalcopyrite assemblage was defined in the area limited by the equilibrium line that indicates the co-existence of tellurobismuthite, cosalite and Te2 (Figure 10).
Key findings that have genetic implications for the San Francisco de los Andes breccia complex are:
- High fS2 and fTe2 conditions prevailed during stages SE-b-II and NW-b-II Bi-ore deposition; hydrothermal fluids must have had high aBi and aAg to stabilize Bi-tellurosulfides, sulfosalts, and sulfides, as well as Ag-tellurides and Ag-rich, Bi-sulfosalts.
- Bismuth and Ag telluride/tellurosulfide result from intermittent contributions of magmatic Te2(g) to hydrothermal mineralizing fluids released from the deep-seated crystalizing Tocota Pluton, implying a genetic link between the breccia complex and the underlying magmatic system. Magmatic volatile-rich vapor plumes probably drove fragmentation and buoyantly ascended though the breccia column.
- Abundant galena and sphalerite coupled with the absence of altaite (PbTe) and Pb or Zn-bearing sulfosalts in the NW domain imply lower Te2 and S2 fugacities throughout stage NW-b-III; a drastic drop in fS2 and particularly fTe2 is consistent with intermittent incorporation of Te via magmatic Te2(g)-rich plumes.
Author Contributions
This article represents a joint effort from the team of authors. F.J.T. conceived and designed the study, interpreted the results, and wrote this article. F.J.T. and L.Z. worked together during data acquisition. D.R.C. supervised this work and was involved during interpretation of thermodynamic data; he provided valuable ideas for the discussion, as well as edited the entire manuscript.
Funding
This research was funded by the AMIRA P1060 project and the ARC Research Hub for Transforming the Mining Value Chain (project number IH130200004).
Acknowledgments
The information published in this article is part of Francisco J. Testa’s PhD thesis. The senior author thanks the AMIRA P1060 project, the ARC Research Hub for Transforming the Mining Value Chain (project number IH130200004) and the University of Tasmania—CODES, for providing funding for his PhD thesis. The main author is grateful to CONICET for providing postgrad funding for the early stages of this study. We thank the Central Science Laboratory at the University of Tasmania, the Geology Department at Universidad Nacional del Sur, and the INGEOSUR for allowing the use of their facilities. We gratefully acknowledge the three anonymous reviewers selected by Minerals, and the academic editor who examined the original manuscript; their critical reading and valuable comments greatly improved this article. Last but not least, we would like to express our appreciation to Professor Noel White for his valuable and constructive suggestions during the final revision of this article.
Conflicts of Interest
The authors declare no conflict of interest.
References
- Llambías, E.J.; Malvicini, L. The geology and genesis of the Bi-Cu mineralized breccia-pipe, San Francisco de los Andes, San Juan, Argentina. Econ. Geol. 1969, 64, 271–286. [Google Scholar] [CrossRef]
- Testa, F.J. Geology, Alteration, Mineralization and Geochemistry of Tourmaline Breccia Complexes in the Andes: Rio Blanco-Los Bronces, Chile and San Francisco de Los Andes, Argentina. Ph.D. Thesis, University of Tasmania, Hobart, Australia, 2017. [Google Scholar]
- Cardó, R.; Segal, S.; Korzeniewski, L.I.; Palacio, M.B.; Chernicoff, C. Estudio Metalogenético de brechas hidrotermales portadoras de mineralización de Bi-Au-Cu en el ámbito de Cordillera Frontal, provincia de San Juan. In Serie Contribuciones Técnicas, Recursos Minerales N° 31; Servicio Geológico Minero Argentino; SEGEMAR: Buenos Aires, Argentina, 2008; pp. 2–28. (In Spanish) [Google Scholar]
- Testa, F.J.; Villanueva, C.; Cooke, D.R.; Zhang, L. Lithological and Hydrothermal Alteration Mapping of Epithermal, Porphyry and Tourmaline Breccia Districts in the Argentine Andes Using ASTER Imagery. Remote Sens. 2018, 10, 203. [Google Scholar] [CrossRef]
- Testa, F.; Cooke, D.; Zhang, L.; Mas, G. Bismoclite (BiOCl) in the San Francisco de los Andes Bi–Cu–Au Deposit, Argentina. First Occurrence of a Bismuth Oxychloride in a Magmatic–Hydrothermal Breccia Pipe and Its Usefulness as an Indicator Phase in Mineral Exploration. Minerals 2016, 6, 62. [Google Scholar] [CrossRef]
- Angelelli, V. Yacimientos Metalíferos de la República Argentina; Comisión de Investigaciones Científicas de la Provincia de Buenos Aires: La Plata, Argentina, 1984. (In Spanish) [Google Scholar]
- Lencinas, A.N. Informe sobre Mina San Francisco de los Andes; Compañía Minera Aguilar S.A.: San Juan, Argentina, 1990. (In Spanish) [Google Scholar]
- Bedlivy, D.; Llambías, E.J. Arseniatos de Cu, de Fe, y de Pb de San Francisco de los Andes, Provincia de San Juan, República Argentina. Rev. la Asoc. Geológica Argentina 1969, 24, 29–40. (In Spanish) [Google Scholar]
- Malvicini, L. Luzonita plumbifera de San Francisco de los Andes provincia de San Juan, República Argentina. Rev. la Asoc. Geológica Argentina 1969, 24, 127–131. (In Spanish) [Google Scholar]
- Bedlivy, D.; Llambías, E.J.; Astarloa, J. Rooseveltit von San Francisco de los Andes und Cerro Negro de la Aguadita, San Juan, Argentinien. Tschermaks Miner. Petrogr. Mitt. 1972, 17, 65–75. [Google Scholar] [CrossRef]
- Bedlivy, D.; Mereiter, K. Preisingerite, Bi3O(OH)(AsO4)2, a new species from San Juan Province, Argentina: Its description and crystal structure. Am. Mineral. 1982, 67, 833–840. [Google Scholar]
- Garrels, R.M.; Christ, C.L. Solutions, Minerals, and Equilibria; Harper & Row: New York, NY, USA, 1965. [Google Scholar]
- Meyer, C.; Hemley, J.J. Wall rock alteration. In Geochemistry of Hydrothermal Ore Deposits; Barnes, H.L., Ed.; Holt, Rinehart and Winston, Inc.: New York, NY, USA, 1967; pp. 166–232. [Google Scholar]
- Robie, R.A.; Waldbaum, D.R. Thermodynamic properties of minerals and related substances at 298.15 K (25.0 °C) and one atmosphere (1.013 bars) pressure and at higher temperatures. In US Geological Survey Bulletin 1259; USGS: Washington, DC, USA, 1968; p. 256. [Google Scholar]
- Craig, J.R.; Barton, P.B. Thermochemical approximations for sulfosalts. Econ. Geol. 1973, 68, 493–506. [Google Scholar] [CrossRef]
- Robie, R.; Hemingway, B.; Fisher, J. Thermodynamic properties of minerals and related substances at 298.15 K and 1 bar (105 pascals) pressure and at higher temperatures. In US Geological Survey Bulletin 1452; USGS: Washington, DC, USA, 1978; p. 456. [Google Scholar]
- Barton, P.B.J.; Skinner, B. Sulfide mineral stabilities. In Geochemistry of Hydrothermal Ore Deposits; Barnes, H.L., Ed.; Wiley Intersci.: New York, NY, USA, 1979; pp. 278–403. [Google Scholar]
- Afifi, M.; Kelly, W.C.; Essene, E.J. Phase relations among tellurides, sulfides, and oxides: I. Thermochemical data and calculated equilibria. Econ. Geol. 1988, 83, 377–394. [Google Scholar] [CrossRef]
- Afifi, A.M.; Kelly, W.C.; Essene, E.J. Phase relations among tellurides, sulfides, and oxides: II. Applications to telluride-bearing ore deposits. Econ. Geol. 1988, 83, 395–404. [Google Scholar] [CrossRef]
- Robie, R.A.; Hemingway, B.S. Thermodynamic properties of minerals and related substances at 298.15 K and 1 bar (105 pascals) pressure and at higher temperatures. In US Geological Survey Bulletin 2131; USGS: Washington, DC, USA, 1995; p. 461. [Google Scholar]
- Krauskopf, K.B.; Bird, D.K. Introduction to Geochemistry, 3rd ed.; McGraw-Hill: New York, NY, USA, 1995. [Google Scholar]
- Sillitoe, R.H. Ore-related breccias in volcanoplutonic arcs. Econ. Geol. 1985, 80, 1467–1514. [Google Scholar] [CrossRef]
- Sillitoe, R.H. Porphyry copper systems. Econ. Geol. 2010, 105, 3–41. [Google Scholar] [CrossRef]
- Barton, P.B.; Bethke, P.M. Chalcopyrite disease in sphalerite: Pathology and epidemiology. Am. Mineral. 1987, 72, 451–467. [Google Scholar]
- Cooke, D.R.; McPhail, D.C.; Bloom, M.S. Epithermal gold mineralization Ancupan Banguio district Philippine: Geology, mineralization, alteration and the thermochemical environmenot of ore deposition. Econ. Geol. 1996, 91, 243–272. [Google Scholar] [CrossRef]
- Thomas, J.B.; Watson, E.B.; Spear, F.S.; Shemella, P.T.; Nayak, S.K.; Lanzirotti, A. TitaniQ under pressure: The effect of pressure and temperature on the solubility of Ti in quartz. Contrib. Mineral. Petrol. 2010, 160, 743–759. [Google Scholar] [CrossRef]
- Wark, D.A.; Watson, E.B. The TitaniQ: A Titanium-in-quartz geothermometer. Contrib. Mineral. Petrol. 2006, 152, 743–754. [Google Scholar] [CrossRef]
- Frikken, P.H.; Cooke, D.R.; Walshe, J.L.; Archibald, D.; Skarmeta, J.; Serrano, L.; Vargas, R. Mineralogical and isotopic zonation in the Sur-Sur tourmaline breccia, Río Blanco-Los Bronces Cu-Mo deposit, Chile: Implications for ore genesis. Econ. Geol. 2005, 100, 935–961. [Google Scholar] [CrossRef]
- Bodnar, R. Revised equation and table for determining the freezing point depression of H2O-NaCl solutions. Geochim. Cosmochim. Acta 1993, 57, 683–684. [Google Scholar] [CrossRef]
- Lecumberri-Sanchez, P.; Steele-MacInnis, M.; Bodnar, R. A numerical model to estimate trapping conditions of fluid inclusions that homogenize by halite disappearance. Geochim. Cosmochim. Acta 2012, 92, 14–22. [Google Scholar] [CrossRef]
- Skewes, M.A.; Holmgren, C.; Stern, C.R. The Donoso copper-rich, tourmaline-bearing breccia pipe in central Chile: Petrologic, fluid inclusion and stable isotope evidence for an origin from magmatic fluids. Miner. Depos. 2003, 38, 2–21. [Google Scholar] [CrossRef]
- Roedder, E. Fluid inclusions. Mineral. Soc. Am. 1984, 12, 644. [Google Scholar]
- Corbett, G.J.; Leach, T.M. Southwest Pacific Rim Gold–Copper Systems: Structure, Alteration, and Mineralization; Special Publication 6; Society of Economic Geologists: Littleton, CO, USA, 1998; p. 238. [Google Scholar]
- Burnham, C.W.; Ohmoto, H. Late stage processes of felsic magmatism. Soc. Min. Geol. Japan 1980, 8, 1–11. [Google Scholar]
- Guilbert, J.M.; Park, C.F. The Geology of Ore Deposits; Freeman: New York, NY, USA, 1985. [Google Scholar]
- Sverjensky, D.A.; Hemley, J.J.; D’Angelo, W.M. Thermodynamic assessment of hydrothermal alkali feldspar-mica-aluminosilicate equilibria. Geochim. Cosmochim. Acta 1991, 55, 989–1004. [Google Scholar] [CrossRef]
- Inoue, A. Formation of clay minerals in hydrothermal environments. In Origin and Mineralogy of Clays; Velde, B., Ed.; Springer: Berlin, Germany, 1995; pp. 268–330. [Google Scholar]
- Pirajno, F. Hydrothermal Processes and Mineral Systems; Springer Science & Business Media: Berlin, Germany, 2009. [Google Scholar]
- Voicu, G.; Bardoux, M.; Jébrak, M. Tellurides from the Paleoproterozoic Omai gold deposit, Guiana shield. Can. Mineral. 1999, 37, 559–573. [Google Scholar]
- Cook, N.J.; Ciobanu, C.L. Bismuth tellurides and sulphosalts from the Larga hydrothermal system, Metaliferi Mts, Romania: Paragenesis and genetic significance. Mineral. Mag. 2004, 68, 301–321. [Google Scholar] [CrossRef]
- Voudouris, P. A comparative mineralogical study of Te-rich magmatic-hydrothermal systems in northeastern Greece. Mineral. Petrol. 2006, 87, 241–275. [Google Scholar] [CrossRef]
- Cooke, D.R.; McPhail, D.C. Epithermal Au-Ag-Te mineralization, Acupan, Baguio district, Philippines: Numerical simulations of mineral deposition. Econ. Geol. 2001, 96, 109–131. [Google Scholar]
- Cook, N.J. What makes a gold-telluride deposit? In GSA Denver Annual Meeting, Session No. 72, Abstracts with Programs, v. 39; Geological Society of America: Washington, DC, USA, 2007; p. 196. [Google Scholar]
- Jensen, E.P.; Barton, M.D. Gold deposits related to alkaline magmatism. Rev. Econ. Geol. 2000, 13, 279–314. [Google Scholar]


© 2018 by the authors. Licensee MDPI, Basel, Switzerland. This article is an open access article distributed under the terms and conditions of the Creative Commons Attribution (CC BY) license (http://creativecommons.org/licenses/by/4.0/).