1. Introduction
Contemplation of resource economics is an important desideratum for personnel involved in the resources industry. Resources hold a unique position as being elemental ingredients for final products, rarely sold as consumer produce. Without direct exposure to consumer markets, the trade and production of resources are vicariously affected by consumer demand, negating product marketing. Instead, resource demand follows large macroeconomic demand from consumers as whole markets, and can be accurately captured by a country’s socioeconomic status.
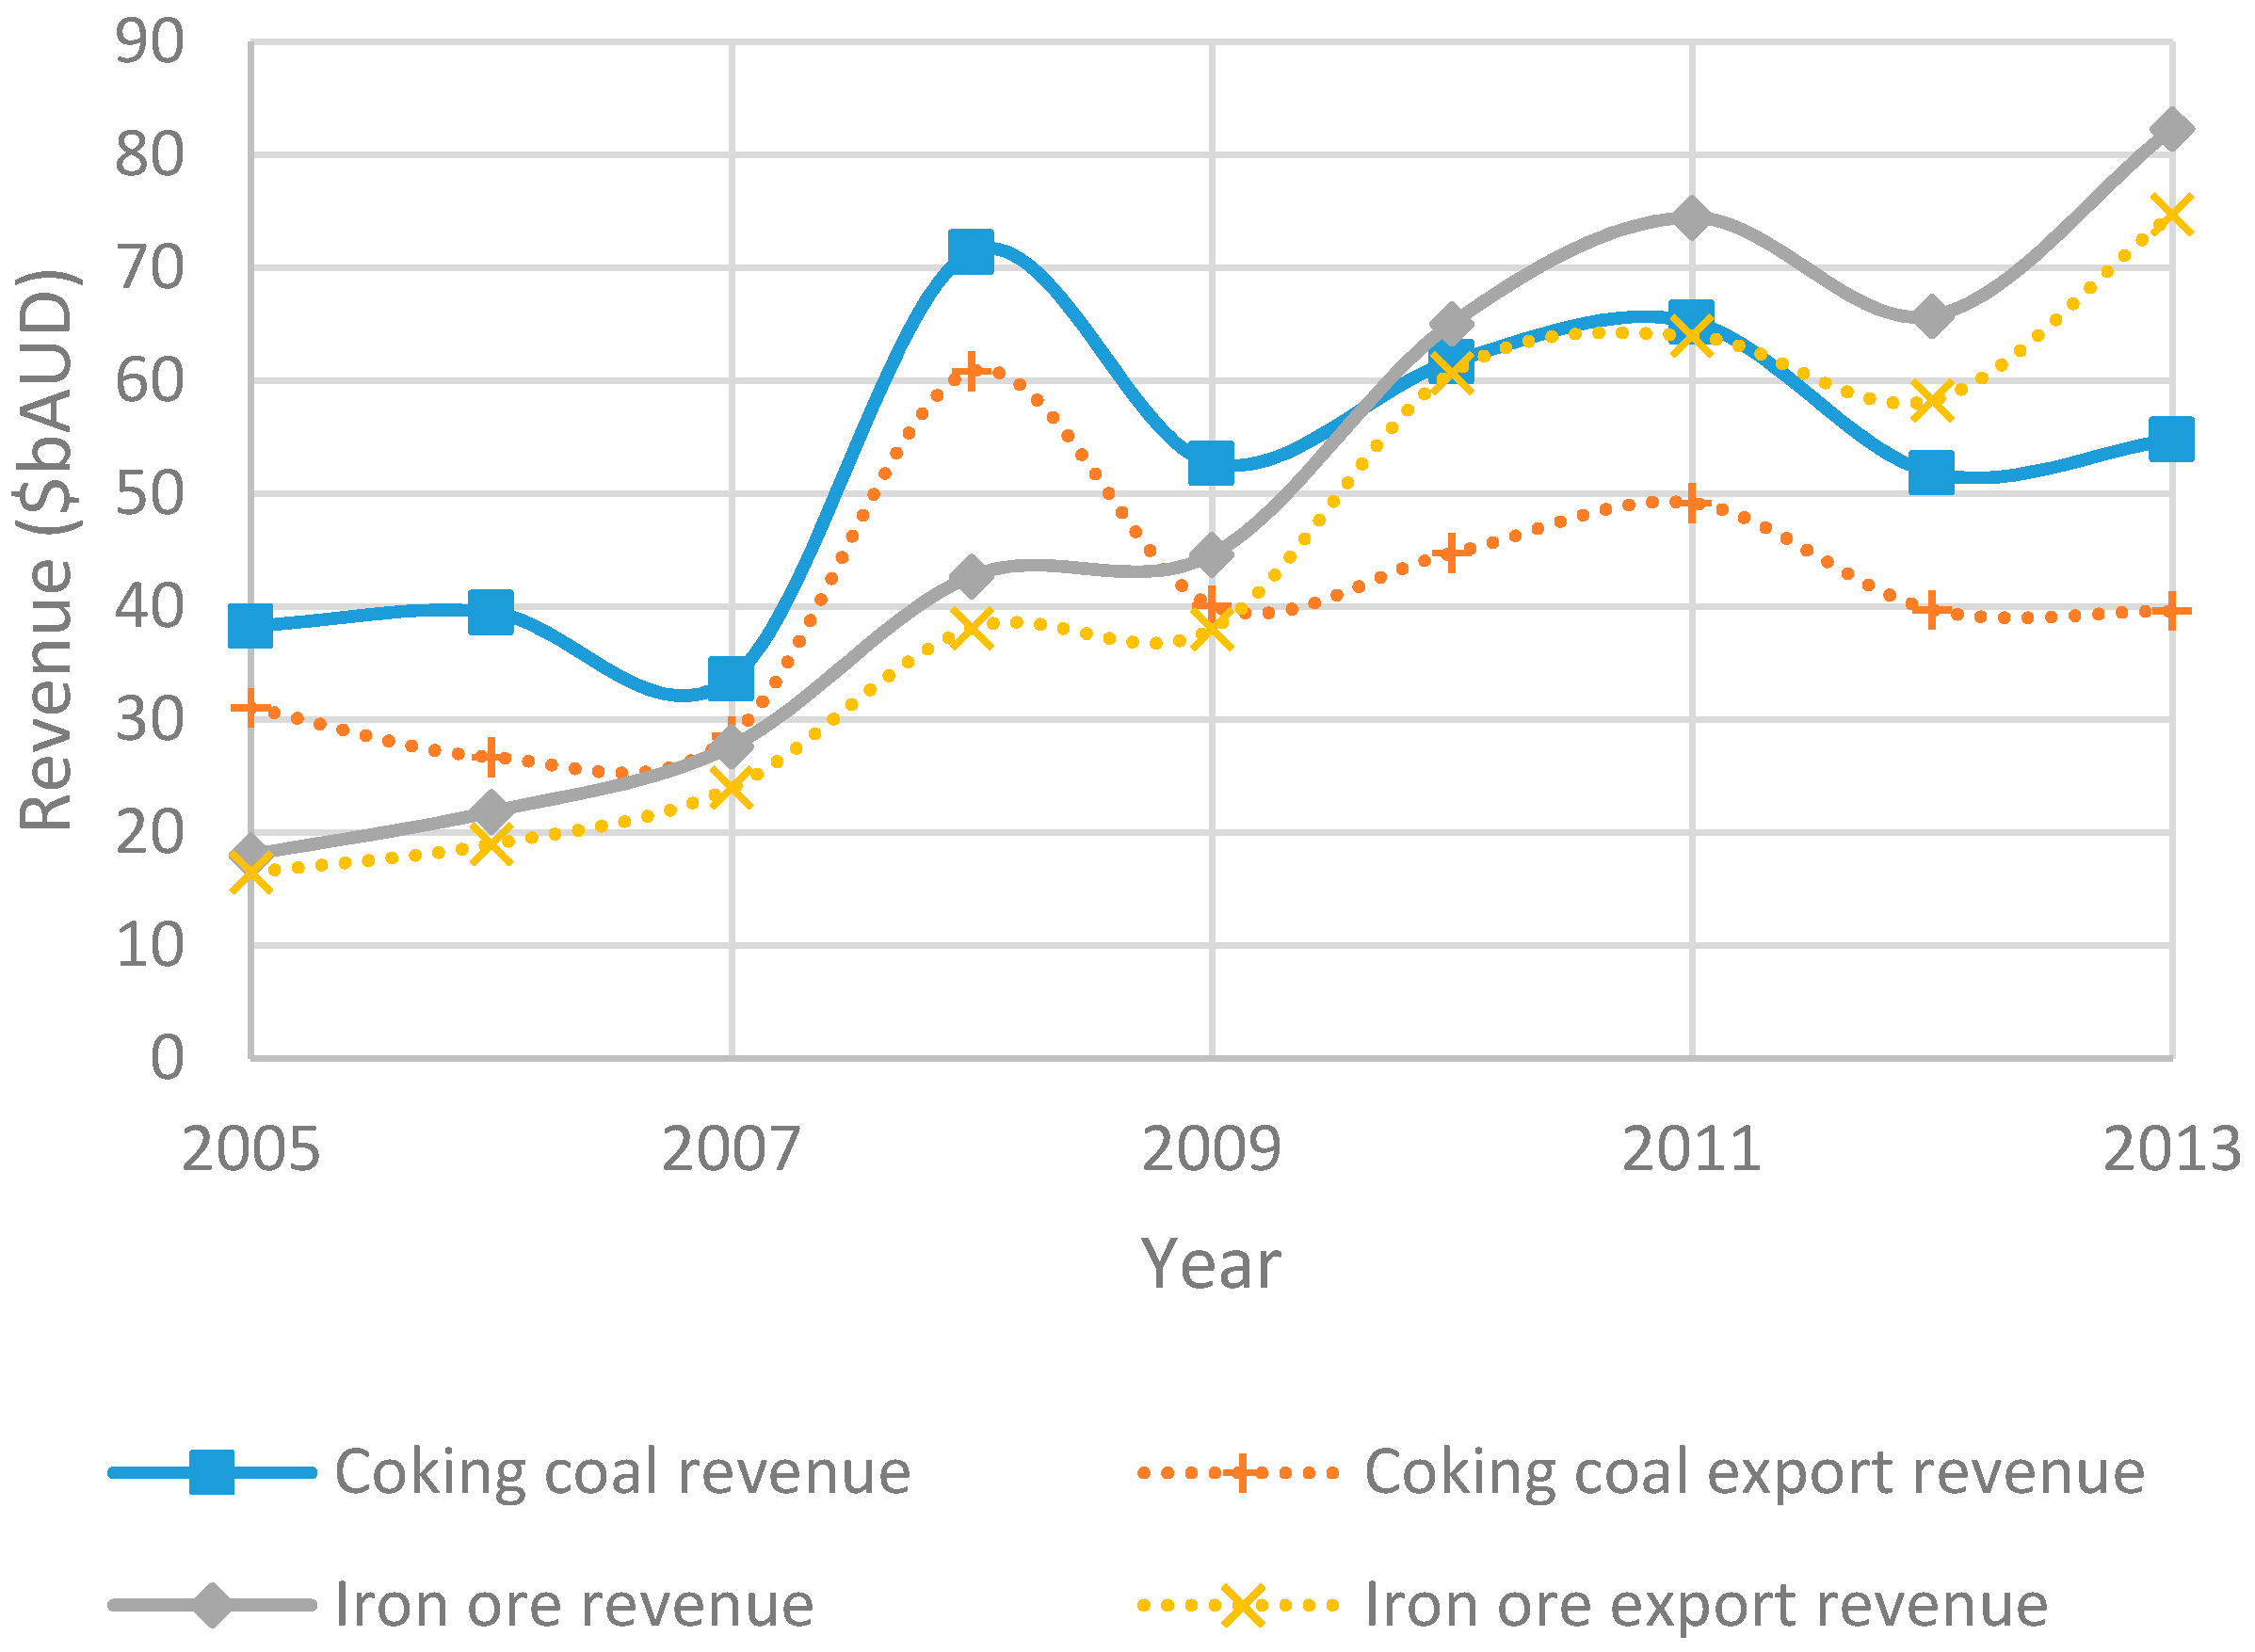
The usage of steel as a country moves through its developing stage is of concern for producers of iron ore and metallurgical coal. The requirement for both iron ore and metallurgical coal as core ingredients within the steelmaking process is expected to create demand correlations with steel production. In Australia, however, over the past decade and especially over the past five years, the iron ore industry has experienced much more growth and less subjugation to the market compared with Australian metallurgical coal producers [
1]. Both industries have climbed in revenue over the years, however, iron ore has grown faster, surpassing the metallurgical coal industry revenue in 2010, shown in
Figure 1.
Figure 1.
Australian industry revenues for iron ore and metallurgical coal since 2005 [
2,
3].
Figure 1.
Australian industry revenues for iron ore and metallurgical coal since 2005 [
2,
3].
The growth in iron ore is seen to be much more robust and consistent than metallurgical coal. To empirically highlight the growth and the contrasts between the two commodities,
Table 1 compares the two Australian industries since 2005, highlighting the major growth experienced in iron ore compared to the menial gains experienced in the metallurgical coal industry. Both commodities have experienced growth, however, the metallurgical coal price has only grown 44% compared to an astronomical growth of 382% for iron ore prices since 2005 [
2,
3]. A correlation measure for price movements over the past decade between the two commodities was calculated to be 0.66, lacking strong correlation that would theoretically arise from steelmaking cost curves [
4].
Table 1.
Australian iron ore and metallurgical coal industry growth since 2005 [
2,
3].
Table 1.
Australian iron ore and metallurgical coal industry growth since 2005 [2,3].
| Measure | Iron Ore Industry | Metallurgical Coal Industry |
|---|
| Measure | Growth since 2005 | Equivalent growth p.a. | Growth since 2005 | Equivalent growth p.a. |
| Revenue | 357% | 21% | 43% | 5% |
| Export revenue | 353% | 21% | 28% | 3% |
| Price | 382% | 22% | 44% | 5% |
The lack of correlating price movements and industry growth over the past decade spurred research into better understanding the competitive factors influencing the two Australian industries. Understanding the factors that have major effects on demand is crucial for resource industry personnel involved in project decision making and price forecasting, not only to accurately model project feasibility, but to understand the longer term economic sustainability effects of their decisions.
The research was carried out with the production of steel hypothesised to produce the economic demand for the two products, iron ore and metallurgical coal, limiting the impact that resource substitution has on trade. This resulted in research primarily conducted into the supply and production of the two commodities, along with data being collected for imports, justifying demand trends. Both the International Energy Agency and World Steel Association were used as valuable repositories of macroeconomic statistics for this study.
3. Recent Iron Ore and Coal Market Trade Trends
3.1. Rising Chinese Steel Production
A transitional period occurred during the 1990s which saw the Chinese steel industry steadily grow, eventually out producing the Japanese steel industry by 1996 [
15]. During this period, Australian exports slowly shifted to supply increasing quantities of iron ore to China. The iron ore export markets started to grow rapidly and suddenly Chinese demand degraded iron ore price negotiations between Australian exporters and the Japanese steel industry. This led to an informal supply cartel creation by Rio Tinto, BHP Billiton, and Vale in 2000 for iron ore. The cartel, which profited from the accelerating iron ore price and demand, was met with a resistive Chinese importing cartel along with new government resource policies in 2005 to help control the excessive iron ore price [
16].
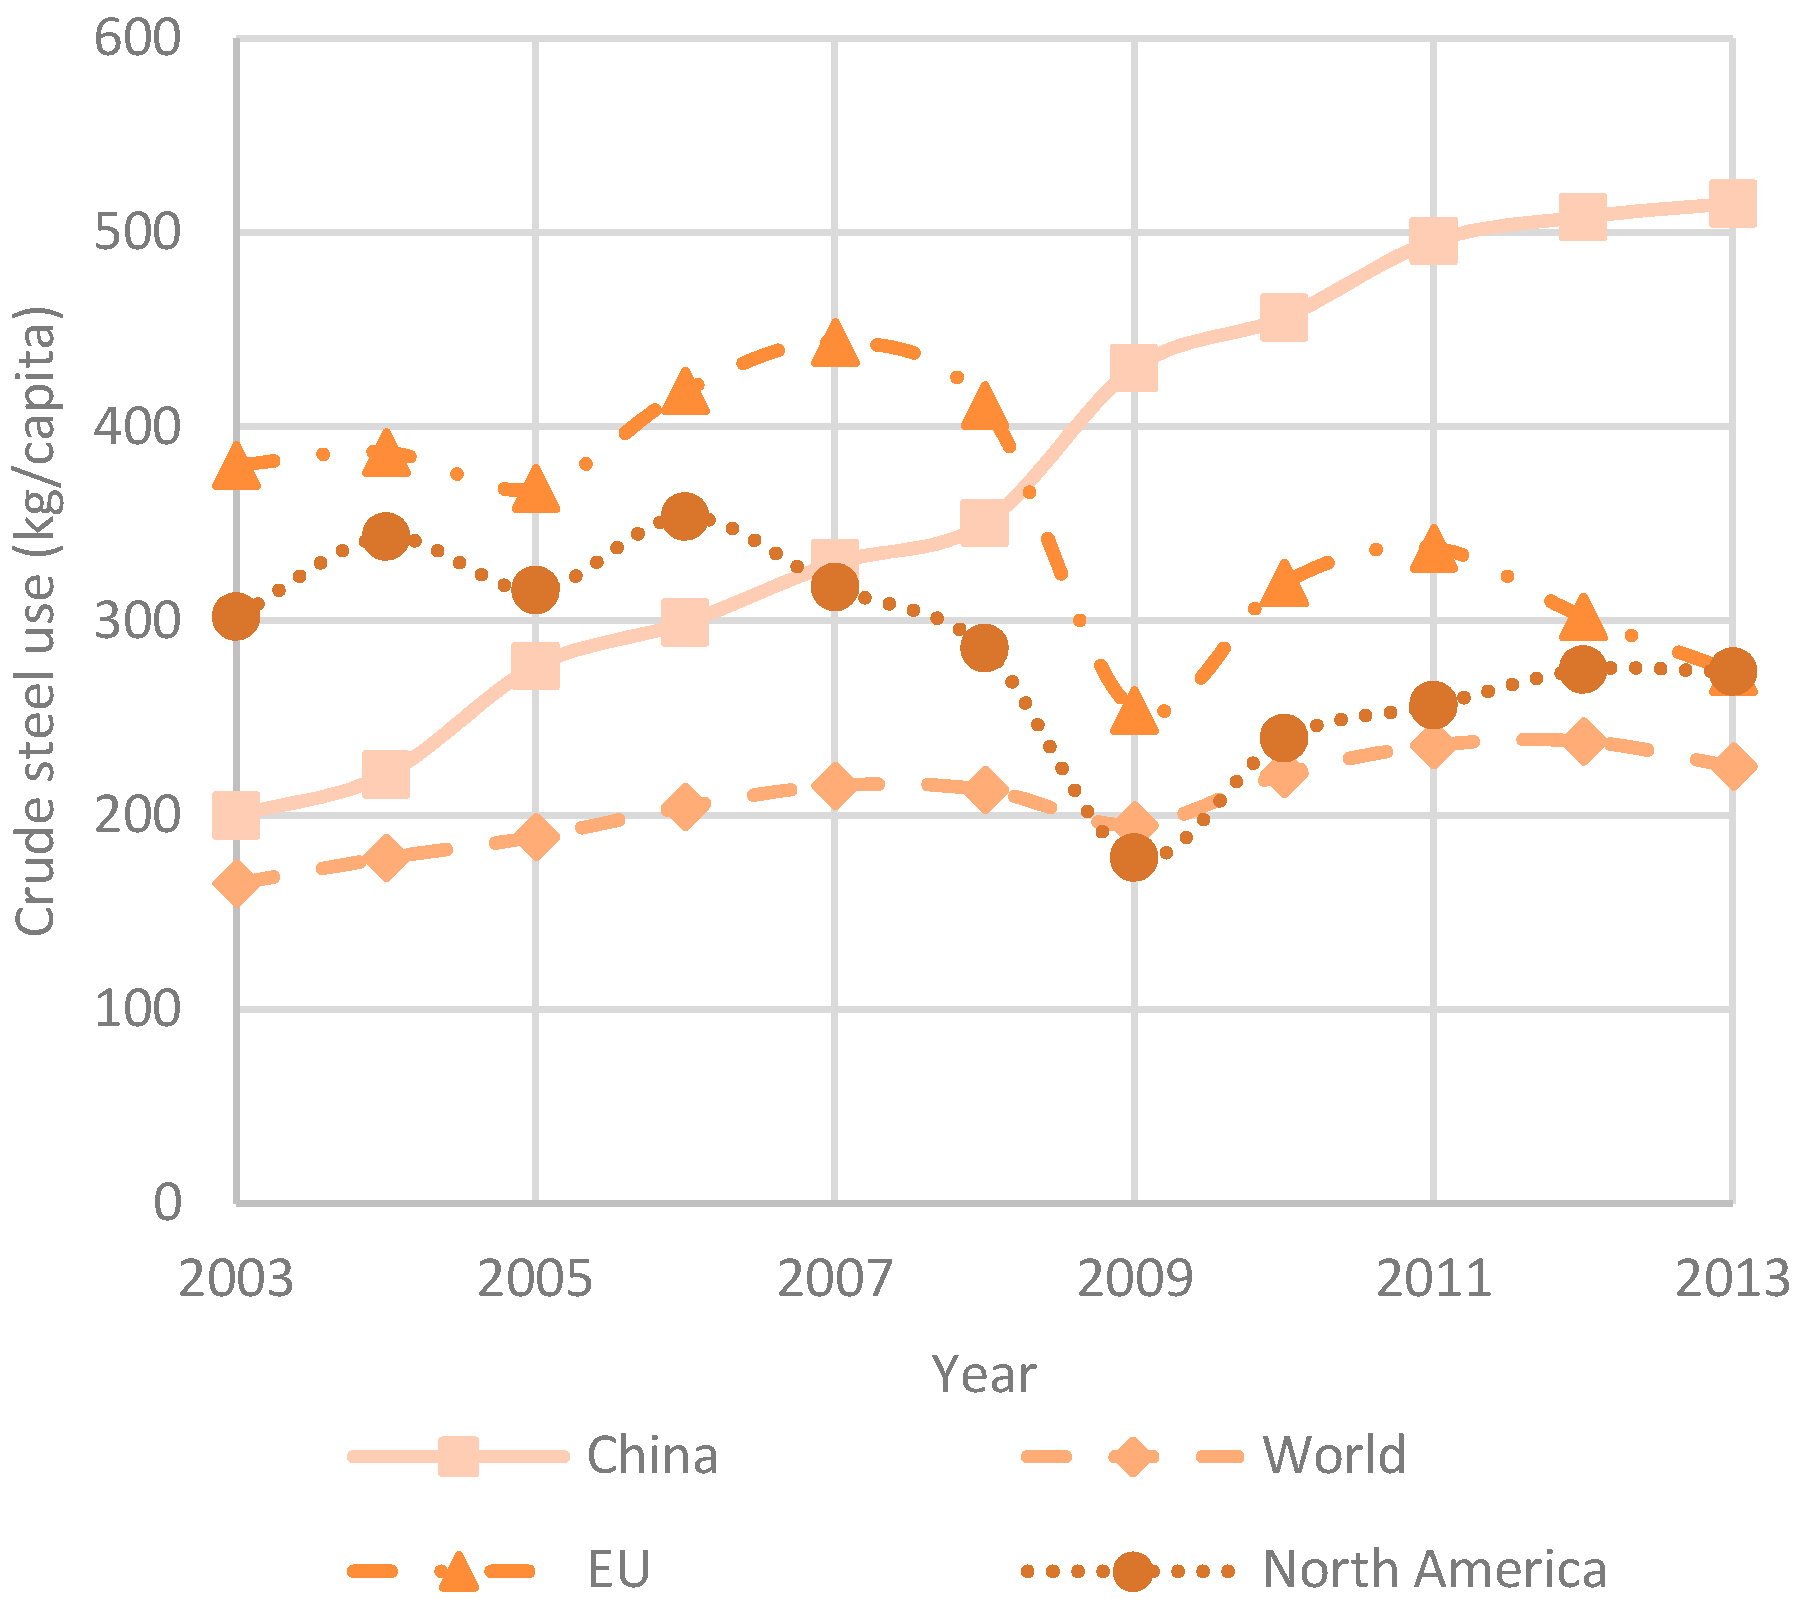
Figure 2 further highlights the growth China experienced in comparison to developed nations. The crude steel usage per capita, or intensity of use, can be used as a measure of development for countries, showing growth as the country develops and its gross domestic product (GDP) rises, before maximising and dropping usage as processes become more efficient and countries become more service orientated [
17]. China’s steel usage has yet to peak, however, it has been slowing in growth recently, suggesting subdued future steel production growth in future years. The Chinese steel production industry does continue to deny forecasts, in 2013 producing 779 Mt of crude steel, surpassing forecasts peaking at 753 Mt in 2025 [
18].
Figure 2.
Graph of the apparent crude steel usage per capita of major nations [
6].
Figure 2.
Graph of the apparent crude steel usage per capita of major nations [
6].
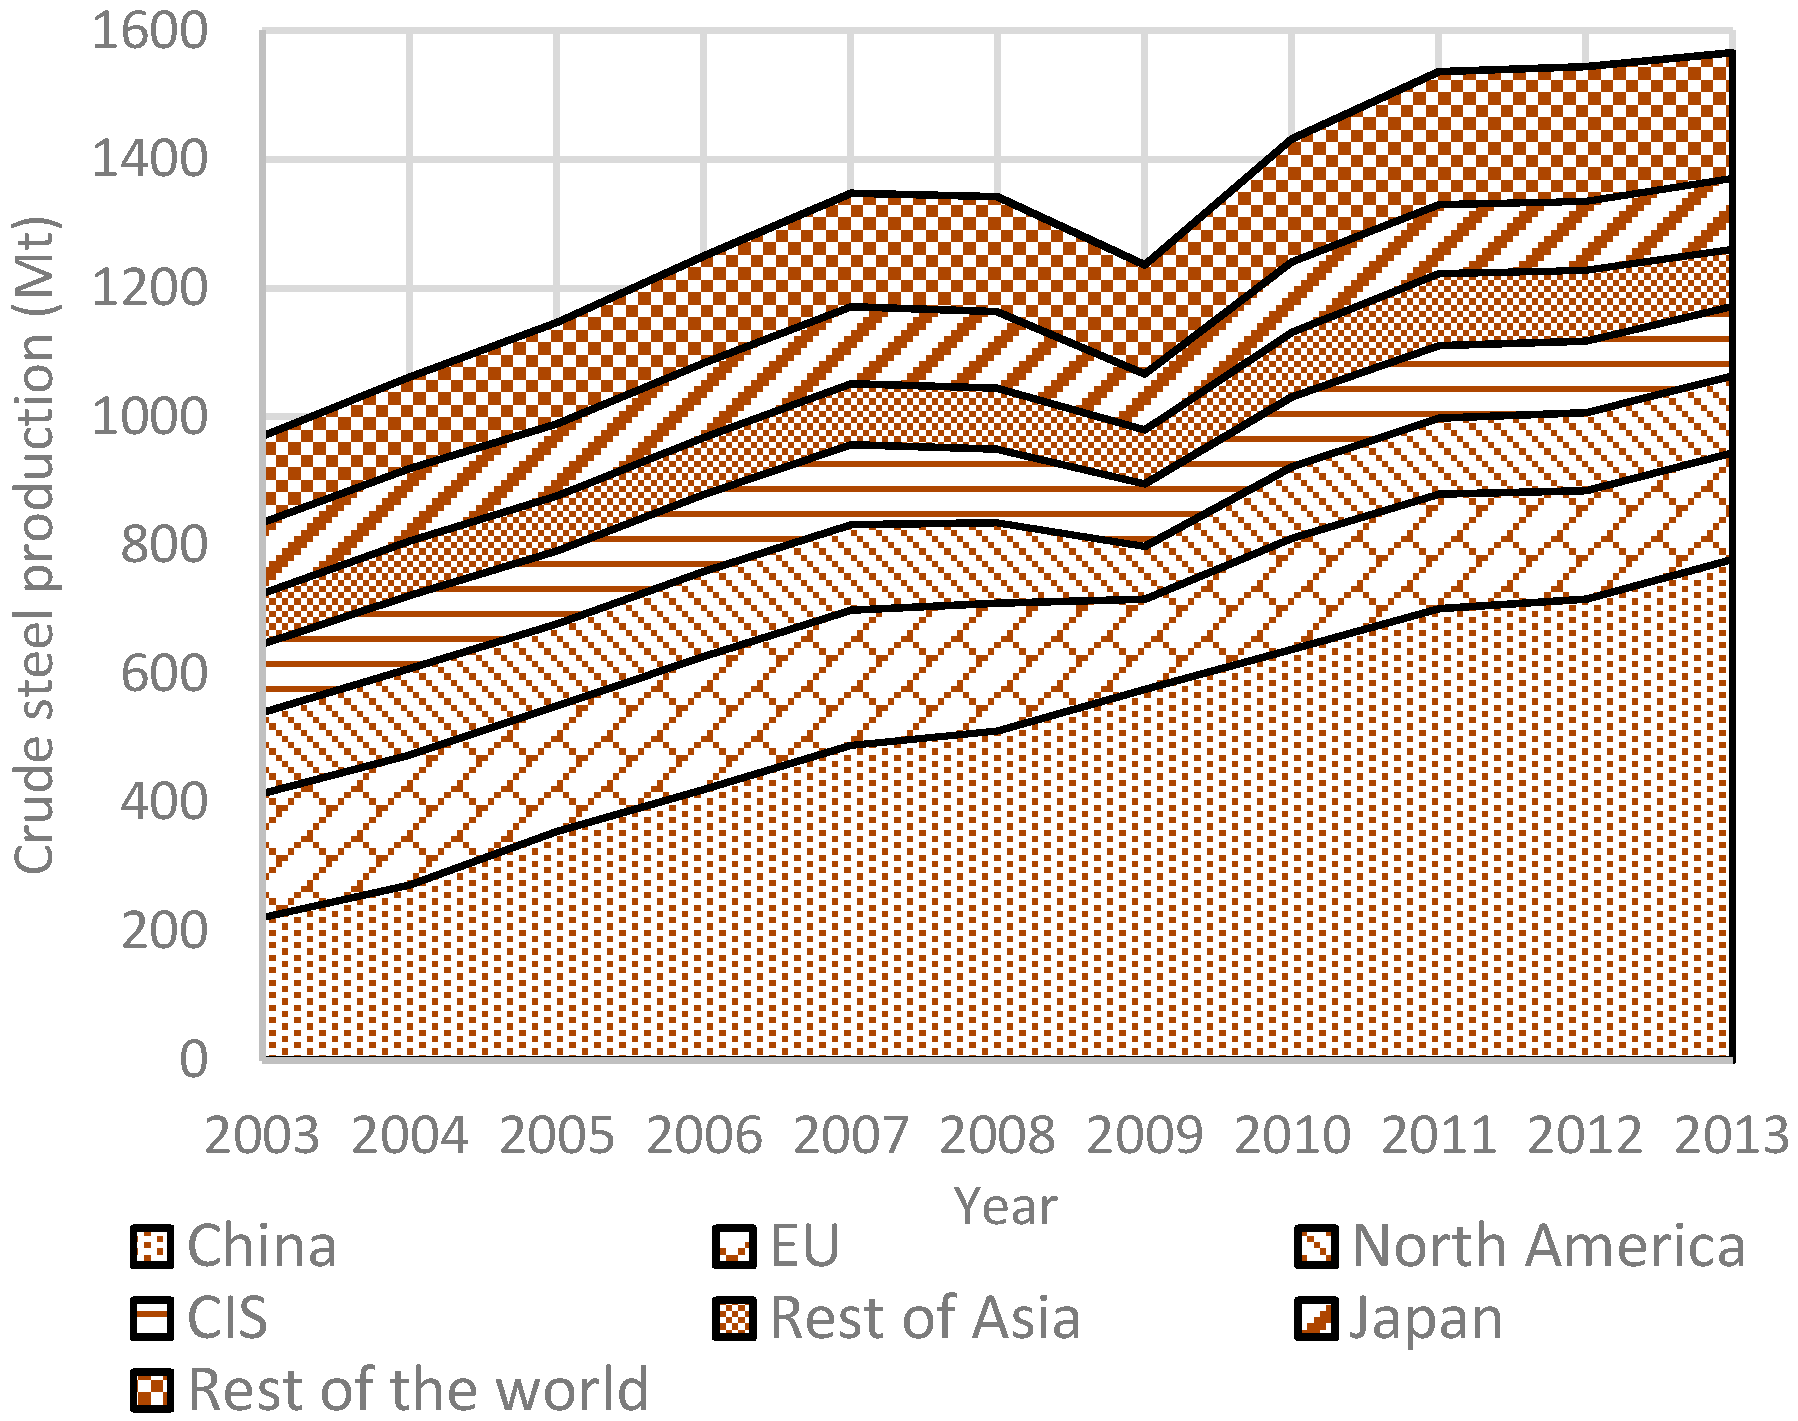
With growing steel usage, crude steel production or importation has to increase.
Figure 3 shows crude steel production of the world, mirroring the crude steel usage. The graph highlights China’s increasing production of steel compared to the rest of the world. China’s production of steel accounted for 50% of world production in 2013, compared to 23% in 2003. This large production level obviously requires large amounts of steel ingredients, primarily iron ore and metallurgical coal. The major market share of Chinese steel production has been reflected with models of iron ore price using Chinese GDP growth as a significant explanatory variable [
19], a derivation from the growth in Chinese iron ore importation.
Figure 3.
World crude steel production over the past decade highlighting major producing countries [
6].
Figure 3.
World crude steel production over the past decade highlighting major producing countries [
6].
3.3. Producers of Iron Ore and Metallurgical Coal
Due to the high barrier for entry that most resource markets present, there tend to be few producers of similar minerals in similar locations. This creates oligopolistic supply markets, allowing producers to output at levels that do not follow the demand curve [
22]. Producers will tend to set prices at a level comfortable for them to produce a certain quality of product. Many buyers are amenable to this action due to the stability of pricing and production, with stability garnering an ever increasing value. When oligopolies and oligopsonies occur, formal cartels tend to coalesce, with the intention to control either pricing or output/consumption of resources. The optimal quantity is found where the marginal cost is equal to the marginal revenue [
23].
This is in contrast to a perfectly competitive market, where the quantity output will match the intersection between total production cost and demand. History has shown the tendency for most cartels to breakdown within five years of formation [
24]. The recent iron ore industry has exhibited excessive cartelisation. The cartelisation has been driven by the worldwide growth in steel production and iron ore demand. Over the past decade, the main supplies of iron ore came from three major countries—Australia, Brazil, and China. Australia has experienced the largest expansion in iron ore production, growing 145 percent over the decade since 2003.
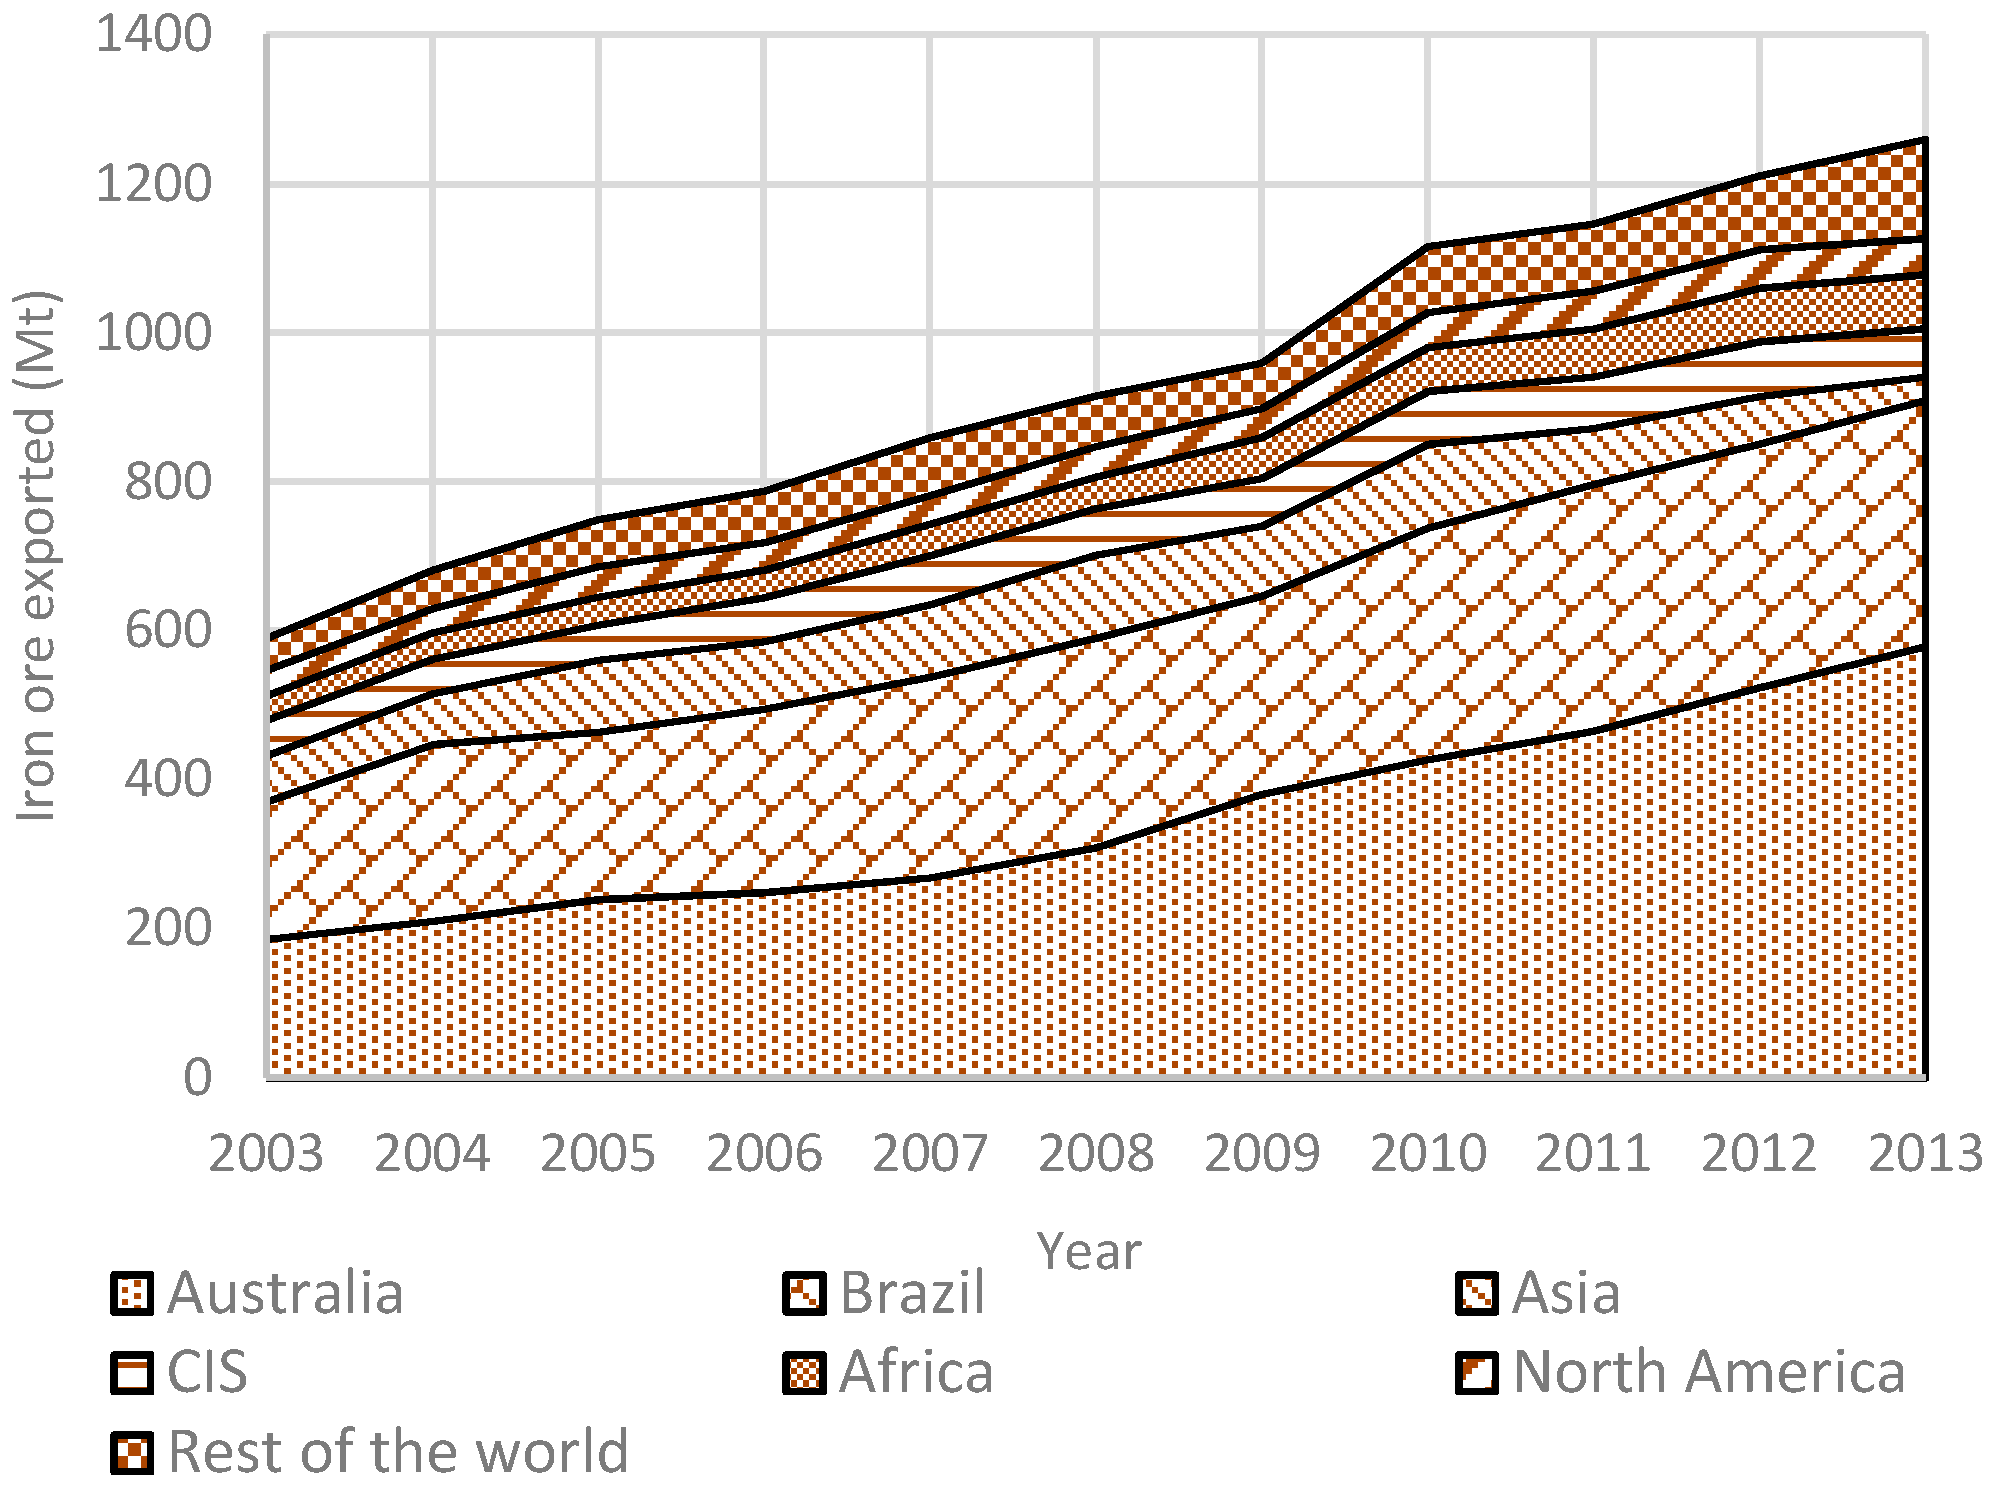
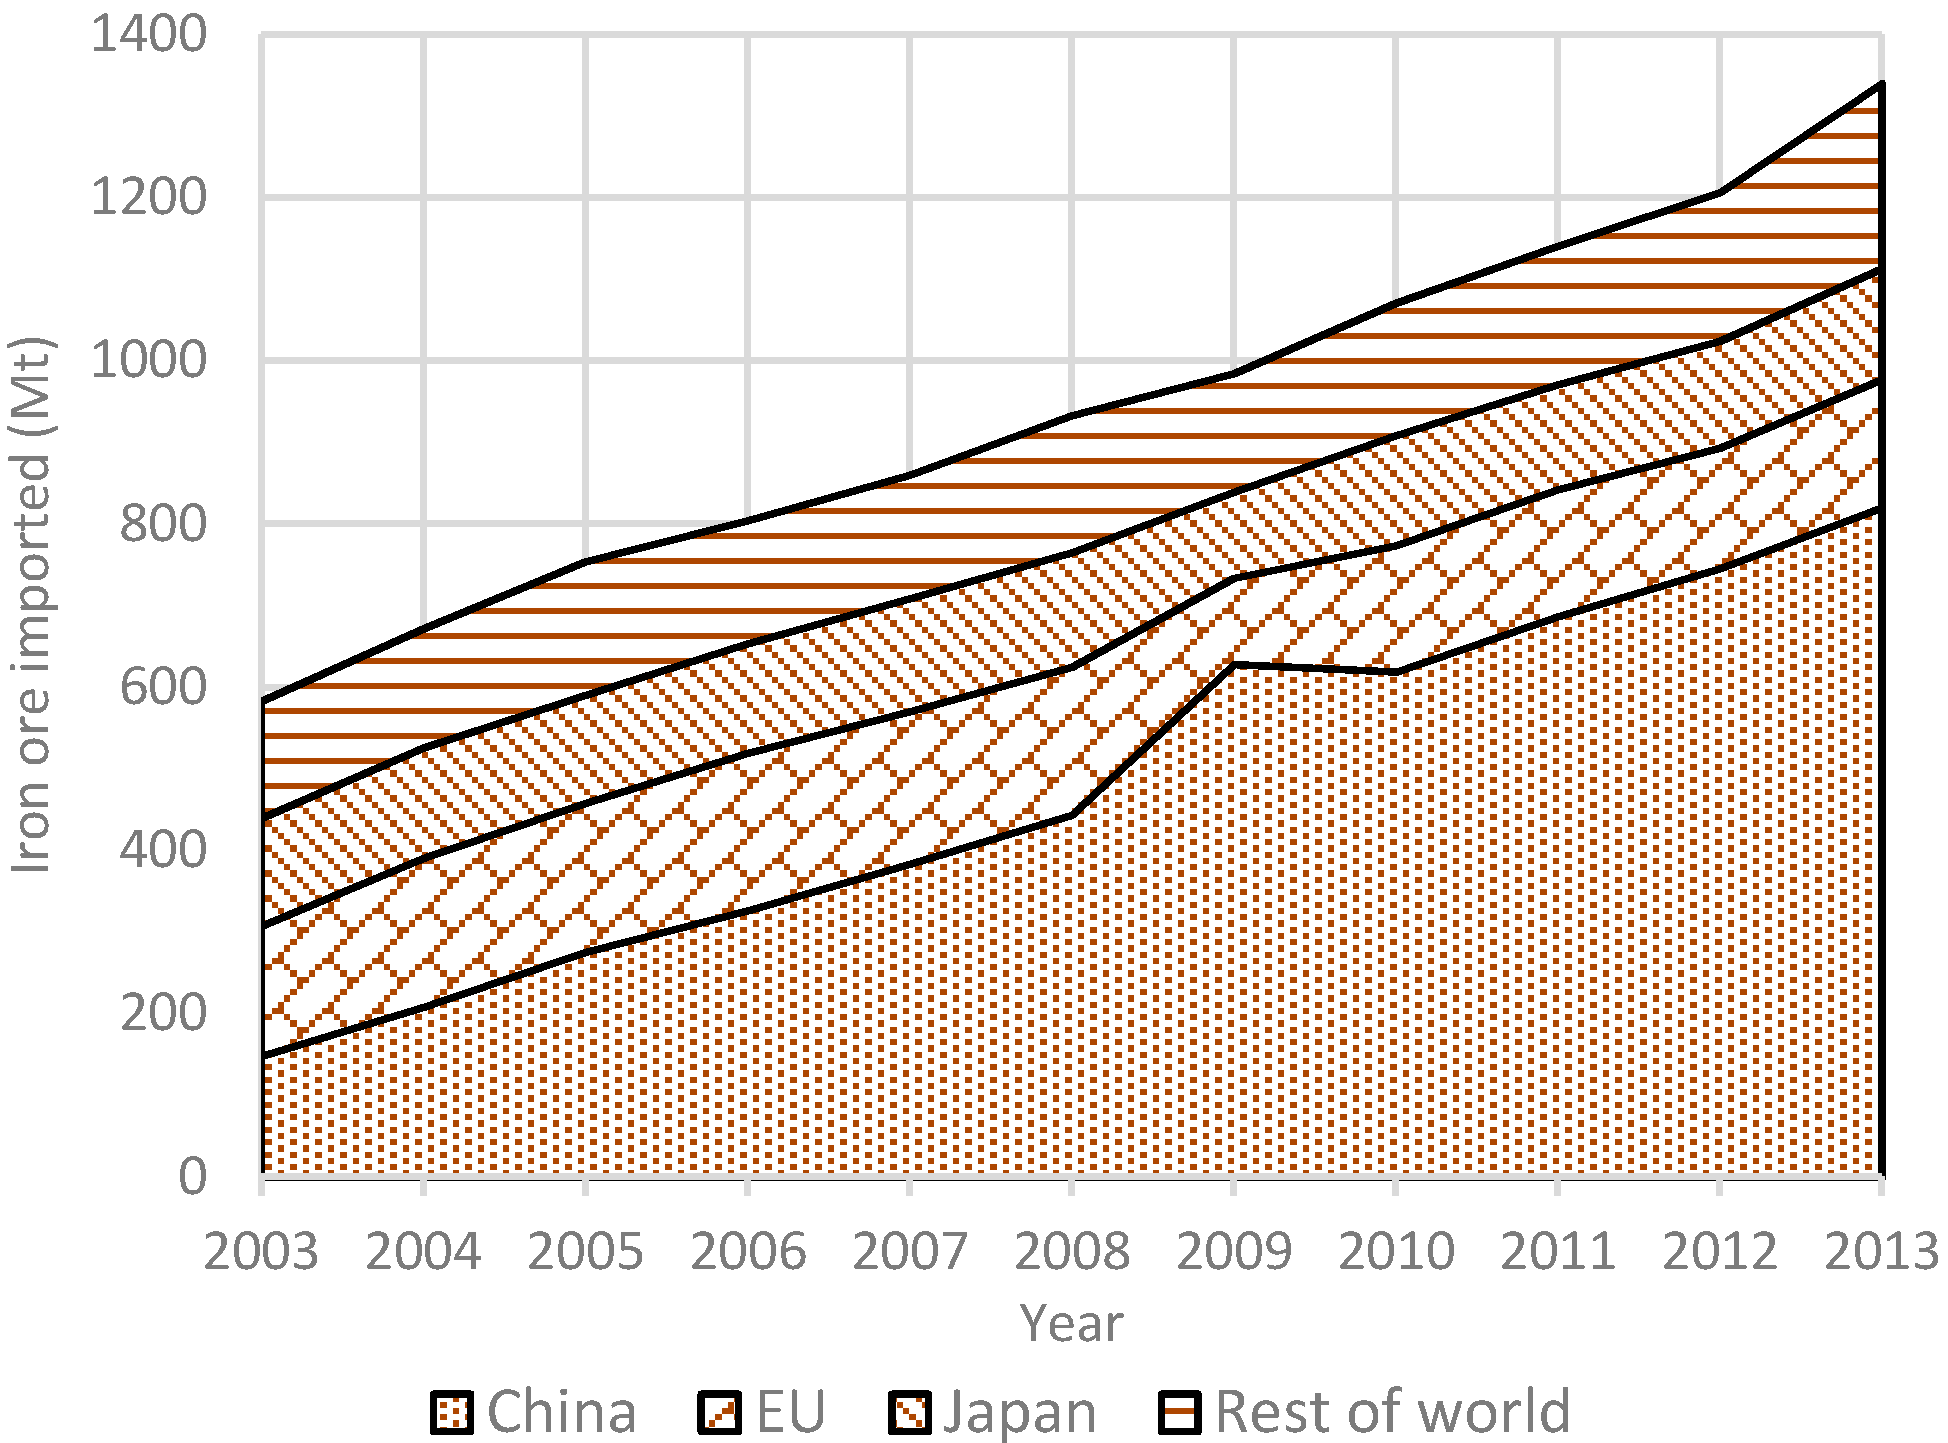
With increased iron ore demand, iron ore production certainly has increased for major producers. The demand in iron ore is driven by the increased crude steel production vicariously acting through the rising import quantities from China. To fuel this increased import demand, iron ore exports have subsequently increased.
Figure 5 highlights the increasing exports of iron ore experienced worldwide. Along with the greatest production growth, Australia has seen the greatest growth in exports, expanding 153 percent over the past decade. Brazil, the second largest producer, has grown 77 percent. There is little competition from other countries, however, when combined, the rest of the world’s producers constitute 28 percent of traded iron ore. China’s iron ore production was 280 Mt in 2013, all of which was supplied to the local steelmakers, and does not feature in global trade [
6].
The iron ore supply market presents itself as an oligopoly. Only two major exporting countries, comprising three major producers between them, have the ability to pressure pricing in their favour. These companies, BHP Billiton, Rio Tinto, and Vale, constitute 55 percent of iron ore supply worldwide. Evidence suggests that this market structure has existed since early 2000s, and an informal supply cartel has been existent for supply into the Asian market. The objective of the cartel was to assist with contract negotiation of iron ore supply. With China’s demand consistently growing, Australian producers were using the excessive profits generated to substantially grow output.
Figure 5.
World iron ore exports split into major exporting regions [
6].
Figure 5.
World iron ore exports split into major exporting regions [
6].
During the decade of rapid growth in the Australian iron ore industry, it could be expected that abnormal inflation would occur solely within the industry, without other sectors growing to similar extents. If the growth was to the detriment of other exporting sectors, due to an appreciation of the Australian dollar, then the phenomenon known as the “Dutch disease” may have occurred. Evidence shows that the increasing iron ore production from Australia has grown such that the exports account for 20 percent of total exports, increasing the effect of iron ore prices on Australian terms of trade [
25]. Whilst this growth has been substantial, the effect on Australian purchasing power was diluted because of the high level of foreign ownership within the iron ore industry, allocating large proportions of iron ore profits to offshore investors. With slowing growth within the industry predicted, continued threat of Dutch disease occurrence should diminish. Corden [
26] examines monetary policies that Australia could adopt to further reduce the negative effects of Dutch disease, of which a reduction in Reserve Bank interest rates would prove most effective, depreciating the Australian dollar.
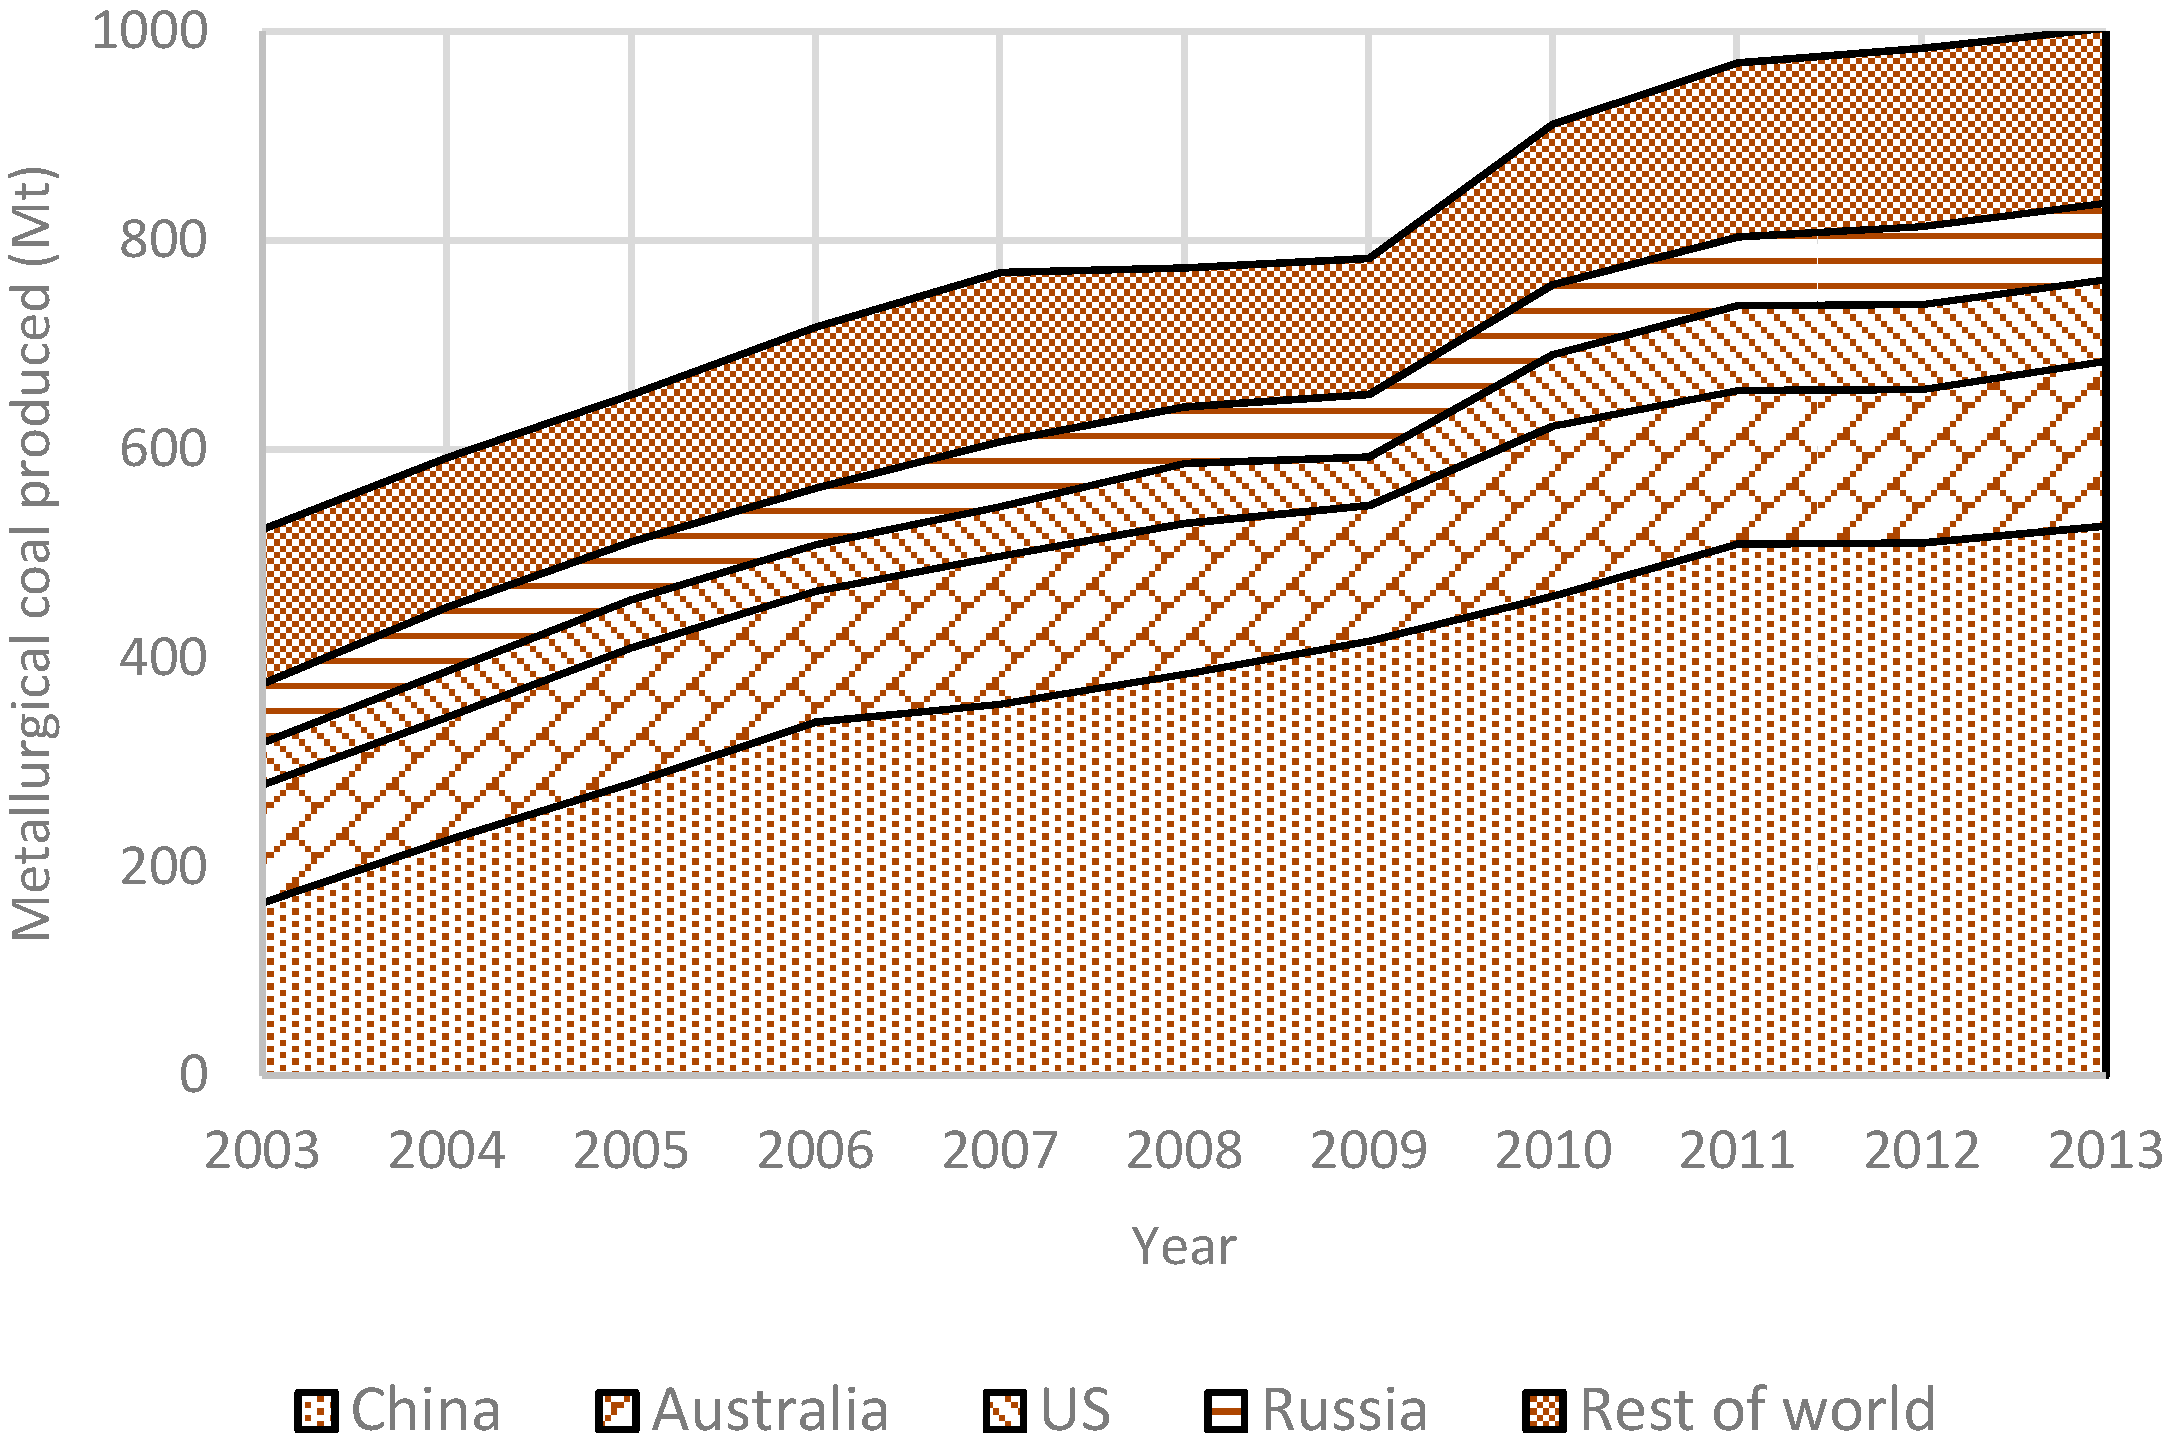
As with the world iron ore production, world metallurgical coal production has experienced strong growth, stemming from China. The increases of production have not been matched by other counties, as seen in
Figure 6, and the majority of metallurgical coal produced by Chinese miners is fed into local steelmakers, thus reducing external demand for foreign metallurgical coal.
Table 3 highlights this further with a comparison between the 2003 and 2013 annual production of the top metallurgical coal producing countries. China has expanded production 217 percent whereas the Australian market as grown merely 40%, a growth which is mirrored by other major producing countries such as Russia and Canada. The United States and India have experienced strong growth, both over 90 percent. The United States has grown such that it is now the third highest producer globally.
Regarding seaborne metallurgical coal trade, Australia ranks as the top supplier. Australia has maintained market share of supply however production has not overly grown. In contrast to Australia, the United States and Russia have shown strong growth in export values, growing 197 percent and 127 percent, respectively. The growth within the United States highlights the threat that low production costs and low investment rates can produce on the production and supply of metallurgical coal. Russia may have grown considerably, however, it does not have major market share and therefore does not impact greatly on supply.
Figure 6.
World metallurgical coal production over the past decade [
21].
Figure 6.
World metallurgical coal production over the past decade [
21].
Table 3.
Metallurgical coal annual production comparing 2003 and 2013 [
21].
Table 3.
Metallurgical coal annual production comparing 2003 and 2013 [21].
| Region | 2003 Production (Mt) | 2013 Production (Mt) | Growth |
|---|
| China | 166 | 527 | 217% |
| Australia | 113 | 158 | 40% |
| US | 40 | 78 | 95% |
| Russia | 57 | 73 | 29% |
| India | 22 | 42 | 92% |
| Canada | 24 | 34 | 41% |
| Ukraine | 26 | 20 | −23% |
| Rest of the world | 76 | 74 | −2% |
4. Steel Ingredient Trade Characteristics
To gain a deeper understanding as to why the growing steel production has impacted the iron ore supply market more positively than the metallurgical coal market, study into market elasticity and geographical trade was undertaken. Elasticity is a measure used to quantify change in quantity for a given change in price. The elasticity measure was created using a regression analysis against production quantities for major producing nations and resource trade pricing. Steel production is generally inelastic, resulting from demand primarily in the manufacturing and construction industry. It flows that the ingredients for steel should also be inelastic, supported by Zhu [
27]. Measures of elasticity over the past decade for both metallurgical coal and iron ore were calculated to determine the competitive position that Australian producers occupy.
The world iron ore market was modelled, along with the Australian and Brazilian industries, representing the major players for iron ore exportation. Australia has maintained a higher elasticity compared to the world market and Brazil. Both markets have increased their elasticity, with Australia moving from 0.19 to 0.59 and Brazil 0.07 to 0.38 over the past decade. Australia continually has had a higher elasticity of supply over Brazil, representing the industry’s ability to increase production more rapidly with increases in iron ore price. Import/export structures were constructed for the major importers of iron ore to determine how the trade structures of the commodities have evolved over the last decade, in theory mirroring the measures of elasticity calculated. Resources have fixed locations resulting in countries being classed into the broad categories of resource producers or material producers. Due to this dichotomy, most resource producing countries export mined minerals. Government entities capitalise on their country’s natural endowment through economic rents. These rents are the profit that is generated through mining and trading resources above any production costs, including the required return upon the investment that a mining operator expects [
28]. Complexity is added to the trade of resources stemming from differing transportation costs associated from the export locations of resources. Developed countries producing resources will tend to export more than countries that still have developing economies.
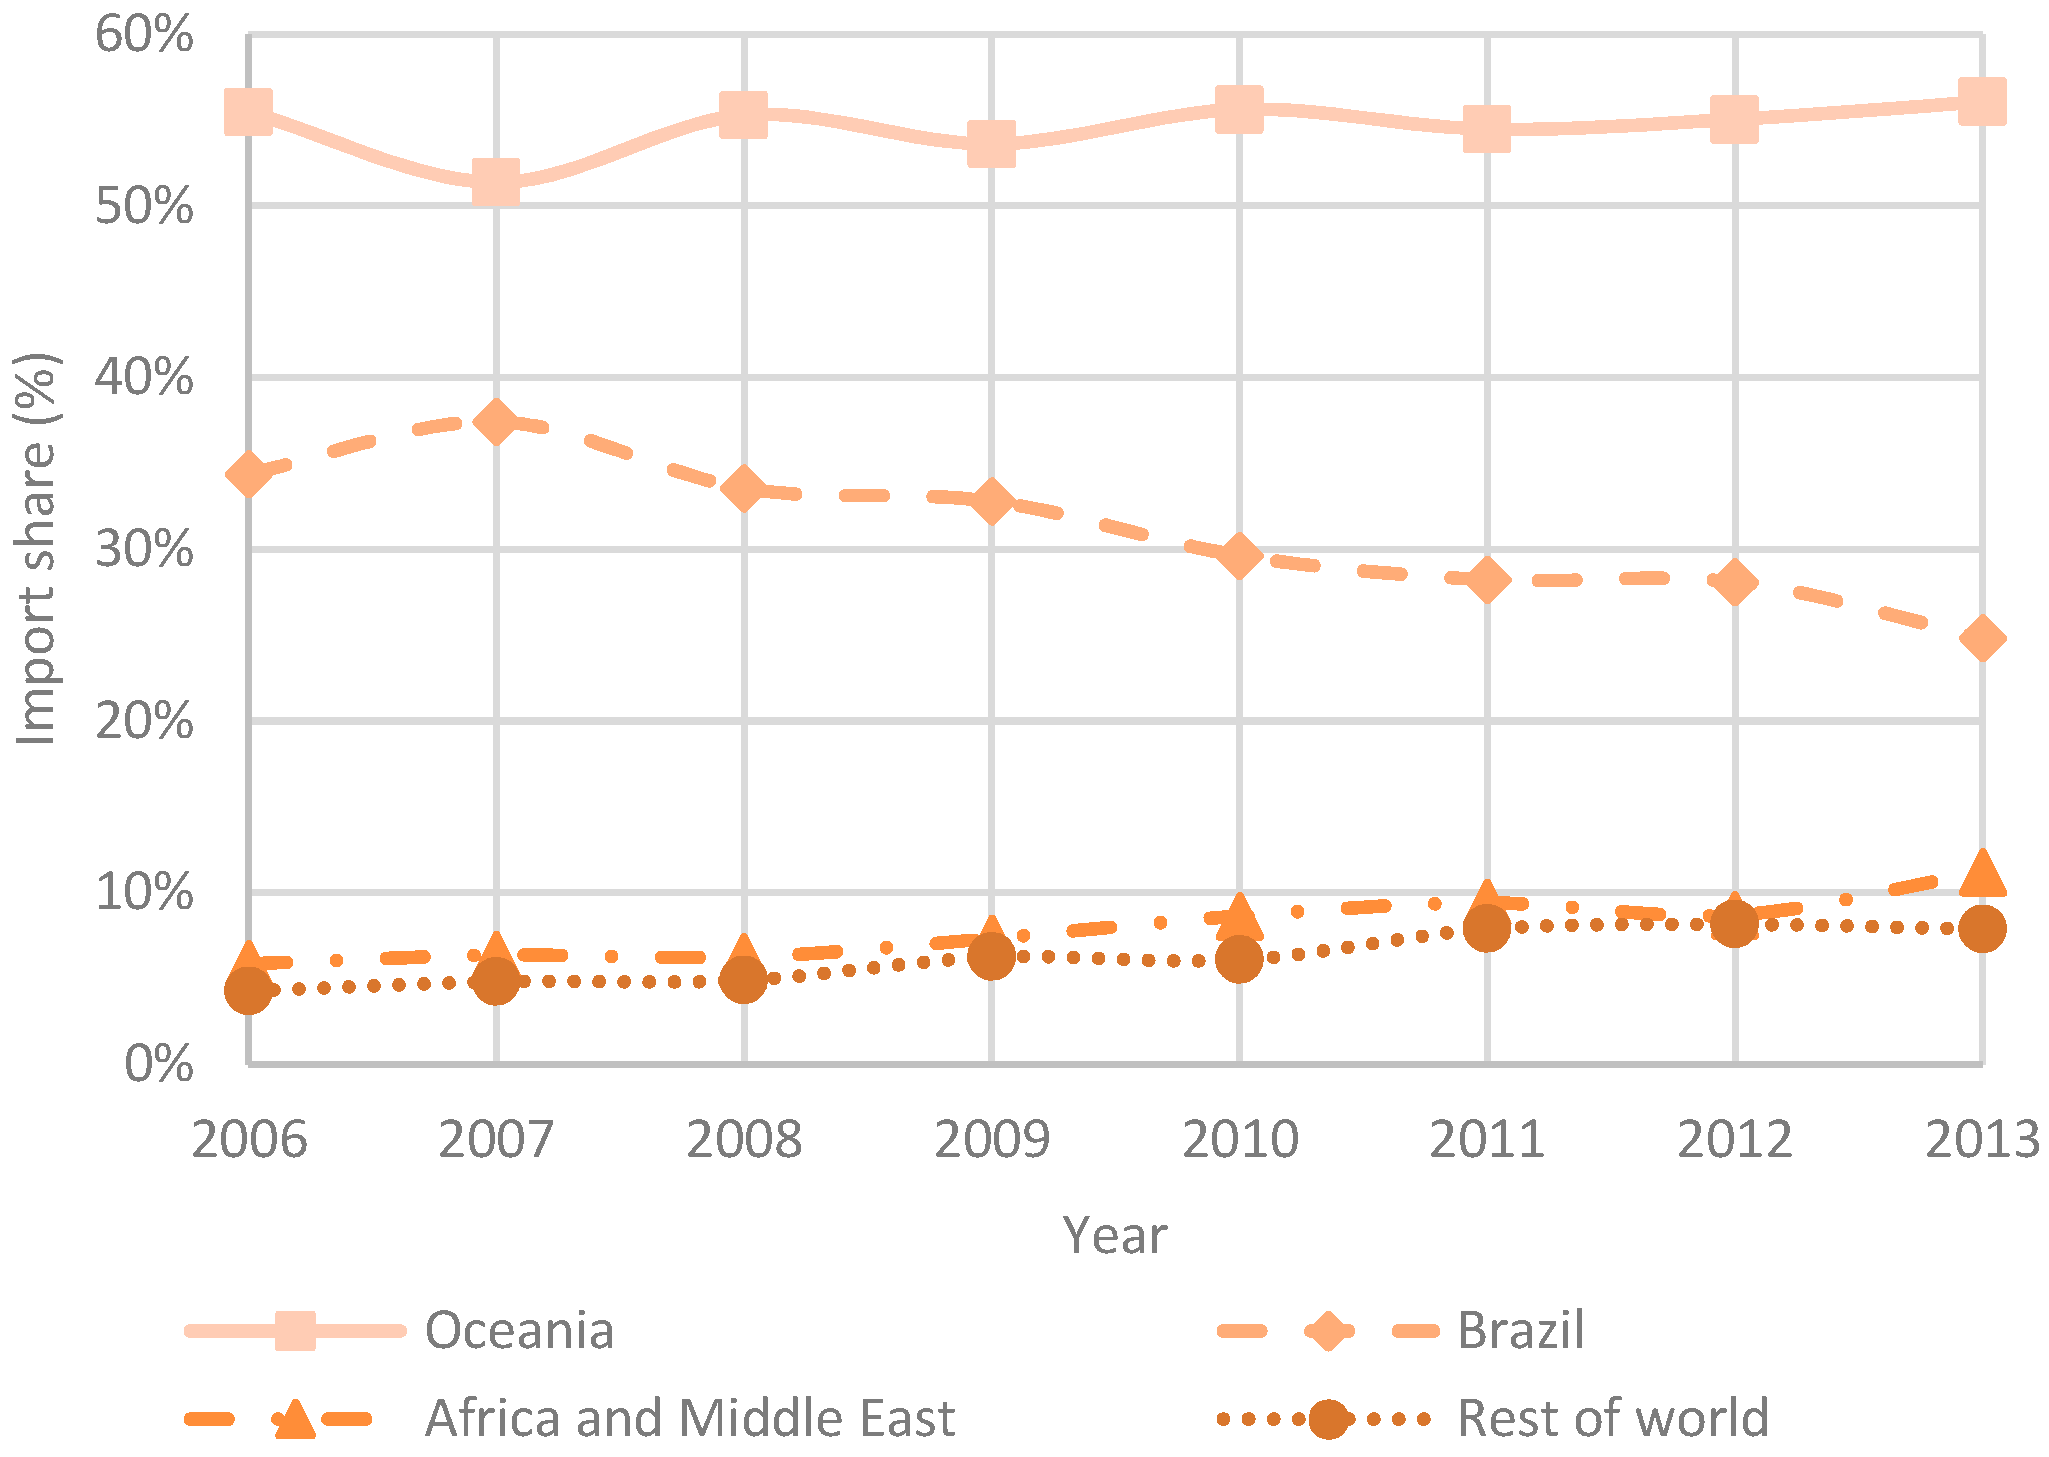
Figure 7 shows the different sources of iron ore that have been imported into the Asian market over time. The Asian market has been increasing its reliance on Australian iron ore producers, along with decreasing the imports from South America and growing imports from Africa. In contrast to this trend, the European Union (EU) market has shown steady reliance on multiple sources, with the majority of iron ore being imported from the Brazilian producers rather than Australian producers. The disaffiliation between the EU and Asian markets means there is a lack of perfectly competitive markets for both Australia and Brazil.
Figure 7.
Asian iron ore import share split into major supply regions [
6].
Figure 7.
Asian iron ore import share split into major supply regions [
6].
With growing importation share of iron ore from the Asian market, Australia has been the main supplier, creating synthetic supply cartels from the Australian iron ore industry. The oligopoly has blatantly existed since early on in the 2000s and the “Big Three” iron ore producers, Rio Tinto, BHP Billiton, and Vale, have exerted power over the supply of iron ore into Asia. The Big Three used negotiations between steelmakers in Asia to set iron ore prices for that going year. In support of Jones [
29], both the supply and import cartels broke down in 2010 in favour of an index-based pricing model. The breakdown of the cartels has not affected the market structure however, with Australia growing supply share into Asia. Wilson [
30] argued that whilst the breakdown of the cartels should have benefited both suppliers and importers, evidence has shown that it has only brought mixed benefits for the Chinese steel industry, whilst restructuring the ownership and pricing on the supply side.
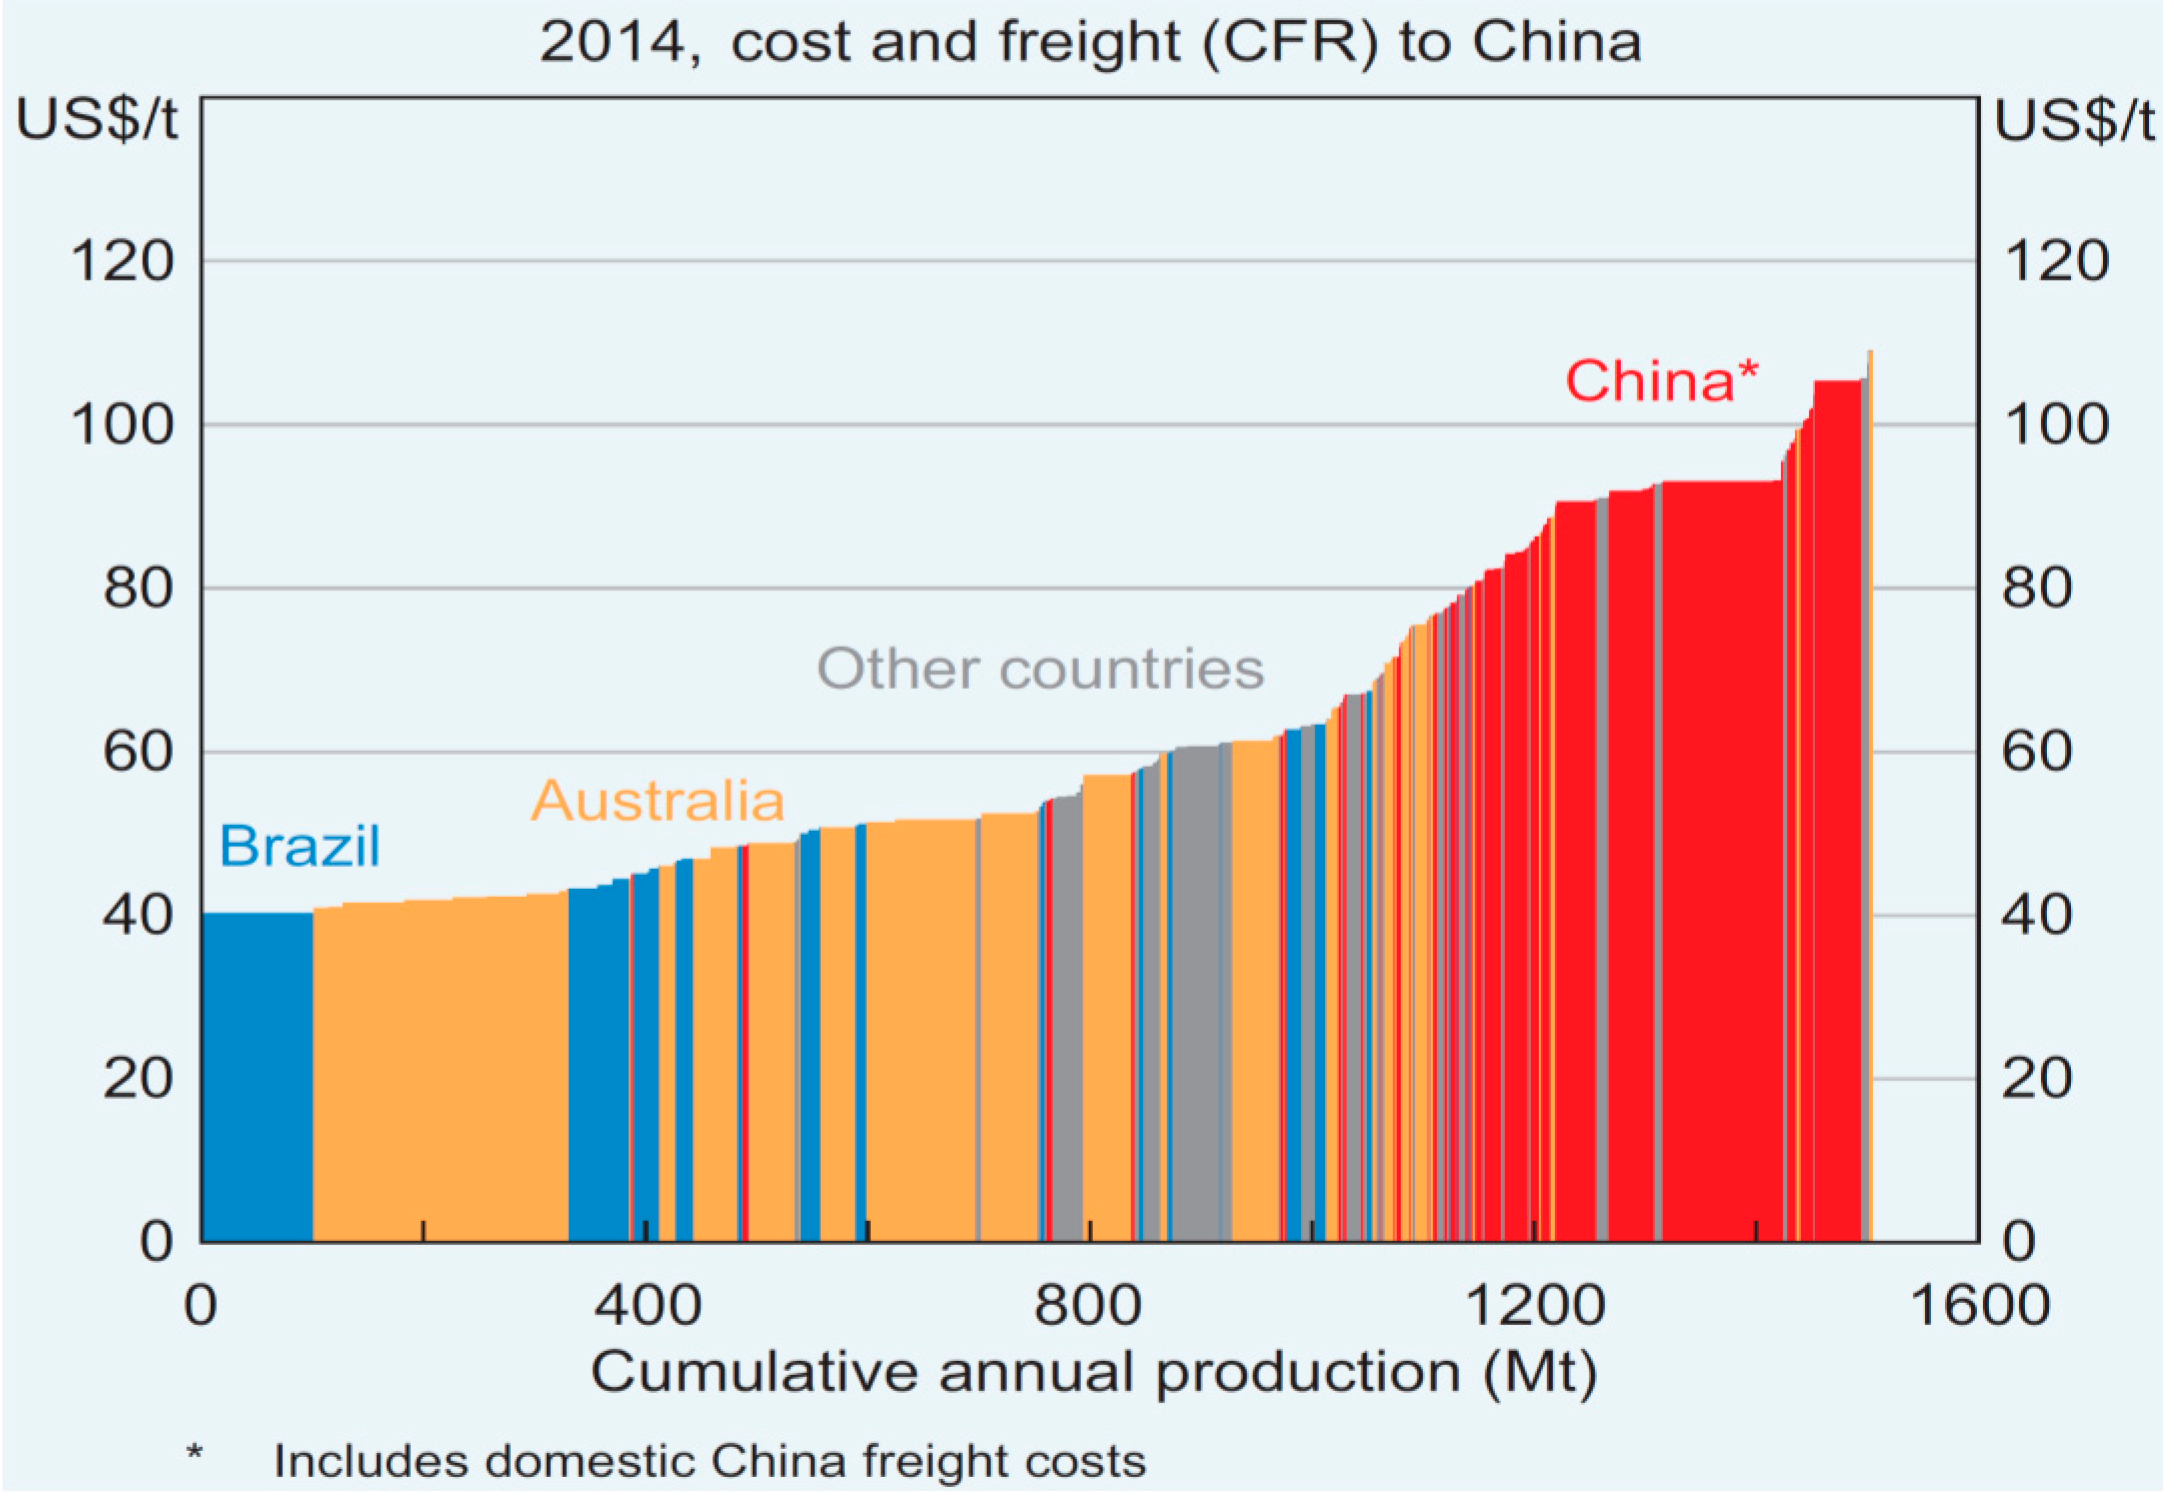
Figure 8 graphs data on production and freight cost for iron ore being imported into China. The graph aptly captures the position that both Australia and Brazil occupy with large low cost production methods. With decreasing iron ore supply share from Brazil into Asia, Australian producers will continue to dominate the market structure, with threat from other countries only existing once demand from China rises above 1000 Mt per annum. Pustov, Malanichev and Khobotilov [
31] forecast that long-term pricing will ease from previous highs to the Chinese production marginal costs of $85 US dollars per tonne. Already the iron ore price has been rapidly decreasing and the end of 2014 is seeing prices aligning with $85 USD/t [
32].
Figure 8.
Global iron ore production costs, including freight to China, 2014 [
33].
Figure 8.
Global iron ore production costs, including freight to China, 2014 [
33].
For metallurgical coal, measures of elasticity were modelled for the world, Australia, and the United States markets, being the dominant exporters within global trade. The Australian industry maintained an elasticity of 0.12 in 2003, compared to 0.30 in 2013, increasing the elasticity of the supply. The United States metallurgical coal industry experienced an elasticity of 0.62 in 2003 and 0.73 in 2013. Elastic supply is experienced to the greatest effect when prices fluctuate upwards, giving the industry greater incentive to increase production. The increased elasticity that the United States enjoys over Australia represents the country’s producers’ ability to increase supply with increases in price. The higher US elasticity could result from an ongoing trend over the past decade of declining productivity within Australian mining operations. Specifically, heavy equipment such as dragline and rope shovels used within Australian coal operations have lower productivity performance compared to measures from US coal operators [
34]. With the United States industry able to respond more rapidly, the increased competition has created negative effects for Australian coal miners who struggle to capitalise on upward price fluctuations, yet experience losses on downward price movements.
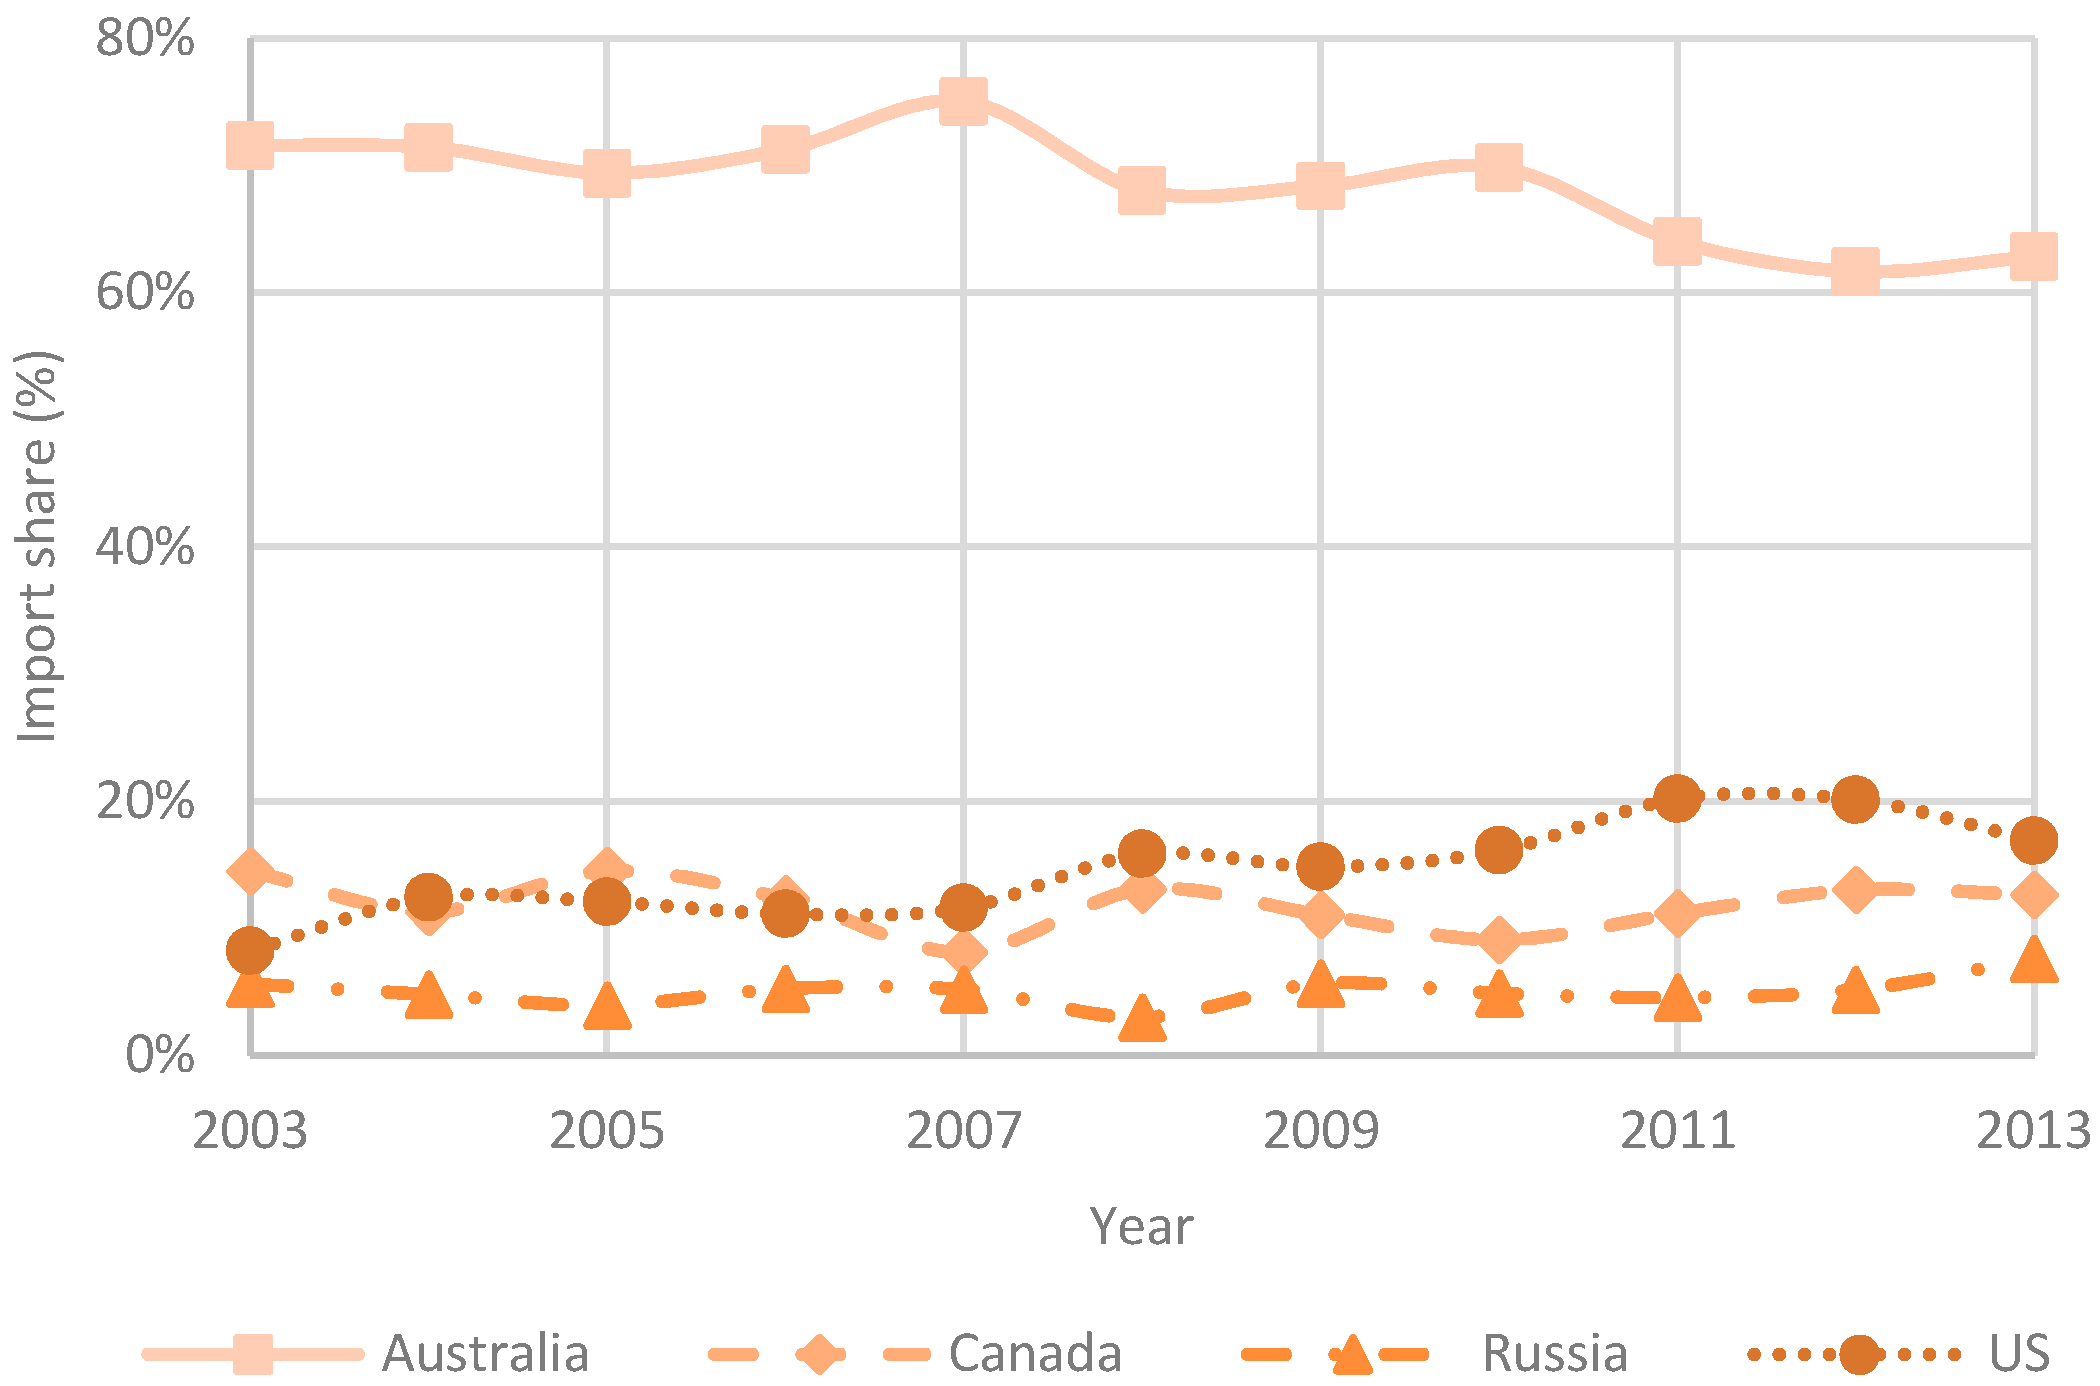
The market share development that Australian metallurgical coal producers have experienced is reversed from the Australian iron ore producers The Asian market has decreased its import reliance from Australia, supplementing it with increasing imports from the United States, and keeping steady the imports from Russia and Canada. Within Europe, another trend emerges with substantial decreases in imports from Australia and the United States, also decreasing reliance on Canada. To complement this, an increasing import trade with Russia has grown to meet demand. When both the Asian and EU markets are combined, an overall trend was graphed in
Figure 9. Australia’s market dominance has decreased and the United States has responded to supplement this decline.
The decreasing market supply share that Australian producers are experiencing globally was highlighted from analysis of supply elasticity. Production costs for metallurgical coal shows that Australia does have lower cost producing operations, however the entire higher end of the spectrum is dominated by Australian producers [
33]. It was highlighted before that few countries import metallurgical coal, and thus create an oligopsony. This market structure will only benefit importers, and Australian high cost producers can only differentiate themselves through higher quality products. Any increase in demand will be met from increases in production by countries with higher supply elasticity (such as the United States) and, hence, the Australian market has remained relatively stagnant.
Figure 9.
Asian and European Union market import share of metallurgical coal split into major exporting regions [
21].
Figure 9.
Asian and European Union market import share of metallurgical coal split into major exporting regions [
21].
5. Conclusions
In summary, the observation that metallurgical coal and iron ore are necessary to produce steel without any competing substitute ingredients, the two markets movements should theoretically positively correlate. However, over the past decade, the prices of iron ore have grown significantly whereas prices for metallurgical coal have experienced vacillating and waning growth. Similar observations have been made with respect to industry revenues.
Worldwide steel production has steadily increased at 9 percent per annum driven by growth from China. The Chinese intensity of steel use has grown over the past decade, and although it has started to slow in growth, it is yet to peak suggesting continued growth in steel production is expected. To meet this growth, worldwide demand for iron ore and metallurgical coal has increased, however, the trade of the two commodities has not increased synchronously.
Iron ore import growth worldwide, driven mainly by the Asian market, has been met with increased production and exports from the Australian iron ore producers. The Australian producers are the main suppliers into China, and Australia’s import share has slightly grown over the past decade. The main competitive country, Brazil, has not matched the substantial increase in iron ore production, and has dropped import share into the Asian market, supplemented by Africa and the Middle East. Australia also has some of the lowest production and freight costs for iron ore, rivalled only by Brazil.
This dominating share of market iron ore supply that Australia enjoys creates oligopolistic market tendencies. During the early 2000s, an informal iron ore export cartel was created within Australia for the benefit of the producing companies, however, it was met with resistance by a Chinese steelmaking import cartel. The two cartels engaged in price negotiations annually before breaking down in 2010 from growing demand pressure and newly implemented Chinese resource policies. Despite the cartel breakdowns, the oligopoly still exists, benefitting iron ore producers.
Iron ore demand growth is expected, however, the production of steel is slowing in growth per year, and will eventually peak and fall. Emphasis on increasing productivity will result in the greatest long term economic stability. With weakening iron ore prices driven by subdued demand for iron ore, companies that can produce at lowest cost will be the greatest benefactors, and will be able to continually meet any demand that is present. The benefits of these economic rents that Australian companies currently enjoy should be focused into productivity improvements, a consensus shared by Ernst and Young [
35]. Australia maintains the highest quality iron ore worldwide, and will always remain an attractive supplier. Keeping costs low will facilitate a period of economic stability, with Australia maintaining the greatest share of supply into the major Asian demand market. Future benefits will consist of large reserves and supply elasticity for positive demand shocks. The current emphasis on rapid expansion should be balanced with productivity improvements, as this saturation of supply will drive prices lower, and Brazil will be the greatest benefactor of this competition. Costs for expansions and greenfield projects will likely not be recouped, wasting the current economic rents. Brazilian iron ore producers will most likely focus on increasing iron ore output. With the ability to produce the lowest cost and freighted ore, the main objective is to increase market share and capture back some of the declining Asian market. So, whilst Australian economic rents are spent on productivity, Brazilian rents will be spent on expansion.
Contrasting the iron ore market, the metallurgical coal market was found to exhibit a reciprocating oligopsony tendency. During the 1970s, the Japanese steel industry was importing large quantities of coal from Australia, Canada, and the United States, along with iron ore from Australia and Brazil. Studies showed that the mineral economic play between the importers and exporters created a large oligopsony. This market structure has never really deteriorated, even with growing steel production worldwide. Lack of substantial demand increase, with very few large importers centralised around Asia has stymied competitive trading. China itself produces the majority of metallurgical coal it requires, and the production rate has been growing rapidly.
The remainder of metallurgical coal demand is supplied mainly through Australia and the United States. Over the past decade, Australia has not grown its production, however, the United States has, becoming the third largest producer globally. Complementing this growth has been accelerating metallurgical coal exports, and thus Australia has been declining in import share into Asia, being supplemented by the United States. The United States has primarily increased this supply with a greater flexibility to meet demand changes than that of Australian producers. With Australian production costs occupying the higher spectrum worldwide, producers lack the elasticity and competiveness required to generate sustainable revenue streams.
Australian metallurgical coal producers face different and more difficult decisions to their iron ore counterparts. Primarily the focus should be on cost cutting exercises, from production through to freight, to remain competitive in the oligopsony market. Further to this, if costs are too far entrenched and the operation is unable to lower costs sufficiently then it would be preferable to permanently shut the operation. Prices are likely to stay oppressed for the next few years, with stronger competition coming from the United States and locally within China. Any increases in demand will be met by these sources, and only a differentiated product will be able to compete successfully.


