Abstract
To address the inefficiency and data loss issues inherent in manual measurement, this study developed a full-time data extraction model for ultra-fine tailing slurry flocculation using Yolov8n. The performance of five flocculants—cationic polyacrylamide (YPAM), non-ionic polyacrylamide (FPAM), polyaluminum chloride (PAC), polymeric ferric sulfate (PFS), and a commercially used flocculant (KY)—was evaluated based on type, dosage, and pH. The model’s reliability was validated through slurry grayscale and clarification height analysis. Results indicate that the model enables automated data collection under varying lighting and viewing angles. YPAM was identified as the optimal flocculant across different pH conditions, improving the selection efficiency by 83% compared to manual methods.
1. Introduction
With the rapid development of China’s economy and construction, the scale and depth of mining have been gradually upgraded [1,2]. As the main by-product of the mining production, the efficient utilization of tailings is key in promoting the construction of green mines and achieving the “double carbon” goal. The world’s annual new tailing volume exceeds 15 billion tons, and China’s tailing storage has exceeded 60 billion tons, while the comprehensive utilization rate is less than 35% [3,4,5]. Due to the fine size of tailing particles, especially in metal tailings such as iron and copper, high surface activity, and difficulty in solid–liquid separation, flocculation and sedimentation technology has become an important method of tailing dewatering [6,7]. Flocculants can accelerate tailing sedimentation and improve the concentration efficiency. However, the traditional flocculant selection method relies on manual experience, causing problems such as low efficiency and poor data integrity, which have restricted the intelligent transformation of tailing treatment [8,9].
In the practical application process, the flocculation characteristics were affected by the slurry concentration, flocculant type, flocculant unit consumption, temperature, pH, and flocculant solution concentration [10,11,12,13,14,15,16]. The catalyst used, salinity, microorganisms present, polymer structure, and other factors can also affect flocculation properties [17,18]. Nieto et al. [19] evaluated the effects of cationic coagulants and high-molecular-weight anionic flocculants on the sedimentation characteristics of highly alkaline synthetic tailing suspensions and concluded that coagulants respond to surface charge. Bergani et al. [20] evaluated the possibility of using xanthan gum, sodium alginate, and carboxymethylcellulose for fine phosphate ores in order to improve environmental problems and found that carboxymethylcellulose had the strongest effect on the mineral surface. For iron ore tailings, Wang et al. [21] used polyaluminum chloride and polyacrylamide composite modification and found that flocculant-modified tailing sand could be converted into effective cyanobacterial bloom flocculation materials, which could be used to remove cyanobacteria and recycle waste. Boshrouyeh et al. [22] studied the energy storage behavior of the slurry using anionic polyacrylamide in a high-salinity environment and found that the sedimentation effect was increased by 60%, which effectively improved the consolidation parameters and tailing flocculation potential under saltwater conditions. The above is mainly used for the treatment of single variables, and there are relatively few studies on the difference between inorganic and organic materials as flocculants, as well as the sensitivity to pH, such as common nonionic polyacrylamide (FPAM), 90% cationic polyacrylamide (YPAM), 26% polyaluminum chloride (PAC), and polymeric iron sulfate (PFS) flocculant. Luo et al. [23] demonstrated a prototype of a novel vertical screw granulator for granulation flocculation of kaolin suspensions, designed to improve compressibility and permeability by forming dense granular aggregates.
At present, the industry generally uses the “static beaker test method” for flocculant selection and relies on manual experience and intermittent sampling and testing. A single test takes 4–6 h, and there is a height error in the manual reading of the liquid level, and there are problems of low efficiency and a high error rate [24,25,26]. Entezari et al. [27] proposed a technique to detect flocculation and provide feedback to adjust flocculant dosage and mixing conditions, but sufficient tests are lacking to validate and calibrate the results. Ruan et al. [28] proposed a flocculation kinetics model based on the population equilibrium model to simulate the polymer flocculation process of whole tailings. Liquid level height and turbidity measurements take 10 to 15 min each time, making it difficult to capture the dynamic changes during the flocculation process [29,30,31]. Meanwhile, it is impossible to simulate all factors in the laboratory to test the flocculation sedimentation characteristics, and only the key factors are used as research objects to conduct corresponding static or dynamic flocculation settling tests; that is, traditional methods often use the “single variable control method” for experimental design [32,33], which struggles to quickly reveal the interaction between various factors such as the type, dosage, and pH value of large batches of flocculant [34]. Yolov8n is an image detection, segmentation, and recognition technology that has achieved good results in many fields, such as orchard identification, pest identification, underwater pollution, and other fields [35,36,37]. In the face of high-precision detection of small targets, the proposed method can improve its versatility and achieve more accurate feature reconstruction in the case of poor recognition through optimization [38]. Following data-intensive methods like those of Wan et al. [39] for flood analysis, this study utilizes the YOLOv8n algorithm to automate the processing of observational test data. This optimization substantially lowers labor requirements and enhances measurement accuracy [40].
In this study, a new flocculation sedimentation detection method is designed by intelligent identification of the slurry area light and dark suppression and grayscale evaluation based on example segmentation, and the flocculation and precipitation effect of tailing slurry of different types and pH is tested. Through the combination of images and intelligent algorithms, it provides a basis for large-scale flocculation precipitation detection and data analysis and provides feasibility for the detection of flocculation effects of fixed-point tailings in mines.
2. Materials and Methods
2.1. Materials
The slurry used in the test is the outlet of an iron ore concentrator in Liaoning Province, China. In order to avoid long-term static precipitation of the slurry and affect the test results, the slurry is pretreated: the slurry is fully stirred with a stirrer, and the middle layer of slurry is used for the test. After testing at 25 °C, the slurry is brownish-black, with a concentration of 7.8%, a density of 0.844 kg/L, and a pH value of 7.9. A 10 mL sample of raw pulp was taken and analyzed using a Malvern Zetasizer Nano ZS910 instrument (Malvern, UK), with the zeta potential being measured three times to avoid accidental errors. The distribution of zeta potential and particle size measurement results are shown in Figure 1 and Figure 2. The raw slurry shows a negative potential with an average value of −20.1 mV, so the cationic flocculant can have a better flocculation effect through electrostatic adsorption. The particle size of tailings in the slurry was found to be distributed in the range of 2~3 μm, which belongs to extremely fine tailings. The chemical composition of the tailings was determined using XRD and XRF, and the results are shown in Figure 3. The main components are quartz and zeolite, and due to the small particle size, interaction with water will make tailing treatment more difficult.
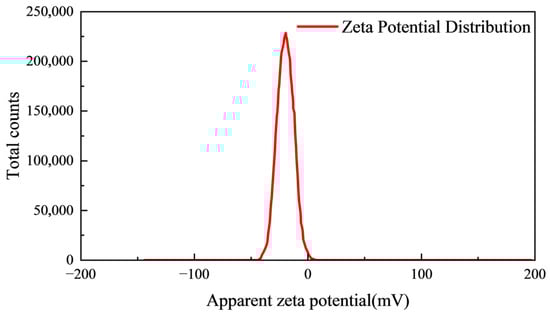
Figure 1.
Zeta potential analysis.
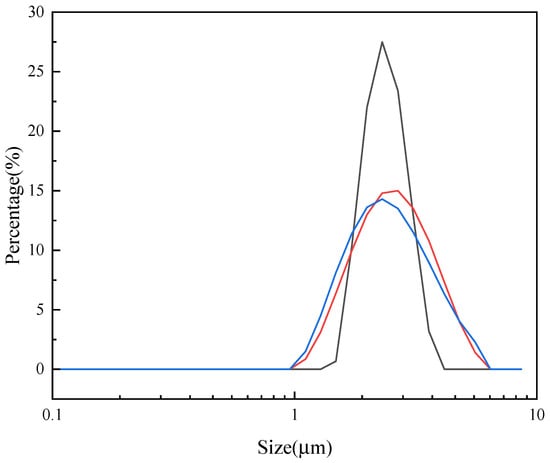
Figure 2.
Particle size distribution analysis.
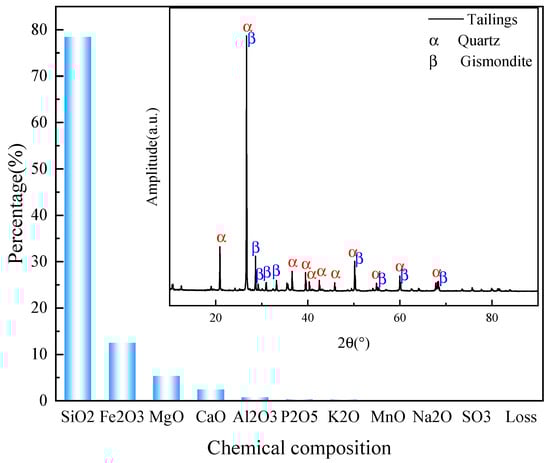
Figure 3.
XRD and XRF patterns of tailings.
Two inorganic flocculants and two organic flocculants were selected. The organic flocculants are 90% nonionic polyacrylamide (FPAM) and 90% cationic acrylamide (YPAM). The FPAM has a molecular weight of 25 million, while the YPAM has a cationic degree of 20%. The cationic degree of 20% refers to the percentage of cationic monomer units in the YPAM polymer chain, which determines its charge density and influences flocculation efficiency in wastewater treatment. The inorganic flocculants are 26% polyaluminum chloride (PAC) and polyferric sulfate (PFS). At the same time, mining flocculant (KY) is used as a comparison.
A 2 g/L aqueous solution of the flocculant was prepared by dissolving 0.80 g of the product in 400 mL of water under stirring for 20–30 min until a homogeneous colloidal state was achieved. Five independent replicates of this solution were prepared. Measured aliquots (5 mL) were taken from each replicate using a syringe for the following tests.
2.2. Experimental Methods
2.2.1. Tailing Flocculation and Settling Test
To investigate the role of intelligent data monitoring in flocculant selection, samples were prepared using different slurry concentrations (10, 20, 30, 40 mg/L) and solution pH values (6.9, 7.9, 8.9). The pH was adjusted with 0.05 mol/L HCl and NaOH standard solutions. The pH-adjusted slurry was measured out into a 200 mL stoppered graduated cylinder, brought to full volume, and placed on the video recording platform. Equal volumes of flocculant were sequentially injected and thoroughly mixed, followed by allowing the mixture to stand undisturbed. The experimental design is as described in Table 1. The camera recorded continuously at a fixed position for 20 min, documenting the entire process from placing the graduated cylinder and injecting the flocculant to the completion of flocculation.

Table 1.
Experiment design.
The slurry was injected with different flocculants in equal doses at the same pH value (the control group was not injected), and after the dosage test was completed, the pH concentration was changed and the next set of tests was carried out, as shown in Figure 4. The test was completed 12 times in the group and 3 times in the control group. Three specimens of each type were tested to avoid accidental errors.
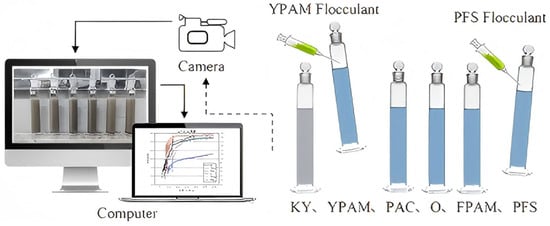
Figure 4.
Experimental flow chart.
2.2.2. Data Fusion Extraction Model Based on Yolov8n
To objectively and continuously monitor the flocculation–sedimentation process of tailing slurry, a computer vision-based automated analysis model based on Yolov8n was developed. This method processes sequential images captured during the settling test to ultimately generate a grayscale time curve that reflects the turbidity change in the supernatant, thereby quantifying the settling velocity and efficiency. The specific procedure is as follows (Figure 5 and Figure 6):
Figure 5.
pH = 7.9, inject 3 mL flocculant YPAM and PAC slurry frame changes at each stage.
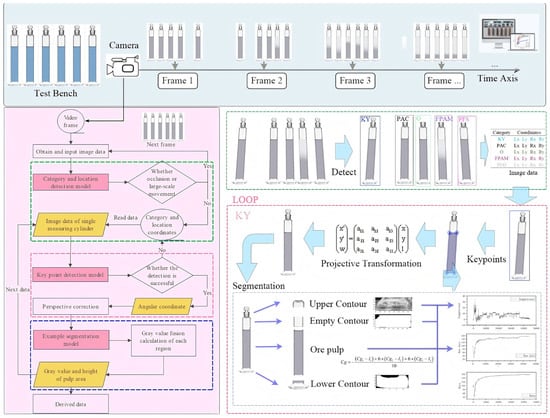
Figure 6.
Slurry settlement video data extraction process.
Cylinder Identification and Image Extraction: The model first automatically identifies and locates the target graduated cylinder within the captured scene. The image of each cylinder is then individually cropped for subsequent analysis. Images from cylinders that are occluded or have moved significantly are automatically discarded to ensure data reliability.
Geometric Image Correction: Cropped cylinder images may exhibit perspective distortion (i.e., appear tilted) due to the camera angle. To address this, the model detects key corner points of the liquid level region and uses them to geometrically correct the image, effectively “straightening” the cylinder to ensure consistent scale for all measurements.
Settling Zone Segmentation and Feature Extraction: On the corrected image, the model automatically segments the internal area of the cylinder into three distinct zones from top to bottom based on the interface position: the supernatant zone, the floc blanket interface zone, and the concentrated slurry zone. The analysis primarily focuses on the supernatant zone. The average grayscale value of this zone is calculated, serving as an indicator of the supernatant turbidity at that moment.
Data Compensation and Curve Generation: To mitigate the influence of ambient lighting fluctuations on the grayscale readings, a light-intensity compensation algorithm was applied to correct the raw data. Finally, plotting the corrected grayscale value of the supernatant against time yields the supernatant grayscale time curve. The descent rate of this curve directly indicates the performance of the flocculant.
3. Results
3.1. Multi-Process Data Detection Construction
3.1.1. Graduated Cylinder Identification and Position Detection
A total of 63 images of the flocculation process with different time periods and image sizes of 1920 × 1080 were intercepted, and the graduated cylinder was marked with a rectangular frame using labelme image marking software (Ubuntu 22.04: 4.6.0). The graduated cylinder category was labeled with the name of the flocculant (0 = KY, 1 = YPAM, 2 = PAC, 3 = O, 4 = FPAM, 5 = PFS), and a total of 347 rectangular boxes were marked. Images with six graduated cylinders account for 60% of the total dataset, with a minimum of four graduated cylinders in the image. The data includes all situations during the lid flocculation experiment. The number of marks for each flocculation dose cartridge is shown in Figure 7 and Figure 8 below. Analysis indicates that the marker boxes for each category exhibit a consistent alignment, with their positions nearly overlapping. Furthermore, these points are evenly distributed along the horizontal axis but concentrated within a narrow vertical band. The darker the color, the more samples are distributed in that interval.
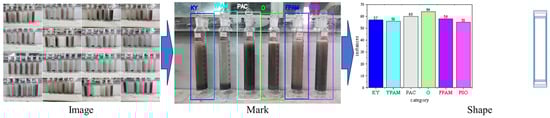
Figure 7.
Quantity chart of each category and collection of rectangular box shapes.
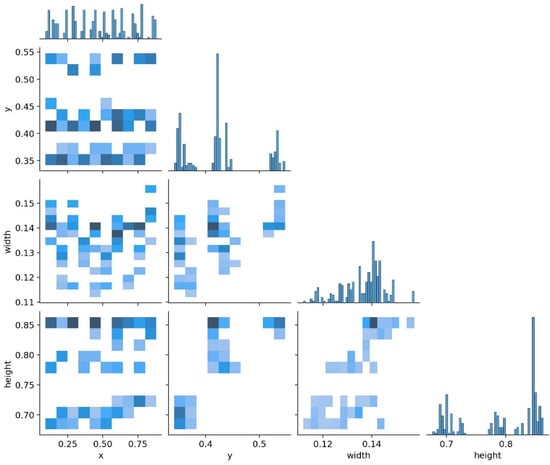
Figure 8.
Rectangular box marking site coordinate distribution. The darker the color, the more samples are distributed in that interval.
The flocculation–sedimentation process was recorded with a digital camera. To ensure robust analysis, the image dataset underwent standardized preprocessing (e.g., adjustments for lighting and scale) before being processed by a trained object detection model. Details of the image processing parameters are provided in Table 2. The model automatically identified the graduated cylinder and isolated the supernatant region, outputting its average grayscale value. This data was compiled into supernatant grayscale time curves, which quantitatively characterized the settling velocity for comparing the performance of the FPAM and YPAM flocculants.
Table 2.
Image enhancement parameter settings.
As shown in Figure 9, during the initial 50 rounds, the model showed significant fluctuations in the validation dataset, which was attributed to the lack of pre-trained weights. By about round 300, the loss function value converges and stabilizes around round 500. After 500 rounds of training, the accuracy of the model p = 0.99, the recall R = 1.0, mAP50 = 0.995, and mAP50–95 = 0.969 show that the model has high accuracy on the test set.
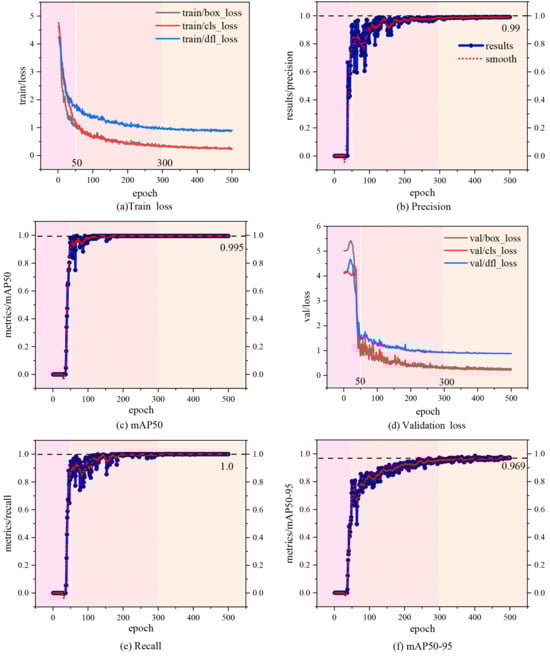
Figure 9.
Model loss and accuracy.
In the process of identifying moving graduated cylinders, occlusion will occur, and the model cannot judge it but can only judge this category within the range of pixels according to the position. The classification of the graduated cylinders was achieved by their positional order, since they shared identical specifications and fixed spacing, and they were arranged in a strict sequence per flocculant group. Therefore, the boundary of each graduated cylinder can be divided into areas, the attribution of the center point of the graduated cylinder position can be calculated, the graduated cylinder category can be determined, and the movement can be judged. The model has high position recognition ability as a whole, but the category classification ability is insufficient. This model, complementary to the multi-category detection models, was trained with the data augmentation settings specified in Table 2, with 100 rounds of training using the yolov8n-detect model. Dataset categories are identified as ‘cup’ unique, 10% dataset validation, and 10% dataset testing. By the 46th round, the loss function values converge and tend to stabilize, and after 100 rounds of training, the accuracy of the model p = 0.996, the recall R = 1.0, mAP50 = 0.995, mAP50–95 = 0.886. The image recognition effect is shown in Figure 10 and Figure 11.
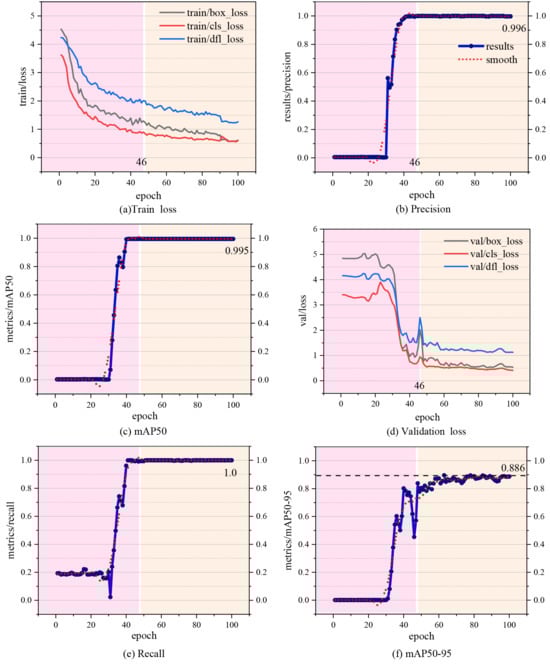
Figure 10.
Model loss and accuracy.
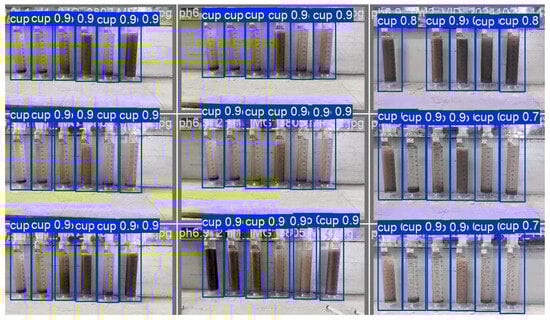
Figure 11.
Placement of graduated cylinder for a priori results.
The multi-category detection model has high precision category detection ability and lower accuracy position detection ability and serves as the global category and position at the same time, and the model will have two categories in a single graduated cylinder during the inspection process. In Figure 12, the single-category detection model has a fixed range of prior results and a higher accuracy of graduated cylinder position detection, and for local category and global position a priori service, there will be a category missing, caused by the movement of the graduated cylinder during the inspection process. This problem is caused by the occlusion caused by the picking up and placement of the graduated cylinder during the injection of flocculant into the graduated cylinder. Fusion calculation is used to replace the position of the multi-category detection model result Model1_1 ‘category-based’ with the single-category detection model result Model1_2’. If there is a position conflict between the same categories identified twice, the subframe result is discarded and the graduated cylinder injects the flocculant stage.
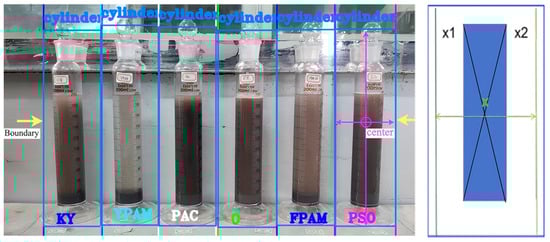
Figure 12.
Placement of graduated cylinder for a priori results.
The result of the multi-category detection model is Model1_1’.
i-Category Name, no reuse (0 = KY, 1 = YPAM, 2 = PAC, 3 = O, 4 = FPAM, 5 = PFS).
Sort the results from smallest to largest by category name and upper left coordinates, and after sorting, find the results of the same category name and replace them with small coordinate values. The model result is obtained as Model1_1’.
The single-category detection model is Model1_2’.
i-Category Name, no reuse (0 = KY, 1 = YPAM, 2 = PAC, 3 = O, 4 = FPAM, 5 = PFS).
At first, determine whether the data lengths of Model1_1’ and Model1_1’ match: if no, discard this frame; if yes, proceed with index replacement. In Model1_1’, sequentially index Mci to determine whether coordinate Mpi belongs to the same category Sci. If so, replace Mpi with Spi; otherwise, discard this frame.
3.1.2. Liquid Level Key Point Detection and Graduated Cylinder Perspective Orthodontic Model
A total of 63 images of the flocculation process with different time periods and image sizes of 1920 × 1080 were used.
In order to ensure that the tilt and point change caused by the change in the recording position of the camera during the test will not affect the slurry liquid level, a key point detection model of a single graduated cylinder image is constructed, the key points of the graduated cylinder are detected, and the deformation of the graduated cylinder image is corrected through image perspective.
In Figure 13, the image is cropped, a single graduated cylinder part is retained, and a total of 348 dataset images are obtained. The size of the dataset images is not unique; the width is between 222~305 pixels, the height is between 718~884 pixels, and the average width and height are 258,814 pixels. Use labelme for image labeling, and select the key points at the corner point boundary of the liquid surface, which are defined as up_left, up_right, down_left, and down_right. The Yolov8N-Pose model was used for 1500 rounds of training, 10% of the dataset for validation, and 10% of the dataset for testing. Since there are four key points in each input image, the recall rate and mAP are close to 1, which is not analytically significant. From the regression loss curve of key points, it can be seen that the model almost no longer changes after convergence to 0.423, and the accuracy of the model for key point recognition obviously achieves the expected effect by observing the test set recognition graph in Figure 14.
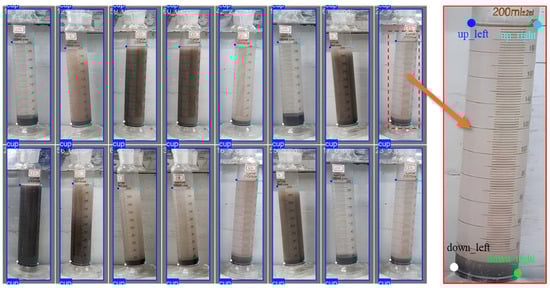
Figure 13.
Mark pattern.
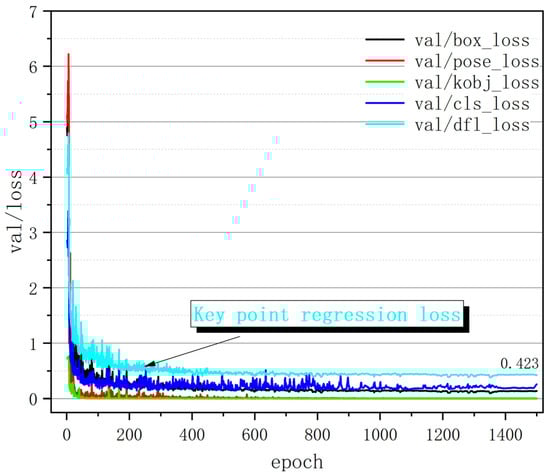
Figure 14.
Model loss results.
The source image is mapped by projection to transform from the original image plane to the new image plane.
u and v are the coordinates of the corresponding points on the left side of the original image, yielding the transformed image coordinates x and y, where . Transformation matrix can be understood in four parts, indicates a linear transformation, indicates translation, and produce perspective. Rewriting the transformation formula yields
Therefore, the transformation formula can be obtained by knowing the point corresponding to the transformation in Figure 15.
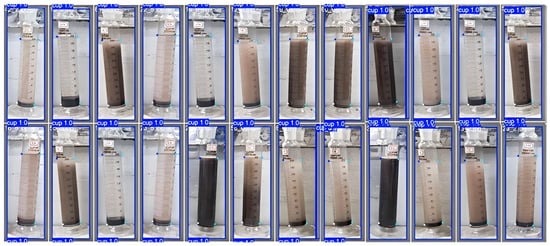
Figure 15.
Model effect.
The dataset employing liquid-level key point detection correction is used as the training dataset for this model, with 10% of the data allocated for testing and 10% for validation. For image annotation with labelme, define the upper contour, clear liquid surface area, turbid liquid surface area, and lower contour as cup_up, flow_down, flow_up, and cup_down, respectively. As there is only one graduated cylinder per image, each image constitutes a single dataset with no occlusions or missing values. The empty area is calculated with the upper contour and liquid surface elevation coordinates.
Train the model using the Yolov8n-seg model for 500 epochs, then test on 20% of the dataset. Data augmentation is identical to the keypoint model. The Figure 16 shows that the training process converges uniformly. At epoch 500, the precision p = 0.996, recall R = 1.0, mAP50 = 0.995, and mAP50–95 = 0.886.
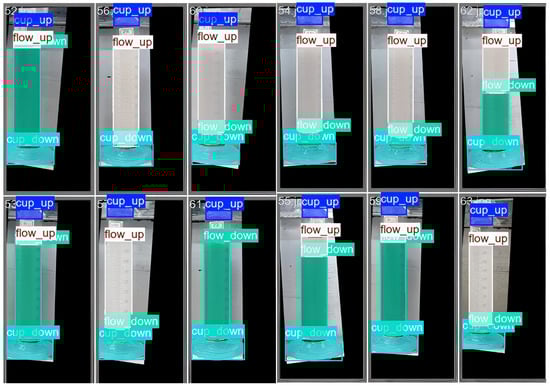
Figure 16.
Graduated cylinder area identification results.
The gray value of the contour of this part of the graduated cylinder profile is taken as one of the components in Figure 17, and the gray value of the upper contour of the graduated cylinder and the gray value component of the lower contour of the graduated cylinder are used to form a light and dark filter. The quota value for each part of the profile component represents the grayscale of the base environment of that part. After testing, the filter can largely compensate for the influence of ambient light transformation on the grayscale of the graduated cylinder, which has a crucial impact on the correctness of the data.
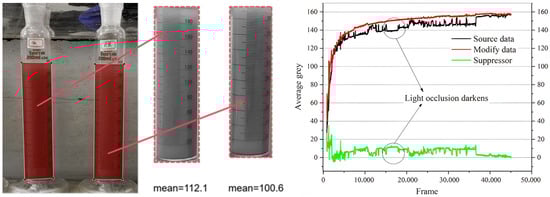
Figure 17.
Slurry grayscale data after filtering.
Cg1: Grayscale value of the upper contour of the measuring cylinder, with a reference environment I1 grayscale of 185.
Cg2: Grayscale value of the free (unfilled) contour of the measuring cylinder, with a reference environment I2 grayscale of 140.
Cg3: Grayscale value of the lower contour of the measuring cylinder, with a reference environment I3 grayscale of 165.
Where the grayscale value of the contour on the Cg1 graduated cylinder is 185 for reference environment I1; the Cg2 graduated cylinder free contour grayscale value for reference environment I2 is 140. The grayscale value of the lower profile of the Cg3 graduated cylinder is 165 in the reference environment I3. The percentile filtering method is adopted, with 240 window points and 20 percentiles, and the signal is processed.
By comparing with the on-site flocculation test data, it can be seen that the algorithm can only process it, and it has the characteristics of high efficiency and accuracy for large batches of data.
3.2. Analysis of Flocculation and Sedimentation
3.2.1. Experimental Phenomena
As shown in Figure 18, before adding flocculant, the slurry in the graduated cylinder is generally cloudy and blackish-brown. When a flocculant is added, the slurry undergoes a three-stage change. Flocculation stage: the slurry is segregated to produce flocculation, and the growth of flocs floats in the slurry and is distributed chaotically with the movement of the slurry. Sedimentation stage: the floc begins to be deposited downward under the action of gravity, the segregation spacing decreases, the upper slurry begins to clear from black-brown turbidity, and the color of the lower part deepens. Stabilization stage: as the solution stabilizes, the demarcation line gradually becomes obvious and slowly descends, the upper part of the slurry continues to be clear, and the lower part slowly deepens the color until the color and the height of the demarcation line no longer change.
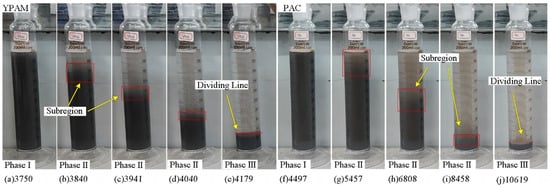
Figure 18.
Tailing solution change under 3 mL YPAM and PAC, pH = 7.9.
3.2.2. The Effect of Flocculants Under Different Dosages
Figure 19 shows the gray scale changes in the slurry with 1 mL, 2 mL, 3 mL, and 4 mL dosages of flocculant under slurry pH = 6.9. The effect of comparing the flocculants is mainly based on the adsorption capacity, supplemented by the binding ability. It can be seen that YPAM has the best performance in each group, and the average gray scale enters the stable stage in the shortest time, with good adsorption and binding ability. The KY flocculant performed well at low doses, with good binding ability and high precipitation efficiency, but at high doses, its effect was not as good as other groups and even achieved the same effect as the blank group. The adsorption capacity of FPAM is second only to KY, and the binding ability is weak. The effect of PAC was gradually prominent at a high dosage, but the adsorption capacity was still weak compared to YPAM. The effect of PSO at all concentrations was not ideal.
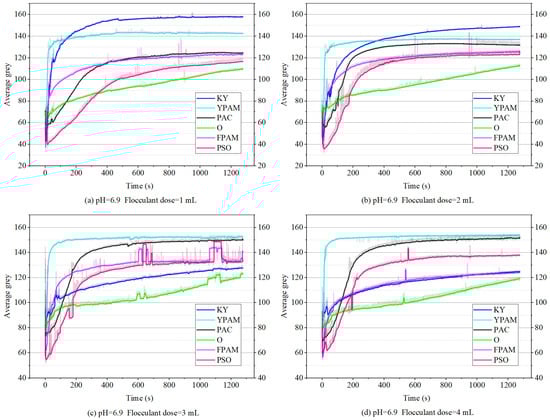
Figure 19.
The average gray level and time changes for each flocculant dosage, pH = 6.9.
With the increase in dosage, the flocculation efficiency was the highest at 4 mL, slightly higher than 3 mL. pH 7.9 is the pH value of the raw slurry, and its slurry concentration is 2.3%. Figure 20 shows the dosage of 1 mL, 2 mL, 3 mL, and 4 mL flocculant for 200 mL of slurry at pH 7.9. It can be seen that YPAM has the best performance in each group, and the performance of KY under the original pH value begins to lag behind with the increase in dosage. At a 1 mL dose, YPAM > FPAM > KY > PAC >PSO > O was the same as 1 mL at 2 mL, 3 mL, and 4 mL. With the increase in dosage, the flocculation efficiency gradually increased. Figure 21 shows the dosage of 1 mL, 2 mL, 3 mL, and 4 mL flocculant for 200 mL of slurry at pH 8.9. YPAM still performs best in each group, and KY begins to lag behind under alkaline conditions. At the dosage of 1 mL, the effects are YPAM > PAC > PSO > FPAM > KY > O, at the dosage of 2 mL, the effects are YPAM > PSO > PAC > FPAM > KY > O, and at the dosage of 3 mL, YPAM > PSO > PAC > FPAM > KY > O, respectively. At 4 mL, the effects are YPAM > PAC > PSO > FPAM > KY > O.
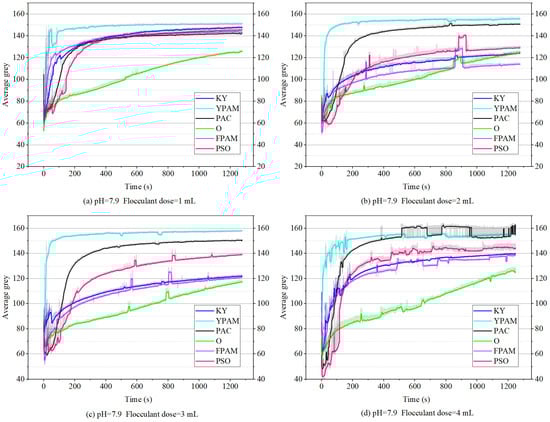
Figure 20.
The average gray level and time changes for each flocculant dosage, pH = 7.9.
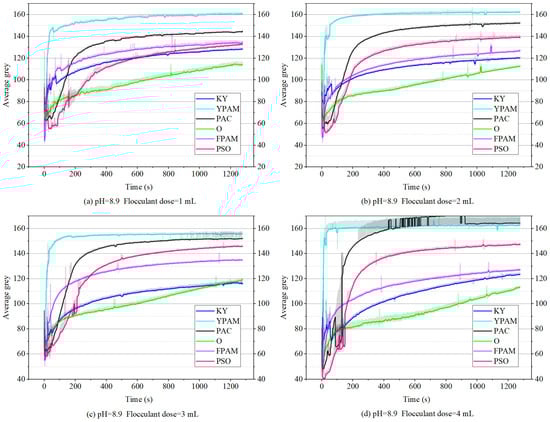
Figure 21.
The average gray level and time changes for each flocculant dosage, pH = 8.9.
3.2.3. The Effects of the Best Flocculant YPAM at Different pHs
At varying pH levels, the performance of YPAM improved with increasing dosage. The effects of different dosages under different pH conditions were compared. The onset of the third (stable) flocculation stage was defined as the smooth turning point on the curve. As shown in Figure 22a, for example, the slurry level height curve for 4 mL of YPAM at pH 6.9 began to turn and converge at 18 s, indicating entry into this stable stage. In Figure 22b, pH = 7.9, YPAM completed settling and began to converge within 17 s. In Figure 22c, pH = 8.9, the settlement is completed within 18 s and begins to converge. In YPAM, under the condition of a 4 mL dosage, the alkaline environment effect of the slurry is greater than that of the acidic environment, which is due to the fact that the colloidal particles of the slurry are alkaline and negatively charged, as well as the accumulation and sedimentation under the attraction of cations. When the solution is transformed into an acid, the negative charge of the colloidal particles of the solution is blocked by hydrogen ions, the cationic flocculant does not achieve an advantage, and the increase in the alkalinity of the solution makes the process of sedimentation faster. The final effect at pH values of 8.9 and 7.9 is the same, the precipitation is complete within 17 s, and sedimentation is complete within 40 s, so the pH value of the slurry does not need to be adjusted considering the economic benefits.
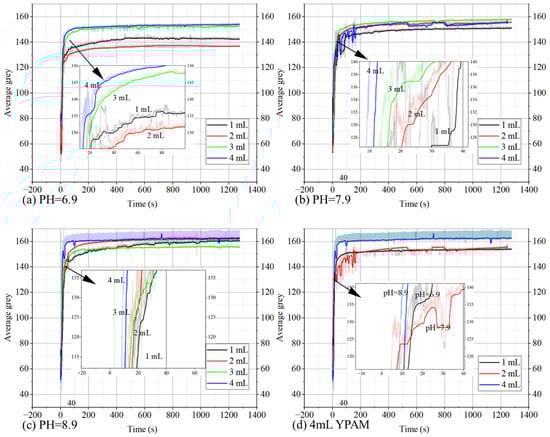
Figure 22.
The average gray level and time change for each pH value for the YPAM flocculant.
4. Discussion
Under different pH conditions, the activity differences in flocculants are primarily influenced by their charge characteristics and solution environment: YPAM, as a cationic organic flocculant, maintains excellent performance within the pH range of 6.9 to 8.9 due to its strong cationic properties, which effectively adsorb negatively charged particles and form stable aggregates through long molecular chains. KY performs well at near-neutral pH with low dosage, but its effectiveness declines as pH increases or dosage rises, likely due to charge adaptability or molecular structure becoming encapsulated or ineffective under alkaline or high-concentration conditions. As a non-ionic flocculant, FPAM primarily relies on hydrogen bonding for adsorption, resulting in an adsorption capacity less affected by pH but a weaker aggregation ability. Inorganic flocculants like PAC show gradual improvement at high dosages, as their hydrolysis products form multi-nuclear hydroxyl complexes under specific pH conditions to promote flocculation, though their adsorption rate remains inferior to YPAM. PSO consistently performs poorly, possibly due to mismatched charge compatibility or molecular configuration with the current water quality conditions. Overall, pH changes directly affect adsorption efficiency and floc stability by altering particle surface charges and flocculant molecular conformations, leading to significant variations in the performance of different flocculants.
YPAM’s long-chain polymer structure and high purity give it a stronger bridging ability. The experiment shows that YPAM can quickly form dense flocs during the settling stage through the analysis of grayscale changes in multi-volume graduated cylinders, which is characterized by a rapid decline in grayscale value and clear boundaries, indicating that suspended particles sink rapidly and shorten the settling time.
The model’s illumination adaptation and distortion correction modules ensure data reliability. The flocculation stability of YPAM in a weakly alkaline environment may be better than that of other reagents. Therefore, it still shows a consistent gray response pattern under complex lighting and video viewing angle changes.
5. Conclusions
In this study, a full-time data extraction model based on YOLOv8n was constructed for selecting flocculants for ultra-fine tailing slurry. Laboratory experiments were designed with various flocculants, dosages, and pH values. The workshop flocculant KY and four other flocculants (PAC, PSO, YPAM, and FPAM) were selected to compare slurry sedimentation effects, thereby testing the model’s performance. The optimal flocculant was identified by comparing the slurry grayscale change with the supernatant clarity height. The conclusions are as follows:
(1) A full-time data extraction model based on Yolov8n for the selection of multiple types of flocculants in ultra-fine particle size tailing slurry was constructed, which adapted to different camera perspectives, different lighting conditions, and different graduated cylinder positions.
(2) Under the conditions of 7.8% slurry concentration and pH 7.9, cationic polyacrylamide (YPAM, with a cationic degree ≥ 90%) demonstrated the best flocculation performance among the four flocculants tested.
(3) The accuracy of the flocculation results after algorithm treatment is verified, and the flocculant effect under a variety of different pH and dosage conditions has been evaluated, which provides key technical support for the detection and selection efficiency of large-scale flocculation process, which is of great significance for reducing the cost of tailing treatment and efficient development.
Author Contributions
X.Q.: Conceptualization, Methodology, Writing—review and editing. K.W.: Investigation Methodology, Formal analysis, Writing—review and editing, Writing—original draft. J.W.: Validation, Methodology, Writing—review and editing. J.H.: Methodology, Writing—review and editing. R.B.: Formal analysis, Writing—review and editing. All authors have read and agreed to the published version of the manuscript.
Funding
This research was financially supported by the National Natural Science Foundation of China (grant 52304120) (grant 52274109).
Data Availability Statement
Data will be made available on request.
Conflicts of Interest
Author Xiaofei Qiao was employed by the Shandong Gold Group Co., Ltd. The remaining authors declare that the research was conducted in the absence of any commercial or financial relationships that could be construed as a potential conflict of interest.
Abbreviations
The following abbreviations are used in this manuscript:
| FPAM | 90% nonionic polyacrylamide |
| YPAM | 90% cationic acrylamide |
| PAC | 26% polyaluminum chloride |
| KY | Mining flocculant |
References
- Wang, K.; Fu, J.; Wang, J.; Li, Y. Assessing the Hydration Behavior of Rice Husk and Shell Ashes as Supplementary Cementitious Materials during Initial Curing Stages. Constr. Build. Mater. 2025, 491, 142773. [Google Scholar] [CrossRef]
- He, Q.; Cao, S.; Yilmaz, E. Sustainable Stabilization of Sulfidic Mine Tailings Using Fly Ash and Sodium Bicarbonate: A Multiscale Analysis. Powder Technol. 2026, 467, 121573. [Google Scholar] [CrossRef]
- Adiguzel, D.; Tuylu, S.; Eker, H. Utilization of Tailings in Concrete Products: A Review. Constr. Build. Mater. 2022, 360, 129574. [Google Scholar] [CrossRef]
- Luo, T.; Yi, Y.; Liu, F.; Sun, Q.; Pan, X.; Hua, C. Early-Age Hydration and Strength Formation Mechanism of Composite Concrete Using Molybdenum Tailings. Case Stud. Constr. Mater. 2022, 16, e01101. [Google Scholar] [CrossRef]
- Fu, J.-X.; Wang, K.; Wang, J. Internal Pore Evolution and Early Hydration Characterization of Fly Ash Cement Backfill. J. Build. Eng. 2023, 72, 106716. [Google Scholar] [CrossRef]
- Jiao, H.; Chen, W.; Wu, A.; Yu, Y.; Ruan, Z.; Honaker, R.; Chen, X.; Yu, J. Flocculated Unclassified Tailings Settling Efficiency Improvement by Particle Collision Optimization in the Feedwell. Int. J. Miner. Metall. Mater. 2022, 29, 2126–2135. [Google Scholar] [CrossRef]
- Ishigami, T.; Karasudani, T.; Onitake, S.; Shirzadi, M.; Fukasawa, T.; Fukui, K.; Mino, Y. Effect of Liquid Volume Fraction and Shear Rate on Rheological Properties and Microstructure Formation in Ternary Particle/Oil/Water Dispersion Systems under Shear Flow: Two-Dimensional Direct Numerical Simulation. Soft Matter 2022, 18, 4338–4350. [Google Scholar] [CrossRef]
- Zhang, C.; Liu, R.; Chen, M.; Li, J.; Wang, X.; Liu, Y.; Zhu, Z.; Wang, M.; Fan, F. Influence of the Flocculation Effect on the Rheological Properties of Cement Slurry. Powder Technol. 2022, 398, 117118. [Google Scholar] [CrossRef]
- Chen, Q.; Tao, Y.; Zhang, Q.; Qi, C. The Rheological, Mechanical and Heavy Metal Leaching Properties of Cemented Paste Backfill under the Influence of Anionic Polyacrylamide. Chemosphere 2022, 286, 131630. [Google Scholar] [CrossRef]
- Aldajani, M.; Alipoormazandarani, N.; Fatehi, P. Two-Step Modification Pathway for Inducing Lignin-Derived Dispersants and Flocculants. Waste Biomass Valoriz. 2022, 13, 1077–1088. [Google Scholar] [CrossRef]
- Lu, C.; Xu, Z.; Zhang, Y.; Dong, B. Rapid and Clean Dewatering of Dredged Sediment via Coupling of a Two-Step Flocculation and Geotextile Filtration. Chem. Eng. J. 2024, 480, 147604. [Google Scholar] [CrossRef]
- Dixon, D.V.; Soares, J.B.P. Flocculating Oil Sands Tailings with Dual Anionic/Cationic Polymers: Dose and Charge Density Effects. Can. J. Chem. Eng. 2024, 102, 88–101. [Google Scholar] [CrossRef]
- Xu, R.; Zou, W.; Wang, T.; Huang, J.; Zhang, Z.; Xu, C. Adsorption and Interaction Mechanisms of Chi-g-P(AM-DMDAAC) Assisted Settling of Kaolinite in a Two-Step Flocculation Process. Sci. Total Environ. 2022, 816, 151576. [Google Scholar] [CrossRef] [PubMed]
- Yang, Y.; Liu, X.; Zhang, L.; Guo, M. Two-Step Shear Flocculation for High-Efficiency Dewatering of Ultra-Fine Tailings. Minerals 2025, 15, 176. [Google Scholar] [CrossRef]
- Zeng, H.; Shi, C.; Huang, J.; Li, L.; Liu, G.; Zhong, H. Recent Experimental Advances on Hydrophobic Interactions at Solid/Water and Fluid/Water Interfaces. Biointerphases 2015, 11, 018903. [Google Scholar] [CrossRef]
- Ali, A.; Meena, B.V.; Shah, N.A.; Kaushik, T.; Dolkar, T.; Ghoroi, C.; Dutta, A. Deploying a Molecular Copper Catalyst for Efficient Degradation of Commercial and Industrial Dyes under Practical Conditions. Environ. Sci. Water Res. Technol. 2023, 9, 2219–2225. [Google Scholar] [CrossRef]
- Dixon, D.V.; Soares, J.B.P. Using Polymer Adsorption Data and a Population Balance Model to Estimate How Polymer Dosage Affects the Flocculation of Oil Sands Tailings. Can. J. Chem. Eng. 2023, 101, 6126–6134. [Google Scholar] [CrossRef]
- Gao, R.; Zhou, K.; Zhang, J.; Guo, H.; Ren, Q. Research on the Dynamic Characteristics in the Flocculation Process of Mineral Processing Tailings. IEEE Access 2019, 7, 129244–129259. [Google Scholar] [CrossRef]
- Nieto, S.; Piceros, E.; Reyes, E.; Ramos, J.; Robles, P.; Jeldres, R. Structural Analysis of Aggregates in Clayey Tail ings Treated with Coagulant and Flocculant. Minerals 2025, 15, 627. [Google Scholar] [CrossRef]
- Bergani, A.; Ait-Khouia, Y.; El-Bahi, A.; Hakkou, R.; Benzaazoua, M.; Taha, Y. Advancing Sustainable Dewatering of Fine Phosphate Tailings: Evaluating Xanthan Gum, Sodium Alginate, and Carboxymethyl Cellulose as Flocculating Agents. Water Res. 2025, 280, 123526. [Google Scholar] [CrossRef]
- Wang, Y.; Zhu, W.; Wang, R.; Li, G.; Wang, X.; Zhong, J. Cyanobacterial Bloom Removal by Rapid Flocculation and Settling Using Modified Iron Tailings Sand Materials. J. Ocean. Limnol. 2025, 43, 1501–1514. [Google Scholar] [CrossRef]
- Boshrouyeh, B.; Edraki, M.; Baumgartl, T.; Costine, A.; Quintero Olaya, S.; Lepková, K.; Dwivedi, D. Impact of Inline Polyacrylamide Polymer Flocculation on the Mechanical and Hydrological Properties of Saline Tailings. Minerals 2024, 14, 1180. [Google Scholar] [CrossRef]
- Luo, Y.; Ekanayake, N.I.K.; Amini, N.; Moon, E.M.; Scales, P.J.; Stickland, A.D. Improved Suspension Dewaterability Using a Novel Pelleting Flocculation Device. Miner. Eng. 2026, 235, 109762. [Google Scholar] [CrossRef]
- Huang, Y.; Chen, J.; Wang, C. Optimization of Flocculation Settling Parameters of Whole Tailings Based on Spatial Difference Algorithm. Symmetry 2019, 11, 1371. [Google Scholar] [CrossRef]
- Liu, D.; Edraki, M.; Fawell, P.; Berry, L. Improved Water Recovery: A Review of Clay-Rich Tailings and Saline Water Interactions. Powder Technol. 2020, 364, 604–621. [Google Scholar] [CrossRef]
- Gungoren, C.; Unver, I.K.; Ozdemir, O. Investigation of Flocculation Properties and Floc Structure of Coal Processing Plant Tailings in the Presence of Monovalent and Divalent Ions. Physicochem. Probl. Miner. Process. 2020, 56, 747–758. [Google Scholar] [CrossRef]
- Entezari, I.; Rivard, B.; Vajihinejad, V.; Wilson, W.G.; Soares, J.B.P.; Fisseha, B.; Beier, N. Monitoring Tailings Floc culation Performance Using Hyperspectral Imagery. Can. J. Chem. Eng. 2019, 97, 2465–2471. [Google Scholar] [CrossRef]
- Ruan, Z.; Wu, A.; Buerger, R.; Betancourt, F.; Ordonez, R.; Wang, J.; Wang, S.; Wang, Y. A Population Balance Model for Shear-Induced Polymer-Bridging Flocculation of Total Tailings. Minerals 2022, 12, 40. [Google Scholar] [CrossRef]
- Sasar, M.; Johnston, C.T.; Kaminsky, H.; Santagata, M. Oscillatory Rheometry to Characterize Polymer Flocculation of Fluid Fine Tailings. Rheol. Acta 2021, 60, 457–479. [Google Scholar] [CrossRef]
- Yin, S.; Hou, Y.; Yang, S.; Chen, X. Study on Static and Dynamic Flocculation Settlement Characteristics of Fine Tailings Slurry and Influence of Flocculant on Strength of Fine Tailings Backfill. Case Stud. Constr. Mater. 2022, 17, e01525. [Google Scholar] [CrossRef]
- Quezada, G.R.; Ayala, L.; Leiva, W.H.; Toro, N.; Toledo, P.G.; Robles, P.; Jeldres, R.I. Describing Mining Tailing Flocculation in Seawater by Population Balance Models: Effect of Mixing Intensity. Metals 2020, 10, 240. [Google Scholar] [CrossRef]
- Shi, Y.; Zheng, B.; Lai, W.; Sheng, J.; Peng, L.; Qi, H.; Zhou, J. Ultrasonic-Enhanced Flocculation and Sedimentation of Lead-Zinc Tailings: Mechanisms and Efficiency Improvements. Ultrasonics 2025, 156, 107751. [Google Scholar] [CrossRef] [PubMed]
- Panda, L.; Biswal, S.K.; Venugopal, R.; Mandre, N.R. Investigation of the Mechanism for Selective Flocculation Process Using Natural Iron Ore Tailings. Metall. Res. Technol. 2020, 117, 102. [Google Scholar] [CrossRef]
- Costine, A.D.; Vajihinejad, V.; Botha, L.; Fawell, P.D.; Soares, J.B.P. Aggregate Structures Formed by Hyper branched Functionalized Polyethylene (HB f PE) Treatment of Oil Sands Tailings. Can. J. Chem. Eng. 2019, 97, 99–102. [Google Scholar] [CrossRef]
- Xie, Z.; Liu, W.; Li, Y.; Du, J.; Long, T.; Xu, H.; Long, Y.; Zhao, J. Enhanced Litchi Fruit Detection and Segmentation Method Integrating Hyperspectral Reconstruction and YOLOv8. Comput. Electron. Agric. 2025, 237, 110659. [Google Scholar] [CrossRef]
- Li, H.; Yuan, W.; Xia, Y.; Wang, Z.; He, J.; Wang, Q.; Zhang, S.; Li, L.; Yang, F.; Wang, B. YOLOv8n-WSE-Pest: A Lightweight Deep Learning Model Based on YOLOv8n for Pest Identification in Tea Gardens. Appl. Sci. 2024, 14, 8748. [Google Scholar] [CrossRef]
- Ma, S.; Liu, Y.; Zhang, Y. Fabric Defect Detection Based on Improved Lightweight YOLOv8n. Appl. Sci. 2024, 14, 8000. [Google Scholar] [CrossRef]
- Yi, W.; Yang, J.; Yan, L. Research on Underwater Small Target Detection Technology Based on Single-Stage USSTD-YOLOv8n. IEEE Access 2024, 12, 69633–69641. [Google Scholar] [CrossRef]
- Wan, J.; Xue, F.; Shen, Y.; Song, H.; Shi, P.; Qin, Y.; Yang, T.; Wang, Q.J. Automatic Segmentation of Urban Flood Extent in Video Image with DSS-YOLOv8n. J. Hydrol. 2025, 655, 132974. [Google Scholar] [CrossRef]
- Liu, Q.; Jiang, R.; Xu, Q.; Wang, D.; Sang, Z.; Jiang, X.; Wu, L. YOLOv8n_BT: Research on Classroom Learning Behavior Recognition Algorithm Based on Improved YOLOv8n. IEEE Access 2024, 12, 36391–36403. [Google Scholar] [CrossRef]
Disclaimer/Publisher’s Note: The statements, opinions and data contained in all publications are solely those of the individual author(s) and contributor(s) and not of MDPI and/or the editor(s). MDPI and/or the editor(s) disclaim responsibility for any injury to people or property resulting from any ideas, methods, instructions or products referred to in the content. |
© 2025 by the authors. Licensee MDPI, Basel, Switzerland. This article is an open access article distributed under the terms and conditions of the Creative Commons Attribution (CC BY) license.