Abstract
In the early Paleoproterozoic, the Earth’s atmosphere–ocean system shifted from a reducing to an oxidizing state, triggering the extensive deposition of banded iron formations (BIFs) in the Siderian period (2.5–2.3 Ga). As a key sedimentary formed during the hydrospheric oxidation stage, BIFs are expected to preserve abundant microbial fossils or organic carbon. However, evidence for contemporaneous widespread biological activity remains limited. This paper focuses on C-O isotopes and the trace element geochemistry of the 2.5 Ga Jining BIF to constrain the redox state of paleo-oceans and associated biogeochemical cycling during BIF deposition. The δ13Ccarb values of the BIF samples range from −18.6‰ to −9.6‰, with an average of −12.7‰, exhibiting a notable negative value, and TOC contents (0.04–0.19 wt.%) are extremely low. This suggests the incorporation of oxidized organic carbon to pore water via ferrihydrite reduction during early diagenesis process. The globally negative δ13Ccarb value of BIFs and iron-rich carbonates reflect enhanced biological activity at ~2.5 Ga. REE patterns reveal negative Ce/Ce*(SN) and Eu/Eu*(CN) anomalies, and the presence of primary hematite mesobands together indicate that the Jining BIF records a redox transition in seawater from reducing to oxidizing conditions.
1. Introduction
The early Earth’s composition contained a large number of highly reduced minerals, resulting in an atmosphere that was initially free of O2 [1,2]. The transition to a permanently oxygenated atmosphere, known as the Great Oxidation Event (GOE), marks a pivotal turning point in Earth’s history [3,4]. The rise in atmospheric oxygen fundamentally changed the chemistry of surface environments and the nature of Earth’s habitability. The early Paleoproterozoic witnessed the rapid development of Superior-type BIFs, magnesite, phosphate, graphite deposits, as well as extensive red beds, evaporites, and stromatolite-bearing carbonates [5,6,7,8]. Rare earth elements (REEs) in chemical sediments of the North China Craton (NCC) also show a distinct pattern across the 2.3 Ga threshold [9,10]. In 1989, the International Commission on Stratigfraphy recommended 2.3 Ga as the boundary between the Siderian and the Rhyacian periods on the Precambrian Chronostratigraphic Chart [11,12]. Notably, the Siderian period is characterized by the widespread deposition of banded iron formations (BIFs).
BIFs are chemical sedimentary rocks with a total iron content greater than 15%, and are primarily composed of alternating silica (chert) and iron-rich mineral (magnetite and hematite) bands [13,14]. The earliest BIFs in the world formed at ~3.8 Ga in the Isua greenstone belt, with continuous deposition from 3.6 to 1.8 Ga, followed by a significant decline after 1.8 Ga, and a subsequent reappearance during the Neoproterozoic Snowball Earth [15]. The world’s super-large BIFs predominantly formed in the Siderian period (2.5–2.3 Ga), including the Kursk BIF of Russia, Cauê BIF in Brazil, Kuruman and Griquatown BIFs in South Africa, Hamersley BIF in Australia, and Krivoy Rog BIF in Ukraine [15,16].
The formation of BIFs is generally attributed to the oxidation of dissolved ferrous iron (Fe2+) to insoluble ferric iron (Fe3+) in seawater [17]. The explosive deposition of BIFs during the Siderian period reflects a major transition of the marine environment from reducing to oxidizing conditions, marking a significant increase in oxygen levels and an enhancement of biological activity [8,18]. However, BIFs worldwide are essentially devoid of fossils and consistently exhibit low total organic carbon (TOC) contents. For example, TOC values in the Dagushan BIF of the Anshan Group range from 0.05 to 0.11 wt.% [19], whereas those of the Yuanjiacun BIF in the Lüliang Group range from 0.01 to 0.34 wt.% [20]. In the Songshan Group, TOC values in the Songshan iron formation samples range from 0.02 to 0.05 wt.% [21]. Similarly, BIF samples from the Hamersley Basin in Australia, the Labrador region in Canada, and the Yilgarn Craton in South Africa all exhibit average TOC contents of less than 0.5 wt.% [22,23]. This paradox raises an intriguing question: why is there such limited geochemical or fossil evidence for biological activity during the peak of BIF deposition in the Paleoproterozoic?
The Jining BIF, located on the western part of Shandong Province, China (Figure 1), is the only known super-large BIF in this region. It formed around 2.5 Ga [18] and is characterized by the presence of abundant siderite and ankerite. In this study, we use carbon and oxygen isotopes coupled with major and trace element geochemistry to trace the signature of the hydrosphere oxidation and assess its potential links to biological processes.
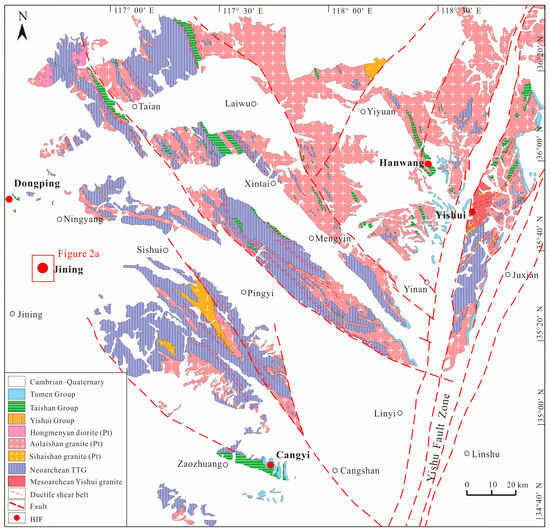
Figure 1.
Precambrian regional geological map of western Shandong province (modified after [24]).
2. Geological Background
2.1. Regional Geology
The Shandong Province is located on the eastern margin of the NCC, with the NNE-trending Yishu Fault Zone cutting across its central region and dividing it into two major tectonic units: the Eastern Shandong Unit and the Western Shandong Unit. The Western Shandong Unit is further subdivided by the Liaokao Fault (i.e., the Liaocheng–Lankao Fault) and the Qiguang Fault (i.e., Qihe–Guangrao Fault), separating it into the Western Shandong Rise (WSR) and the North China Depression (NCD) [25]. The study area is located within the WSR, where early Precambrian sequences are well developed, including the Jining, Taishan, and Yishui groups (Figure 1). This region is one of the most important BIF distribution areas in China, hosting the super-large Jining BIF as well as numerous medium-to-large size BIFs, such as the Dongping, Cangyi, Shanxian, Hanwang, and Yangzhuang BIFs (Figure 1).
The Jining BIF is situated on the WSR (Figure 1) and is hosted within the Yandian Formation of the Jining Group, which has experienced greenschist facies metamorphism. The Jining Group is a completely concealed stratigraphic unit and buried at depths exceeding 900 m below the surface [26]. According to drilling data, the stratigraphy of the Jining Group, from bottom to top, is subdivided into the Zhaicun Formation, Yandian Formation, and Hongfusi Formation (Figure 2b). These three formations are all in conformable contacts. The Zhaicun Formation consists mainly of metamorphosed volcanic and volcaniclastic rocks, including meta-andesitic tuff, meta-andesitic breccia tuff, and meta-tuffaceous sandstone, interlayered with meta-sandstone and phyllite, with minor meta-dacite [26,27]. The Yandian Formation is an iron-rich unit, which is primarily composed of BIFs, chlorite phyllite, chlorite–sericite phyllite, carbonaceous phyllite, and meta-sandstone, locally interbedded with meta-dacite or meta-tuffaceous clastic rocks [26,27]. The Hongfusi Formation consists mainly of fine-grained meta-clastic sedimentary rocks, including chlorite–sericite phyllite, sericite phyllite, carbonaceous phyllite, meta-sandstone, and meta-conglomerate, with thin graphite layers locally developed within the carbonaceous phyllite [26,27].
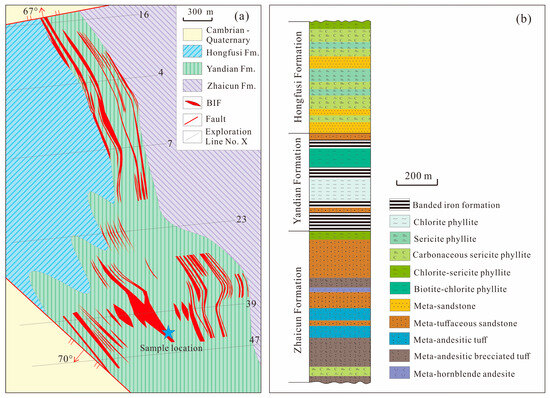
Figure 2.
(a) Geological map for top surface of the Jining Group (modified after [26]); (b) column of the Jining Group (modified after [26]).
The formation age of the Jining Group remains controversial. The K-Ar dating of meta-dacite yields an age of 1709.5 Ma [28], while the Rb-Sr isochron of phyllite constrains an age of 1753.5 Ma [29], both of which are interpreted as the metamorphic ages of the Jining Group. Wang et al. [30] obtained an upper intercept age of 2561 ± 15 Ma for meta-felsic volcanic and a youngest detrital zircon age (closest to the concordia line) of 2609 ± 13 Ma for chlorite–sericite phyllite. They concluded that the Jining Group was deposited no earlier than 2609 Ma, with its formation most likely occurring at 2561 ± 15 Ma. Wan et al. [31] reported a weighted average age of 2522 ± 7 Ma from seven zircons near the concordia line in meta-felsic volcanic rock, suggesting that the Jining Group formed in the Neoarchean. Song et al. [32] reported the youngest magmatic zircon age of 2487 ± 7 Ma and an upper intercept age of 2522 ± 7 Ma in the meta-dacite of the Zhaicun Formation, suggesting that volcanic activity spanned the late Neoarchean to early Paleoproterozoic. Zhang [33] obtained an upper intercept age of 2602 ± 5 Ma and a weighted average age of 2602 ± 2 Ma from 35 zircons in a phyllite from the Yandian Formation, concluding that the Jining BIF formed after 2.6 Ga, most likely between 2.56 and 2.52 Ga.
However, it should be noted that most coarse-grained magmatic zircons in volcanic rocks generally crystallized in magma chambers prior to eruption, were captured from the wall rocks along magma conduits, or inherited from magmatic source regions; therefore, only the youngest magmatic zircon ages can constrain the depositional age of the strata. Similarly, detrital zircons are transported from source areas, so the youngest detrital zircon age provides the maximum age for the strata. Recent statistical analyses show that the reliably youngest magmatic zircon from the Yandain Formation yields an age of 2505 ± 29 Ma [18], indicating that the Jining BIF in the Yandian Formation formed at around 2.5 Ga, consistent with the global peak of BIF deposition.
2.2. Geology of the Jining BIF Deposit
The Jining BIF is situated in the WSR and is mainly hosted within the Yandian Formation (Figure 2a). Due to mining administration, the deposit is subdivided into the north Yandian (or Hongfusi) and the south Zhaicun (or Tuntou) mining areas [33]. The Jining BIF is a concealed orebody, with a burial depth exceeding ~1 km [34].
A total of 11 iron orebodies have been identified within the Yandian mining area. These orebodies strike between 333° and 355°, dipping toward SWW at angles of 56–65°. The Yandian deposit has a resource of 622 million tons (Mt), with an avgerage TFe (total iron) grade of 28.42% and mFe (magnetic iron) of 20.96% [34]. In contrast, the Zhaicun mining area has a total of 44 orebodies. Orebodies one to eight strike between 342° and 354° and dip SSW at angles ranging from 58° to 65°. Meanwhile, orebodies 9 to 44 strike between 326° and 359° and dip SWW at angles from 54° to 70° [35]. The Zhaicun iron deposit hosts 976 Mt of iron ore resources, with an average TFe grade of 31.09% and mFe of 22.44% [35]. The wall rocks of Jining BIF are predominantly composed of chlorite–sericite phyllite, magnetite-bearing chlorite–sericite phyllite, and calcite–sericite phyllite.
Magmatic rocks are generally undeveloped in this area [34,35]. In the Yandian mining area, fine-grained diorite intrudes along the layer without observable disruption to ore bodies [34,35]. In the Zhaicun mining area, diorite and diabase also intrude along the layer and occur as veins. Diabase are relatively small and have not affected the ore layers, whereas diorite are large in scale and locally disrupted the orebodies.
3. Sampling and Analytical Methods
3.1. Sample Description
Samples for this study were collected from the Zhaicun mining area. Based on mineral assemblages, the ores can be classified into four major types: hematite facies, carbonate–magnetite facies, magnetite–carbonate facies, and silicate facies.
The hematite facies sample (Figure 3a,b) is dominant by hematite (35–45%), quartz (25–30%), and sericite (5–15%), with minor magnetite, minnesotaite, and carbonates and the main ore type is banded as a sericite–quartz–hematite. Hematite generally occurs as coarse grains (10–70 μm), partly replacing magnetite and forming martite, while some hematite appears as platy or flaky crystals with finer grains (<15 μm).
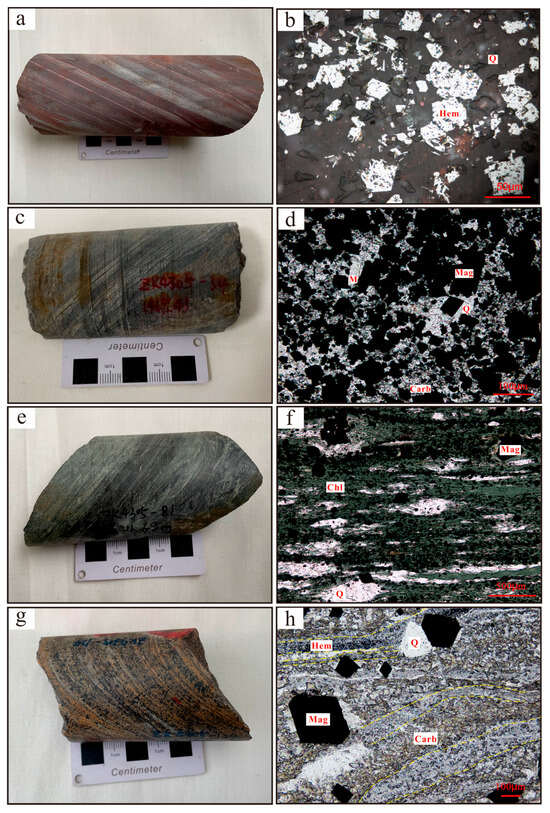
Figure 3.
(a,b) Hematite facies ores; (c,d) carbonate–magnetite facies ores; (e,f) silicate-facies ores; (g,h) magnetite–carbonate facies ores. (Abbreviations: Hem = hematite, Q = quartz, Mag = magnetite, Carb = carbonate, Chl = chlorite, M = minnesotaite).
The carbonate–magnetite facies sample (Figure 3c,d) consists primarily of magnetite (50–60%), quartz (10–25%), and carbonates (10–20%), with minor chlorite, sericite, apatite, minnesotaite, and pyrite. The dominant ore types are banded as quartz–siderite–magnetite and siderite–quartz–magnetite.
The most typical feature of the silicate-facies BIF (Figure 3e,f) is that chlorite and sericite together exceed 15%, accompanied by magnetite (30–40%), quartz (15–20%) and carbonate (10–25%), with minor biotite, apatite, minnesotaite, hematite, and pyrite. The typical ore types are banded in a chlorite–quartz–magnetite rock and sericite–quartz–magnetite rock.
The mineral assemblage of magnetite–carbonate facies BIFs (Figure 3g,h) is dominated by carbonates (30–40%), magnetite (20–30%), and quartz (20–35%), with minor hematite, chlorite, sericite, minnesotaite, and apatite. The main ore type is banded quartz–magnetite–siderite rock.
A distinctive feature of the Jining BIF is the abundant occurrence of carbonate minerals, including siderite and ankerite, as well as the common presence of fine-grained (<3 μm) anhedral to subhedral hematite microbands (Figure 3h). These microbands are discontinuous and cut by recrystallized magnetite and quartz (Figure 3h), suggesting that they are of primary sedimentary origin.
The hematite facies BIFs in the Jining deposit are restricted to areas near the unconformity. In this BIF, hematite commonly replaces magnetite and siderite, and goethite is commonly observed. These features suggest that the hematite is formed during late-stage oxidation weathering. This process resulted in significant mineralogical alteration and element remobilization and redistribution, thereby overprinting the primary geochemical signatures of the samples. Consequently, in this study, 14 representative samples from drill core ZK4305 were selected for whole-rock major, trace, and rare earth element analyses, as well as C-O isotope analysis. These include five carbonate–magnetite facies samples, five silicate-facies samples, and four magnetite–carbonate facies samples.
3.2. Analysis Methods
All the bulk rock samples were first powdered to less than 200 mesh in an agate mill. Major elements analysis were determined at Peking University by X-ray fluorescence spectrometry (XRF) using a Primus IV (Rigaku Corporation, Tokyo, Japan). Samples were oven-dried at 105 °C for 12 h, after which approximately 1.0 g of each dried sample was placed in a porcelain crucible and heated in a resistance furnace at 980 °C for 20 min. After cooling to room temperature, the samples were reweighed to determine the loss on ignition (LOI). For XRF measurements, about 5 g of each sample was placed in an aluminum cup lined with boric acid, pressed into pellets under a pressure of 30 MPa, and mounted in sample holders for analysis. The analytical precision for major elements was better than 5% (RSD).
Trace elements analysis were determined at Guangzhou Tuoyan Analytical Technology Co., Ltd., Guangzhou, China. For trace elements and REEs, approximately 50 mg powder was added to 1 mL HNO3 and 1 mL HF in a Teflon beaker. The trace element and REE concentrations were determined by inductively coupled plasma mass spectrometry (ICP-MS) (iCAP RQ, Thermo Fisher Scientific, Bremen, Germany), with a precision better than 5% for most trace elements and REEs.
Carbon and oxygen isotope, as well as total organic carbon (TOC) content determinations, were also performed at Guangzhou Tuoyan Analytical Technology Co., Ltd., Guangzhou, China. For isotopic analysis, 100 μg of the sample powder was weighed into a reaction flask and flushed with high-purity helium (He) by penetrating the septa using a double-hole needle at a flow rate of 100 mL/min. Six drops of 100% phosphoric acid were then added to the reaction flask, and the mixture was allowed to react at 70 °C for about 72 h. The duration of the reaction is due to the Fe-rich carbonate composition of samples. After equilibrium, the produced CO2 was separated from other impurity gases through a chromatographic column and analyzed on mass spectrum MAT253 (Thermo Fisher Scientific, Bremen, Germany). The δ13C and δ18O values reported are relative to the V-PDB standard with an analytical precision of ±0.1‰. For TOC content analysis, 0.25–0.50 g powder was treated with 10% HCl to remove inorganic carbon. The dried sample was then combusted in a high-temperature oxygen stream system to completely convert the organic carbon into CO2. TOC content was determined using a Vario cube TOC-isoprime100 (Thermo Fisher Scientific, Waltham, MA, USA), with an analytical precision better than 0.2%. The conversion between V-SMOW and V-PDB uses the following formula [36]:
δ18OV-SMOW = 1.03091 × δ18OV-PDB + 30.91
The results of whole-rock major and trace elemental compositions, C-O isotopic, and TOC compositions are listed in Supplementary Tables S1–S3, respectively.
4. Results
4.1. Major Elements
The Jining BIF samples are mainly composed of SiO2 (38.76–62.40 wt.%, avg. 47.59 wt.%) and Fe2O3T (23.09–46.50 wt.%, avg. 35.37 wt.%), with subordinate amounts of Al2O3 (1.90–10.74 wt.%, avg. 5.57 wt.%), MgO (0.52–2.04 wt.%, avg. 1.21 wt.%), and CaO (0.48–2.95 wt.%, avg. 1.46 wt.%). Other oxides occur in relatively low concentrations, including K2O (0.10–2.41 wt.%, avg. 1.05 wt.%), Na2O (0.01–2.13 wt.%, avg. 0.55 wt.%), TiO2 (0.06–0.34 wt.%, avg. 0.20 wt.%), P2O5 (0.05–0.26 wt.%, avg. 0.15 wt.%), and MnO (0.02–0.08 wt.%, avg. 0.05 wt.%). In addition, the LOI of the Jining BIF is relatively high, ranging from 1.6 to 11.34 wt.%, with an average of 6.56 wt.%.
The carbonate–magnetite facies BIFs are characterized by the highest Fe enrichment, with Fe2O3T ranging from 37.06 to 46.50 wt.% (avg. 41.18 wt.%) and correspondingly lower SiO2 contents ranging from 38.76 to 49.93 wt.% (avg. 44.43 wt.%). In contrast, Al2O3 (1.90–5.71 wt.%, avg. 4.35 wt.%) and TiO2 (0.06–0.19 wt.%, avg. 0.14 wt.%) are distinctly lower than in other facies, indicating a limited input of detrital material. MgO, CaO, and K2O contents range from 0.52 to 1.36 wt.% (avg. 1.04 wt.%), 0.92 to 2.74 wt.% (avg. 1.45 wt.%), and 0.05 to 1.35 wt.% (avg. 0.99 wt.%), respectively. Overall, the Fe2O3 content in this facies is significantly higher than the others, primarily controlled by magnetite enrichment. The SiO2, MgO, CaO, K2O, and LOI are moderate, indicating the co-occurrence of carbonate and silicate minerals at intermediate levels, which is consistent with the observations under the microscope.
The silicate-facies BIFs are distinguished by the highest Al2O3 (4.67–10.74 wt.%, avg. 7.21 wt.%), MgO (0.84–2.04 wt.%, avg. 1.47 wt.%), and TiO2 (0.14–0.34 wt.%, avg. 0.25 wt.%) contents, indicating a strong influence from detrital material and the enrichment of chlorite and sericite, consistent with microscope observations. Fe2O3T contents are relatively lower (23.40–39.07 wt.%, avg. 30.30 wt.%), and SiO2 ranges from 42.39 to 62.40 wt.%, avg. 51.91 wt.%. CaO contents range from 1.25 to 2.95 wt.% (avg. 1.90 wt.%). In sample 81, the silicate minerals are predominantly chlorite, corresponding to the highest MgO content, while K2O and Al2O3 contents are relatively low. Samples 57 and 134 are dominated by sericite, with notably elevated K2O and Al2O3 levels.
The magnetite–carbonate facies BIFs contain Fe2O3T ranging from 28.39 to 40.60 wt.% (avg. 34.44 wt.%) and SiO2 from 41.45 to 51.50 wt.% (avg. 46.14 wt.%). Al2O3 (4.57 to 5.78 wt.%, avg. 5.06 wt.%) and TiO2 (0.17 to 0.24 wt.%, avg. 0.20 wt.%) are moderately enriched, but still lower than in silicate facies. MgO and CaO contents range from 1.03 to 1.18 wt.% (avg. 1.12 wt.%) and 0.48 to 1.48 wt.% (avg. 0.95 wt.%), respectively. This facies shows the higest LOI contents (8.83 to 11.34 wt.%, avg. 10.11 wt.%), indicating a high proportion of carbonates. The relatively low MgO and CaO contents further suggest that siderite is the dominant carbonate mineral, accompanied by minor ankerite, which is consistent with petrographic observations.
4.2. Trace Elements and REEs
All REEs plus Y (REY) data are normalized to the values of Post-Archean Australian Shale (PAAS, subscript SN) [37]. REE anomalies are calculated using the following formulas: La/La*(SN) = LaSN/(3PrSN − 2NdSN); Ce/Ce*(SN) = CeSN/(2PrSN − NdSN); Pr/Pr*(SN) = 2PrSN/(CeSN + NdSN); Eu/Eu*(SN) = 2EuSN/(SmSN + GdSN); Gd/Gd*(SN) = GdSN/(2TbSN − DySN); and Y/Y*(SN) = 2Y/(DySN + HoSN) [38]. The degree of light to heavy REE fractionation is expressed by the (Pr/Yb)SN ratio.
The ΣREY contents of the carbonate–magnetite facies BIF samples range from 17.95 to 69.07 ppm, with an average of 49.79 ppm. The La/La*(SN) values range from 0.67 to 1.04 (avg. 0.88), Y/Y*(SN) ranges from 0.90 to 1.23 (avg. 1.03), Gd/Gd*(SN) spans from 0.85 to 1.06 (avg. 0.96), Ce/Ce*(SN) varies from 0.77 to 0.93 (avg. 0.88), and Eu/Eu*(SN) ranges from 1.51 to 1.62 (avg. 1.57). The (Pr/Yb)SN ratios vary between 0.52 and 0.77 (avg. 0.63) and the Y/Ho ratio ranges between 25.59 and 32.23 (avg. 28.26). Large-ion lithophile elements (LILEs) exhibit variable abundances, with Rb contents of 20.91–54.78 ppm (avg. 35.40 ppm), Sr of 55.72 to 83.47 ppm (avg. 69.05 ppm), and Ba of 125.38 to 285.44 ppm (avg. 212.53 ppm). High field strength elements (HFSEs) include Nb contents ranging from 0.5 to 2.21 ppm (avg. 1.47 ppm), Zr from 12.57 to 36.47 ppm (avg. 24.80 ppm), Hf from 0.36 to 1.12 ppm (avg. 0.76 ppm), and Th from 0.44 to 1.98 ppm (avg. 1.30 ppm).
The ΣREY contents of silicate-facies BIF samples range from 44.20 to 73.93 ppm (avg. 54.28 ppm). RAAS-normalized REY patterns display La/La*(SN) values of 0.75–0.94 (avg. 0.86), Y/Y*(SN) of 0.94–1.04 (avg. 1.00), Gd/Gd*(SN) of 0.98–1.01 (avg. 0.99), and Ce/Ce*(SN) of 0.86–0.92 (avg. 0.89). A moderately positive Eu anomaly is observed, with Eu/Eu*(SN) values ranging from 1.36 to 1.57 (avg. 1.49). The (Pr/Yb)SN ratios vary from 0.69 to 1.08 (avg. 0.86), and the Y/Ho ratios fall within the 26.19 to 28.01 (avg. 27.33) range. LILEs and HFSEs are relatively enriched compared to magnetite facies, with Rb contents of 5.39–55.65 ppm (avg. 37.82 ppm), Sr of 63.79–118.71 ppm (avg. 88.67 ppm), Ba of 34.78–786.14 ppm (avg. 286.49 ppm), Nb of 1.11–3.23 ppm (avg. 1.99 ppm), Zr of 32.89–99.53 ppm (avg. 52.67 ppm), Hf of 0.98–2.94 ppm (avg. 1.58 ppm), and Th of 1.01–3.00 ppm (avg. 2.02 ppm).
The magnetite–carbonate facies BIF samples exhibit ΣREY values ranging from 39.68 to 58.01 ppm, with an average of 46.02 ppm. The ratios of La/La*(SN) fall between 0.80 and 0.91, averaging 0.84; Y/Y*(SN) ranges from 1.00 to 1.07, with an average of 1.03; Gd/Gd*(SN) values span from 0.97 to 1.00, averaging 0.98; Ce/Ce*(SN) is between 0.87 and 0.90, with an average of 0.88; and Eu/Eu*(SN) ranges from 1.27 to 1.70, averaging 1.46. The (Pr/Yb)SN ratios vary from 0.62 to 0.90, with an average of 0.74, while the Y/Ho ratio ranges from 27.12 to 29.48, averaging 27.98. For LILEs, Rb content varies from 9.65 to 52.28 ppm, with a mean value of 33.39 ppm; Sr content spans from 43.38 to 117.04 ppm, averaging 73.08 ppm; and Ba ranges from 54.37 to 272.93 ppm, averaging 177.15 ppm. In terms of HFSEs, Nb varies from 0.93 to 1.50 ppm, with an average of 1.23 ppm; Zr ranges from 28.62 to 39.13 ppm, averaging 34.25 ppm; Hf ranges from 0.85 to 1.17 ppm, with an average of 1.01 ppm; and Th ranges from 0.71 to 1.90 ppm, averaging 1.15 ppm.
Overall, all three types facies BIFs consistently display PAAS-normalized pronounced negative Ce anomalies, depletion of LREEs relative to HREEs, and positive Eu anomalies (Figure 4). These samples are futher characterized by elevated and variable LILE and HFSE concentrations, with the silicate-facies BIFs showing the strongest enrichment.
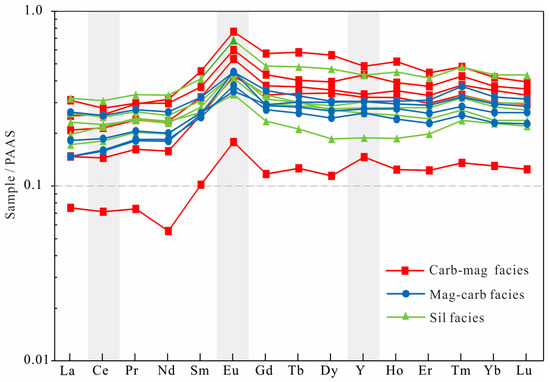
Figure 4.
PAAS-normalized REY pattern of the Jining BIF (Carb-mag: carbonate–magnetite facies; Mag-carb facies: magnetite–carbonate facies; and sil facies: silicate facies).
4.3. C-O Isotopes
The carbonate–magnetite facies BIF samples show δ13C values ranging from −16.2‰ to −11.3‰, with an average of −13.5‰, δ18O values from 13.6‰ to 14.6‰ (avg. 14.0‰), and TOC contents of 0.04–0.12 wt.% (avg. 0.08 wt.%). The δ13C values of silicate-facies BIFs range from −18.6‰ to −10.6‰, with an average of −13.1‰, while δ18O values vary between 12.1‰ and 14.7‰, averaging 13.8‰. The TOC content ranges from 0.06 to 0.19 wt.%, with a mean value of 0.14 wt.%. The magnetite–carbonate facies BIFs yield δ13C values of −15.4‰ to −9.6‰ (avg. −11.2‰), δ18O values of 12.9 to 15.0‰ (avg. 14.3‰), and TOC contents of 0.07 to 0.09 wt.% (avg. 0.08 wt.%).
Despite mineralogical differences, all facies are characterized by strongly negative δ13C and δ18O values compared to typical marine carbonates (Figure 5), and have extremely low TOC contents. Moreover, the δ18O values vary within a relatively narrow range, and the δ13C and δ18O plots show an almost paralled trend along the δ13C axis (Figure 5).
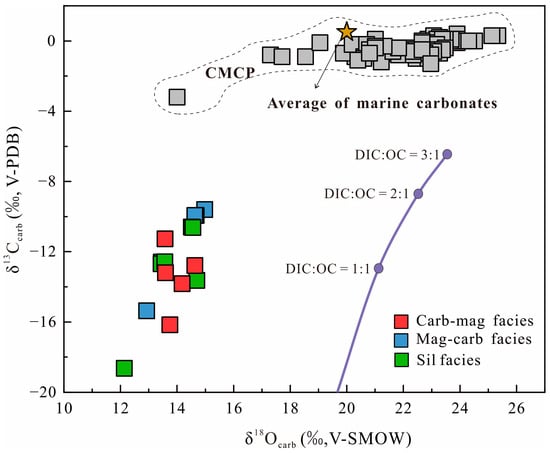
Figure 5.
δ18Ocarb vs. δ13Ccarb plot for the samples of the Jining BIF (the purple line represents the modeled carbon and oxygen isotopic values corresponding to different mixing ratios of dissolved inorganic carbon (DIC) and oxidized organic carbon (OC); the gray square data of the Neoarchean Campbellrand–Malmani carbonate platform (CMCP) in South Africa from [39]).
5. Discussion
5.1. Detrital Contamination
BIFs are marine chemical sediments supported by the predominance of iron oxides and silica, with generally low concentrations of Al2O3, MgO, and TiO2. However, not all BIFs are pure chemical sediments, as many BIFs have been variably influenced by terrestrial detrital input during deposition [21,40,41,42].
Since Al2O3, TiO2, some HFSEs (e.g., Nb, Ta, Ti, Zr, and Hf), LILEs (e.g., Rb, Cs, Sr, Ba, and Pb), and transition metals (e.g., Sc and V) have limited mobility in seawater, their abundances and correlations are commonly used as geochemical tracers for detrital contamination in BIFs. For instance, the enrichment of Zr, Rb, Sr, Hf, and Y generally indicates felsic material contributions, while elevated Cr, Ni, Co, Sc, and V contents are typically associated with mafic detrital inputs [43,44]. The Y/Ho ratio of the Post-Archean average shale is approximately 27, and the values for continental source rocks and chondrites range from 26 to 28, while normal seawater and marine sediments usually have higher Y/Ho ratios, ranging from 43 to 80 [38,41,45]. Therefore, when marine sediments are contaminated by terrigenous detrital material, their Y/Ho ratios will decrease significantly.
The Jining BIF samples show notably high concentrations of trace elements including Rb (5.39–55.65 ppm; avg. 35.69 ppm), Sr (43.38–118.71 ppm, avg. 77.21 ppm), Ba (34.78–786.14 ppm, avg. 228.84 ppm), Zr (12.57–99.53 ppm, avg. 37.45 ppm), Th (0.44–3.00 ppm, avg. 1.52 ppm), and Hf (0.36–2.94 ppm, avg. 1.12 ppm). In addition, Al2O3 exhibits strong positive correlations with TiO2, Zr, and Hf (Figure 6a–c), as well as between Hf and Zr (Figure 6d). These characteristics support the presence of detrital material contamination during BIF deposition. Furthermore, the Y/Ho ratios of the Jining BIF samples range from 25.59 to 32.23, with an average of 27.85, are comparable to those of chondritic and continental crustal sources, providing additional evidence for the input of terrestrial detritus. In contrast, the total REE (TREE) shows weak correlations with TiO2 (Figure 6e), Zr (Figure 6f), Hf (R2 = 0.16), and Al2O3 (R2 = 0.32), indicating that REEs were only minimally affected by detrital contamination. The absence of significant correlations between MgO and Cr or Ni (Figure 6g,h) suggest that the detrital components in the Jining BIF were mainly derived from felsic continental crust, with only minor contributions from mafic detritus.
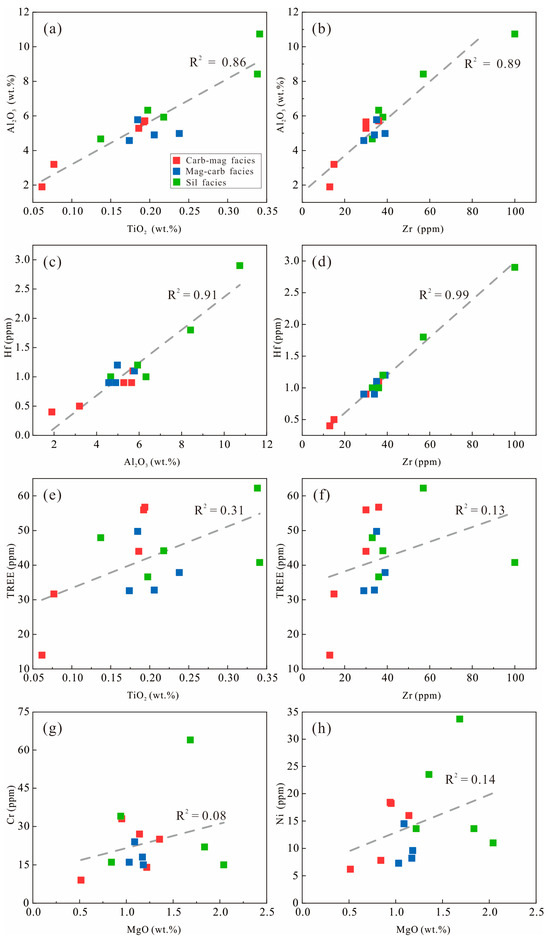
Figure 6.
Covariant relationship between (a) Al2O3 and TiO2, (b) Al2O3 and Zr, (c) Al2O3 and Hf, (d) Zr and Hf, (e) TiO2 and TREE, (f) Zr and TREE, (g) MgO and Cr, and (h) MgO and Ni for the Jining BIF.
Distinct differences are observed among BIF facies. In Jining BIF, the silicate-facies samples exhibit higher concentrations of Al2O3, TiO2, and MgO, indicating a stronger influence of terrestrial detrital input. Furthermore, the contents of incompatible trace elements (Th, U, Zr, Hf, Nb, Ta, Pb, Sr, and Ba) are markedly higher in silicate-facies samples than in other facies, further confirming more intense detrital contribution.
5.2. Depositional Environment and Type of the Jining BIF
The REEs are particularly useful as geochemical tracers to understand the deposition of BIFs, because of their immobility during diagenesis and metamorphism process [46,47,48]. The REE patterns in marine sediments, particularly those of cerium (Ce) and europium (Eu), are commonly used to reconstruct the redox conditions of ancient seawater. Although the Jining BIF samples show some degree of terrigenous detrital contamination, no significant correlations are observed between REEs and typical detrital indicators such as Al2O3, TiO2, Zr, and Hf (Figure 6e,f). Furthermore, the Ce/Ce* (SN), and Eu/Eu*(SN) ratios also exhibit no clear relationship with Al2O3 and TiO2 contents (all R2 < 0.19), suggesting that the BIF samples have largely preserved their primary REE distribution patterns from deposition.
Under reducing conditions, Ce primarily exists as Ce3+, behaving similarly to other trivalent REEs and thus showing no significant Ce anomaly. In contrast, under oxidizing conditions, Ce3+ is oxidized to Ce4+, which is then efficiently scavenged from seawater by adsorption onto iron–manganese oxides, organic matter, and clay particles. This process results in the decoupling of Ce from other REEs and results in a relative depletion of Ce in seawater. Therefore, oxic seawater is typically characterized by a pronounced negative Ce anomaly, whereas such anomalies are absent under suboxic to anoxic environments [41,49]. In addition, in stratified seawater, the reductive dissolution of Fe-Mn particles beneath the redoxcline can lead to the development of positive Ce anomalies in the underlying sediments [49].
Since Ce anomalies can be influenced by La anomalies, Bau and Dulski [41] proposed a Ce/Ce* versus Pr/Pr* discrimination diagram to identify true negative Ce anomalies. As illustrated in Figure 7, BIF samples exhibit pronounced negative Ce anomalies. This suggests that seawater, during the deposition of the Jining BIF, was in an oxidizing state.
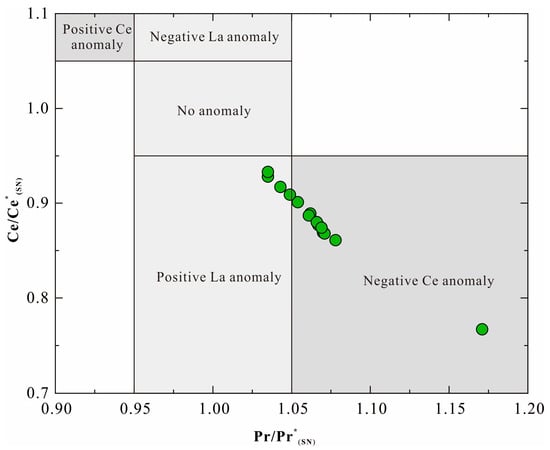
Figure 7.
Plot of Ce and Pr anomalies normalized to PAAS to the samples of the BIF (modified after [41]).
Compared with the Archean, positive Eu/Eu*(SN) anomalies in Paleoproterozoic BIFs are generally less pronounced, always interpreted as reflecting a transition of hydrothermal systems from high to lower temperatures [23,50]. However, Eu anomalies may also be influenced by the redox state of seawater [9,10,51]. Europium can occur as both divalent (Eu2+) and trivalent (Eu3+), whereas the other REEs (except Ce) exist exclusively in the trivalent ions (R3+). According to the soft and hard acid–base (SHAB) theory [52], both Eu3+ and other R3+ ions are considered as hard acids and, thus, exhibit similar chemical properties. Under oxidizing conditions, Eu3+ is the dominant species. In such an environment, the primary aqueous anions, including OH−, CO32−, SO42−, and NO3, act as hard base ligands that easily form stable complexes with Eu3+ and other R3+, promoting their precipitation from seawater. However, Eu2+ remains largely in solution as a free ion due to its low reactivity with these hard base ligands. Consequently, sediments deposited in oxidizing environments are typically characterized by a negative Eu anomaly. In contrast, under reducing conditions, Eu2+ is more stable and easily forms complexes with soft base ligands such as HS−, S2−, SCN−, CN−, S2O32−, CO, and CH4, facilitating its removal from seawater via precipitation. Meawhile, R3+ and a small portion of Eu3+ remain in seawater as free ions because they cannot effectively bind with these soft ligands. As a result, sediments formed under reducing conditions typically exhibit positive Eu anomalies.
Tang et al. [51,53] compared Eu anomalies in chemical sediments from different geological periords and reported that under oxidizing conditions, chondrite-normalized (subscript CN, [54]) sediments typically exhibit pronounced negative Eu anomalies, with Eu/Eu*(CN) < 1 (corresponding to Eu/Eu*(SN) < 1.53), while under reducing conditions, Eu/Eu*(CN) > 1 (corresponding to Eu/Eu*(SN) > 1.53). In this study, Eu/Eu*(SN) values of Jining BIF smaples range from 1.26 to 1.65, with an average of 1.47, and Eu/Eu*(CN) samples range from 0.81 to 1.06, with an average of 0.95. This futher supports that seawater during the deposition of the Jiining BIF was transitioning from a reducing to an oxidizing state.
The ore of the Jining BIFs contains abundant carbonate minerals, including siderite and ankerite. In addition, the occurrence of primary hematite bands, coupled with a pronounced negative Ce anomaly, suggests deposition under relatively oxidizing conditions, which is consistent with the characteristics of Superior-type BIFs. The CaO/(CaO + MgO) ratio in chemical sediments is commonly used to evaluate the contribution of hydrothermal fluids, while fluids derived from mid-ocean ridge or active vent systems through reactions between basalt and seawater typically exhibit ratios as high as 0.8 [55,56]. In contrast, the Jining BIF samples yield CaO/(CaO + MgO) ratios ranging from 0.29 to 0.84, with an average of 0.53, indicating deposition from distal to mid-ocean ridges or hydrothermal vents and only with minor hydrothermal activity influence. Geochemical data reveal elevated concentrations of Al2O3, TiO2, and incompatible elements (Zr, Hf, Nb, Rb, Sr, and Ba), indicative of significant terrigenous felsic detritus input. These suggest that the Jining BIF likely formed in a passive continental margin setting. Moreover, the Eu/Eu*(SN) values (1.26–1.65, avg. 1.47) of Jining BIF samples fall within the range typical of Superior-type BIFs, and below the threshold (>1.8) commonly observed in Algoma-type BIFs [50]. In summary, the mineral assemblages, trace elements and REE signatures, and depositional environment all support classification of the Jining BIF as Superior-type.
5.3. Mechanism and Implications of Negative δ13Ccarb and δ18Ocarb Values
Marine carbonates from the Phanerozoic generally exhibit a δ13C value of 0.5 ± 2.5‰ [57]. In the Jining BIF, siderite is the predominant carbonate mineral. The carbon isotope fractionation factor between siderite and HCO3−(aq) is 0.5 ± 0.2‰, while that between calcite and HCO3−(aq) is 0.94 ± 0.06‰ at room temperature [58,59]. Therefore, siderite precipitating in equilibrium with seawater should yield similar δ13C values to those of marine carbonates. However, the Jining BIF samples analyzed in this study display pronounced negative δ13C values, ranging from −18.6‰ to −9.6‰, with an average of −12.7‰. These values overlap with those reported by He et al. [35] for seven BIF samples, which ranged from −15‰ to −6.4‰, averaging at −9.9‰. Such negative δ13C values in BIF carbonates can be attributed to (1) carbonates directly precipitating from a hydrothermal seawater mixture fluid bearing mantle-derived dissolved inorganic carbon (DIC) with a δ13C of −7‰ [35,60,61,62]; (2) authigenic precipitates from porewater in sediments facilitated by the oxidation of organic carbon [19,63,64] or the anaerobic oxidation of methane (AOM) [63,65]; (3) precipitation from seawater-derived DIC and expression of a kinetic isotope effect (KIE) associated with siderite growth [66,67,68]; and (4) later hydrothermal fluid alteration [69].
The δ13C values obtained in the Jining BIF (−18.6‰ to −9.6‰, avg. −12.7‰) are significantly lower than those of mantle-drived hydrothermal fluids (−5–−7‰, [70]) and also exceed the fractionation (~8‰) that KIEs can always produce. Therefore, mantle-derived carbon sources or hydrothermal alteration alone cannot explain the magnitude of the nagative carbon values recorded in these samples.
More importantly, based on fractionation factors determined at room temperature by Carothers et al. [71] and Kim and O’Neil [72], if calcite and siderite precipitated from the same fluid, the δ18O values of siderite should be approximately 4‰ higher than those of calcite. However, the δ18O values of the Jining BIF samples in this study range from 12.1‰ to 15.0‰, which are much lower than those of typical marine carbonates (20 ± 4.2‰, [73]). This suggests that the oxygen isotopes of BIF carbonates are not in equilibrium with seawater. Furthermore, Jiang et al. [68,74] noted that siderite crystallizes at rates nearly ~seven orders of magnitude slower than calcite under comparable solution saturation, and that the high supersaturation threshold required for siderite precipitation was difficult to achieve in the Archean ocean. These all indicate that direct precipitation of siderite from seawater was uncommon. Although KIEs can account for negative δ13C values [68], they cannot explain the negative δ18O values documented in the Jining BIF.
The combined carbon and oxygen isotope values imply that, besides DIC and oxygen-derived from seawater, an additional carbon and oxygen source with low δ13C and δ18O must have been incorporated during the early diagenesis process. The two most plausible mechanisms for supplying such a source are the oxidation of organic carbon or methane.
Methane has been considered as an important greenhouse gas in the Archean, and metal-driven AOM would introduce a nagative δ13C source (CH4 + 8Fe(OH)3 + 15H+ → HCO3− + 8Fe2+ + 21H2O) [65]. Methanogens and anaerobic methane-oxidizing archaeaes rely on metal cofactors such as nickel (Ni), cobalt (Co), and zinc (Zn), for electron transport and catalysis [65,75]. In the Jining BIF, Ni contents range from 6.24 to 33.73 ppm (avg. 14.40 ppm), Co from 2.5 to 11.43 ppm (avg. 6.07 ppm), and Zn from 10.35 to 50.83 ppm (avg. 28.05 ppm). The relatively low concentrations suggest that the AOM was unlikely to have provided a significant amount of low δ13C.
Given the limited role of the AOM, oxidation of organic carbon emerges as the more plausible explanation. The genesis of BIFs is widely attributed to the oxidation of Fe2+ in seawater, leading to the formation of ferric oxyhydroxides (ferrihydrite, Fe(OH)3). This oxidation process generally requires biological involvement, either directly or indirectly [17]. In the water column, ferric oxyhydroxides could adsorb organic matter and subsequently settle onto the seafloor [76]. During early diagenesis, reduction in ferric oxyhydroxides by organic matter could release isotopically light carbon into porewater, as illustrated by the following reaction: CH3COO− + 8Fe(OH)3 → 8Fe2+ + 2HCO3− + 15OH− + 5H2O [77].
In this process, the TOC content of sediments progressively decreases, and the HCO3− derived from the oxidation of organic matter mixes with marine DIC and oxygen, causing synchronous decreases in both δ13C and δ18O of carbonate minerals precipitating from porewater. This oxidation could proceed either through dissimilatory iron reduction (DIR) [64,78] or through the thermochemical reduction (170 °C and 1.2 kbar) [79]. However, since thermochemical reduction usually form spherical siderite [79], which has not been observed in the Jining BIF, the most plausible formation mechanism is DIR.
Assuming that the δ13Csw value of Archean seawater’s DIC was approximately 0‰ [64] and that δ13Corg was −26‰ [57], the relative proportions of these two end-members can be estimated using the following mass balance equation [23]: [DIC]carb δ13Ccarb = [DIC]org δ13Corg + [DIC]sw δ13Csw. The terms [DIC]carb, [DIC]org, and [DIC]sw correspond to the flux of DIC from carbonate precipitation, oxidation of organic carbon, and seawater, respectively. The proportion of oxidized organic carbon in the Jining BIF ranges from 0.37 to 0.72, with an average value of 0.49.
The δ18OV-SMOW of seawater is assumed to be 0‰, = 30‰ [80], = 26‰ [71], = 0‰ [81], and = −1‰ [82]. We also calculated the carbon and oxygen isotope compositions under different mixing ratios of DIC and organic carbon using the method of [64]. The δ13CV-PDB and δ18OV-SMOW values in the Jining BIF show a clear positive correlation, closely following the modeled trend (Figure 5 purple line). Meanwhile, the TOC content remains low further supports the hypothesis of oxidation of organic carbon by ferrihydrite through DIR.
However, the δ18OV-SMOW values in all Jining BIF samples are ~8‰ lower than theoretical values overall (Figure 5). The relatively narrow range of δ18OV-SMOW (variation of 2.8‰) implies that significant overprinting by later fluid alteration is unlikely. The most plausible explanation is regional metamorphism. The δ18OSid-final of siderite formed through metamorphic recrystallization can be expressed as
δ18Osid-intial represents the oxygen isotope value of siderite formed through DIR (Figure 5); δ18OSW represents the oxygen isotope composition of the fluid, assumed to be mainly derived from seawater (δ18OV-SMOW = 0‰, [83]); f represents the water/rock ratio (W/R); and α is the temperature-dependent fractionation factor between siderite and seawater; is defined as 1000 lnα, which can be expressed as [71]
Jiao et al. [27] suggested that the metamorphic temperature of the Jining Group ranges from 350 °C to 500 °C. In this study, the oxygen isotope of metamorphic recrystallization siderite was modeled under different water/rock (W/R) ratios at metamorphic temperatures of 350 °C and 500 °C (Figure 8). The results indicate that during metamorphism, the observed oxygen isotope values can be reproduced when the W/R ratio ranges from 0.48 to 1.02.
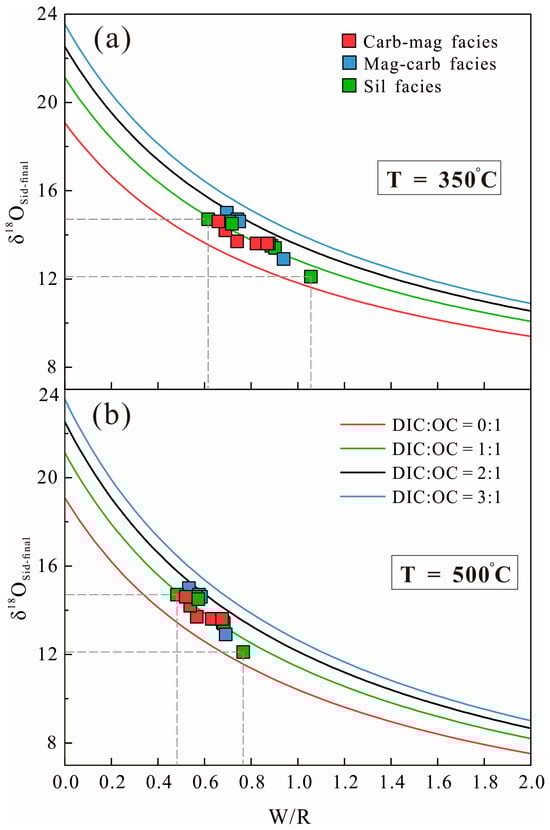
Figure 8.
Variations of δ18Osid-final of metamorphic recrystallization siderite with different water/rock ratio (W/R) and organic carbon mixing ratio under metamorphic temperatures of (a) 350 °C and (b) 500 °C.
5.4. Records of the Extensive Biological Activities at ~2.5 Ga
The δ13C of the Jining BIF (ranging from −18.6‰ to −9.6‰, with an average of −12.7‰) is generally lower than that of normal marine carbonates, exhibiting a significant negative carbon isotope value. This suggests that the carbon source of the carbonate minerals was mainly derived from a mixture of oxidized organic carbon and marine DIC. The presence of abundant iron-rich carbonates with negative δ13C values suggests enhanced biological acitivity during the Jining BIF’s deposition. However, it remains unclear whether this reflects regional processes or holds global significance. To address this issue, this paper systematically compiles global carbon isotope data from early Precambrian BIFs (Table 1).
In the 2.56 Ga Wittenoom Formation of the Hamersley Group, Western Australia, δ13Ccarb values of Fe-rich carbonates range from −14.66‰ to −0.25‰ (avg. −4.91‰) [84]. In the 2.47 Ga Brockman Iron Formation of the Hamersley Basin, siderite and ankerite exhibit δ13Ccarb values from −15.05‰ to −6.5‰ (avg. −9.83‰) [85]. In the 2.58–2.42 Ga Cauê Formation of the Minas Supergroup, Brazil, δ13Ccarb values of BIFs range from −12.2‰ to −3.4‰ (avg. −5.6‰) [86]. In the 2.46 Ga Griquatown–Kuruman Iron Formation of the Transvaal Supergroup, South Africa, δ13Ccarb values of BIFs range from −13.4‰ to −5.5‰ (avg. −9.4‰), while those of ankerite and siderite range from −12.9‰ to −5.6‰ (avg. −9.2‰) [87]. In the 2.45 Ga Krivoy Rog Iron Formation of Ukraine, the δ13Ccarb values of BIFs range from −16.8‰ to −0.8‰ (avg. −9.8‰) [88].
In comparison, the magnitude of negative carbon isotope values in Archean BIFs are relatively small. For instance, in the 3.83 Ga Isua greenstone belt, Craddock and Dauphas [85] reported δ13Ccarb values ranging from −5.94‰ to −4.10‰ in iron-rich carbonates and from −1.98‰ to −0.34‰ in iron-poor carbonates. Sial et al. [89] documented δ13Ccarb values between −6‰ and −3‰ in the 2.76 Ga carbonate-facies BIFs of the Carajás Formation in Brazil. For the 2.75 Ga Helen Formation in Canada, Ohmoto et al. [84] reported δ13Ccarb values of BIFs ranging from −5.85‰ to 0.18‰, while Garcia et al. [90] recorded values between −7.5‰ and 3.5‰. Additionally, Bowins and Crocket [91] found δ13Ccarb values of −7.7‰ to −4.9‰ in iron-rich carbonates from the 2.74 Ga Temagami BIF in Canada. However, some individual Archean BIFs have recorded extremely low δ13Ccarb values, for example, Smith et al. [92,93] obtained δ13Ccarb values of BIF samples in the 2.99–2.91 Ga Witwatersrand Supergroup ranging from −16.65‰ to −9.12‰, and in the 2.99–2.84 Ga Mozaan Group they varied from −18.77‰ to −7.72‰. However, these BIFs are generally in thin-bedded [92].
Overall, compared to the early Archean, late Neoarchean to Paleoproterozoic BIFs not only host larger-scale carbonate-facies BIFs but also exhibit more pronounced negative carbon isotope values. The consistent and widespread preservation of negative δ13Ccarb values in early Paleoproterozoic BIFs suggest widespread oxidation of organic carbon during diagenesis processes, which reflects a time of enhanced biological activity globally around 2.5 Ga. This process would have led to substantial organic matter consumption, which is a key factor contributing to the generally low TOC contents observed in BIFs. Moreover, as biological photosynthesis intensified, large amounts of free oxygen accumulated in seawater, which caused Fe2+ to oxidize to Fe3+, triggering the widespread deposition of BIFs in the Siderian period.

Table 1.
Carbon isotopic composition of early Precambrian BIFs and associated carbonate rocks.
Table 1.
Carbon isotopic composition of early Precambrian BIFs and associated carbonate rocks.
| Formation/Region | Age (Ga) | Types | δ13Ccarb (‰) | Average (‰) | References |
|---|---|---|---|---|---|
| Krivoy Rog Iron Formation, Ukraine | 2.45 | BIFs | −16.8 to −0.8 | −9.8 | [88] |
| Griquatown–Kuruman Iron Formation, South Africa | 2.46 | BIFs | −13.4 to −5.5 | −9.4 | [87] |
| 2.46 | Siderite/ankerite | −12.9 to −5.6 | −9.2 | [87] | |
| Brockman Iron Formation, Australia | 2.47 | siderite/ankerite | −15.05 to −6.5 | −9.83 | [85] |
| Yandian Formation, China | ~2.5 | BIFs | −18.6 to −9.6 | −12.72 | This study |
| Cauê Formation, Brazil | 2.58–2.42 | BIFs | −12.2 to −3.4 | −5.6 | [86] |
| Wittenoom Formation, Australia | 2.56 | Fe-rich carbonates | −14.66 to −0.25 | −4.91 | [84] |
| Temagami Iron Formation, Canada | 2.74 | Fe-rich carbonates | −7.7 to −4.9 | −6.7 | [91] |
| Helen Iron Formation, Canada | 2.75 | BIFs | −5.85 to 0.18 | −1.46 | [84] |
| Helen Iron Formation, Canada | 2.75 | BIFs | −7.5 to 3.5 | −0.14 | [90] |
| Carajás Iron Formation, Brazil | 2.76 | BIFs | −6 to −3 | Not provided | [89] |
| Witwatersrand Supergroup, South Africa | 2.99–2.91 | BIFs | −16.65 to −9.12 | −12.62 | [92,93] |
| Mozaan Group, South Africa | 2.99–2.84 | BIFs | −18.77 to −7.72 | −15.46 | [92,93] |
| Isua greenstone belt, Greenland | 3.83 | Fe-rich carbonates | −5.94 to −4.10 | −4.83 | [85] |
| Isua greenstone belt, Greenland | 3.83 | Fe-poor carbonates | −1.98 to −0.34 | −1.28 | [85] |
6. Conclusions
Strong positive correlations of Al2O3 with TiO2, Zr, and Hf, coupled with low Y/Ho ratios and enrichment in incompatible trace elements indicate a significant input of felsic terrigenous detritus during the deposition of the Jining BIF.
The Jining BIF exhibits pronounced negative Ce/Ce*(SN), weak positive Eu/Eu*(SN) and negative Eu/Eu*(CN) anomalies, suggesting a transition of seawater from a relatively reducing to a more oxidizing state. Mineral assemblages, trace elements and REE signatures collectively support the classification of the Jining BIF as Superior-type.
The δ13Ccarb values of BIF samples are notably negative (−18.6 to −9.6‰), indicating that the carbon in carbonates originated from a mixture of seawater dissolved inorganic carbon and oxidized organic carbon via DIR.
The consistently negative δ13Ccarb values observed in BIFs and iron-rich carboantes worldwide, which were deposited contemporaneously with the Jining BIF, imply a period of enhanced biological activity at ~2.5 Ga.
Supplementary Materials
The following supporting information can be downloaded at: https://www.mdpi.com/article/10.3390/min15121298/s1, Table S1: Major (wt.%) compositions of the Jining BIF; Table S2: Trace elemental (ppm) compositions of the Jining BIF; Table S3: Carbon and oxygen isotopic compositions and TOC contents of the Jining BIF.
Author Contributions
Conceptualization, R.T. and Y.C.; investigation, R.T., X.C. and J.C.; methodology, R.T. and Y.C.; writing—original draft preparation, R.T. and Y.C.; writing—review and editing, R.T., Y.C., X.C. and J.C.; All authors have read and agreed to the published version of the manuscript.
Funding
This research was funded by the National Natural Science Foundation of China (Nos. U2244206, U1906207).
Data Availability Statement
The data presented in this study are available in Supplementary Tables S1–S3.
Conflicts of Interest
The authors declare no conflict of interest.
References
- Liu, Y.; Chou, I.-M.; Chen, J.; Wu, N.; Li, W.; Bagas, L.; Ren, M.; Liu, Z.; Mei, S.; Wang, L. Oldhamite: A New Link in Upper Mantle for C–O–S–ca Cycles and an Indicator for Planetary Habitability. Natl. Sci. Rev. 2023, 10, nwad159. [Google Scholar] [CrossRef]
- Lyons, T.W.; Reinhard, C.T.; Planavsky, N.J. The Rise of Oxygen in Earth’s Early Ocean and Atmosphere. Nature 2014, 506, 307–315. [Google Scholar] [CrossRef]
- Holland, H.D. When Did the Earth’s Atmosphere Become Oxic? A Reply. Geochem. News 1999, 100, 20–22. [Google Scholar]
- Holland, H.D. Volcanic Gases, Black Smokers, and the Great Oxidation Event. Geochim. Cosmochim. Acta 2002, 66, 3811–3826. [Google Scholar] [CrossRef]
- Chen, Y. The Geologic Environment Catastrophe at about 2300 Ma. Young Geol. Nanjing Univ. 1987, 1, 119–125. (In Chinese) [Google Scholar]
- Chen, Y. Evidences for the Catastrophe in Geologic Environment at about 2300 Ma and the Discussions on Several Problems. J. Stratigr. 1990, 14, 178–186, (In Chinese with English Abstract). [Google Scholar]
- Chen, Y.; Ji, H.; Fu, S.; Zhou, X. The Challenge to Traditional Geological Theory by the Discover of Catastrophe Events in 2.3 Billion Years: A New Understanding of Some Major Geological Problems. Adv. Earth Sci. 1991, 6, 63–68. (In Chinese) [Google Scholar]
- Tang, H.; Chen, Y. Global Glaciations and Atmospheric Change at ca. 2.3 Ga. Geosci. Front. 2013, 4, 583–596. [Google Scholar] [CrossRef]
- Chen, Y.; Fu, S.; Hu, S.; Zhang, Y. REE Geochemical Evolution and Its Significance of Early Precambrian Metamorphic Terrain, Wuyang, Henan. Chin. J. Geochem. 1992, 11, 133–139. [Google Scholar] [CrossRef]
- Chen, Y.; Zhao, Y. Geochemical Characteristics and Evolution of REE in the Early Precambrian Sediments: Evidence from the Southern Margin of the North China Craton. Epis. J. Int. Geosci. 1997, 20, 109–116. [Google Scholar]
- Cowie, J.W.; Ziegler, W.; Remane, J. Stratigraphic Commission Accelerates Progress, 1984 to 1989. Epis. J. Int. Geosci. 1989, 12, 79–82. [Google Scholar] [CrossRef]
- Sun, D. A New Division and Naming of the Precambrian Era. Bull. Mineral. Petrol. Geochem. 1989, 4, 243–245. (In Chinese) [Google Scholar]
- James, H.L. Sedimentary Facies of Iron-Formation. Econ. Geol. 1954, 49, 235–293. [Google Scholar] [CrossRef]
- James, H.L. Distribution of Banded Iron-Formation in Space and Time. In Developments in Precambrian Geology; Iron-Formation Facts and Problems; Elsevier: Amsterdam, The Netherlands, 1983; Volume 6, pp. 471–490. [Google Scholar]
- Bekker, A.; Slack, J.F.; Planavsky, N.; Krapez, B.; Hofmann, A.; Konhauser, K.O.; Rouxel, O.J. Iron Formation: The Sedimentary Product of a Complex Interplay among Mantle, Tectonic, Oceanic, and Biospheric Processes. Econ. Geol. 2010, 105, 467–508. [Google Scholar] [CrossRef]
- Bekker, A.; Planavsky, N.J.; Krapež, B.; Rasmussen, B.; Hofmann, A.; Slack, J.F.; Rouxel, O.J.; Konhauser, K.O. Iron Formations: Their Origins and Implications for Ancient Seawater Chemistry. In Treatise on Geochemistry; Elsevier: Amsterdam, The Netherlands, 2014; pp. 561–628. [Google Scholar]
- Konhauser, K.O.; Amskold, L.; Lalonde, S.V.; Posth, N.R.; Kappler, A.; Anbar, A. Decoupling Photochemical Fe(II) Oxidation from Shallow-Water BIF Deposition. Earth Planet. Sci. Lett. 2007, 258, 87–100. [Google Scholar] [CrossRef]
- Tang, R.; Chen, Y. Advances in Isotopic Chronology of Paleoproterozoic Banded Iron Formations in North China Craton. Acta Petrol. Sin. 2024, 40, 3663–3684, (In Chinese with English Abstract). [Google Scholar] [CrossRef]
- Tong, X.; Mänd, K.; Li, Y.; Zhang, L.; Peng, Z.; Wu, Q.; Li, P.; Zhai, M.; Robbins, L.J.; Wang, C.; et al. Iron and Carbon Isotope Constraints on the Formation Pathway of Iron-Rich Carbonates within the Dagushan Iron Formation, North China Craton. Minerals 2021, 11, 94. [Google Scholar] [CrossRef]
- Wang, C.; Konhauser, K.O.; Zhang, L. Depositional Environment of the Paleoproterozoic Yuanjiacun Banded Iron Formation in Shanxi Province, China. Econ. Geol. 2015, 110, 1515–1539. [Google Scholar] [CrossRef]
- Lan, C.; Long, X.; Zhai, M.; Wang, J. Depositional Age and Geochemistry of the 2.44–2.32 Ga Granular Iron Formation in the Songshan Group, North China Craton: Tracing the Effects of Atmospheric Oxygenation on Continental Weathering and Seawater Environment. Precambrian Res. 2021, 357, 106142. [Google Scholar] [CrossRef]
- Gole, M.J.; Klein, C. Banded Iron-Formations through Much of Precambrian Time. J. Geol. 1981, 89, 169–183. [Google Scholar] [CrossRef]
- Konhauser, K.O.; Planavsky, N.J.; Hardisty, D.S.; Robbins, L.J.; Warchola, T.J.; Haugaard, R.; Lalonde, S.V.; Partin, C.A.; Oonk, P.B.H.; Tsikos, H.; et al. Iron Formations: A Global Record of Neoarchaean to Palaeoproterozoic Environmental History. Earth-Sci. Rev. 2017, 172, 140–177. [Google Scholar] [CrossRef]
- Wang, J.; Li, J.; Li, Q.; Wang, Q.; Dong, Z. Greenstone Belt Gold Deposits and Their Ore Source Beds in Western Shandong. Acta Geol. Sin. 2013, 87, 994–1002, (In Chinese with English Abstract). [Google Scholar]
- Hao, X. Study on Metallogenic Regularities and Prognosis of Iron Deposits in Western Shandong Province. Ph.D. Thesis, China University of Geosciences (Beijing), Beijing, China, 2014. (In Chinese with English Abstract). [Google Scholar]
- Song, M.; Jiao, X.; Zhang, C.; Zhang, Z.; Hu, S.; Li, S.; Li, Z.; Li, P. Stratigraphic Sequence and Tectonic Setting of the Jining Group in Shandong Province. J. Stratigr. 2016, 40, 26–40, (In Chinese with English Abstract). [Google Scholar]
- Jiao, X.; Song, M.; Yin, P.; Hu, S.; Zhang, C.; Ma, Z. The Jining Group and Its Mineralization; Geology Press: Beijing, China, 2017; (In Chinese with English Abstract). [Google Scholar]
- Qi, R. The Precambrian Stratigraphic Classification and Iron Formation Geological Characteristics in the Western Shandong Province. Bull. Nanjing Inst. Geol. Miner. Resour. 1984, 5, 58–108. (In Chinese) [Google Scholar]
- Li, S.; Li, P. Data Processing and Prospecting Effect of Magnetic Anomaly in Jining Area, Shandong Province. In The Corpus for Geophysical Computing of Metallic Ore; Geological Publishing House: Beijing, China, 1979; pp. 1–211. (In Chinese) [Google Scholar]
- Wang, W.; Wang, S.; Liu, D.; Li, P.; Dong, C.; Xie, H.; Ma, M.; Wan, Y. Formation Age of the Neoarchaean Jining Group (Banded Iron Formation) in the Western Shandong Province: Constraints from SHRIMP Zircon U-Pb Dating. Acta Petrol. Sin. 2010, 26, 1175–1181, (In Chinese with English Abstract). [Google Scholar]
- Wan, Y.; Liu, D.; Wang, S.; Jiao, X.; Wang, W.; Dong, C.; Xie, H.; Ma, M. Redefinition of Early Precambrian Supracrustal Rocks and Formation Age of BIF in Western Shandong, North China Craton. Acta Petrol. Sin. 2012, 28, 3457–3475, (In Chinese with English Abstract). [Google Scholar]
- Song, M.; Jiao, X.; Zhang, C.; Zhang, Z.; Li, S.; Li, P. An Analysis of Formation Age of Jining Group in Shandong Province. Geol. China 2016, 43, 829–842, (In Chinese with English Abstract). [Google Scholar]
- Zhang, Y. Formation and Evolution of Neoarchean BIF in Western Shandong Province. Ph.D. Thesis, China University of Geosciences (Beijing), Beijing, China, 2022. (In Chinese with English Abstract). [Google Scholar]
- Li, P.; Bian, R.; Cao, X. Geological Characteristics of Hongfusi Iron Deposit in Yandian Mine Area of Yanzhou City. Shandong Land Resour. 2010, 26, 11–14, (In Chinese with English Abstract). [Google Scholar]
- He, Q. Study on Geological Characteristics and the Origin of Zaicun Iron Deposit in Yanzhou City of Shandong Province. Shan Dong Land Resour. 2018, 34, 21–26, (In Chinese with English Abstract). [Google Scholar]
- Coplen, T.B.; Kendall, C.; Hopple, J. Comparison of Stable Isotope Reference Samples. Nature 1983, 302, 236–238. [Google Scholar] [CrossRef]
- McLennan, S.M. Rare Earth Elements in Sedimentary Rocks: Influence of Provenance and Sedimentary Processes. Rev. Mineral. Geochem. 1989, 21, 169–200. [Google Scholar]
- Bolhar, R.; Kamber, B.S.; Moorbath, S.; Fedo, C.M.; Whitehouse, M.J. Characterisation of Early Archaean Chemical Sediments by Trace Element Signatures. Earth Planet. Sci. Lett. 2004, 222, 43–60. [Google Scholar] [CrossRef]
- Eroglu, S.; Van Zuilen, M.A.; Taubald, H.; Drost, K.; Wille, M.; Swanner, E.D.; Beukes, N.J.; Schoenberg, R. Depth-Dependent δ13C Trends in Platform and Slope Settings of the Campbellrand- Malmani Carbonate Platform and Possible Implications for Early Earth Oxygenation. Precambrian Res. 2017, 302, 122–139. [Google Scholar] [CrossRef]
- Arora, M.; Govil, P.K.; Charan, S.N.; Udayraj, B.; Balaram, V.; Manikyamba, C. Geochemistry and Origin of Archean Banded Iron-Formation from the Bababudan Schist Belt, India. Econ. Geol. 1995, 90, 2040–2057. [Google Scholar] [CrossRef]
- Bau, M.; Dulski, P. Distribution of Yttrium and Rare-Earth Elements in the Penge and Kuruman Iron-Formations, Transvaal Supergroup, South Africa. Precambrian Res. 1996, 79, 37–55. [Google Scholar] [CrossRef]
- Lan, T.-G.; Fan, H.-R.; Hu, F.-F.; Yang, K.-F.; Cai, Y.-C.; Liu, Y.-S. Depositional Environment and Tectonic Implications of the Paleoproterozoic BIF in Changyi Area, Eastern North China Craton: Evidence from Geochronology and Geochemistry of the Metamorphic Wallrocks. Ore Geol. Rev. 2014, 61, 52–72. [Google Scholar] [CrossRef]
- Rao, T.G.; Naqvi, S.M. Geochemistry, Depositional Environment and Tectonic Setting of the BIF’s of the Late Archaean Chitradurga Schist Belt, India. Chem. Geol. 1995, 121, 217–243. [Google Scholar] [CrossRef]
- Sunder Raju, P.V. Petrography and Geochemical Behaviour of Trace Element, REE and Precious Metal Signatures of Sulphidic Banded Iron Formations from the Chikkasiddavanahalli Area, Chitradurga Schist Belt, India. J. Asian Earth Sci. 2009, 34, 663–673. [Google Scholar] [CrossRef]
- Nozaki, Y.; Zhang, J.; Amakawa, H. The Fractionation between Y and Ho in the Marine Environment. Earth Planet. Sci. Lett. 1997, 148, 329–340. [Google Scholar] [CrossRef]
- Grauch, R.I. Rare Earth Elements in Metamorphic Rocks. Mineral. Soc. Am. 1989, 11, 147–167. [Google Scholar]
- Bau, M. Rare-Earth Element Mobility during Hydrothermal and Metamorphic Fluid-Rock Interaction and the Significance of the Oxidation State of Europium. Chem. Geol. 1991, 93, 219–230. [Google Scholar] [CrossRef]
- Bau, M.; Dulski, P. Small-Scale Variations of the Rare-Earth Element Distribution in Precambrian Iron-Formations. Eur. J. Mineral. 1992, 4, 1429–1434. [Google Scholar] [CrossRef]
- Sholkovitz, E.R.; Shaw, T.J.; Schneider, D.L. The Geochemistry of Rare Earth Elements in the Seasonally Anoxic Water Column and Porewaters of Chesapeake Bay. Geochim. Cosmochim. Acta 1992, 56, 3389–3402. [Google Scholar] [CrossRef]
- Huston, D.L.; Logan, G.A. Barite, BIFs and Bugs: Evidence for the Evolution of the Earth’s Early Hydrosphere. Earth Planet. Sci. Lett. 2004, 220, 41–55. [Google Scholar] [CrossRef]
- Tang, H.-S.; Chen, Y.-J.; Santosh, M.; Zhong, H.; Yang, T. REE Geochemistry of Carbonates from the Guanmenshan Formation, Liaohe Group, NE Sino-Korean Craton: Implications for Seawater Compositional Change during the Great Oxidation Event. Precambrian Res. 2013, 227, 316–336. [Google Scholar] [CrossRef]
- Dai, A. Coordination Chemistry; Science Press: Beijing, China, 1987. (In Chinese) [Google Scholar]
- Tang, H.; Chen, Y.; Wu, G.; Yang, T. Rare Earth Element Geochemistry of Carbonates of Dashiqiao Formation, Liaohe Group, Eastern Liaoning Province: Implications for Lomagundi Event. Acta Petrol. Sin. 2009, 25, 3075–3093, (In Chinese with English Abstract). [Google Scholar]
- Taylor, S.R.; McLennan, S.M. The Continental Crust: Its Composition and Evolution; Wiley–Blackwell: Hoboken, NY, USA, 1985. [Google Scholar]
- Murray, R.W.; Buchholtz Ten Brink, M.R.; Gerlach, D.C.; Russ, G.P.; Jones, D.L. Rare Earth, Major, and Trace Elements in Chert from the Franciscan Complex and Monterey Group, California: Assessing REE Sources to Fine-Grained Marine Sediments. Geochim. Cosmochim. Acta 1991, 55, 1875–1895. [Google Scholar] [CrossRef]
- Dasgupta, H.C.; Sambasiva Rao, V.V.; Krishna, C. Chemical Environments of Deposition of Ancient Iron- and Manganese-Rich Sediments and Cherts. Sediment. Geol. 1999, 125, 83–98. [Google Scholar] [CrossRef]
- Schidlowski, M. A 3800-Million-Year Isotopic Record of Life from Carbon in Sedimentary Rocks. Nature 1988, 333, 313–318. [Google Scholar] [CrossRef]
- Jimenez-Lopez, C.; Caballero, E.; Huertas, F.J.; Romanek, C.S. Chemical, Mineralogical and Isotope Behavior, and Phase Transformation during the Precipitation of Calcium Carbonate Minerals from Intermediate Ionic Solution at 25 °C. Geochim. Cosmochim. Acta 2001, 65, 3219–3231. [Google Scholar] [CrossRef]
- Jimenez-Lopez, C.; Romanek, C.S. Precipitation Kinetics and Carbon Isotope Partitioning of Inorganic Siderite at 25 °C and 1 Atm. Geochim. Cosmochim. Acta 2004, 68, 557–571. [Google Scholar] [CrossRef]
- Kaufman, A.J.; Hayes, J.M.; Klein, C. Primary and Diagenetic Controls of Isotopic Compositions of Iron-Formation Carbonates. Geochim. Cosmochim. Acta 1990, 54, 3461–3473. [Google Scholar] [CrossRef]
- Beukes, N.J.; Klein, C.; Kaufman, A.J.; Hayes, J.M. Carbonate Petrography, Kerogen Distribution, and Carbon and Oxygen Isotope Variations in an Early Proterozoic Transition from Limestone to Iron-Formation Deposition, Transvaal Supergroup, South Africa. Econ. Geol. Bull. Soc. Econ. Geol. 1990, 85, 663–690. [Google Scholar] [CrossRef]
- Yang, X.; Zhang, Z.; Santosh, M.; Duan, S.; Liang, T. Anoxic to Suboxic Mesoproterozoic Ocean: Evidence from Iron Isotope and Geochemistry of Siderite in the Banded Iron Formations from North Qilian, NW China. Precambrian Res. 2018, 307, 115–124. [Google Scholar] [CrossRef]
- Konhauser, K.O.; Newman, D.K.; Kappler, A. The Potential Significance of Microbial Fe(III) Reduction during Deposition of Precambrian Banded Iron Formations. Geobiology 2005, 3, 167–177. [Google Scholar] [CrossRef]
- Heimann, A.; Johnson, C.M.; Beard, B.L.; Valley, J.W.; Roden, E.E.; Spicuzza, M.J.; Beukes, N.J. Fe, C, and O Isotope Compositions of Banded Iron Formation Carbonates Demonstrate a Major Role for Dissimilatory Iron Reduction in ~2.5 Ga Marine Environments. Earth Planet. Sci. Lett. 2010, 294, 8–18. [Google Scholar] [CrossRef]
- Hu, J.; Li, S.; Wang, S.-J.; Peckmann, J.; Guan, H.; Jiang, S.; Chen, W.; Cui, H.; Qin, Z.; Liu, P.; et al. Metal-Driven Anaerobic Oxidation of Methane and the Sturtian Deglaciation. Nat. Commun. 2025, 16, 7249. [Google Scholar] [CrossRef]
- Jiang, C.Z.; Tosca, N.J. Growth Kinetics of Siderite at 298.15 K and 1 Bar. Geochim. Cosmochim. Acta 2020, 274, 97–117. [Google Scholar] [CrossRef]
- Rasmussen, B.; Muhling, J.R.; Krapež, B. Greenalite and Its Role in the Genesis of Early Precambrian Iron Formations—A Review. Earth-Sci. Rev. 2021, 217, 103613. [Google Scholar] [CrossRef]
- Jiang, C.Z.; Halevy, I.; Tosca, N.J. Kinetic Isotope Effect in Siderite Growth: Implications for the Origin of Banded Iron Formation Siderite. Geochim. Cosmochim. Acta 2022, 322, 260–273. [Google Scholar] [CrossRef]
- Huang, H.; Zhang, L. Genesis of the Lilaozhuang iron-magnesite deposit in the Huoqiu area of Anhui province: Indicative significance of carbon and oxygen isotopes. Bull. Mineral. Petrol. Geochem. 2020, 39, 072, (In Chinese with English Abstract). [Google Scholar]
- Hoefs, J. Stable Isotope Geochemistry; Springer: Berlin, Germany, 1997. [Google Scholar]
- Carothers, W.W.; Adami, L.H.; Rosenbauer, R.J. Experimental Oxygen Isotope Fractionation between Siderite-Water and Phosphoric Acid Liberated CO2-Siderite. Geochim. Cosmochim. Acta 1988, 52, 2445–2450. [Google Scholar] [CrossRef]
- Kim, S.-T.; O’Neil, J.R. Equilibrium and Nonequilibrium Oxygen Isotope Effects in Synthetic Carbonates. Geochim. Cosmochim. Acta 1997, 61, 3461–3475. [Google Scholar] [CrossRef]
- Schidlowski, M.; Eichmann, R.; Junge, C.E. Precambrian Sedimentary Carbonates: Carbon and Oxygen Isotope Geochemistry and Implications for the Terrestrial Oxygen Budget. Precambrian Res. 1975, 2, 1–69. [Google Scholar] [CrossRef]
- Jiang, C.Z.; Tosca, N.J. Fe(II)-Carbonate Precipitation Kinetics and the Chemistry of Anoxic Ferruginous Seawater. Earth Planet. Sci. Lett. 2019, 506, 231–242. [Google Scholar] [CrossRef]
- Glass, J.B.; Orphan, V.J. Trace Metal Requirements for Microbial Enzymes Involved in the Production and Consumption of Methane and Nitrous Oxide. Front. Microbiol. 2012, 3, 61. [Google Scholar] [CrossRef]
- Fischer, W.W.; Knoll, A.H. An Iron Shuttle for Deepwater Silica in Late Archean and Early Paleoproterozoic Iron Formation. GSA Bull. 2009, 121, 222–235. [Google Scholar] [CrossRef]
- Nealson, K.H.; Myers, C.R. Iron Reduction by Bacteria: A Potential Role in the Genesis of Banded Iron Formations. Am. J. Sci. 1990, 290, 35–45. [Google Scholar]
- Lovley, D.R. Dissimilatory Fe(III) and Mn(IV) Reduction. Microbiol. Rev. 1991, 55, 259–287. [Google Scholar] [CrossRef]
- Köhler, I.; Konhauser, K.O.; Papineau, D.; Bekker, A.; Kappler, A. Biological Carbon Precursor to Diagenetic Siderite with Spherical Structures in Iron Formations. Nat. Commun. 2013, 4, 1741. [Google Scholar] [CrossRef]
- Beck, W.C.; Grossman, E.L.; Morse, J.W. Experimental Studies of Oxygen Isotope Fractionation in the Carbonic Acid System at 15°, 25°, and 40 °C. Geochim. Cosmochim. Acta 2005, 69, 3493–3503. [Google Scholar] [CrossRef]
- Guy, R.D.; Fogel, M.L.; Berry, J.A. Photosynthetic Fractionation of the Stable Isotopes of Oxygen and Carbon. Plant Physiol. 1993, 101, 37–47. [Google Scholar] [CrossRef]
- Bao, H.; Koch, P.L.; Thiemens, M.H. Oxygen Isotopic Composition of Ferric Oxides from Recent Soil, Hydrologic, and Marine Environments. Geochim. Cosmochim. Acta 2000, 64, 2221–2231. [Google Scholar] [CrossRef]
- Muehlenbachs, K. The Oxygen Isotopic Composition of the Oceans, Sediments and the Seafloor. Chem. Geol. 1998, 145, 263–273. [Google Scholar] [CrossRef]
- Ohmoto, H.; Watanabe, Y.; Kumazawa, K. Evidence from Massive Siderite Beds for a CO2-Rich Atmosphere before~1.8 Billion Years Ago. Nature 2004, 429, 395–399. [Google Scholar] [CrossRef]
- Craddock, P.R.; Dauphas, N. Iron and Carbon Isotope Evidence for Microbial Iron Respiration throughout the Archean. Earth Planet. Sci. Lett. 2011, 303, 121–132. [Google Scholar] [CrossRef]
- Teixeira, N.L.; Caxito, F.A.; Rosière, C.A.; Pecoits, E.; Vieira, L.; Frei, R.; Sial, A.N.; Poitrasson, F. Trace Elements and Isotope Geochemistry (C, O, Fe, Cr) of the Cauê Iron Formation, Quadrilátero Ferrífero, Brazil: Evidence for Widespread Microbial Dissimilatory Iron Reduction at the Archean/Paleoproterozoic Transition. Precambrian Res. 2017, 298, 39–55. [Google Scholar] [CrossRef]
- Tsikos, H.; Siahi, M.; Rafuza, S.; Mhlanga, X.R.; Oonk, P.B.H.; Papadopoulos, V.; Boyce, A.J.; Mason, P.R.D.; Harris, C.; Gröcke, D.R.; et al. Carbon Isotope Stratigraphy of Precambrian Iron Formations and Possible Significance for the Early Biological Pump. Gondwana Res. 2022, 109, 416–428. [Google Scholar] [CrossRef]
- Perry, E.C.; Ahmad, S.N. Oxygen and Carbon Isotope Geochemistry of the Krivoy Rog Iron Formation, Ukranian SSR. Lithos 1981, 14, 83–92. [Google Scholar] [CrossRef]
- Sial, A.N.; Ferreira, V.P.; Dealmeida, A.R.; Romano, A.W.; Parente, C.V.; Dacosta, M.L.; Santos, V.H. Carbon Isotope Fluctuations in Precambrian Carbonate Sequences of Several Localities in Brazil. An. Acad. Bras. Ciênc. 2000, 72, 539–558. [Google Scholar] [CrossRef]
- Garcia, T.I.; Gorton, M.P.; Li, H.; Wortmann, U.G.; Spooner, E.T.C. The Geochemistry of the 2.75 Ga-Old Helen Iron Formation, Wawa, Ontario—Insights into Iron Formation Deposition from Carbon Isotopes and Rare Earth Elements. Precambrian Res. 2016, 275, 357–368. [Google Scholar] [CrossRef]
- Bowins, R.J.; Crocket, J.H. Sulfur and Carbon Isotopes in Archean Banded Iron Formations: Implications for Sulfur Sources. Chem. Geol. 1994, 111, 307–323. [Google Scholar] [CrossRef]
- Smith, A.J.B. The Paleo-Environmental Significance of the Iron- Formations and Iron-Rich Mudstones of the Mesoarchean Witwatersrand-Mozaan Basin, South Africa. Master’s Thesis, University of Johannesburg, Johannesburg, South Africa, 2007. [Google Scholar]
- Smith, A.J.B.; Beukes, N.J.; Gutzmer, J. The Composition and Depositional Environments of Mesoarchean Iron Formations of the West Rand Group of the Witwatersrand Supergroup, South Africa. Econ. Geol. 2013, 108, 111–134. [Google Scholar] [CrossRef]
Disclaimer/Publisher’s Note: The statements, opinions and data contained in all publications are solely those of the individual author(s) and contributor(s) and not of MDPI and/or the editor(s). MDPI and/or the editor(s) disclaim responsibility for any injury to people or property resulting from any ideas, methods, instructions or products referred to in the content. |
© 2025 by the authors. Licensee MDPI, Basel, Switzerland. This article is an open access article distributed under the terms and conditions of the Creative Commons Attribution (CC BY) license (https://creativecommons.org/licenses/by/4.0/).