Abstract
The consistency between geochemical discrimination diagrams and the modal Quartz–Alkali feldspar–Plagioclase (QAP) classification scheme was investigated by evaluating the accuracy of three diagrams—the Quartz–Plagioclase coordinates (P-Q), the SiO2–CaO/(CaO + K2O) (SCK), and the Silica–Total Alkali (TAS) diagrams—for granitoid rocks. A global dataset of 1981 samples, each containing both whole-rock geochemical data and quantitative modal mineralogy, was employed. The results indicate that the P-Q and SCK diagrams have relatively low overall accuracy (~50%–55%) in reproducing the QAP classification. Their accuracy is acceptable for granites but notably lower for basic and intermediate rock types. The SCK diagram achieves higher accuracy (~80%) for tonalite but exhibits considerable dispersion for other lithologies. Despite the IUGS recommending the TAS diagram for volcanic rocks only, it is commonly used for intrusive rocks; this study, however, finds that it yields low accuracy rates for most common plutonic rocks and is therefore unsuitable for their reliable classification. This limited accuracy is attributed to the use of only three or four oxides to estimate major mineral proportions, a practice equivalent to dimensionality reduction that results in substantial information loss.
1. Introduction
Granitoids are plutonic rocks characterized by a relatively simple felsic mineral assemblage—quartz, alkali feldspar, and plagioclase—with variable but generally minor amounts of mafic minerals []. For over two centuries, granitoids have been an important subject of geological research [,,]. Among the nine representative non-genetic classification schemes proposed during the past century for granitoid rocks, seven are based on the chemical composition of major rock-forming elements [].
Through the longstanding efforts of the IUGS Subcommission on the Systematics of Igneous Rocks (IUGS SSIR), the modal mineralogical QAP (quartz–alkali feldspar–plagioclase) classification scheme has gained broad acceptance among geologists worldwide [,,,]. Nevertheless, many researchers continue to prefer geochemical diagrams for classifying and naming felsic intrusive rocks [,,,,]. Compared with point-counting modal mineralogy, whole-rock geochemical analysis is less time-consuming and better suited for machine learning applications []. Therefore, geochemical classification diagrams remain practically valuable in granitoid petrology.
A variety of geochemical diagrams have been proposed as effective proxies for QAP classification. These can be grouped into three categories:
- (1)
- Normative mineral-based diagrams, such as the Quartz (Q′)–Anorthite–Orthoclase diagram (Q′–ANOR diagram; [] and the Quartz–Orthoclase–Albite–Anorthite normative diagram (2Q–(Or + Ab)–4An diagram, abbreviated QUORAA; [];
- (2)
- Major-element weight percent-based diagrams, such as the Silica–Total Alkali diagram (TAS; [,,] and the SiO2–CaO/(CaO + K2O) diagram (SCK; [];
- (3)
- Cation-number-based diagrams, such as the Quartz–Plagioclase coordinate diagram (P-Q diagram; [,].
Despite the proliferation of such diagrams, the IUGS SSIR has not yet officially endorsed any geochemical scheme for plutonic rock classification [,,]. Moreover, few studies have systematically evaluated the consistency between nomenclature derived from these diagrams and the modal QAP classification. Early work by Vilinovic and Petřík [] assessed the reliability of the Q′–ANOR diagram using mesonorm calculations from ~100 Carpathian granitoid samples. Bellieni et al. [] tested the IUGS-recommended TAS diagram—originally designed for volcanic rocks—on 278 intrusive samples. Galindo et al. [] compared the TAS [], P-Q, Q′–ANOR, and R1–R2 [] diagrams against QAP nomenclature using samples from five Brazilian batholith suites, finding that while geochemical diagrams accurately identify granite sensu stricto, they perform poorly for more basic rocks (e.g., gabbro and diorite). Our recent studies indicate that normative diagrams such as QUORAA and Q′–ANOR exhibit low accuracy relative to QAP classification [,], whereas the SCK diagram performs well in identifying tonalite []. Santos and Hartmann [] highlighted inconsistencies between the IUGS-recommended QAP scheme for volcanic rocks and the TAS diagram. Sharpenok et al. [] proposed a modified TAS diagram for granitoids in an EGU General Assembly abstract, though no detailed methodology or diagram has been published.
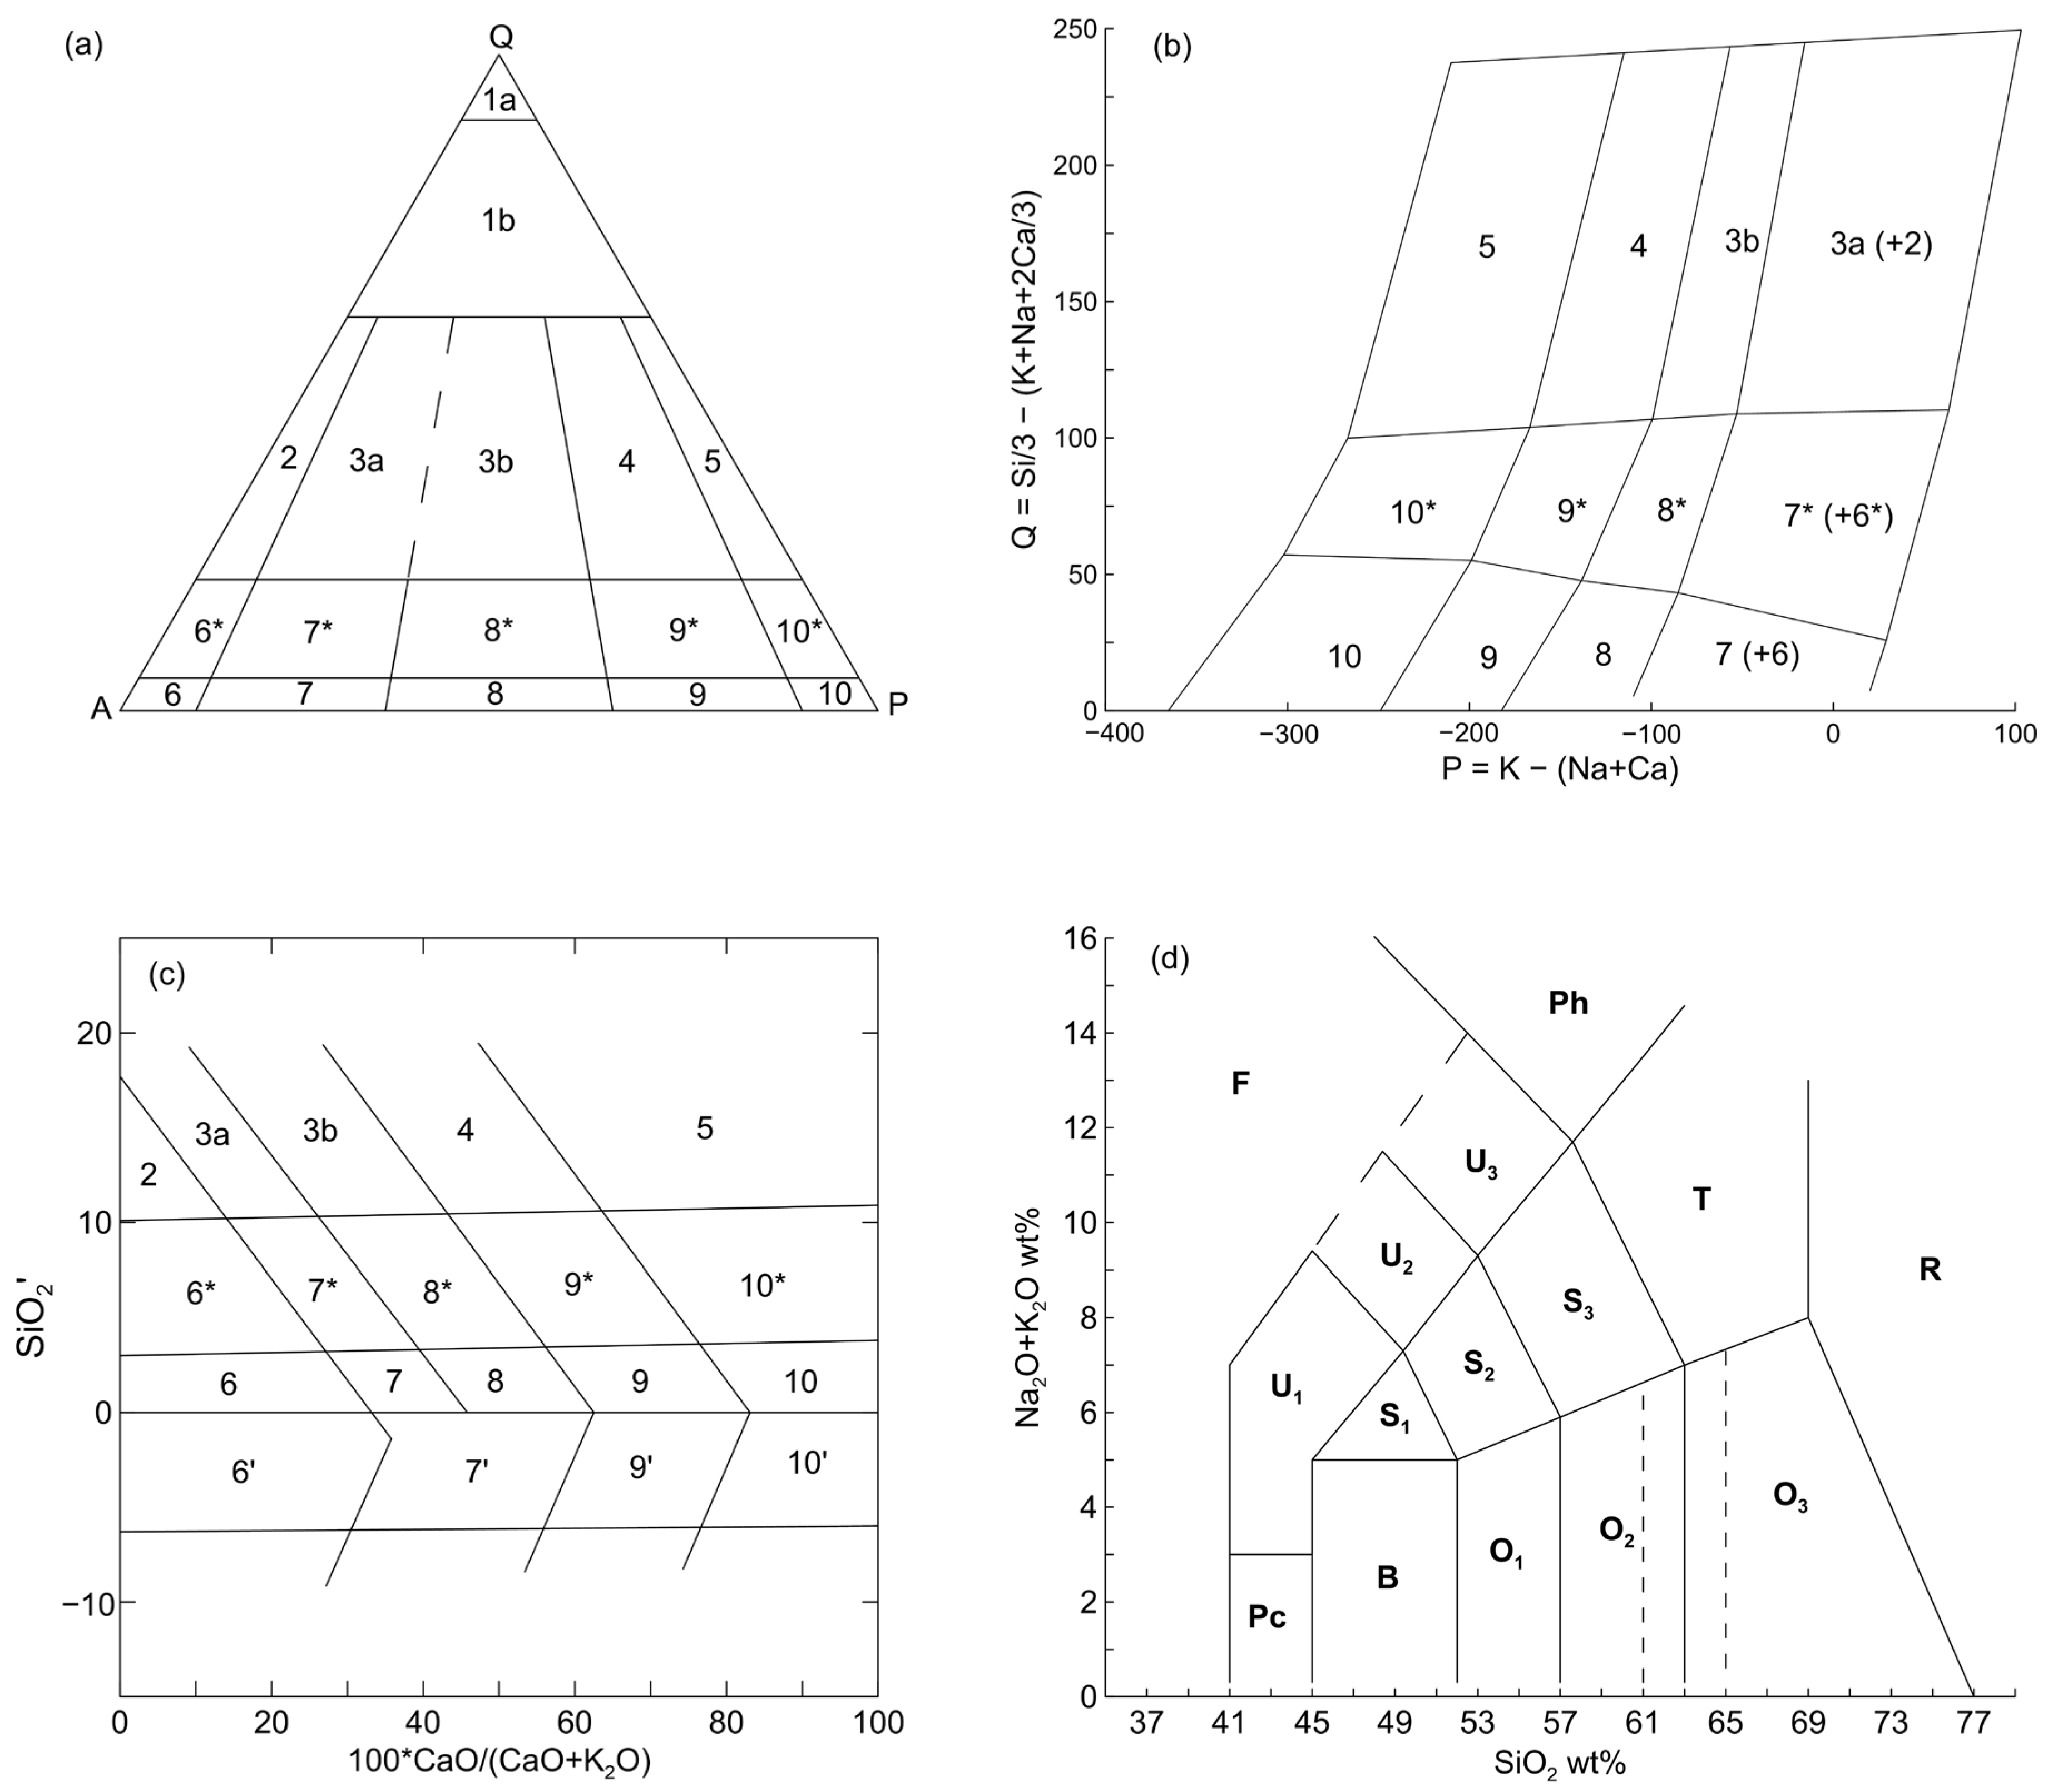
In this study, we compile major oxide and modal mineral content data of granitoid rocks from diverse regions worldwide. Using a dataset of 1981 samples, we evaluate the accuracy of three representative geochemical classification diagrams: the P-Q, SCK, and TAS (Figure 1). While previous studies [,,] have also assessed the consistency between geochemical diagrams and the QAP scheme, this work advances the field by employing a substantially larger global dataset (1981 samples, compared to <300 in Bellieni et al. [] or Galindo et al. []) and by systematically evaluating diagrams based on distinct principles—cation-based (P-Q), element ratio-based (SCK), and oxide-based (TAS).
Figure 1.
Non-genetic classification diagram for the granitoid rocks. (a) QAP diagram []; (b) P-Q diagram []; (c) SCK diagram [], the axis and boundaries are transformed according to []); (d) TAS diagram (base map boundaries after []; nomenclature after []). 1a—Quartzolite; 1b—Quartz-rich granitoid; 2—Alkali feldspar granite; 3a—Syenogranite; 3b—Monzogranite; 4—Granodiorite; 5—Tonalite; 6*—Quartz alkali feldspar syenite; 7*—Quartz syenite; 8*—Quartz monzonite; 9*—Quartz monzodiorite; 10*—Quartz diorite/quartz gabbro; 6—Alkali feldspar syenite; 7—Syenite; 8—Monzonite; 9—Monzodiorite; 10—Diorite/Gabbro. For SCK diagram: 6′—Feldspathoid syenite; 7′—Feldspathoid monzosyenite; 9′—Feldspathoid monzodiorite; 10′—Olivine/feldspathoid diorite/gabbro. SiO2′ = SiO2 + 20.4 × CaO/(CaO + K2O) − 64.8. For TAS diagram: R—Granite; O3—Granodiorite; O2—Tonalite; O1—Diorite; B—Gabbro; Pc—Olivine gabbro; T—Syenite; S3—Monzonite; S2—Monzodiorite; S1—Monzogabbro; Ph—Feldspathoid syenite; U3—Feldspathoid monzosyenite; U2—Feldspathoid monzodiorite; U1—Feldspathoid gabbro; F—Foidite. The vertical dot lines at SiO2 = 61% and 65% bracket the “Tonalite” region in TAS diagram as proposed by Middlemost [].
2. Materials and Methods
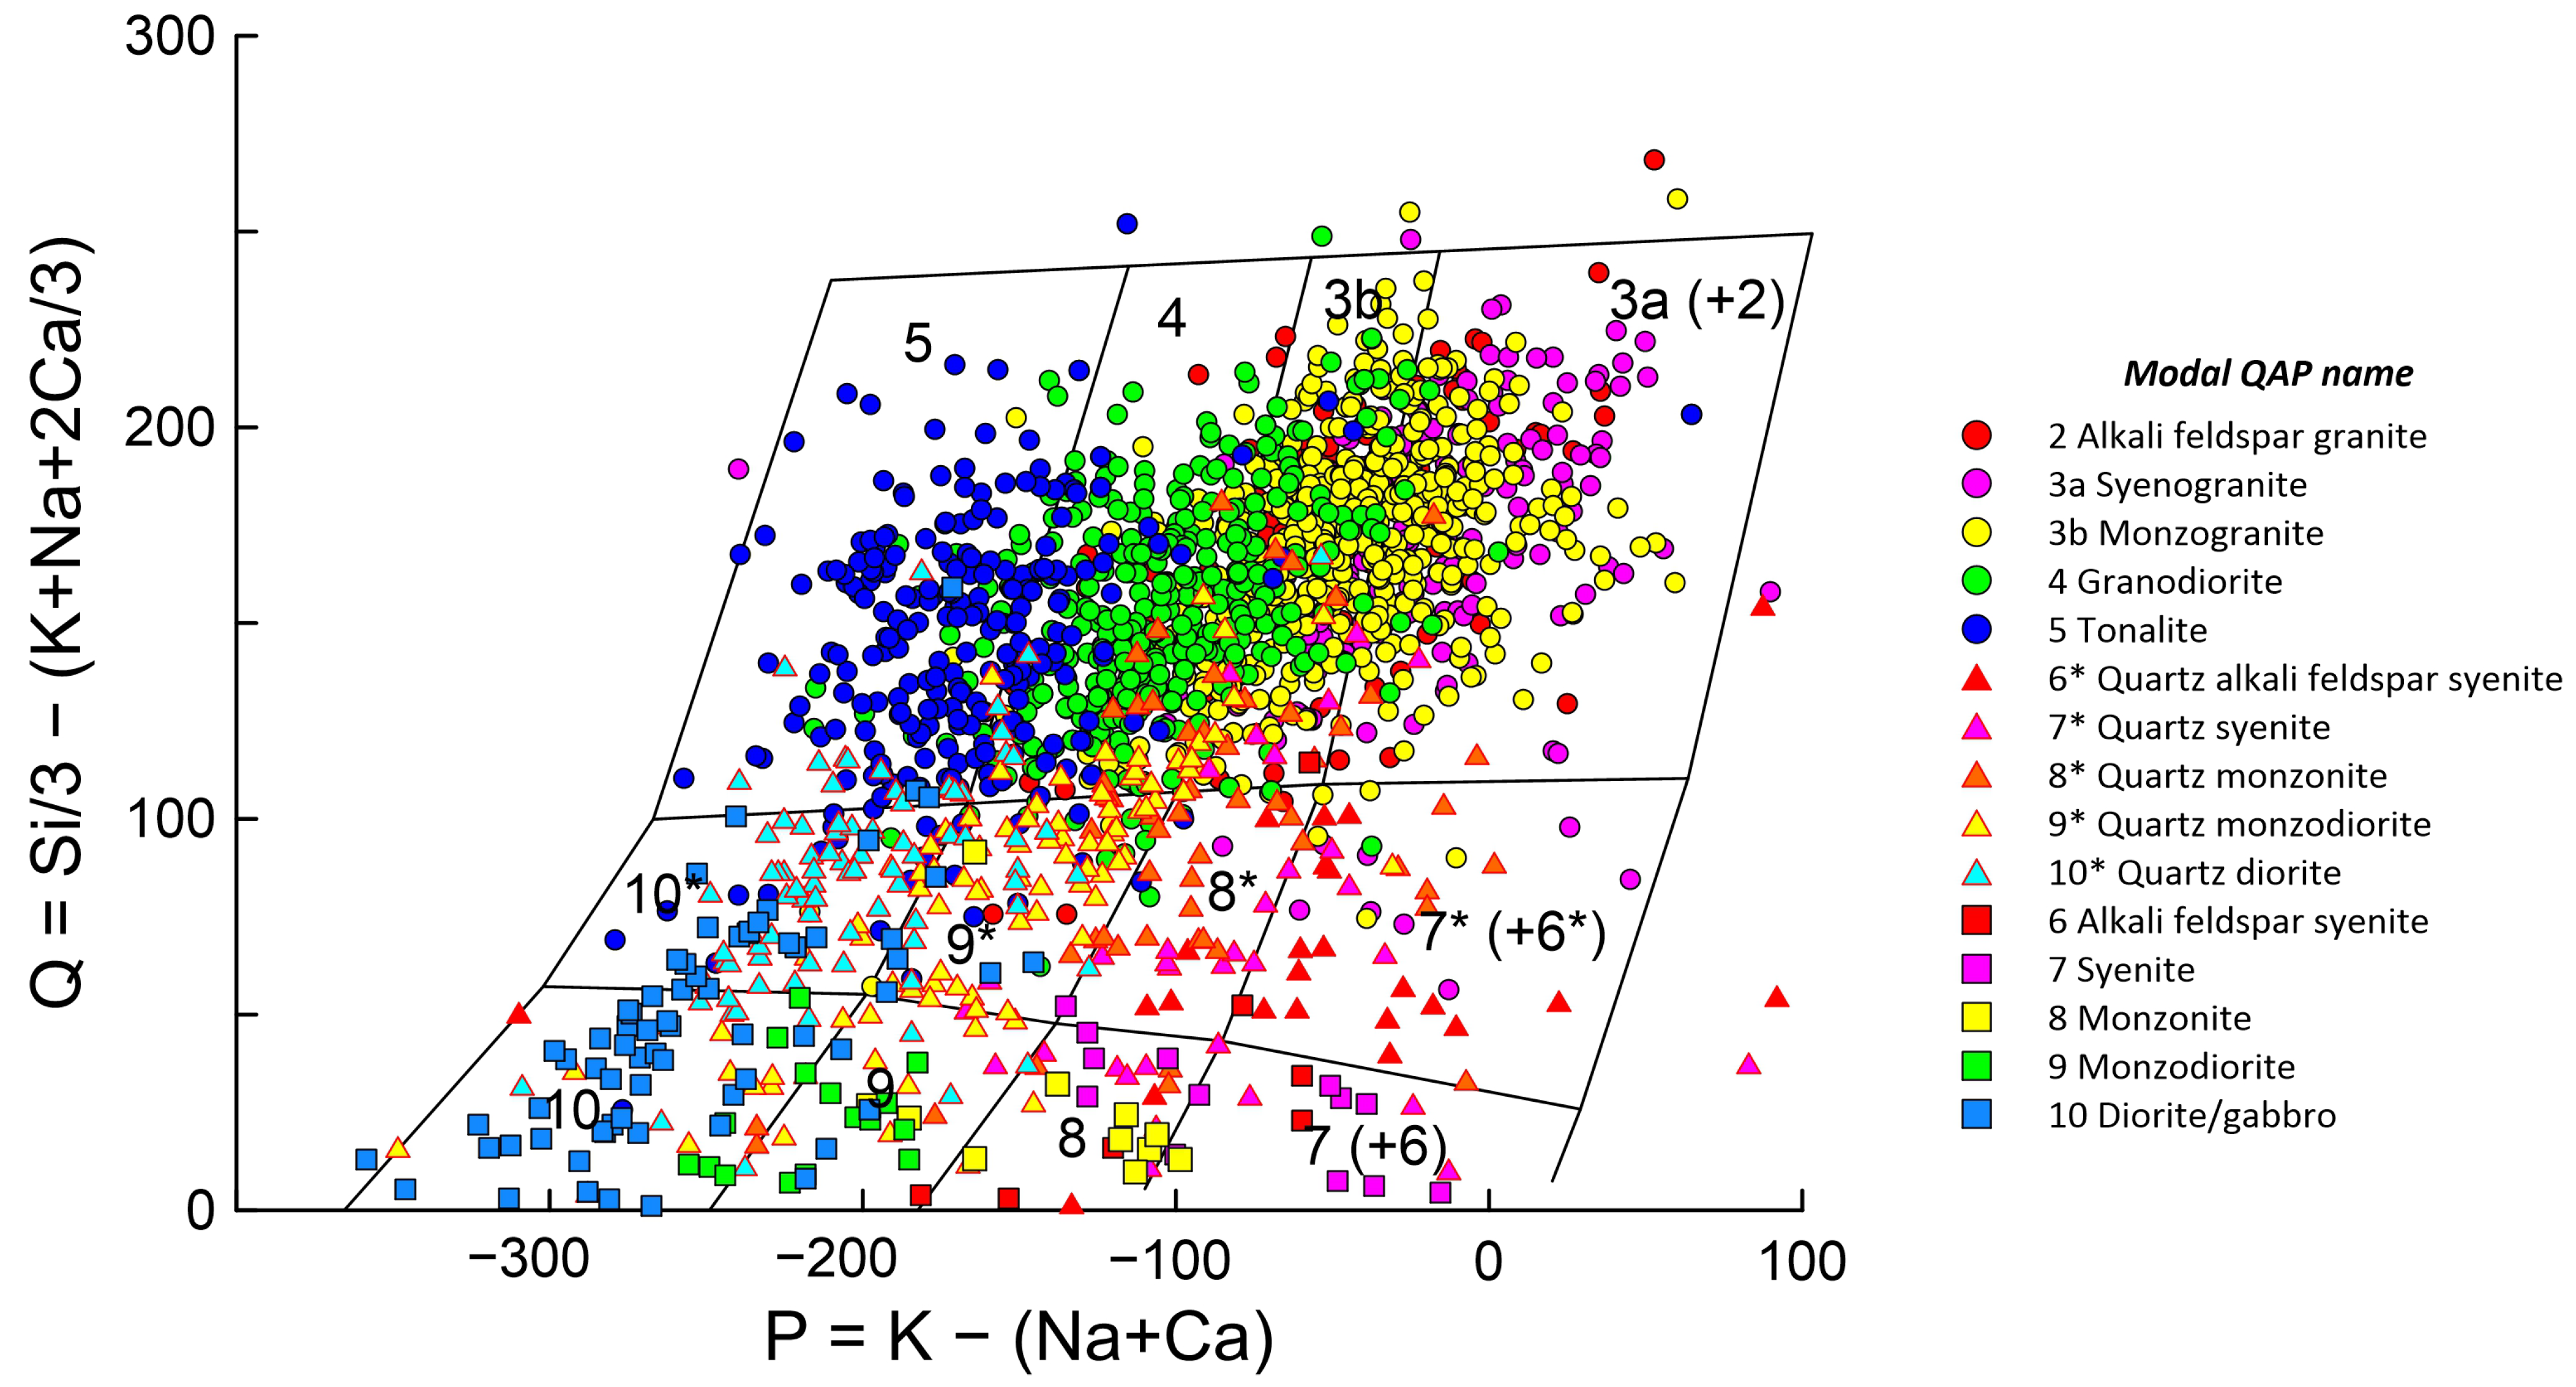
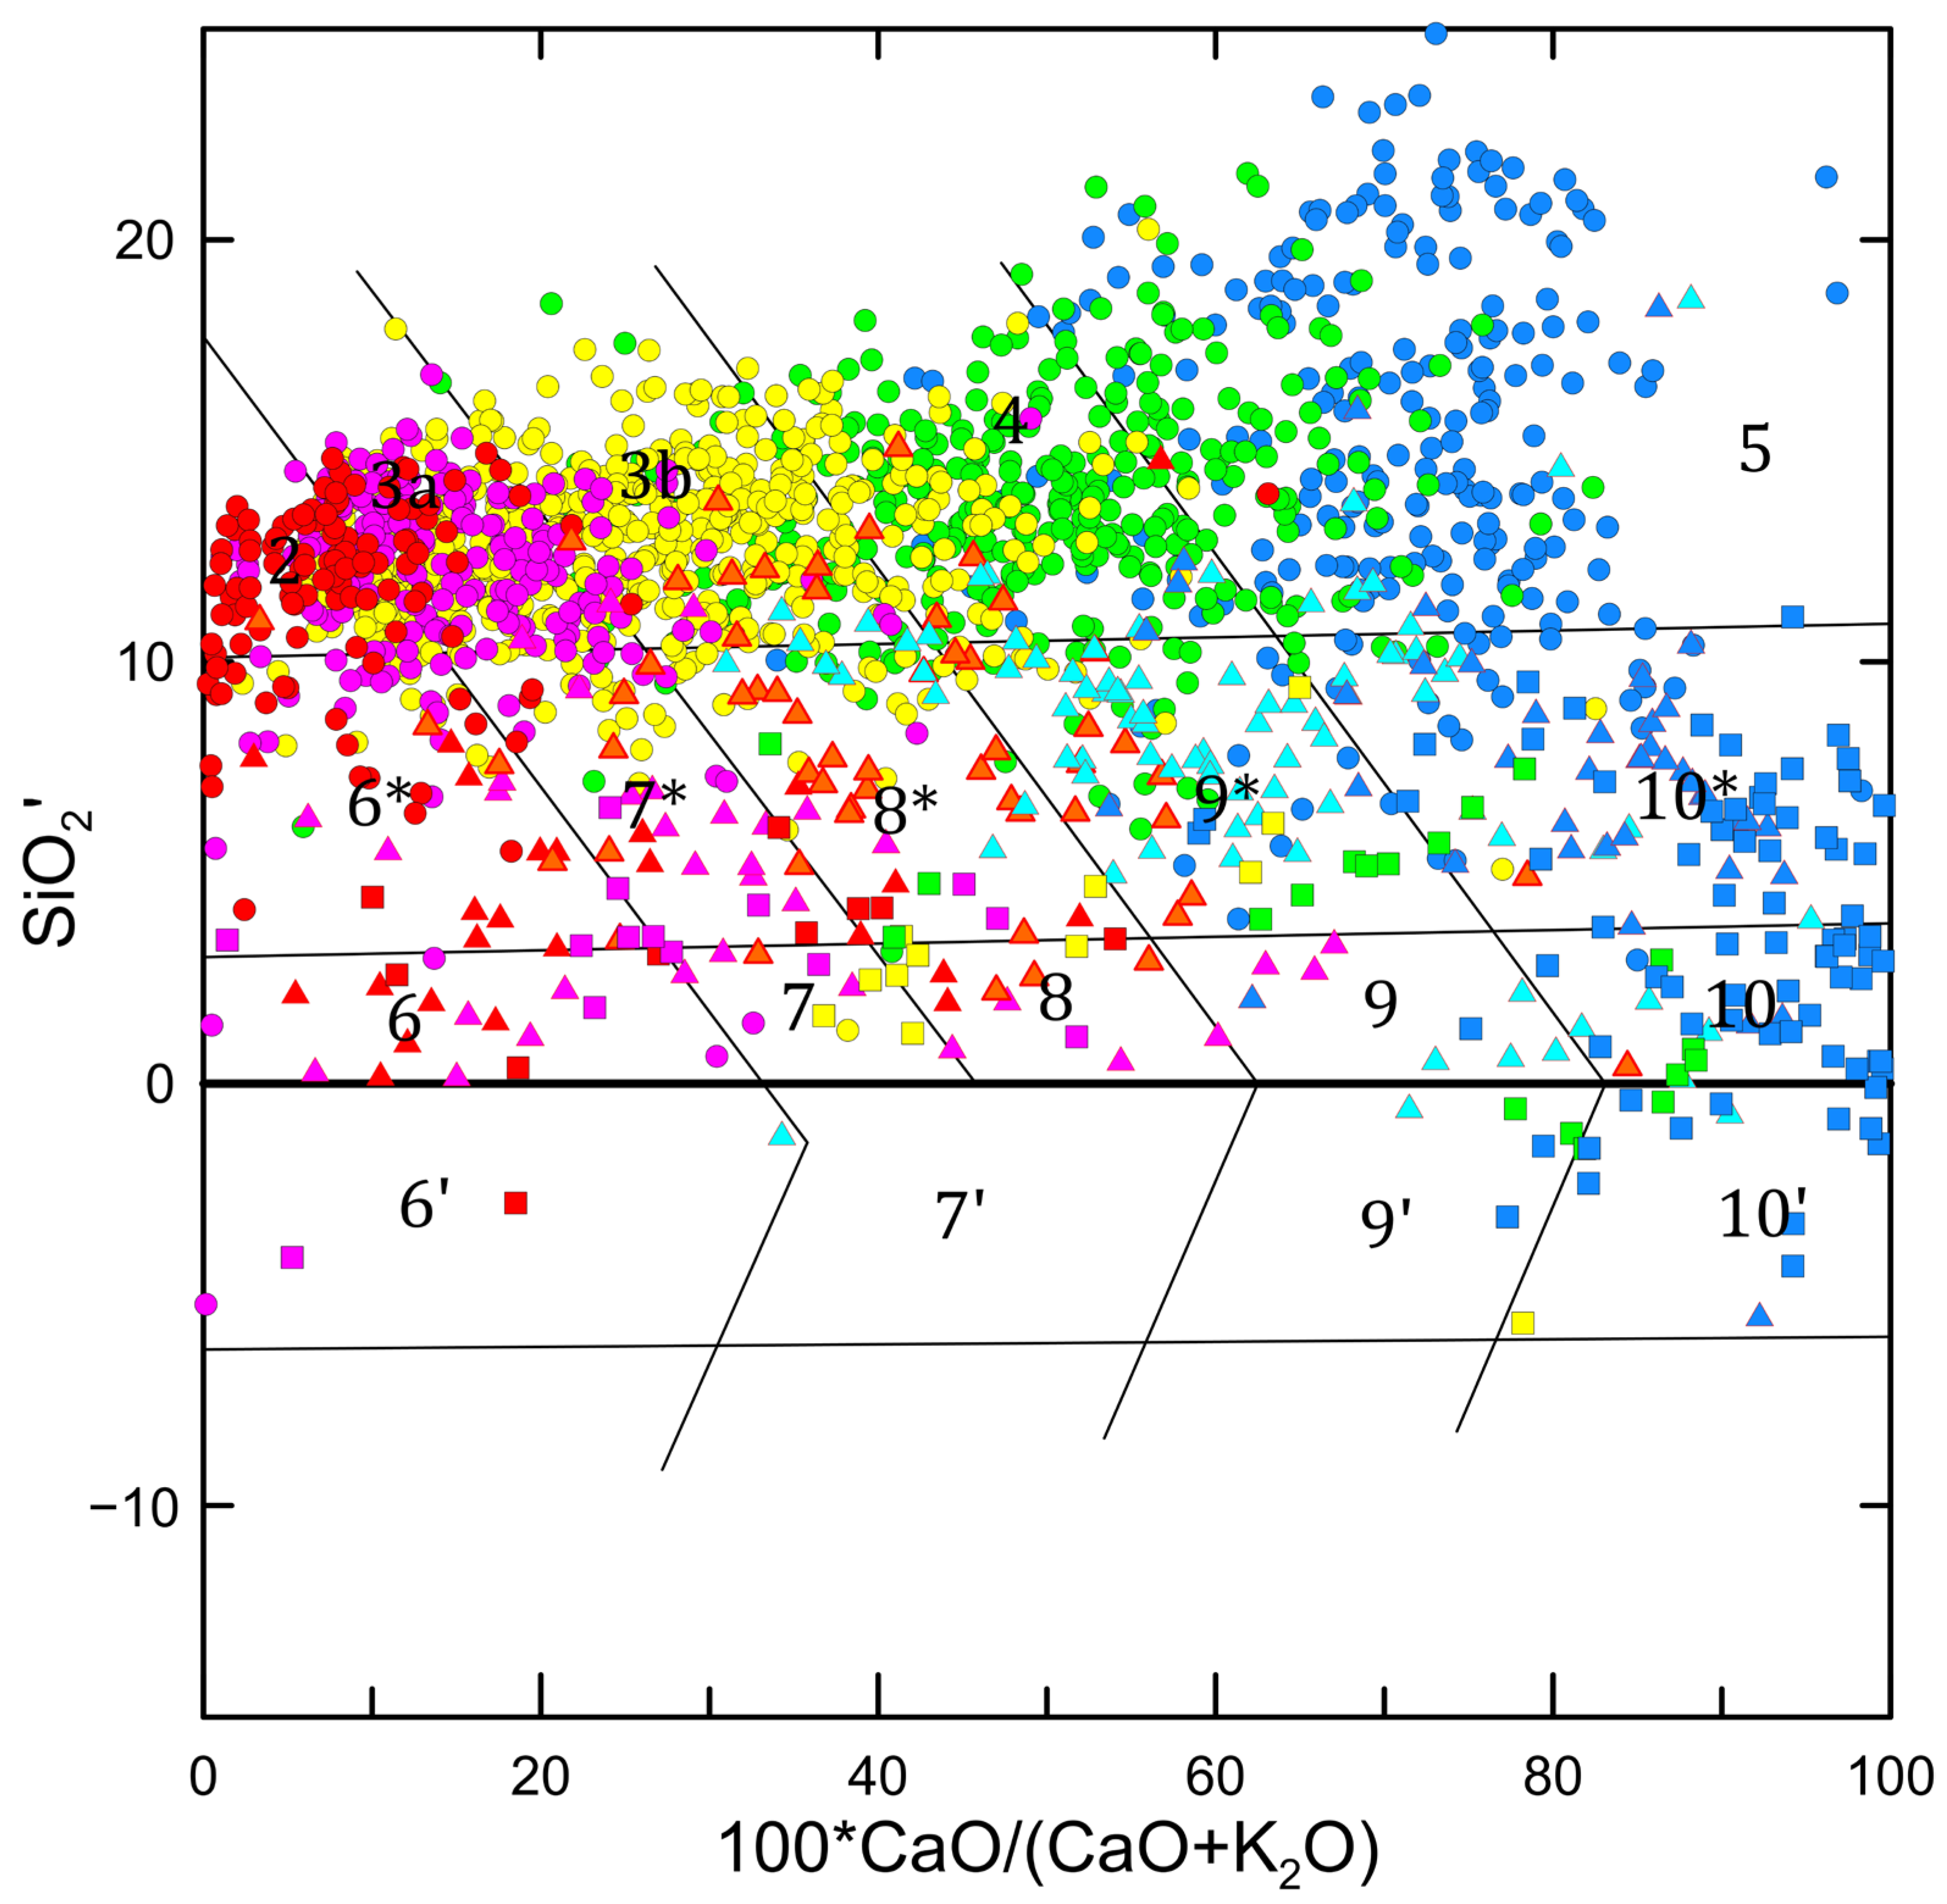
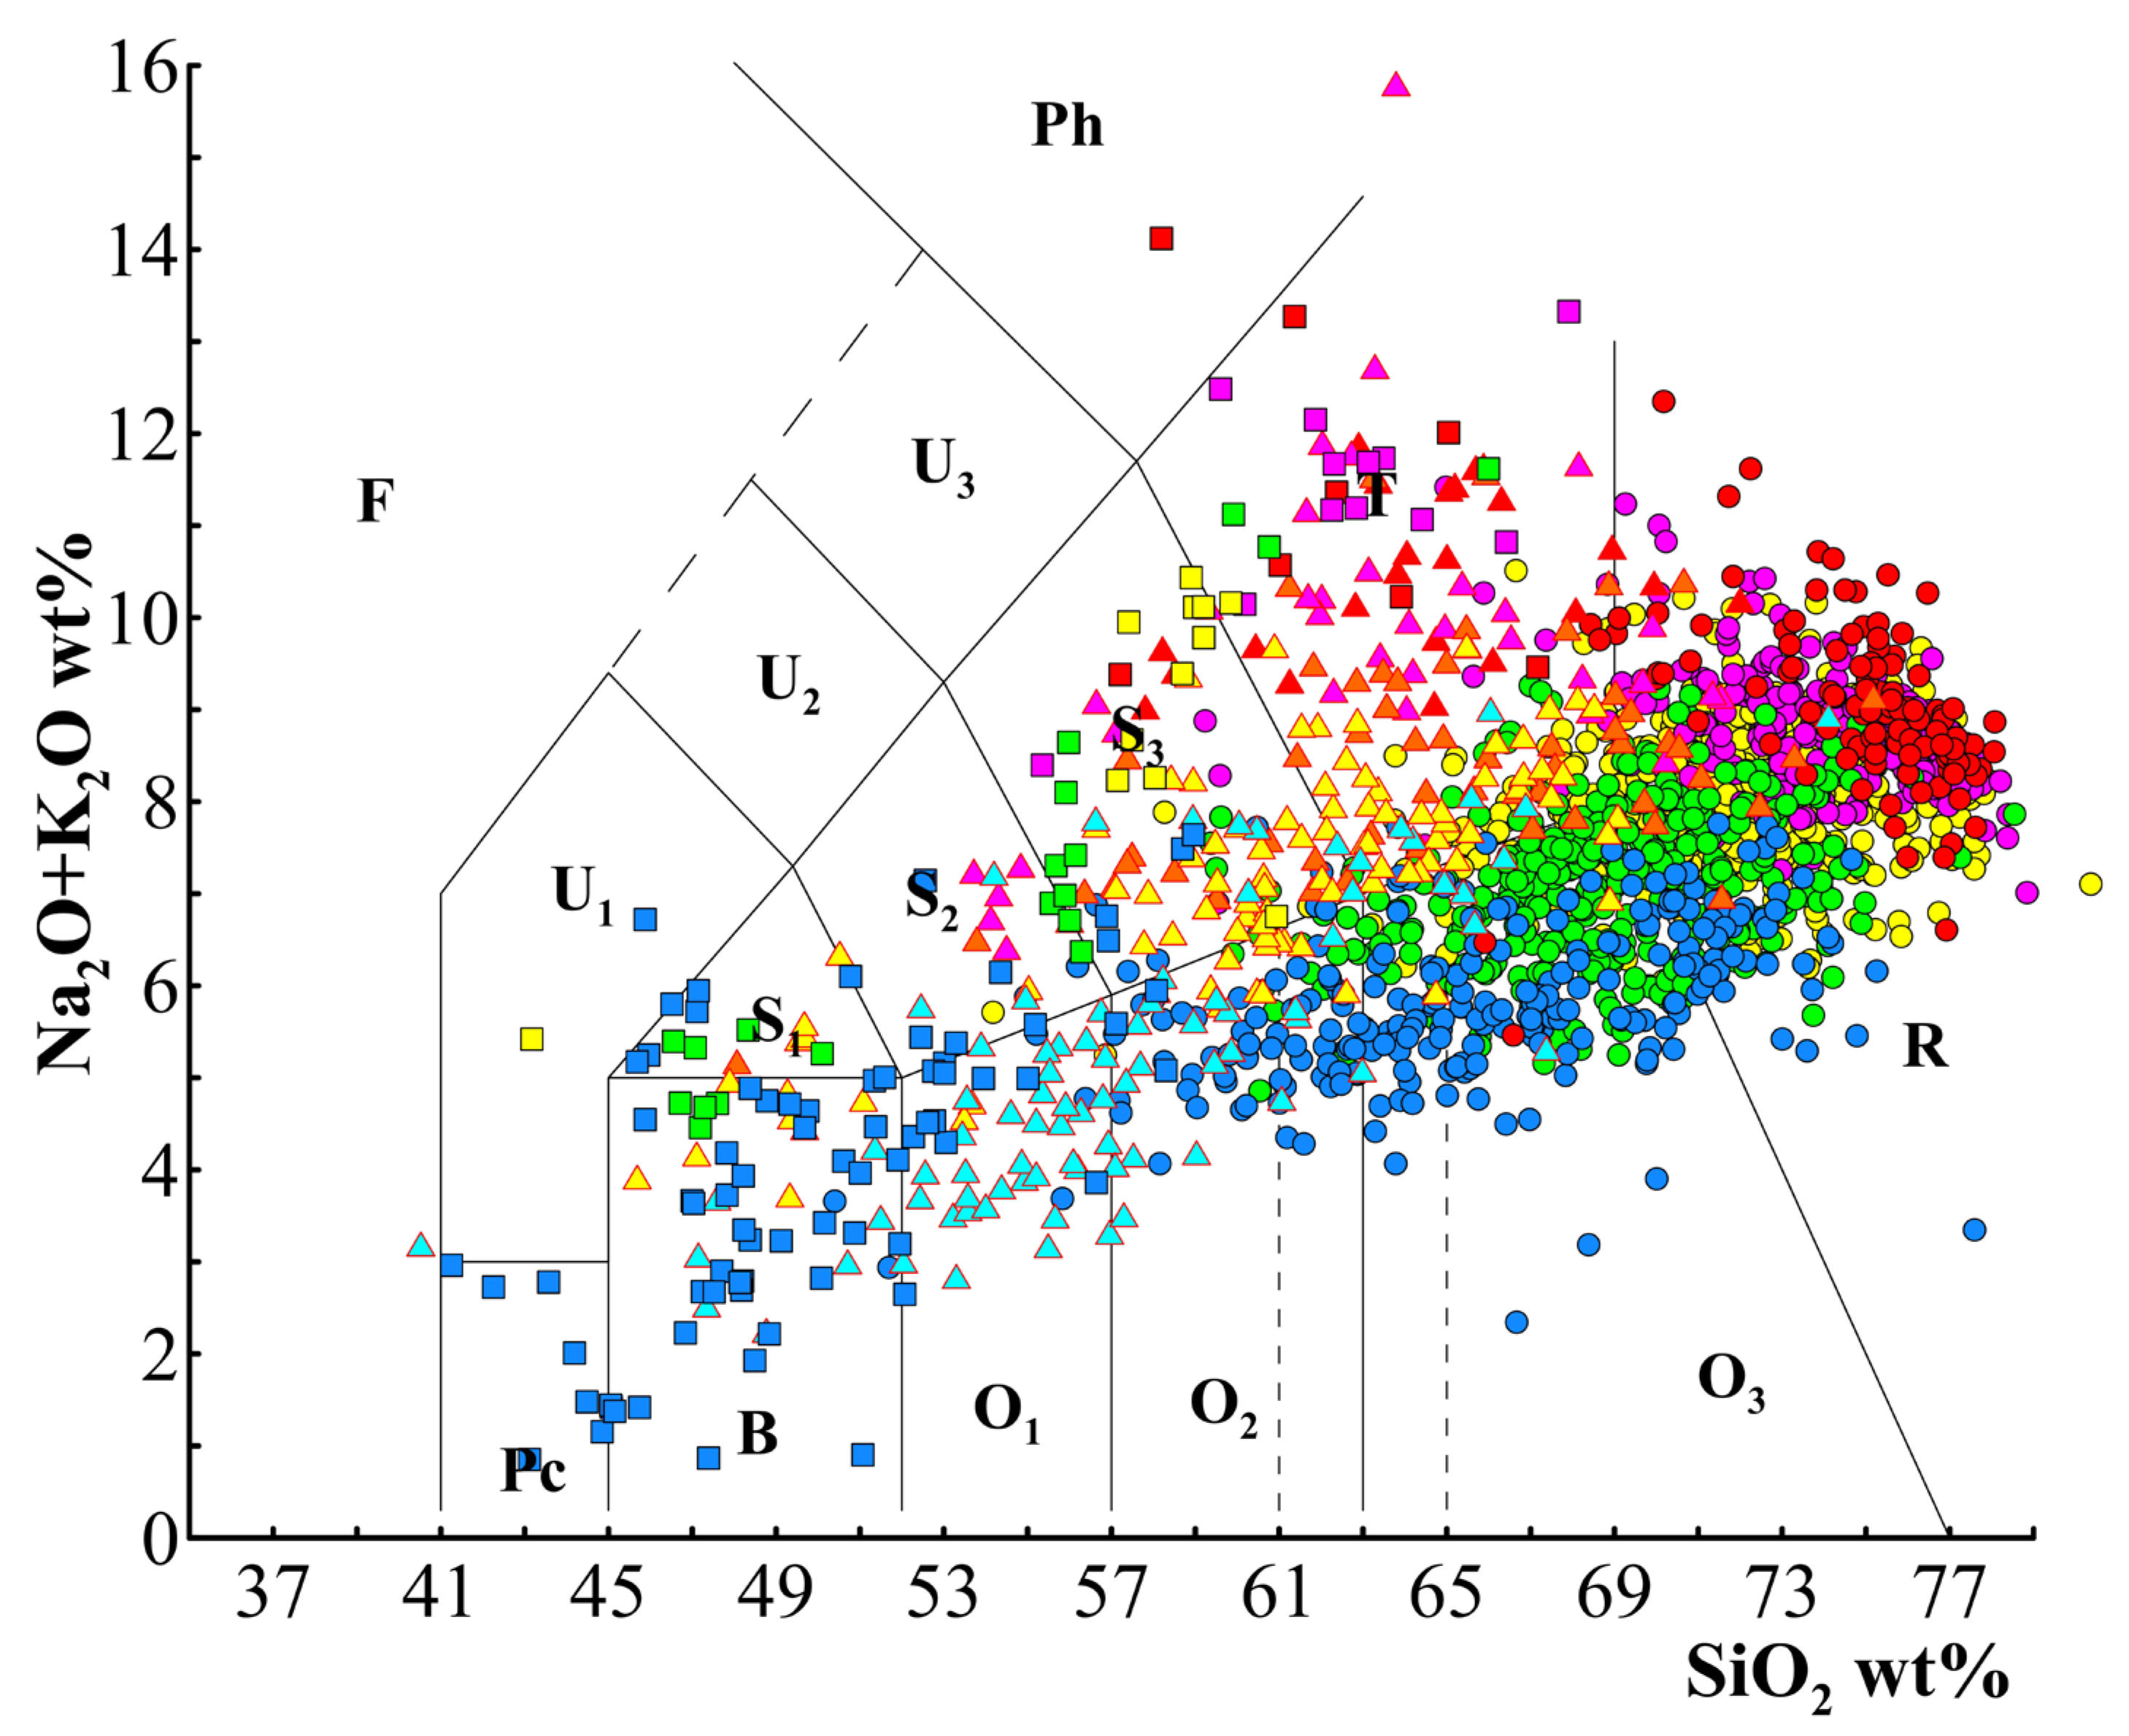
This study evaluates the reliability of geochemical classification diagrams against the modal QAP scheme using a systematically compiled global dataset of 1981 samples (Table 1). Each sample includes both whole-rock geochemical data and corresponding quantitative mineral modes—primarily obtained by point-counting (see Supplementary Files for data sources). The actual mineral mode of each sample was projected onto the QAP diagram, while its geochemical parameters were plotted in three discrimination diagrams: P-Q, SCK, and TAS (Figure 2, Figure 3 and Figure 4). In these geochemical diagrams, sample points are color-coded according to the lithology determined by their modal QAP projection.
Table 1.
The sample size of the compiled plutonic data in the different QAP zones.
Figure 2.
Projection of the compiled data on the P-Q diagram (base map after [,]. 3a(+2)—Syenogranite and Alkali-feldspar granite; 3b—Monzogranite; 4—Granodiorite; 5—Tonalite; 7*(+6*)—Quartz syenite and quartz alkali-feldspar syenite; 8*—Quartz monzonite; 9*—Quartz monzodiorite; 10*—Quartz diorite/quartz gabbro; 7(+6)—Syenite and alkali-feldspar syenite; 8—Monzonite; 9—Monzodiorite; 10—Diorite/Gabbro.
Figure 3.
Projection of the compiled data on the SCK diagram (original plot from [], but the axis and boundaries are transformed by SiO2′ = SiO2 + 20.4 × CaO/(CaO + K2O) − 64.8, after []). The legend is the same as in Figure 2. 2—Alkali feldspar granite; 3a—Syenogranite; 3b—Monzogranite; 4—Granodiorite; 5—Tonalite; 6*—Quartz alkali feldspar syenite; 7*—Quartz syenite; 8*—Quartz monzonite; 9*—Quartz monzodiorite; 10*—Quartz diorite/quartz gabbro; 6—Alkali feldspar syenite; 7—Syenite; 8—Monzonite; 9—Monzodiorite; 10—Diorite/Gabbro; 6′—Feldspathoid syenite; 7′—Feldspathoid monzosyenite; 9′—Feldspathoid monzodiorite; 10′—Olivine/feldspathoid diorite/gabbro.
Figure 4.
Projection of the compiled data on the TAS diagram (base map boundaries after []; nomenclature after []). The legend is the same as in Figure 2. R—granite; O3—granodiorite; O2—tonalite; O1—quartz diorite; B—gabbro/diorite; Pc—olivine gabbro; T—syenite; S3—monzonite; S2—monzodiorite; S1—monzogabbro; Ph—feldspathoid syenite; U3—feldspathoid monzosyenite; U2—feldspathoid monzodiorite; U1—feldspathoid gabbro; F—foidite. The vertical dot lines at SiO2 = 61% and 65% bracket the “Tonalite” region in TAS diagram as proposed by Middlemost [] (pp. 47–48).
To facilitate comparison, the categories in the P-Q and SCK diagrams were aligned with the zones of the QAP classification system (Figure 1). A sample was counted as correctly classified (“1”) if the rock name derived from the geochemical diagram matched that from the QAP classification; otherwise, it was marked as incorrect (“0”). The overall accuracy (replication rate) of each diagram was calculated as the proportion of samples falling into the “correct” QAP zones.
For the P-Q and SCK diagrams, accuracy was also evaluated in terms of two criteria:
Quartz Content Discrimination: A sample was considered correctly classified if it fell within the same rock field or an adjacent horizontal zone (i.e., with equivalent quartz content) in the geochemical diagram. For example, QAP-classified syenogranite (Zone 3a) samples plotted in Zones 3a, 3b, or 2 were all deemed correct.
Alkali Feldspar-to-Plagioclase Ratio Discrimination: A sample was regarded as correctly classified if it fell within the same rock zone or an adjacent vertical zone (i.e., with equivalent feldspar ratio). For instance, QAP-classified quartz syenite (Zone 7) samples located in Zones 7, 7*, or 3a were considered correct.
3. Results
3.1. P-Q Diagram
Niggli [] proposed that major oxide compositions of igneous, metamorphic, and sedimentary rocks could be converted into cationic values, thereby defining cationic ratios of rock-forming minerals—an approach once widely used in igneous petrology []. Building on this concept, Debon and Le Fort [,] developed a cation-number-based classification diagram for common intrusive rocks. Its core idea involves chemically simulating the QAP diagram, specifically through two coordinates: the Q coordinate (=[Si/3 − (Na + K + 2 × Ca/3)]), which reflects quartz content in common granitoids, and the P coordinate (=[K − (Na + Ca)]), which indicates the proportion of alkali feldspar to total feldspar [].
To evaluate the reliability of the P-Q diagram against the modal QAP classification, we plotted all samples on the P-Q diagram (Figure 2), with each point colored according to the lithology defined by its actual mineral mode.
Statistical analysis shows that, of the 1981 samples, 1114 are consistently classified by both the P-Q diagram and the QAP scheme, yielding an overall accuracy of approximately 56%. A breakdown by rock type (considering only fields with >50 samples; Table 2) reveals that, except for alkali feldspar granite (Zone 2) and quartz monzonite (Zone 8*), the P-Q diagram achieves accuracies between 40% and 70% for most rock types, with the majority falling in the 55%–70% range. Notably, when granites sensu stricto (QAP Zone 3) are not subdivided into syenogranite (Zone 3a) and monzogranite (Zone 3b), the identification accuracy rises significantly to 87%.
Table 2.
Lithology identification accuracy rates of the granitoid rocks in the P-Q diagram.
We further evaluated the performance of the P-Q diagram in distinguishing quartz content and alkali feldspar-to-plagioclase ratio separately (Table 3 and Table 4). As shown in Table 3, the diagram achieves high accuracy (≥90%) in identifying quartz content for most granitoids (Zones 2, 3a, 3b, 4, 5). In contrast, accuracy drops to 50%–65% for rocks with lower quartz content, such as quartz monzonite (Zone 8*), quartz monzodiorite (Zone 9*), quartz diorite (10*), and diorite (Zone 10). Table 4 indicates that the P-Q diagram performs moderately (55%–71%) in identifying feldspar ratios for typical granitoids, but achieves higher accuracy (~80%) for quartz diorite (Zone 10*) and diorite (Zone 10).
Table 3.
Identification accuracy rates of the relative proportions of quartz in the P-Q diagram.
Table 4.
Identification accuracy rates of the alkali-feldspar to plagioclase ratio in the P-Q diagram.
3.2. SiO2-CaO/(CaO + K2O) Diagram
The SiO2–CaO/(CaO + K2O) diagram (SCK diagram) was empirically derived by Enrique and Esteve [] as a geochemical proxy for the CIPW normative Q′–ANOR diagram of Streckeisen and Le Maitre []. In this scheme, SiO2 content serves as an indicator of quartz abundance, while the CaO/(CaO + K2O) ratio approximates the relative proportion of plagioclase to alkali feldspar.
Projection of the compiled samples onto the SCK diagram (Figure 3) shows that 989 out of the 1981 samples are consistently classified by both the SCK and QAP schemes, corresponding to an overall accuracy of approximately 50%.
A breakdown by rock type (Table 5; including only zones with >50 samples) indicates that, except for tonalite (Zone 5), quartz monzonite (Zone 8*), and diorite (Zone 10), the SCK diagram yields accuracies between 40% and 60% for other rock types—a relatively low performance from a statistical perspective. Notably, the diagram performs considerably better for tonalite, with an accuracy of ~80%. When granites sensu stricto (QAP Zone 3) are considered as a single group without subdivision into syenogranite (Zone 3a) and monzogranite (Zone 3b), the accuracy improves to 70%.
Table 5.
Lithology identification accuracy rates of the granitoid rocks in the SCK diagram.
We further assessed the SCK diagram’s ability to discriminate quartz content and feldspar ratio separately (Table 6 and Table 7). As summarized in Table 6, the diagram shows relatively high accuracy (77%–89%) in identifying quartz content for most granitoids (Zones 2, 3a, 3b, 4, 5). Performance is moderate (59%–71%) for rocks with lower quartz content, such as quartz monzonite (Zone 8*), quartz monzodiorite (Zone 9*), and quartz diorite (Zone 10*), but drops markedly to 38% for diorite (Zone 10).
Table 6.
Identification accuracy rates of the relative proportions of quartz in the SCK diagram.
Table 7.
Identification accuracy rates of the alkali-feldspar to plagioclase ratio in the SCK diagram.
Table 7 shows that the SCK diagram achieves high accuracy (83%–89%) in identifying the feldspar ratio for samples where plagioclase constitutes over 90% of total feldspar, including tonalite (Zone 5), quartz diorite (Zone 10*), and diorite (Zone 10). In contrast, accuracy is considerably lower (44%–66%) for rocks with significant alkali feldspar contents, such as granite (Zones 2, 3a, 3b), granodiorite (Zone 4), quartz monzonite (Zone 8*), and quartz monzodiorite (Zone 9*).
3.3. Total Alkali—Silica (TAS) Diagram
The total alkali–silica (TAS) diagram was initially introduced for the classification of volcanic rocks []. Although it has also been proposed for use in plutonic rock nomenclature [,,], it has not been formally adopted by the IUGS for this purpose. Middlemost [] presented a TAS scheme for intrusive rocks that largely mirrors the volcanic TAS diagram in field boundaries, with volcanic rock names replaced by their plutonic equivalents. This version has been widely applied in practice, despite lacking IUGS endorsement. Bellieni et al. [] further contended that only minor adjustments were needed to adapt the TAS diagram for common intrusive rocks.
Unlike the P-Q, SCK, and Q′–ANOR diagrams, the TAS diagram uses the sum of Na2O and K2O (in wt%) to reflect variations in feldspar composition, whereas the other diagrams employ specific parameters to represent the alkali feldspar-to-plagioclase ratio—corresponding to the horizontal dimension of the QAP triangle. As a result, there is no strict correspondence between the TAS diagram and the QAP system or its geochemical proxies [].
This discrepancy raises the question of whether a TAS diagram can be designed to align with the modal QAP scheme—a challenge currently being addressed by the IUGS Task Group on Igneous Rocks [,].
In this study, we examine this issue using the global dataset of felsic intrusive rocks with both chemical and modal mineralogical data. Two analytical approaches were applied:
Projecting whole-rock compositions of QAP-classified samples onto the TAS diagram to observe the distribution of lithologies within TAS fields (Figure 4, Supplementary Figure S4; Table 8); and analyzing the QAP nomenclature of samples falling within specific TAS fields (Supplementary Figure S5; Table 9).
Table 8.
Percentage distribution of rock types (n > 50) across the TAS diagram zones (in column) relative to the QAP classification.
Table 9.
The QAP zone distribution (%, in column) of rock types (n > 50) benchmarked against the TAS classification.
As summarized in Table 8, samples of alkali feldspar granite (Zone 2), syenogranite (Zone 3a), and monzogranite (Zone 3b) predominantly (>85%) plot within the R (granite) field of the TAS diagram. In contrast, other lithologies exhibit more scattered distributions:
Granodiorite (Zone 4) occurs mainly in O3 (52%) and R (36%);
Tonalite (Zone 5) is concentrated in O3 (48%), O2 (24%), and R (20%);
Quartz monzonite (Zone 8*) is distributed across T (50%), R (24%), and S3 (22%);
Quartz monzodiorite (Zone 9*) appears mainly in T (38%), S3 (30%), and O2 (13%);
Quartz diorite (Zone 10*) is found chiefly in O1 (40%), O2 (25%), B (8%), and T (7%);
Diorite (Zone 10) lies predominantly in B (50%), O1 (14%), Pc (9%), S2 (8%), and S1 (8%).
These patterns indicate that, apart from granite sensu stricto and alkali feldspar granite, most lithologies show considerable dispersion and overlap in the TAS diagram, with no statistically consistent correspondence between TAS and QAP classifications for non-granitic felsic intrusive rocks.
A reverse analysis (Table 9) further confirms this mismatch:
The TAS R field corresponds mainly to monzogranite (~50%), syenogranite (~18%), alkali feldspar granite (~11%), and granodiorite (~14%);
The O3 field is dominated by granodiorite (55%), tonalite (31%), and monzogranite (10%);
The O2 field consists largely of tonalite (53%), quartz diorite (18%), granodiorite (16%), and quartz monzodiorite (11%);
The O1 field includes quartz diorite (64%), diorite (21%), and tonalite (9%);
The B field is composed chiefly of diorite (66%), quartz diorite (12%), and quartz monzodiorite.
Moreover, samples within the T (syenite) and S3 (monzonite) TAS fields exhibit highly dispersed QAP affiliations, covering a wide range of intermediate to felsic lithologies.
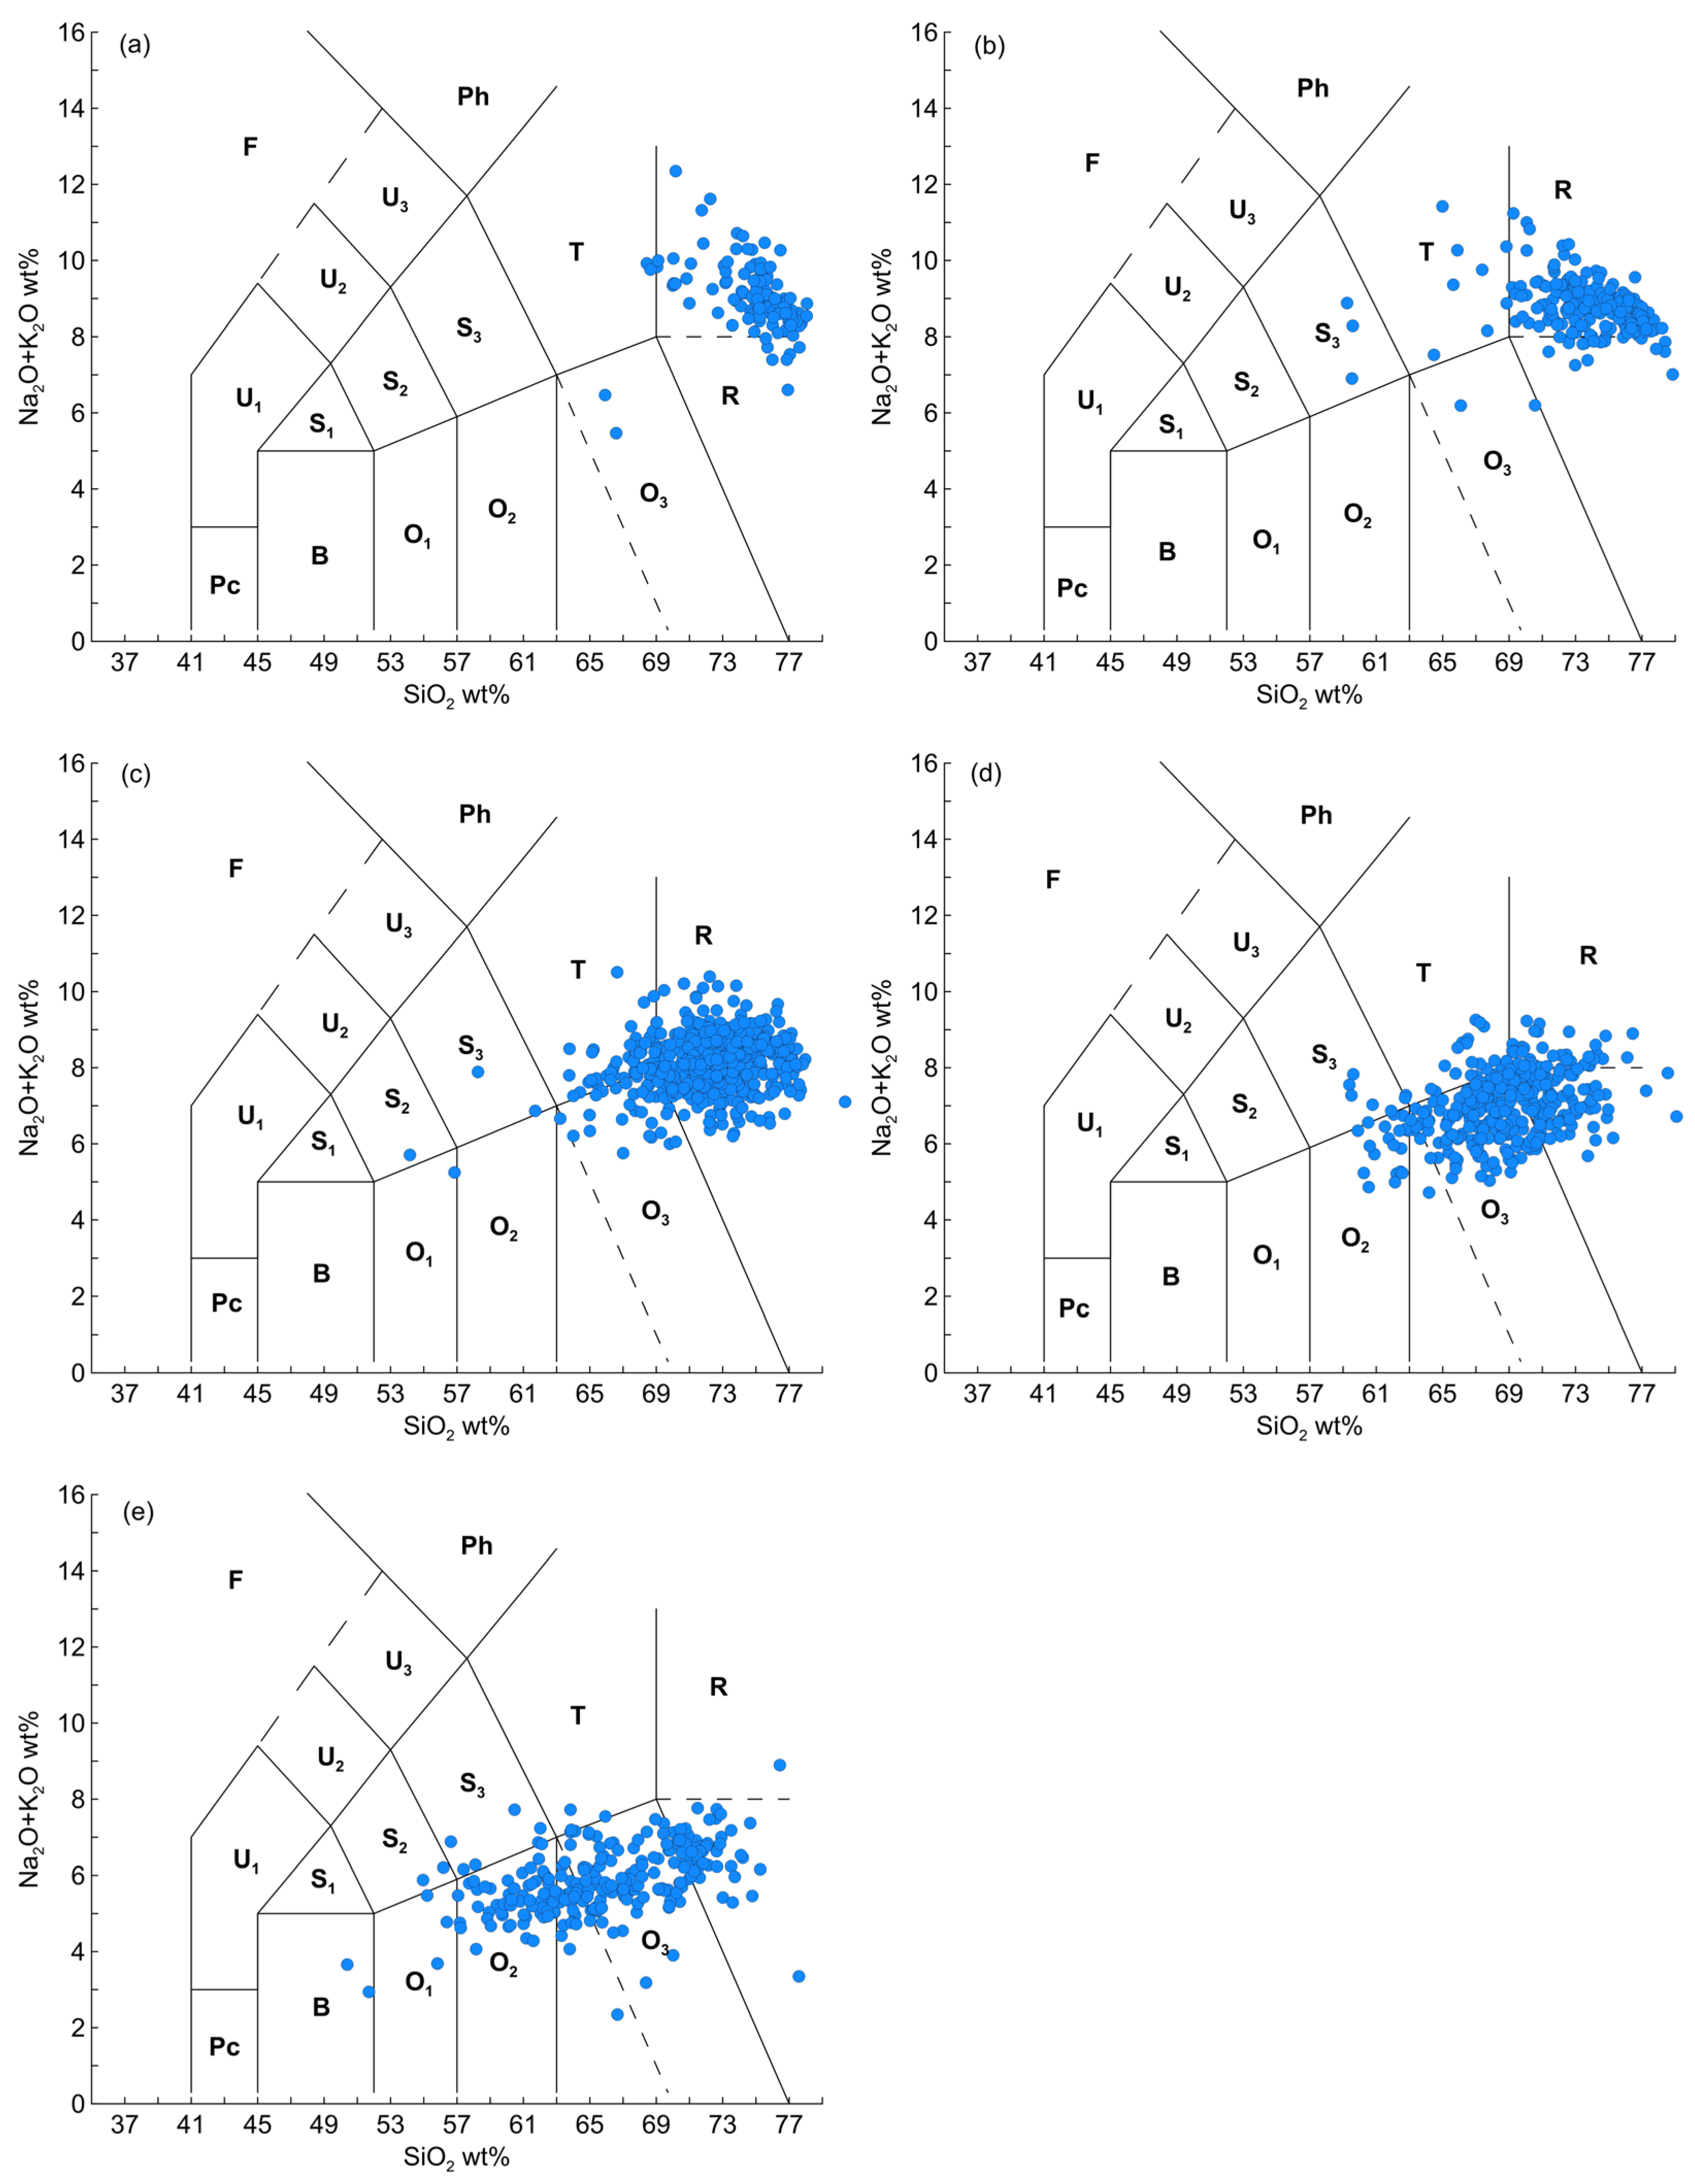
Compared with the earlier study by Bellieni et al. [] based on 278 samples, our larger dataset (1981 samples) reveals more pronounced overlaps and misclassifications (Figure 5). In particular:
Figure 5.
Distribution of data points from the (a) zone 2, (b) zone 3a, (c) zone 3b, (d) zone 4, (e) zone 5 of the QAP scheme on the TAS diagram (base map boundaries after []; nomenclature after []). R—Granite; O3—Granodiorite; O2—Tonalite; O1—Diorite; B—Gabbro; Pc—Olivine gabbro; T—Syenite; S3—Monzonite; S2—Monzodiorite; S1—Monzogabbro; Ph—Feldspathoid syenite; U3—Feldspathoid monzosyenite; U2—Feldspathoid monzodiorite; U1—Feldspathoid gabbro; F—Foidite. The dash lines are introduced by Bellieni et al. [].
Alkali feldspar granite and syenogranite cannot be reliably distinguished in the TAS diagram (Figure 5a,b);
Syenogranite and monzogranite show substantial overlap in total alkali content (Figure 5b,c);
Granodiorite primarily plots in the O3 field, with secondary occurrences in R, O2, and T (Figure 5d);
Tonalite mainly falls in O3, followed by O2 and R (Figure 5e), making it difficult to distinguish from granodiorite using the TAS diagram alone.
4. Discussions
For common plutonic rocks, neither the cation-based P-Q diagram nor the element-based SCK or TAS diagram performs well in reproducing QAP nomenclature. Our previous studies also indicate that CIPW norm-based diagrams exhibit low consistency with the QAP scheme [,]. For instance, the Q′–ANOR diagram shows an overall accuracy of only 55% (Table 10; Supplementary Figure S6), comparable to that of the SCK diagram. It performs poorly in identifying tonalite (~57%), quartz diorite (~54%), and diorite (~53%)—samples with plagioclase-to-total feldspar ratios exceeding 90%—while achieving better accuracy (~85%) for alkali feldspar granite (Zone 2) [].
Table 10.
Lithology identification accuracy rates of granitoid rocks in the Q′–ANOR diagram (after []).
In the P-Q, SCK, and Q′–ANOR diagrams, the quartz content indicator performs well for granitic rocks (zones 2, 3a, 3b, 4, 5; quartz/(feldspars + quartz) > 20%), but poorly for intermediate and basic types (zones 8, 9, 10, 10*; quartz/(feldspars + quartz) < 20%) (Table 2 and Table 5; []). This discrepancy can be attributed to the higher mafic mineral content in intermediate and basic rocks, as noted by Galindo et al. []. Furthermore, the empirical estimation of the alkali feldspar-to-plagioclase ratio leads to unsatisfactory discrimination among different granitic rocks (e.g., alkali feldspar granite, syenogranite, monzogranite, granodiorite) in these diagrams [,]. The presence of abundant micas also introduces significant inconsistencies between modal QAP and geochemical classifications [,].
Synthesizing the accuracy results from the P-Q, SCK, and Q′–ANOR diagrams yields several key observations:
Overall accuracy is relatively low, slightly above 50%—comparable to random chance;
Quartz content is more reliably identified than feldspar proportions, with the Q′–ANOR and P-Q diagrams performing better in this regard;
The SCK diagram shows high accuracy in identifying tonalite;
Accuracy improves significantly for granite (s.s.) when syenogranite and monzogranite are grouped together.
The inconsistency between the TAS and QAP classifications indicates that the TAS diagram is unsuitable for nomenclature of common intrusive rocks when the modal QAP scheme is used as the benchmark. Simply replacing volcanic rock names with their intrusive equivalents in the TAS diagram represents an oversimplification. This is because:
The QAP scheme is based on the proportion between plagioclase and alkali feldspar, while the TAS uses (Na2O + K2O) to approximate alkali feldspar content;
The QAP classification considers only quartz and feldspars, whereas the TAS diagram uses whole-rock SiO2 and (Na2O + K2O) values that include contributions from all minerals—particularly significant in basic and intermediate rock types.
Fundamentally, diagrams such as QUORAA, Q′–ANOR, P-Q, SCK, and TAS cannot serve as reliable diagnostic tools for granitoid nomenclature because they estimate major mineral proportions using only three or four major oxides. This approach is equivalent to dimensionality reduction in high-dimensional geochemical data, resulting in substantial information loss. Bonin et al. [] applied linear discriminant analysis (LDA) to granitoid major-element data and found that LD1 (mainly determined by SiO2, TFeO, Na2O, and K2O) accounts for 53.6% of variance, LD2 (Al2O3, Na2O) for 32.6%, and LD3 (CaO) for 9.8%. The geochemical diagrams considered here incorporate only three major oxides (SiO2, K2O, and CaO or Na2O) from LD1, reflecting at most 50% of the major-element characteristics, whereas the QAP scheme effectively incorporates oxides contributing to LD1–LD3.
The IUGS-recommended QAP scheme focuses on felsic minerals [], but other minerals also contain Si, Ca, and alkali oxides. For example, micas—often the most abundant carriers of K and Al in granitoids—shift geochemical projections toward alkali feldspar-rich fields in the P-Q, SCK, and Q′–ANOR diagrams. Conversely, amphibole and pyroxene, which are Si-deficient and often Ca-rich, shift projections toward silica-poor and plagioclase-rich domains. These effects are particularly pronounced in melanogranitoids rich in mafic minerals [].
As noted by Santos and Hartmann [], Na is not a discriminating element in igneous rock classification, partly because it partitions into both plagioclase and alkali feldspar []. The P-Q and Q′–ANOR diagrams lack a proper mechanism for allocating sodium between feldspars, potentially leading to misclassification. Similarly, the absence of CaO in the TAS diagram prevents accurate estimation of alkali feldspar-to-plagioclase ratios, resulting in inconsistency with QAP nomenclature.
Glazner et al. [,] argued that the IUGS-recommended classification of intrusive rocks is overly complex, with some names rarely used in practice. We therefore propose a simplified “low-resolution” scheme: merging Zones 2, 3a, and 3b into granite (broad sense); Zones 6, 6, 7, 7*, 8, and 8* into syenitic rocks; and Zones 9, 9*, 10, and 10* into dioritic rocks, while retaining granodiorite and tonalite as distinct categories. This simplification significantly improves the naming accuracy of the P-Q, SCK, and Q′–ANOR diagrams, with overall identification accuracy exceeding 70% (Table 11). Both the Q′–ANOR and P-Q diagrams show high accuracy (>85%) for granite but perform poorly for tonalite (57% and 64%, respectively). Since granite constitutes about half of the compiled dataset, the overall accuracy of the Q′–ANOR and P-Q diagrams is slightly higher than that of the SCK diagram. However, based on median accuracy across the five major lithological categories, the SCK diagram performs best, achieving over 70% accuracy for tonalite, granite, dioritic rocks, and syenitic rocks, with only granodiorite showing lower accuracy (54%).
Table 11.
Lithology identification accuracy of each rock type relative to the QAP diagram after merging zones.
An intuitive and practical two-dimensional diagram for plutonic rock diagnostics should reflect both quartz content and alkali feldspar-to-plagioclase ratio—as in the Q′–ANOR, P-Q, and SCK diagrams—rather than follow the TAS approach. It should also adopt a simplified lithological categorization similar to the IUGS field QAP nomenclature, grouping common granitoids into five categories: granite, granodiorite, tonalite, syenitic rocks, and dioritic rocks. While the original 15-zone QAP diagram is useful for specialists, a “low-resolution” version is more suitable for general geoscientists and practitioners.
Linear programming methods can be used to derive the “true” mode of major minerals from bulk chemistry before projecting onto QAP diagrams []. However, this approach requires individual computation for each sample and is less efficient than conventional two-dimensional diagram plotting.
5. Summary
Based on the projection of 1981 global granitoid samples with paired whole-rock major element and modal mineralogical data onto three commonly used discrimination diagrams (P-Q, SCK, and TAS), the following conclusions are drawn:
- (1)
- These geochemical classification diagrams reproduce the modal QAP classification with an overall accuracy of only 50%–55% across the full dataset. Among the lithologies examined, identification accuracy is higher for granites sensu stricto (QAP zones 3a + 3b) than for other rock types.
- (2)
- The SCK diagram shows markedly better performance in identifying tonalite, with an accuracy of ~80%, compared to other diagrams.
- (3)
- The TAS diagram is only reliable for identifying granites sensu stricto. For intermediate to acidic plutonic rocks defined by QAP (e.g., tonalite, granodiorite, quartz diorite, and diorite), sample distributions in the TAS diagram are highly scattered. There is approximately a 50% probability that TAS-derived rock names will not match the lithology assigned by modal QAP classification.
Therefore, we conclude that current geochemical classification schemes are not reliable substitutes for the modal QAP scheme in the nomenclature of common plutonic rocks.
Supplementary Materials
The following supporting information can be downloaded at: https://www.mdpi.com/article/10.3390/min15111165/s1, Figure S1: Projections of the QAP-defined lithologies on the P-Q diagram; Figure S2: Projections of the QAP-defined lithologies on the SCK diagram; Figure S3: Projections of the QAP-defined lithologies on the TAS diagram []; Figure S4: Distribution of the rock types across TAS diagram fields relative to the QAP classification; Figure S5: Proportional distribution of the rock types across QAP diagram zones with the TAS classification as the reference standard []; Figure S6: Projections of the QAP-defined lithologies on the Q′–ANOR diagram. Tables S1 and S2: data compilations with sources [,,,,,,,,,,,,,,,,,,,,,,,,,,,,,,,,,,,,,,,,,,,,,,,,,,,,,,,,,,,,,,,,,,,,].
Author Contributions
Conceptualization, Y.W.; methodology, S.C. and Y.W.; validation, S.C. and Y.W.; formal analysis, S.C. and Y.W.; investigation, S.C. and Y.W.; resources, Y.W.; data curation, S.C.; writing—original draft preparation, S.C.; writing—review and editing, Y.W. All authors have read and agreed to the published version of the manuscript.
Funding
This work was financially funded by the National Natural Science Foundation of China (Grant Nos. 40572128, 41102122, 41772201).
Data Availability Statement
No new data were created in this study.
Acknowledgments
We would like to express our gratitude to the three reviewers for their insightful and constructive feedback, which significantly improved the quality of this paper.
Conflicts of Interest
The authors declare no conflicts of interest.
References
- Bonin, B.; Janoušek, V.; Moyen, J.F. Chemical variation, modal composition and classification of granitoids. Geol. Soc. Lond. Spec. Publ. 2020, 491, 9–51. [Google Scholar] [CrossRef]
- Le Bas, M.J. Igneous rock classification revisited: Simplicity won the day. Geol. Today 2006, 22, 53–55. [Google Scholar]
- González-Esvertit, E.; Prieto-Torrell, C.; Bons, P.D.; Canals, A.; Casas, J.M.; Elburg, M.A.; Gomez-Rivas, E. A review of the granite concept through time. Earth-Sci. Rev. 2025, 261, 105008. [Google Scholar] [CrossRef]
- Streckeisen, A. To each plutonic rock its proper name. Earth-Sci. Rev. 1976, 12, 1–33. [Google Scholar] [CrossRef]
- Le Maitre, R.W. Igneous Rocks: A Classification and Glossary of Terms: Recommendations of the International Union of Geological Sciences, Subcommission on the Systematics of Igneous Rocks, 2nd ed.; Cambridge University Press: Cambridge, UK, 2002; pp. 1–236. [Google Scholar]
- Frost, B.R.; Frost, C.D.; Anderson, L.A.; Barens, C.G.; Wilson, B.M. A more informative way to name plutonic rocks—Comment by Frost et al. GSA Today 2019, 29, 38–39. [Google Scholar] [CrossRef]
- Hogan, P. A more informative way to name plutonic rocks—Comment by Hogan. GSA Today 2019, 29, 40–41. [Google Scholar] [CrossRef]
- Cox, K.G.; Bell, J.D.; Pankhurst, R.J. The Interpretation of Igneous Rocks; Springer: Cham, Switzerland, 1979; pp. 1–450. [Google Scholar]
- Middlemost, E.A.K. Naming materials in the magma/igneous rock system. Earth-Sci. Rev. 1994, 37, 215–224. [Google Scholar] [CrossRef]
- Middlemost, E.A.K. Magmas, Rocks and Planetary Development: A Survey of Magma/Igneous Rock Systems; Routledge: London, UK, 1997; pp. 47–48. [Google Scholar]
- Rollinson, H.R. Using Geochemical Data: Evaluation, Presentation, Interpretation; Longman: London, UK, 1993; pp. 1–352. [Google Scholar]
- Rollinson, H.R.; Pease, V.L. Using Geochemical Data: To Understand Geological Processes, 2nd ed.; Cambridge University Press: Cambridge, UK, 2021; pp. 157–177. [Google Scholar]
- Petrelli, M. Machine Learning for Earth Sciences: Using Python to Solve Geological Problems; Springer: Cham, Switzerland, 2023; pp. 1–209. [Google Scholar]
- Streckeisen, A.; Le Maitre, R.W. Chemical approximation to modal QAPF classification of the igneous rocks. Neues Jahrb. Für Mineral. Abh. 1979, 136, 169–206. [Google Scholar]
- Enrique, P. Clasificación normativa de las rocas plutónicas saturadas y sobresaturadas en sílice basada en la clasificación modal QAP: El diagrama 2Q–(or+ab)–4an. Geogaceta 2018, 63, 95–98. [Google Scholar]
- Bellieni, G.; Justin-Visentin, E.; Zanettin, B. Use of the Chemical TAS diagram (Total Alkali Silica) for classification of plutonic rocks: Problems and suggestions. Plinius 1995, 14, 49–52. [Google Scholar]
- Enrique, P.; Esteve, S. A chemical approximation to the modal QAPF and normative Q′(F’)-ANOR classification of the igneous rocks based on their SiO2-CaO-K2O content. Geogaceta 2019, 66, 91–94. [Google Scholar]
- Debon, F.; Le Fort, P. A chemical–mineralogical classification of common plutonic rocks and associations. Trans. R. Soc. Edinb. 1983, 73, 135–149. [Google Scholar] [CrossRef]
- Debon, F.; Le Fort, P. A cationic classification of common plutonic rocks and their magmatic associations: Principles, method, applications. Bull. Minéral. 1988, 111, 493–510. [Google Scholar] [CrossRef]
- Lustrino, M.; 16 TGIR Members. IUGS Task Group on Igneous Rocks. 2022. Available online: https://www.iugs.org/_files/ugd/f1fc07_cefb1e00fc1f4a9d8d83019958867039.pdf?index=true (accessed on 16 January 2024).
- Lustrino, M.; 16 TGIR Members. A Revision of the IUGS Recommendations for Classification and Nomenclature of Igneous Rocks—A Preliminary Report (37th IGC, Busan 2024, IUGS Workshop, 30 August 2024). 2024. Available online: https://www.researchgate.net/publication/383708684 (accessed on 14 March 2025).
- Vilinovic, V.; Petřík, I. Classification of granitoid rocks according to mesonorm. Geol. Carpathica 1982, 33, 147–157. [Google Scholar]
- Galindo, A.C.; Nascimento, M.A.L.; Medeiros, V.C. Classificação/nomenclatura de rochas plutônicas com base em diagramas modais e químicos: Um estudo para ro-chas granitoides e dioritoides no extremo nordeste da província Borborema. Estud. Geol. 2019, 29, 180–195. [Google Scholar] [CrossRef]
- De La Roche, H.; Leterrier, J.; Grandclaude, P.; Marchal, M. A classification of volcanic and plutonic rocks using R1R2-diagram and major-element analyses—Its relationships with current nomenclature. Chem. Geol. 1980, 29, 183–210. [Google Scholar] [CrossRef]
- Sun, M.; Wang, Y. The 2Q–(Or + Ab)–4An (QUORAA) diagram: Poor for classification but good at deciphering the evolution of granitoids. J. Geosci. 2024, 69, 65–75. [Google Scholar] [CrossRef]
- Sun, M.; Wang, Y. The nomenclature and classification of granitoids and the petrochemical interpretation of geotectonic settings of granitoids: A case study of the Q′–ANOR diagram. Bull. Mineral. Petrol. Geochem. 2025, 44, 413–426. [Google Scholar] [CrossRef]
- Zhang, J.P.; Wang, Y. An evaluation on the petrochemical diagrams for discriminating plagioclase-rich granitoids. Geol. Rev. 2024, 70, 1963–1980, (In Chinese with English abstract). [Google Scholar]
- Santos, J.O.S.; Hartmann, L.A. Classification of common volcanic rocks based on degree of silica saturation and CaO/K2O ratio. An. Acad. Bras. Ciências 2021, 93, e20201202. [Google Scholar] [CrossRef]
- Sharpenok, L.; Kostin, A.; Kukharenko, E. Diagram ‘alkali sum-silica’ (TAS) for chemical classification and diagnostics of plutonic rocks. In Proceedings of the EGU General Assembly 2013, Vienna, Austria, 7–12 April 2013; Geophysical Research Abstracts. Volume 15, p. 13518. [Google Scholar]
- Sun, M.; Wang, Y. SiO2′–CaO/(CaO + K2O) (S’CK) diagram as a petrochemical tool for deciphering the tectono-magmatic characterization of granitoid suites. Acta Geol. Sin. Engl. Ed. 2025, 99, 598–610. [Google Scholar] [CrossRef]
- Niggli, P. Rocks and Mineral Deposits; W.H. Freeman and Company: San Francisco, CA, USA, 1954; pp. 1–559. [Google Scholar]
- McDonald, I. Reimagining Niggli Numbers for modern data applications in petrology and exploration geochemistry. Chem. Geol. 2024, 650, 121915. [Google Scholar] [CrossRef]
- Le Maitre, R.W. Some problems of the projection of chemical data into mineralogical classifications. Contrib. Mineral. Petrol. 1976, 56, 181–189. [Google Scholar] [CrossRef]
- Glazner, A.F.; Bartley, J.M.; Coleman, D.S. A more informative way to name plutonic rocks. GSA Today 2019, 29, 4–10. [Google Scholar] [CrossRef]
- Glazner, A.F.; Bartley, J.M.; Coleman, D.S. A more informative way to name plutonic rocks—Reply. GSA Today 2019, 29, 42–43. [Google Scholar] [CrossRef]
- Stanley, C. Lithogeochemical classification of igneous rocks using Streckeisen ternary diagrams. Geochem. Explor. Environ. Anal. 2017, 17, 63–91. [Google Scholar] [CrossRef]
- Weiss, S.; Troll, G. The Ballachulish Igneous Complex, Scotland: Petrography, mineral chemistry, and order of crystallization in the monzodiorite-quartz diorite suite and in the granite. J. Petrol. 1989, 30, 1069–1115. [Google Scholar] [CrossRef]
- Lipman, P.W. Gibson Peak Pluton: A discordant composite intrusion in the southeastern Trinity Alps, northern California. GSA Bull. 1963, 74, 1259–1280. [Google Scholar] [CrossRef]
- Bateman, P.C.; Nokleberg, W.J. Solidification of the Mount Givens granodiorite, Sierra Nevada, California. J. Geol. 1978, 86, 563–579. [Google Scholar] [CrossRef]
- Frost, C.D.; Frost, B.R.; Chamberlain, K.R.; Edwards, B.R. Petrogenesis of the 1.43 Ga Sherman Batholith, SE Wyoming, USA: A reduced, rapakivi-type anorogenic granite. J. Petrol. 1999, 40, 1771–1802. [Google Scholar] [CrossRef]
- Larson, E.S. Batholith and associated rocks of corona, Elsinore, and San Luis Rey quadrangles southern California. GSA Mem. 1948, 29, 1–175. [Google Scholar]
- Bateman, P.C.; Chappell, B.W.; Kistler, R.W.; Peck, D.L.; Busacca, A. Tuolumne Meadows Quadrangle, California-Analytic Data; USGS Bulletin 1819; U.S. Geological Survey: Denver, CO, USA, 1988; pp. 1–43.
- Hine, R.; Williams, I.S.; Chappell, B.W.; White, A.J.R. Contrasts between I- and S-type granitoids of the Kosciusko Batholith. J. Geol. Soc. Aust. 1978, 25, 219–234. [Google Scholar] [CrossRef]
- Bai, Z.; Xu, S.; Ge, S. Badaling Magmatic Complex; Geological Publishing House: Beijing, China, 1991; pp. 1–169. (In Chinese) [Google Scholar]
- Wang, J.; Li, B.; Zhou, D.; Yao, S.; Li, Z. Geological Characteristics of the Intermediate—Acid Plutons of Hebei Province and Their Relations to the Ore-Forming Processes; Geological Publishing House: Beijing, China, 1994; pp. 1–213. (In Chinese) [Google Scholar]
- Wolska, A. Petrology and geochemistry of granitoids and their mafic microgranular enclaves (MME) in marginal part of the Małopolska Block (S Poland). Mineralogia 2012, 43, 3–127. [Google Scholar] [CrossRef]
- Rodríguez-García, G.; Ramírez, D.A.; Zapata, J.P.; Correa-Martínez, A.M.; Sabrica, C.; Obando, G. Redefinición, correlación e implicaciones geotectónicas del batolito de Ibagué, Colombia (Redefinition, correlation and geotectonic implications of the batholith of Ibagué, Colombia). Boletín Geol. 2022, 44, 65–93. [Google Scholar]
- Poubova, M. Composition of amphiboles and rock type subdivisions in the Central Bohemian Pluton. Krystalinikum 1974, 10, 149–169. [Google Scholar]
- Bateman, P.C.; Dodge, F.C.W.; Bruggman, P.E. Major Oxide Analyses, CIPW Norms, Modes, and Bulk Specific Gravities of Plutonic Rocks from the Mariposa 1° × 2° Sheet, Central Sierra Nevada. California; USGS Open-File Report 84-162; U.S. Geological Survey: Denver, CO, USA, 1984; pp. 1–50.
- de Waard, D. The anorthosite-charnockite suite of rocks of Roaring Brook valley in the eastern Adirondacks (Marcy Massif). Am. Mineral. 1970, 55, 2063–2075. [Google Scholar]
- Malm, O.A.; Ormaasen, D.E. Mangerite charnockite intrusives in the Lofoten-Vesteralen area, North Norway: Petrography, chemistry and petrology. Nor. Geol. Unders. 1978, 338, 83–114. [Google Scholar]
- Archibald, D.B. Field Relations, Petrology, and Tectonic Setting of the Ordovician West Barneys River Plutonic Suite, Southern Antigonish Highlands, Nova Scotia. Master’s Thesis, Acadia University, Wolfville, NS, Canada, 2013; pp. 1–259. [Google Scholar]
- Whalen, J.B. Geology, petrography, and geochemistry of Appalachian granites in New Brunswick and Gaspesie, Quebec. Geol. Surv. Can. Bull. 1993, 436, 130. [Google Scholar]
- du Bray, E.A. Distribution, petrology, and mineral potential of peraluminous granitoid plutons in the eastern and southeastern Arabian Shield, Kingdom of Saudi Arabia. U.S. Geol. Surv. Bull. 1984, 1694, 13–32. [Google Scholar]
- Ramsay, C.R.; Drysdall, A.R.; Clark, M.D. Felsic plutonic rocks of the Midyan region, Kingdom of Saudi Arabia I. Distribution, classification and resource potential. J. Afr. Earth Sci. 1986, 4, 63–77. [Google Scholar] [CrossRef]
- Douch, C.J. Ratamah specialized granite, Midyan region, Kingdom of Saudi Arabia; rock types, geochemistry and rare-metal distribution. J. Afr. Earth Sci. 1986, 4, 177–182. [Google Scholar] [CrossRef]
- Tayyar, J.A.; Jackson, N.J.; Al-Yazid, S. Geology and mineralization of the Jabalat alkali-feldspar granite, northern Asir region, Kingdom of Saudi Arabia. J. Afr. Earth Sci. 1986, 4, 183–188. [Google Scholar] [CrossRef]
- Bokhari, M.M.; Jackson, N.J.; Al Oweidi, K. Geology and mineralization of the Jabal Umm Al Suqian albitized apogranite, southern Najd region, Kingdom of Saudi Arabia. J. Afr. Earth Sci. 1986, 4, 189–198. [Google Scholar] [CrossRef]
- du Bray, E.A.; Holm-Denoma, C.S.; San Juan, C.A.; Lund, K.; Premo, W.R.; DeWitt, E. Geochemical, modal, and geochronologic data for 1.4 Ga A-type granitoid intrusions of the conterminous United States. U.S. Geol. Surv. Data Ser. 2015, 942, 1–19. [Google Scholar]
- Kamaunji, V.D.; Wang, L.-X.; Chen, W.; Girei, M.B.; Ahmed, H.A.; Zhu, Y.-X.; Vincent, V.I.; Cao, L. Petrogenesis and rare-metal mineralization of the Ririwai alkaline granitoids, north-central Nigeria: Mineralogical and geochemical constraints. Int. Geol. Rev. 2024, 66, 2409–2439. [Google Scholar] [CrossRef]
- Puchalski, R. Field Relations and Petrology of the Trafalgar Plutonic Suite, Northeastern Meguma Terrane, Nova Scotia. Master’s Thesis, Acadia University, Wolfville, NS, Canada, 2012; pp. 1–338. [Google Scholar]
- Joplin, G.A. A Petrography of Australian Igneous Rocks, Including Material from the Territory of Papua and New Guinea; Revised Edition; Angus and Robertson: Sydney, Australia, 1971; pp. 1–253. [Google Scholar]
- Noyes, H.J.; Wones, D.R.; Frey, F.A. A tale of two plutons: Petrographic and mineralogic constraints on the petrogenesis of the Red Lake and Eagle Peak plutons, central Sierra Nevada, California. J. Geol. 1983, 91, 353–379. [Google Scholar] [CrossRef]
- Mahlburg Kay, S.; Kay, R.W.; Brueckner, H.K.; Rubenstone, J.L. Tholeiitic Aleutian Arc Plutonism: The Finger Bay Pluton, Adak, Alaska. Contrib. Mineral. Petrol. 1983, 82, 99–116. [Google Scholar]
- Azman, A.G. Petrology and geochemistry of granite and syenite from Perhentian Island, Peninsular Malaysia. Geosci. J. 2001, 5, 123–137. [Google Scholar] [CrossRef]
- Kaygusuz, A.; Siebel, W.; Sen, C.; Satir, M. Petrochemistry and petrology of I-type granitoids in an arc setting: The composite Torul pluton, Eastern Pontides, NE Turkey. Int. J. Earth Sci. 2008, 97, 739–764. [Google Scholar] [CrossRef]
- Srivastava, S.K.; Hamilton, S.; Nayak, S.; Pandey, U.K.; Mohanty, R.; Umamaheswar, K. Petrography, geochemistry and Rb-Sr geochronology of the basement granitoids from Umthongkut Area, West Khasi Hills District, Meghalaya, India: Implications on petrogenesis and uranium mineralization. J. Geol. Soc. India 2015, 86, 59–70. [Google Scholar] [CrossRef]
- Wolczanski, H.A.; Barr, S.M.; Miller, B.V. Petrology, age, and tectonic setting of the Wolves Pluton: Implications for Appalachian terranes in the western Bay of Fundy region. Atl. Geol. 2007, 43, 57–73. [Google Scholar] [CrossRef] [PubMed]
- Young, D.A. A quartz syenite intrusion in the New Jersey Highlands. J. Petrol. 1972, 13, 511–528. [Google Scholar] [CrossRef]
- Conceição, J.A.; Silva Rosa, M.L.; Conceição, H. Sienogranitos leucocráticos do Domínio Macururé, Sistema Orogênico Sergipano, Nordeste do Brasil: Stock Glória Sul (Leucocratic syenogranites the Macururé Domain, Sergipano Orogenic System, Northeastern Brazil: Glória Sul Stock). Braz. J. Geol. 2016, 46, 63–77. [Google Scholar] [CrossRef]
- Ahmed, F. The geology of J. Qeili igneous complex, Central Sudan. Geol. Rundsch. 1975, 64, 835–846. [Google Scholar] [CrossRef]
- Paiva, A.L., Jr.; Lamarão, C.N.; Lima, P.H.A. Geologia, petrografi a e geoquímica do Batólito Seringa, Província Carajás, SSE do Pará. Rev. Bras. Geociênc. 2011, 41, 185–202. [Google Scholar] [CrossRef]
- Valério, C.S.; Souza, V.S.; Macambira, M.J.B. The 1.90–1.88 Ga magmatism in the southernmost Guyana Shield, Amazonas, Brazil: Geology, geochemistry, zircon geochronology, and tectonic implications. J. S. Am. Earth Sci. 2009, 28, 304–320. [Google Scholar] [CrossRef]
- Duffles, P.A.; Trouw, R.A.J.; Mendes, J.C.; Gerdes, A. Marins Granite (MG/SP): Petrography, geochemistry, geochronology, and geotectonic setting. Braz. J. Geol. 2013, 43, 487–500. [Google Scholar] [CrossRef]
- Nalon, P.A.; Sousa, M.Z.A.; Ruiz, A.S.; Macambira, M.J.B. Batólito Guaporeí: Uma extensão do Complexo Granitoide Pensamiento em Mato Grosso, SW do Cráton Amazônico (The Guaporeí Batholith: An extension of the Pensamiento Granitoid Complex in Mato Grosso, SW Amazonian Craton). Braz. J. Geol. 2013, 43, 85–100. [Google Scholar] [CrossRef]
- Santos, P.A.; Feio, G.R.L.; Dall’Agnol, R.; Costi, H.T.; Lamarão, C.N.; Galarza, M.A. Petrography, magnetic susceptibility and geochemistry of the Rio Branco Granite, Carajás Province, southeast of Pará, Brazil. Braz. J. Geol. 2013, 43, 2–15. [Google Scholar] [CrossRef]
- Czamanske, G.K.; Wones, D.R.; Eichelberger, J.C. Mineralogy and petrology of the intrusive complex of the Pliny Range, New Hampshire. Am. J. Sci. 1977, 277, 1073–1123. [Google Scholar] [CrossRef]
- Foland, K.A.; Loiselle, M.C. Oliverian syenites of the Pliny region, northern New Hampshire. Geol. Soc. Am. Bull. Part I 1981, 92, 179–188. [Google Scholar] [CrossRef]
- Whalen, J.B.; Currie, K.L. The Topsails Igneous Suite, Western Newfoundland; Fractionation and Magma Mixing in an “Orogenic” A-Type Granite Suite; Geological Society of America: Boulder, CO, USA, 1990; Volume 246, pp. 287–299. [Google Scholar]
- Lumbers, S.B.; Wu, T.-W.; Heaman, L.M.; Vertolli, V.M.; MacRae, N.D. Petrology and age of the A-type Mulock granite batholith, northern Grenville Province, Ontario. Precambrian Res. 1991, 53, 199–231. [Google Scholar] [CrossRef]
- de Albuquerque, C.A.R. Petrochemistry of a series of granitic rocks from northern Portugal. Geol. Soc. Am. Bull. 1971, 82, 2783–2798. [Google Scholar] [CrossRef]
- Knutson, J.; Flood, R.H. Ben Bullen plutons, New South Wales: A Carboniferous gabbro-trondhjemite suite. Aust. J. Earth Sci. 1988, 35, 245–257. [Google Scholar] [CrossRef]
- Sims, P.K.; Schulz, K.J.; Dewitt, E.; Brasaemle, B. Petrography and Geochemistry of Early Proterozoic Granitoid Rocks in Wisconsin Magmatic Terranes of Penokean Orogen, Northern Wisconsin, No. 1904; US Geological Survey Bulletin; U.S. Government Printing Office: Washington, DC, USA, 1993.
- Arth, J.G.; Barker, F.; Peterman, Z.E.; Friedman, I. Geochemistry of the gabbro—Diorite—Tonalite—Trondhjemite suite of southwest Finland and its implications for the origin of tonalitic and trondhjemitic magmas. J. Petrol. 1978, 19, 289–316. [Google Scholar] [CrossRef]
- Hietanen, A. Uber das Grundgebirge des Kalantigebietes im suwestlichen Finnland. Bull. Comm. Geol. Finl. 1943, 130, 1–105. [Google Scholar]
- Barnes, C.G.; Barnes, M.A.; Kistler, R.W. Petrology of the Caribou Mountain Pluton, Klamath Mountains, California. J. Petrol. 1992, 33, 95–124. [Google Scholar] [CrossRef]
- Davis, G.A. Structure and mode of emplacement of Caribou Mountain Pluton, Klamath Mountains, California. Geol. Soc. Am. Bull. 1963, 74, 331–348. [Google Scholar] [CrossRef]
- Coleman, R.G.; Donato, M.M. Oceanic plagiogranite revisited. In Trondhjemites, Dacites and Related Rocks; Barker, F., Ed.; Elsevier: New York, NY, USA, 1979; pp. 149–168. [Google Scholar]
- Goldich, S.S.; Hanson, G.N.; Hallford, C.R.; Mudrey, M.G., Jr. Early Precambrian rocks in the Saganaga Lake-Northern Light Lake area, Minnesota-Ontario Part I. Petrology and structure. Geol. Soc. Am. Mem. 1972, 135, 151–178. [Google Scholar]
- de Albuquerque, C.A.R. Geochemistry of the tonalitic and granitic rocks of the Nova Scotia southern pluton. Geochim. Cosmochim. Acta 1977, 41, 1–13. [Google Scholar] [CrossRef]
- Bloxam, T.W. The petrology of Byne Hill, Ayrshire. Trans. R. Soc. Edinb. 1968, 68, 105–122. [Google Scholar] [CrossRef]
- Size, W.B. Petrology, geochemistry and genesis of the type area trondhjemite in the Trondheim Region, Central Norwegian Caledonides. Nor. Geol. Undersøkelse Bull. 1979, 351, 51–76. [Google Scholar]
- Barker, F.; Millard, H.T., Jr. Geochemistry of the type trondhjemite and three associated rocks, Norway. In Trondhjemites, Dacites and Related Rocks; Barker, F., Ed.; Elsevier: New York, NY, USA, 1979; pp. 517–529. [Google Scholar]
- Westhues, A. Geochemical Data from Sedimentary, Intrusive and Metamorphic Rocks from the Dunnage and Gander Zones in the St. Alban’s Map Sheet, South Coast of Newfoundland (NTS map area 1M/13); Open File 001M/13/0922; Government of Newfoundland and Labrador, Department of Natural Resources, Geological Survey: St. John’s, NL, Canada, 2018; pp. 1–8.
- Westhues, A. Lithogeochemistry of Gaultois Granite, Northwest Brook Complex and North Bay Granite Suite Intrusive Rocks, St. Alban’s Map Area; Current Research Report 2020-1; Government of Newfoundland and Labrador, Department of Natural Resources, Geological Survey: St. John’s, NL, Canada, 2020; pp. 49–70.
- Foster, P.L.L. Geologia e Petrologia do Maciço Palanqueta, Mina Bom Futuro, Rondônia. Dissertação de Mestrado Apresentada ao Instituto de Geociências e Ciências Exatas do Câmpus de Rio Claro. Ph.D. Thesis, da Universidade Estadual Paulista, São Paulo, Brazil, 2016; pp. 1–86. [Google Scholar]
- Moura, M.A.; Botelho, N.F. The topaz-albite granite and related rocks form the Sn-In mineralized zone of Mangbeira granitic Massif (GO, Brazil). Rev. Bras. Geociênc. 2000, 30, 270–273. [Google Scholar] [CrossRef]
- Viana da Cunha, I.R.; Dall’Agnol, R.; Feio, G.R.L. Mineral chemistry and magnetic petrology of the Archean Planalto Suite, Carajas Province-Amazonian Craton: Implications for the evolution of ferroan Archean granites. J. S. Am. Earth Sci. 2016, 67, 100–121. [Google Scholar] [CrossRef]
- Romanini, S.J. Geologia e Geoquímica do Complexo Granitoide de Massangana e sua Relaçao com as Mineralizaçoes de Estanho. Dissertaçao (Programa de Posgraduaçao em Geociencias). Ph.D. Thesis, Universidade Federal da Bahia, Salvador, Brazil, 1982; pp. 1–85. [Google Scholar]
- Castro, C.C. Southern Portion of the Serra da Providência Batholith Relating Its Role in the Tin Metallogeny of the Rondonia Tin Province: Insights of a Recurrence in the Tin Mineralizations. Ph.D. Thesis, Universidade do Estado do Rio de Janeiro, Faculdade de Geologia, Rio de Janeiro, Brazil, 2016; pp. 1–158. [Google Scholar]
- Johnson, K.; Barnes, C.G.; Miller, C.A. Petrology, geochemistry, and genesis of high-Al tonalite and trondhjemites of the Cornucopia Stock, Blue Mountains, northeastern Oregon. J. Petrol. 1997, 38, 1585–1611. [Google Scholar] [CrossRef]
- Condie, K.C.; Allen, P. Origin of Archean migmatites from the Gwenoro Dam area, Zimbabwe-Rhodesia. Contrib. Mineral. Petrol. 1980, 74, 35–43. [Google Scholar] [CrossRef]
- Larsen, L.H.; Poldervaart, A. Petrologic study of Bald Rock Batholith, near Bidwell Bar, California. Geol. Soc. Am. Bull. 1961, 72, 69–92. [Google Scholar] [CrossRef]
- Taubeneck, W.H. Petrology of Cornucopia Tonalite Unit, Cornucopia Stock, Wallowa Mountains, Northeastern Oregon; Geological Society of America: Boulder, CO, USA, 1967; Volume 91, pp. 1–56. [Google Scholar]
Disclaimer/Publisher’s Note: The statements, opinions and data contained in all publications are solely those of the individual author(s) and contributor(s) and not of MDPI and/or the editor(s). MDPI and/or the editor(s) disclaim responsibility for any injury to people or property resulting from any ideas, methods, instructions or products referred to in the content. |
© 2025 by the authors. Licensee MDPI, Basel, Switzerland. This article is an open access article distributed under the terms and conditions of the Creative Commons Attribution (CC BY) license (https://creativecommons.org/licenses/by/4.0/).