Abstract
The adoption of photovoltaic solar technology for renewable energy generation has been growing rapidly worldwide. In decarbonization processes, the use of photovoltaic panels has been preferred due to their reliability, safety, and efficiency. Specifically, the use of photovoltaic panels has increased significantly in Chile, as the climatic conditions are ideal for photovoltaic solar technology. The expected lifespan of a photovoltaic panel is approximately 25 years, so the amount of photovoltaic waste is projected to rise significantly in the coming decades. Consequently, interest has emerged in establishing policies and processes for recycling and recovering value from photovoltaic waste. The objective of this study is to develop a life cycle assessment (LCA) of the leaching process of photovoltaic modules using nitric acid as a leaching agent and to employ the results to analyze the projected scenario for the Antofagasta region in 2040. Through statistical analysis of currently approved photovoltaic installations, projections were made to estimate the amount of photovoltaic waste and the total value of recyclable material expected to be available in 2040, resulting in an approximate figure of 30,676,367 discarded modules. Simultaneously, a life cycle assessment of the leaching process for photovoltaic waste using nitric acid was conducted using the OpenLCA software. The analysis showed that the proposed process has a high impact on global warming potential (GWP), generating 7.07 kg of CO2 equivalent per kilogram of photovoltaic cell waste. Finally, an environmental and economic comparative analysis was performed, comparing nitric acid with ionic liquids previously studied by the research group. Preliminary results concluded that nitric acid has a significantly lower environmental impact and production cost.
1. Introduction
Climate change is one of the world’s biggest environmental problems, being caused mainly by greenhouse gas (GHG) emissions in the atmosphere. When present in the atmosphere, GHGs can capture outgoing radiation from the planet into the Earth’s atmosphere. The retention of additional heat in the Earth’s atmosphere causes an increase in the planet’s temperature, which leads to gradual changes in regional and global weather patterns that can affect Earth’s delicate balance [1]. Although the GHG category includes several different gasses, 71.6% of global greenhouse gas emissions are caused by emissions of carbon dioxide (CO2) [2]. CO2 emissions are mainly a consequence of combustion processes in the energy industry in which the combustion of oil, natural gas, coal, and other fossil fuels are used to generate electricity and heat. Thirty-four percent of global GHG emissions are associated with the energy industry [3]. In Chile, 75.5% of GHG emissions are associated with CO2 emissions. In 2020, the Chilean energy sector (vastly composed of activities associated with fossil fuel combustion) was responsible for 79,724.3 kt of CO2 eq emissions, being the largest contributor of emissions, responsible for 76% of total GHG emissions in the country [4].
Faced with this problem, the scientific community has sought energy generation alternatives based on technologies that produce fewer emissions, replacing traditional energies to reduce or mitigate GHG emissions in the energy sector. These technologies are categorized as non-conventional renewable energies due to their capacity to generate clean energy from virtually inexhaustible resources and without the need to use combustion processes [5].
Among the most widely used non-conventional renewable energies worldwide, photovoltaic (PV) solar energy stands out due to its safety, low cost, and reliability [6], ranking as the second most widely used renewable energy generation technology worldwide [7].
Photovoltaic systems can produce electricity by means of solar energy, using a semiconductor material. The key component in the structure of a photovoltaic solar panel is a photovoltaic cell composed of silicon with the presence of precious materials such as silver. The photovoltaic cell is encapsulated between two layers of ethylene vinyl acetate (EVA), covered by glass and polyvinyl fluoride and mounted on an aluminum frame [8].
Global-installed solar capacity reached 1180 GW by the end of 2022, which corresponds to a contribution of 6.2% of global electricity demand [9]. Global-installed solar capacity is expected to exceed 4500 GW by the end of 2050 [10] due to factors such as the projected growth trends in global energy demand and the decarbonization processes taking place around the world incentivizing the creation of additional photovoltaic facilities [10].
Chile is considered one of the countries with the ideal characteristics for producing solar energy due to the amount of solar incidence received by the northern regions of the country. Because of this, solar PV has become an important source of energy in Chile, contributing 33,330 MW to the installed capacity of electricity generation as of December 2023 and being responsible for 25.4% of the country’s installed capacity [11]. As of 2020, there are 12.5 million PV panels installed in the country, and it is estimated that by 2050, there will be between 161 million and 270 million PV panels in the country [12]. According to the Chilean National Institute of Statistics [13], the Antofagasta region experienced a 30.4% increase in solar energy in 2023, which is expected to continue growing in the coming years. The adoption of renewable energy sources in Chile has contributed to the reduction in emissions in recent years, leading to a 21% decrease in GHG emissions by the beginning of 2024 [14].
Despite the benefits delivered by the increase in PV-based energy production sources, there are several factors that could be detrimental to the environment and human health in the future if they are not considered in advance. One of these factors relates to the amount of PV panel waste that will exist in the future. The lifetime of a PV panel is estimated to be between 25 and 30 years [15], so eventually, the PV panels currently in use will be replaced, generating waste. The International Renewable Energy Agency (IRENA) estimated that by the end of 2030, there will be about 8 million tons of PV panel waste and 78 million tons by 2050 [16]. Similarly, In-Data and RIGK estimate that by the year 2046, there will be about 120 tons of PV waste in Chile [12].
In view of the above, members of the international community have implemented PV panel waste management and recycling policies that allow for proper management, thus favorably impacting the supply chain while minimizing the environmental impact of waste. Among the countries that stand out are Germany, Spain, and Japan [17].
The Chilean Extended Producer Responsibility and Recycling Promotion Law (REP Law) makes producers responsible for managing waste from priority product categories such as lubricating oils, batteries, and electronic equipment. In Chile, solar PV panels are currently categorized as electronic devices, and although there is currently no policy specifically related to the valorization of PV panel waste, a future legal proposal is foreseen to consider collection and valorization goals. Therefore, it is of national interest to evaluate recycling and valuation technologies for these wastes to anticipate future policies.
The recycling of PV panels at the end of their life cycle can be divided into three stages: manual dismantling of the PV panel components, chemical or mechanical separation of the glass, and recovery of materials [18]. There are multiple technical processes for the recovery of materials by hydrometallurgy using common leaching agents such as nitric acid, hydrofluoric acid, and phosphoric acid to obtain a leached solution rich in valuable metals such as silver, copper, and aluminum [19].
Life cycle analysis (LCA) is a methodology used to investigate and evaluate the environmental impact of a product or service at all stages of its existence, from product manufacturing to recycling. This methodology is performed in accordance with international standards ISO 14040 and ISO 14044 [18].
There are several life cycle analysis studies related to the recycling of PV panels using life cycle analysis. For example, the environmental impacts of landfilling, upcycling, or downcycling PV panel wastes have been evaluated through life cycle analysis [18]. Similarly, life cycle analysis has been used to compare recycling methods for c-Si and CdTe panels with a particular emphasis on the mechanical separation and delamination stage of PV panel waste [20]. However, the information available in the literature regarding the life cycle analysis of PV panel waste leaching is scarce and not detailed. Therefore, it is necessary to conduct a study that considers the proposed leaching process at a higher level of detail.
The objective of the study is to analyze the future of PV panels installed in the Antofagasta region. Through a statistical analysis of the currently approved projects in the region as of 2024, a future estimate will be made of the amount of PV panel waste generated by 2040. A life cycle analysis is carried out to evaluate the environmental impacts of the PV panel leaching process using nitric acid as a leaching agent. Finally, a comparison is made with e-waste leaching processes using other leaching agents.
2. Materials/Methods
2.1. Waste Estimation
To estimate the number of photovoltaic projects in the Antofagasta region, a characterization of the photovoltaic projects currently approved was carried out, identifying the type of PV technology used, number of modules, and geographical location. The statistical analysis was carried out based on information from the Chilean Environmental Evaluation Service.
As of 2023, the Antofagasta region has 104 active PV projects distributed throughout seven municipalities (Antofagasta, Mejillones, Sierra Gorda, Taltal, Calama, Maria Elena, and Tocopilla). According to the type of technology used, PV projects were classified as monocrystalline, polycrystalline, or thin-film photovoltaic panels. Monocrystalline and polycrystalline PVs can be further subclassified as monofacial or bifacial panels (Figure 1). The data related to the projects are presented in Table 1. Most of the projects currently approved use single-facial polycrystalline (41) or single-facial monocrystalline (25) technology. Many projects do not specify the type of specific technology used, only defining the use of Si-C. These projects were classified in the present study as unspecified crystalline silicon. It is worth noting that only one of the currently approved projects uses thin-film PV panels, corresponding to less than 1% of the total projects. The PV project distribution can be visualized in Figure 2. The distribution of PV modules is shown in Table 2. Currently, there are 38,952,933 PV modules in the Antofagasta region, most of which are in the commune of Maria Elena.
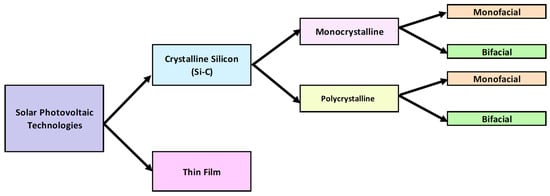
Figure 1.
Photovoltaic energy project distribution in Antofagasta Region.

Table 1.
Number of projects by commune and photovoltaic technology used.
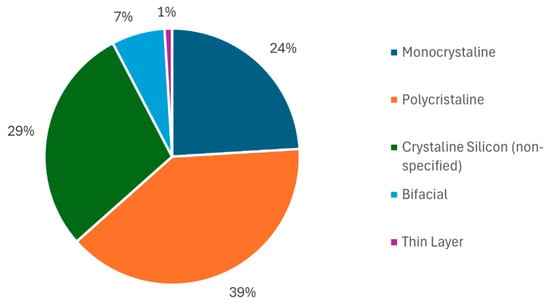
Figure 2.
PV projects according to the type of technology used in Antofagasta Region.
Table 2.
Number of approved photovoltaic modules by commune and type of technology used.
The technologies that contribute the largest number of modules are, in descending order, crystalline silicon, monocrystalline, and polycrystalline. The contribution of each type of technology can be seen in Figure 3. It is worth pointing out that the contribution to the number of thin-film PV modules corresponds to a single PV project: the Sol del Desierto Photovoltaic Solar Park is the only PV park in the Antofagasta region that uses thin-film technology. Construction of the park was approved in 2015 and began operations in 2022. There are currently no other thin-film PV projects in the planning, construction, or operation stages, so the study assumes that the Sol del Desierto Photovoltaic Solar Park is an outlier, and it is not expected that future PV projects will use thin-film technology. Therefore, the study will only consider monofacial Si-C panels (both monocrystalline and polycrystalline) for the estimations.
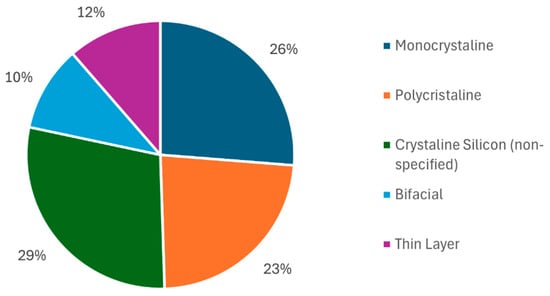
Figure 3.
Technologies that contribute the largest number of modules in Antofagasta region.
Table 3 shows the yearly number and the cumulative amounts of approved PV modules. From this information, a linear regression was performed to analyze the data trends over time. The linear fit obtained has a relationship coefficient of 0.911 (Figure 4), so it is assumed that a linear model is sufficiently valid for the scope of this study. Using the previously obtained model, a forecast was made of the amount of PV modules produced per year and the cumulative amount of PV modules until 2030 (Table 4). According to the model, there will be 45,340,694 total PV modules installed in the Antofagasta region, with 14,831,551 of these installed between 2023 and 2030.
Table 3.
Historical data on the number of approved photovoltaic modules per year.
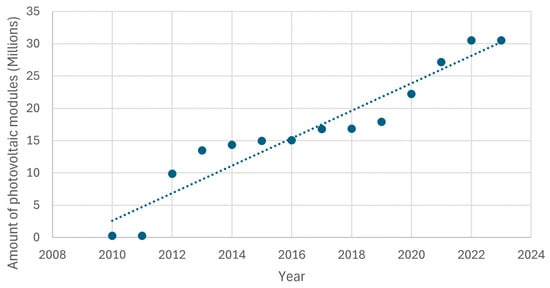
Figure 4.
Total approved photovoltaic modules.
Table 4.
Projected number of photovoltaic modules approved annually 2024–2030.
To estimate the amount of waste that could be generated by 2040, some considerations were made based on information present in the literature. Generally, the lifetime of a PV panel is estimated to be close to 25 years. However, the work performed by Andradi et al. mentions that high levels of solar radiation can degrade the plastic components of PV modules at an accelerated rate, causing failures and decreasing the lifetime of PV modules by 30% [21]. Similarly, Jordan et al. observed that PV panels have an average irreparable failure rate of 0.5% per year [22]. Considering this information, the cumulative amount of waste generated by 2040 was estimated (Table 5). According to the analysis, there will be 30,676,367 units of discarded PV modules.
Table 5.
Projected annual disposed PV modules through 2040.
The work of Maani et al. reviewed the mass composition of a Si-C technology PV panel and the percentage recovery of each material [20]. Considering an average PV panel weight of 18 kg and using reference values for each material, the projected cumulative amount of PV panel waste was calculated. In total, the potentially recyclable material is estimated to have a value of $760,531,033.630 USD. This is presented in more detail in (Table 6).
Table 6.
Valorization of recyclable materials from discarded photovoltaic modules.
To extract the composition of the photovoltaic modules, it is necessary to apply 3 recycling techniques: dismantling (removal of frame and wiring), delamination (removal of glass), and leaching (stage discussed in detail in Section Leaching Process).
2.2. Life Cycle Analysis
Life cycle analysis is a methodology used to study the life cycle of a product or process to assess the potential impact on the environment by identifying and quantifying the inputs and outputs involved in the evaluated product or process. The methodology is based on the international standard ISO 14040 and considers four steps: scope definition, inventory analysis, impact assessment, and interpretation.
2.2.1. Scope Definition
The present study aims to evaluate the “cradle to gate” environmental impacts on the recovery of silver and other valuable materials from crystalline silicon photovoltaic cell wastes by means of a leaching process using nitric acid as a leaching agent. According to studies, the most commonly used acid for leaching non-ferrous metals present in photovoltaic cells is nitric acid, especially due to its effectiveness in silver recovery. According to Li, W. et al. [23], in the silver recovery process, it is possible to use more than one acid to achieve a complete extraction of the organic matter. In this case, nitric acid, sulfuric acid, and hydrofluoric acid are used to obtain the best results [23]. An input stream of 1 kg of PV cell waste will be considered for the analysis. The system boundaries will include upstream processes such as chemical production, electricity, and heat.
2.2.2. Inventory Modeling
The inventory analysis is responsible for determining all inputs (resource consumption) and outputs (emissions generated) involved in the processes of each raw material and unit process. For the processes of each raw material, the Needs and EcoInvent databases were used, which include information regarding electricity and metals present in the different stages of the study. The nitric acid production process was modeled with the OpenLCA program based on information present in the literature. In relation to solar cell wastes, the use of crystalline silicon cells was considered, modeling the process in OpenLCA.
Leaching Process
For the life cycle analysis, the leaching unit process considered 1 kg of solar cell waste as an input for silver recovery, using 50% nitric acid as a leaching agent with room temperature conditions, which estimates a silver recovery rate of 55% [20]. The leaching agent use of 50% is assumed instead of the 70% established in the literature due to limitations of the software used. The input and output flows considered in the modeling of the leaching process described are shown in Table 7. The leaching process consists of the input of 1 kg of solar cell waste and a nitric acid leaching solution in a rotary agitator for twelve hours, obtaining an output flow of 11,882 kg of leached solution (PLS).
Table 7.
Input and output flows of the photovoltaic cell leaching process with nitric acid.
Solar Cell Precursors
For solar cell residues entering the leaching process, the life cycle analysis considered both the valuable metals and the corresponding energy consumption. Due to the absence of information in the databases corresponding to the quality of crystalline silicon used in the production of solar cells, the data used in the study worked under the assumption of using metallurgical-grade silicon. The material input flows are based on the PV composition presented in Table 7 and represent the quantities of materials in 1 kg of solar cells. The energy consumption for solar cell production was obtained from the PV system life cycle inventory report in Frischknecht et al. [24]. The input and output flows considered for modeling the solar cell precursors are presented in Table 8.
Table 8.
Input and output flows of solar cell modeling process.
Nitric Acid Production
For the life cycle analysis of the nitric acid production process, the life cycle inventories of chemical products obtained by Ecoinvent [25] were used. The report describes a weak nitric acid production process based on the Ostwald method (Figure 5), which consists of three main reactions:
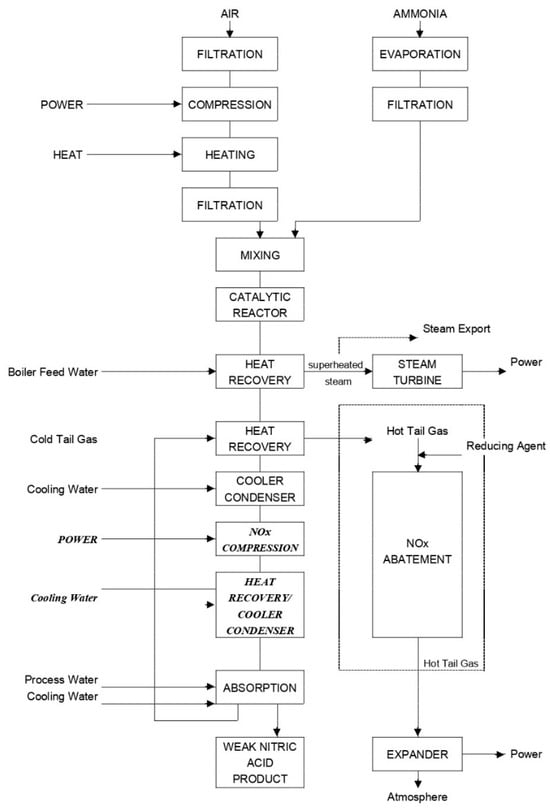
Figure 5.
Nitric acid production process based on the Ostwald method.
- Oxidation of ammonia in the presence of a platinum-rhodium catalyst.
- Oxidation of nitric oxide obtained through cooling.
- Absorption of nitrogen dioxide, producing nitric acid.
The electricity applied in the software, unlike that presented in the Ecoinvent report, was low voltage, UCTE production, at grid, due to the lack of information available in the databases used. The input and output flows considered for this stage are presented in Table 9.
Table 9.
Input and output flows of the nitric acid production modeling process.
2.2.3. Impact Assessment
The impact assessment was performed by applying the CML2001-jan 2016 method using OpenLCA software with the objective of quantifying the data previously considered in the inventory. The following categories are considered to assess the environmental impact:
- Abiotic depletion potential (ADP)
- Acidification potential (AP)
- Eutrophication potential (EP)
- Freshwater Aquatic Ecotoxicity Potential (FAETP)
- 100-year Global Warming Potential (GWP)
- Human toxicity potential (HTP)
- Marine Aquatic Ecotoxicity Potential (MAEP)
- Photochemical ozone creation potential (POCP)
- Terrestrial Eco-Toxicity Potential (TETP)
Ozone Depletion Potential (ODP) was not included because the program considers that the impacts of the inventory do not include the characterization factors that the CML2001 database has.
3. Results and Discussion
3.1. Environmental Impact Analysis of Leaching Process
The results of the impact categories obtained for the stages analyzed in the study of nitric acid generation, photovoltaic cell precursors, and leaching with nitric acid are presented in Table 10. The graph in Figure 6 shows the impact categories for the three processes described, where it is established that in all cases, the greatest environmental impact is global warming potential, equivalent to the release of kilograms of CO2 into the atmosphere. The large impact in the global warming potential category can be preliminarily associated with the formation of nitrous oxide during nitric acid production and subsequent leaching of the waste [26]. Nitrous oxide has a global warming potential 265 times that of carbon dioxide.
Table 10.
Comparison of impact categories for each stage of the proposed process.
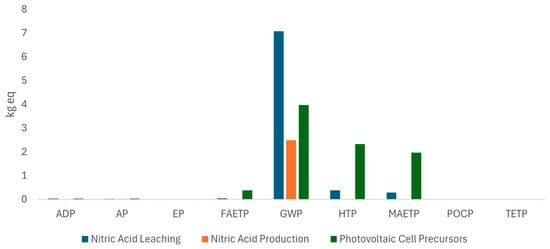
Figure 6.
Impact categories for the leaching process.
Figure 7 shows the percentage contribution of the impact categories for the three cases, establishing as 100% the total impacts generated in each stage. With respect to the impacts generated from PV precursors, the following categories stand out: Global Warming Potential (46%), Marine Aquatic Ecotoxicity Potential (23%), Human Toxicity Potential (4%), and Freshwater Aquatic Ecotoxicity Potential (4%). For the generation of nitric acid, the greatest impact was identified as Global Warming Potential, equivalent to 99% of the impacts present in the process. The greatest environmental impacts produced in the leaching process are Global Warming Potential (90%), Human Toxicity Potential (5%), and Marine Aquatic Ecotoxicity Potential (4%).
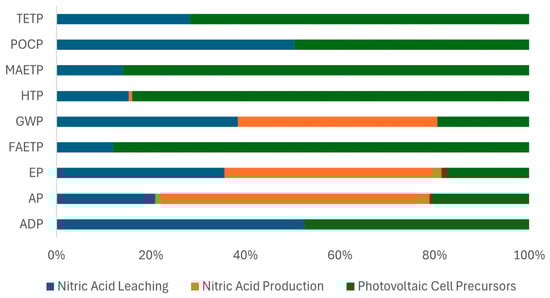
Figure 7.
Contribution of the impact categories for the three cases in study.
3.2. Environmental Impact Analysis in Antofagasta Region, 2040
Considering the mass balance corresponding to the projection of accumulated PV waste in the Antofagasta region for the year 2040, an estimate of the impact categories was made. For the year 2040, a mass of PV equivalent to 42,939,939 kg was estimated, which required a quantity of 54,104,323 kg of nitric acid for leaching. Table 11 details the projected impact categories for the year 2040, and Figure 8 illustrates the comparison of the categories.
Table 11.
Impact categories for each sub-process caused by projected amount of photovoltaic waste.
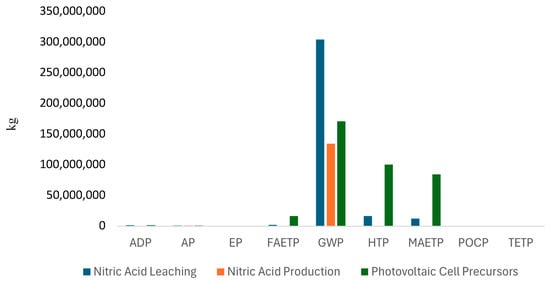
Figure 8.
Comparison of the projected impact categories to the year 2040.
3.3. Comparative Impact Analysis Assessment for the Leaching Process
In the absence of studies that would allow discussion of the results, the data obtained by Vallejos-Michea et al. were considered [27]. In the previous study, two main alternatives for the leaching process were studied: the application of sulfuric acid with and without ionic liquids. The ionic liquids used are 1-methylimidazolium hydrogen sulfate (Hmim HSO4), 1-butyl-3-methylimidazolium chloride (Bmim Cl), 1-butyl-3-methylimidazolium bromide (Bmim Br), and 1-butyl-3-methylimidazolium hydrogen sulfate (Bmim HSO4). Table 12 and Figure 9 present a comparison of the environmental impacts generated in the production of nitric acid together with the impacts generated by the production of leaching agents evaluated in the previous study.
Table 12.
Comparison of impact categories generated in the production of 1 kg of different leaching agents.
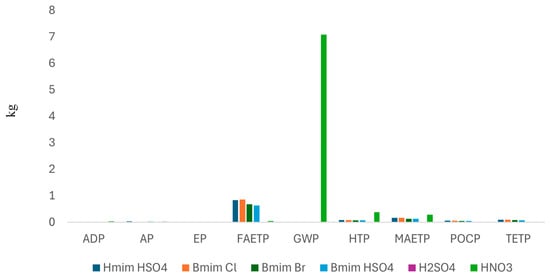
Figure 9.
Comparison of the environmental impacts generated in the production of nitric acid and by the production of leaching agents.
Table 13 shows the comparison between the environmental impacts produced by generating 11,882 kg of leachate product. It should be noted that the composition of the leached waste contemplated in the previous study differs from the composition of the solar cells evaluated in this study. However, this comparison is still appropriate because both types of waste are considered e-waste. Also, Table S1 shows inputs/outputs for e-waste leaching process with ionic liquids, for 1 kg of leach solution, and Table S2 shows inputs/outputs for e-waste leaching process with ionic liquids, for 11.8820 kg of leached.
Table 13.
Comparison of impact categories generated by the leaching of 1 kg of different types of electronic waste [27].
A preliminary comparison of the cost of each reagent was made, evaluating the cost to obtain 11,882 kg of leachate product. The reference values were obtained from Sigma Aldrich. Table 14 presents the reagent values and Table S3 the valorization of 1 kg of reagents, more details about the calculation are presented in supplementary material.
Table 14.
Valorization of reagents to obtain 11,882 kg of leached product.
4. Conclusions
In the present study, an evaluation of the solar cell leaching process was carried out. The Antofagasta region of Chile was used as a case study due to its ideal conditions for the development of solar energy projects.
It is estimated that by 2030, there will be 45,340,694 photovoltaic panel units in the region, composed mainly of monofacial and bifacial Si-C modules. Considering factors such as the annual irreparable failure rate and the reduction in the expected life cycle due to environmental conditions, it is estimated that by 2040, there will be a cumulative amount of 30,676,367 PV panel waste units, which is equivalent to approximately 508,324 tons of PV residue. It was determined that the material cost that can be valued from this waste is equivalent to $760,531,033,630 USD.
The life cycle analysis performed considered the stages of nitric acid production, the precursors of 1 kg of solar cells, and the process of leaching valuable metals from 1 kg of solar cells. When comparing the environmental impacts of these stages, it is observed that the eutrophication potential, freshwater aquatic ecotoxicity potential, and global warming potential impact categories are higher in the nitric acid leaching process. On the other hand, solar cell processing has a greater impact on abiotic resource depletion, acidification potential, human toxicity potential, marine aquatic ecotoxicity potential, photochemical ozone creation potential, and terrestrial ecotoxicity potential categories. In general, the category with the greatest impact for the three stages studied is global warming potential, generating an impact equivalent to the release of more than 7 kg of CO2.
Based on the analysis carried out, it is estimated that by the year 2040, the nitric acid leaching process used to leach solar cell waste will generate an impact equivalent to 303,748,972 kg of CO2 in the global warming potential category, 16,400,480 kg of DCB in human toxicity levels and 12,468,900 kg of DCB corresponding to marine aquatic ecotoxicity potential.
When comparing with similar e-waste leaching processes that propose using sulfuric acid and ionic liquids, it is observed that nitric acid has a higher impact on abiotic resource depletion, global warming potential, human toxicity potential, and marine aquatic ecotoxicity potential, being lower in all other categories. When comparing costs, it is concluded that the nitric acid leaching process is more economical than processes involving ionic liquids but more expensive than sulfuric acid leaching.
It is concluded that the use of nitric acid for the solar cell leaching process is cost-effective; however, high levels of contamination linked to global warming and human toxicity are produced.
Supplementary Materials
The following supporting information can be downloaded at: https://www.mdpi.com/article/10.3390/min15010045/s1, Table S1: Inputs/Outputs for e-waste leaching process with ionic liquids, for 1 kg of leach solution. Table S2: Inputs/Outputs for e-waste leaching process with ionic liquids, for 11.8820 kg of leached. Table S3: Valorization of 1 kg of reagents.
Author Contributions
The authors would like to highlight the following contributions: Conceptualization: M.M., C.G.; Formal analysis: M.M., Y.B. and C.G.; Investigation: C.G. and M.M.; Methodology: C.G, M.M., Y.B. and Y.P.J.; Resources: M.M. and Y.P.J.; Supervision: M.M. and Y.P.J.; Roles/Writing—original draft: M.M., Y.B. and L.F.; Writing—review and editing: M.M., C.G. Y.B., Y.P.J. and L.F.; Funding acquisition: M.M. and Y.P.J.; Project administration: M.M. and Y.P.J. All authors have read and agreed to the published version of the manuscript.
Funding
This research was funded by ANID-Chile grant number Fondecyt N°1221428. And the APC was funded by Universidad de Antofagasta.
Data Availability Statement
The data are presented in the article.
Acknowledgments
M. Martínez and Y. P. Jimenez would like to thank the Department of Chemical Engineering and Mineral Processes of the Universidad de Antofagasta for making this work possible. M.M. acknowledges the infrastructure and support from Doctorado en Ingeniería de Procesos de Minerales at the Universidad de Antofagasta. Finally, the authors thank ANID-Chile for funding this research through the Fondecyt N°1221428 project.
Conflicts of Interest
The authors declare no conflict of interest.
References
- Aziz, N.; Hossain, B.; Lamb, L. The effectiveness of environmental protection policies on greenhouse gas emissions. J. Clean. Prod. 2024, 450, 141868. [Google Scholar] [CrossRef]
- Crippa, M.; Guizzardi, D.; Solazzo, E.; Muntean, M.; Schaaf, E.; Monforti-Ferrario, F.; Banja, M.; Olivier, J.G.J.; Grassi, G.; Rossi, S.; et al. GHG Emissions of All World Countries 2021 Report; Publications Office of the European Union: Luxembourg, 2021. [CrossRef]
- Global Greenhouse Gas Overview|US EPA. Available online: https://www.epa.gov/ghgemissions/global-greenhouse-gas-overview (accessed on 22 December 2024).
- Martinez, R. Informe del Inventario Nacional de Chile 2022: Inventario Nacional de Gases de Efecto Invernadero y Otros Contaminantes Climáticos 1990–2020. November 2023. Available online: https://bibliotecadigital.odepa.gob.cl/handle/20.500.12650/73015?show=full (accessed on 22 December 2024).
- Meraj, S.T.; Yu, S.S.; Rahman, M.S.; Hasan, K.; Lipu, M.S.H.; Trinh, H. Energy management schemes, challenges and impacts of emerging inverter technology for renewable energy integration towards grid decarbonization. J. Clean. Prod. 2023, 405, 137002. [Google Scholar] [CrossRef]
- Hei, K.K.; Savaget, P.; Fukushige, S.; Halog, A. The necessity for end-of-life photovoltaic technology waste management policy: A systematic review. J. Clean. Prod. 2024, 461, 142497. [Google Scholar] [CrossRef]
- Global Installed Renewable Energy Capacity by Technology. Available online: https://ourworldindata.org/grapher/installed-global-renewable-energy-capacity-by-technology (accessed on 22 December 2024).
- Granata, G.; Altimari, P.; Pagnanelli, F.; De Greef, J. Recycling of solar photovoltaic panels: Techno-economic assessment in waste management perspective. J. Clean. Prod. 2022, 363, 132384. [Google Scholar] [CrossRef]
- Snapshot of Global PV Markets 2022—IEA-PVPS; Report IEA-PVPS T1-42:2022; IEA-PVPS: St. Ursen, Switzerland, 2022; pp. 1–23. Available online: https://www.researchgate.net/publication/360562245_Snapshot_of_Global_PV_Markets_2022_Task_1_Strategic_PV_Analysis_and_Outreach_PVPS (accessed on 22 December 2024).
- Venkatachary, S.K.; Samikannu, R.; Murugesan, S.; Dasari, N.R.; Subramaniyam, R.U. Economics and impact of recycling solar waste materials on the environment and health care. Environ. Technol. Innov. 2020, 20, 101130. [Google Scholar] [CrossRef]
- Reporte, Estadísticas y Plataforma I Coordinador Eléctrico Nacional (CEN). Available online: https://www.coordinador.cl/reportes-y-estadisticas/ (accessed on 22 December 2024).
- RIGK. Alternativas de Tratamiento de Módulos Fotovoltaicos Luego de su Vida Útil. 2020. Available online: https://www.prendete-cap.cl/post/alternativas-de-tratamiento-de-m%C3%B3dulos-fotovoltaicos-luego-de-su-vida-%C3%BAtil (accessed on 22 December 2024).
- Boletín de Generación y Distribución de Energía Eléctrica Enero 2023. Available online: https://regiones.ine.cl/antofagasta/prensa/bolet%C3%ADn-de-generaci%C3%B3n-y-distribuci%C3%B3n-de-energ%C3%ADa-el%C3%A9ctrica-enero-2023 (accessed on 22 December 2024).
- Sistema Eléctrico Redujo 21% sus Emisiones en 2023 y se Espera que Siga Creciendo Participación de Energía Renovable Variable7 |Coordinador Eléctrico Nacional. Available online: https://www.coordinador.cl/novedades/sistema-electrico-redujo-21-sus-emisiones-en-2023-y-se-espera-que-siga-creciendo-participacion-de-energia-renovable-variable/ (accessed on 22 December 2024).
- Tsanakas, J.A.; Ha, L.; Buerhop, C. Faults and infrared thermographic diagnosis in operating c-Si photovoltaic modules: A review of research and future challenges. Renew. Sustain. Energy Rev. 2016, 62, 695–709. [Google Scholar] [CrossRef]
- Weckend, S.; Wade, A.; Heath, G.A. End of Life Management: Solar Photovoltaic Panels; IRENA: Masdar City, Abu Dhabi, 2016. [Google Scholar] [CrossRef]
- Sharma, A.; Pandey, S.; Kolhe, M. Global review of policies & guidelines for recycling of solar pv modules. Int. J. Smart Grid Clean Energy 2019, 8, 597–610. [Google Scholar] [CrossRef]
- Mao, D.; Yang, S.; Ma, L.; Ma, W.; Yu, Z.; Xi, F.; Yu, J. Overview of life cycle assessment of recycling end-of-life photovoltaic panels: A case study of crystalline silicon photovoltaic panels. J. Clean. Prod. 2024, 434, 140320. [Google Scholar] [CrossRef]
- Preet, S.; Smith, S.T. A comprehensive review on the recycling technology of silicon based photovoltaic solar panels: Challenges and future outlook. J. Clean. Prod. 2024, 448, 141661. [Google Scholar] [CrossRef]
- Maani, T.; Celik, I.; Heben, M.J.; Ellingson, R.J.; Apul, D. Environmental impacts of recycling crystalline silicon (c-SI) and cadmium telluride (CDTE) solar panels. Sci. Total Environ. 2020, 735, 138827. [Google Scholar] [CrossRef] [PubMed]
- Andrady, A.L.; Pandey, K.K.; Heikkilä, A.M. Interactive effects of solar UV radiation and climate change on material damage. Photochem. Photobiol. Sci. 2019, 18, 804–825. [Google Scholar] [CrossRef]
- Jordan, D.C.; Silverman, T.J.; Wohlgemuth, J.H.; Kurtz, S.R.; VanSant, K.T. Photovoltaic failure and degradation modes. Progress. Photovolt. Res. Appl. 2017, 25, 318–326. [Google Scholar] [CrossRef]
- Li, W.; Liu, B.; Wang, S.; Jiao, F.; Qin, W.; Liu, W. Short-process leaching and kinetic behaviour of aluminium and silver from waste photovoltaic modules. Chem. Eng. J. 2024, 495, 153455. [Google Scholar] [CrossRef]
- Frischknecht, R.; Itten, R.; Sinha, P.; Wild-Scholten, M.; Zhang, J.; Heath, G. Life Cycle Inventories and Life Cycle Assessments of Photovoltaic Systems: IEA PVPS Task 12: PV Sustainability. 2015. Available online: https://research-hub.nrel.gov/en/publications/life-cycle-inventories-and-life-cycle-assessments-of-photovoltaic (accessed on 22 December 2024).
- Life Cycle Inventories of Highly Pure Chemicals. Data v2.0. Uster 2007. Available online: https://www.researchgate.net/publication/313054431_Life_Cycle_Inventories_of_Highly_Pure_Chemicals_Data_v20_Uster_2007 (accessed on 22 December 2024).
- Pérez-Ramírez, J.; Kapteijn, F.; Schöffel, K.; Moulijn, J.A. Formation and control of N2O in nitric acid production: Where do we stand today? Appl. Catal. B 2003, 44, 117–151. [Google Scholar] [CrossRef]
- Vallejos-Michea, C.; Barrueto, Y.; Jimenez, Y.P. Life cycle analysis of the ionic liquid leaching process of valuable metals from electronic wastes. J. Clean. Prod. 2022, 348, 131357. [Google Scholar] [CrossRef]
Disclaimer/Publisher’s Note: The statements, opinions and data contained in all publications are solely those of the individual author(s) and contributor(s) and not of MDPI and/or the editor(s). MDPI and/or the editor(s) disclaim responsibility for any injury to people or property resulting from any ideas, methods, instructions or products referred to in the content. |
© 2025 by the authors. Licensee MDPI, Basel, Switzerland. This article is an open access article distributed under the terms and conditions of the Creative Commons Attribution (CC BY) license (https://creativecommons.org/licenses/by/4.0/).