1. Introduction
In any mining operation, one of the most important roles played by the technicians managing the mine is the supervision of grade control; this is the procedure to differentiate ore from waste. In an open-pit mine, this requires the sampling of blast holes produced by hammer drills and the classification of bench materials into several materials, typically ore, low-grade ore, waste, or various metallurgical types. In some cases, grade control could also involve the sampling of truck or shovel loads to ensure that the material is assigned to the correct stockpile or material bin or correctly guided to a waste dump. In underground operations, grade control may involve the scanning and sampling of stope faces, sampling of LHDs (load haul dump) loads or draw-point muck piles, broken rock at a recently blasted face, jackhammer cuttings, or prospection drill cores. The objective is to ensure that mining closely follows the mineralized zone and that overbreaks during the mining operation are kept to a minimum.
The mined product, the ore, is usually processed and concentrated in a plant where its grade is augmented to some extent to be directly sold or treated in a metallurgical plant. The concentration plant will require a homogenous material input, both in grade and in the presence of the so-called poisons, minerals, or elements that can degrade the efficiency of the plant. The main purpose of grade control is then to assure that material being fed to the concentration plant is of economic grade and that large fluctuations in grade are minimized by blending ores from different benches, or parts thereof, or from different stopes. It is essential that mill feed be kept as close as possible to that called for in the original design specification of the mill and concentrator.
Grade control works start from the information of the mine model block. Nowadays, it is impossible to think of a mine exploitation without a previously developed economic model of the mine. The rock mass that surrounds a high-grade mineralization discovery is sampled with a prospection holes mesh, say typically 25 m between holes, where rock is sampled and analyzed in a laboratory, searching for geotechnical characteristics, lithologies, and grades of all the interesting elements. All these data are stored in a three-dimensional database that allows the creation of an economic model through interpolation and optimization algorithms. The resource is considered a reserve if it can be economically mined.
This paper will explain in detail the grade control process used in the Riotinto polymetallic mine, Corta Cerro Colorado, from the company Atalaya Mining [
1].
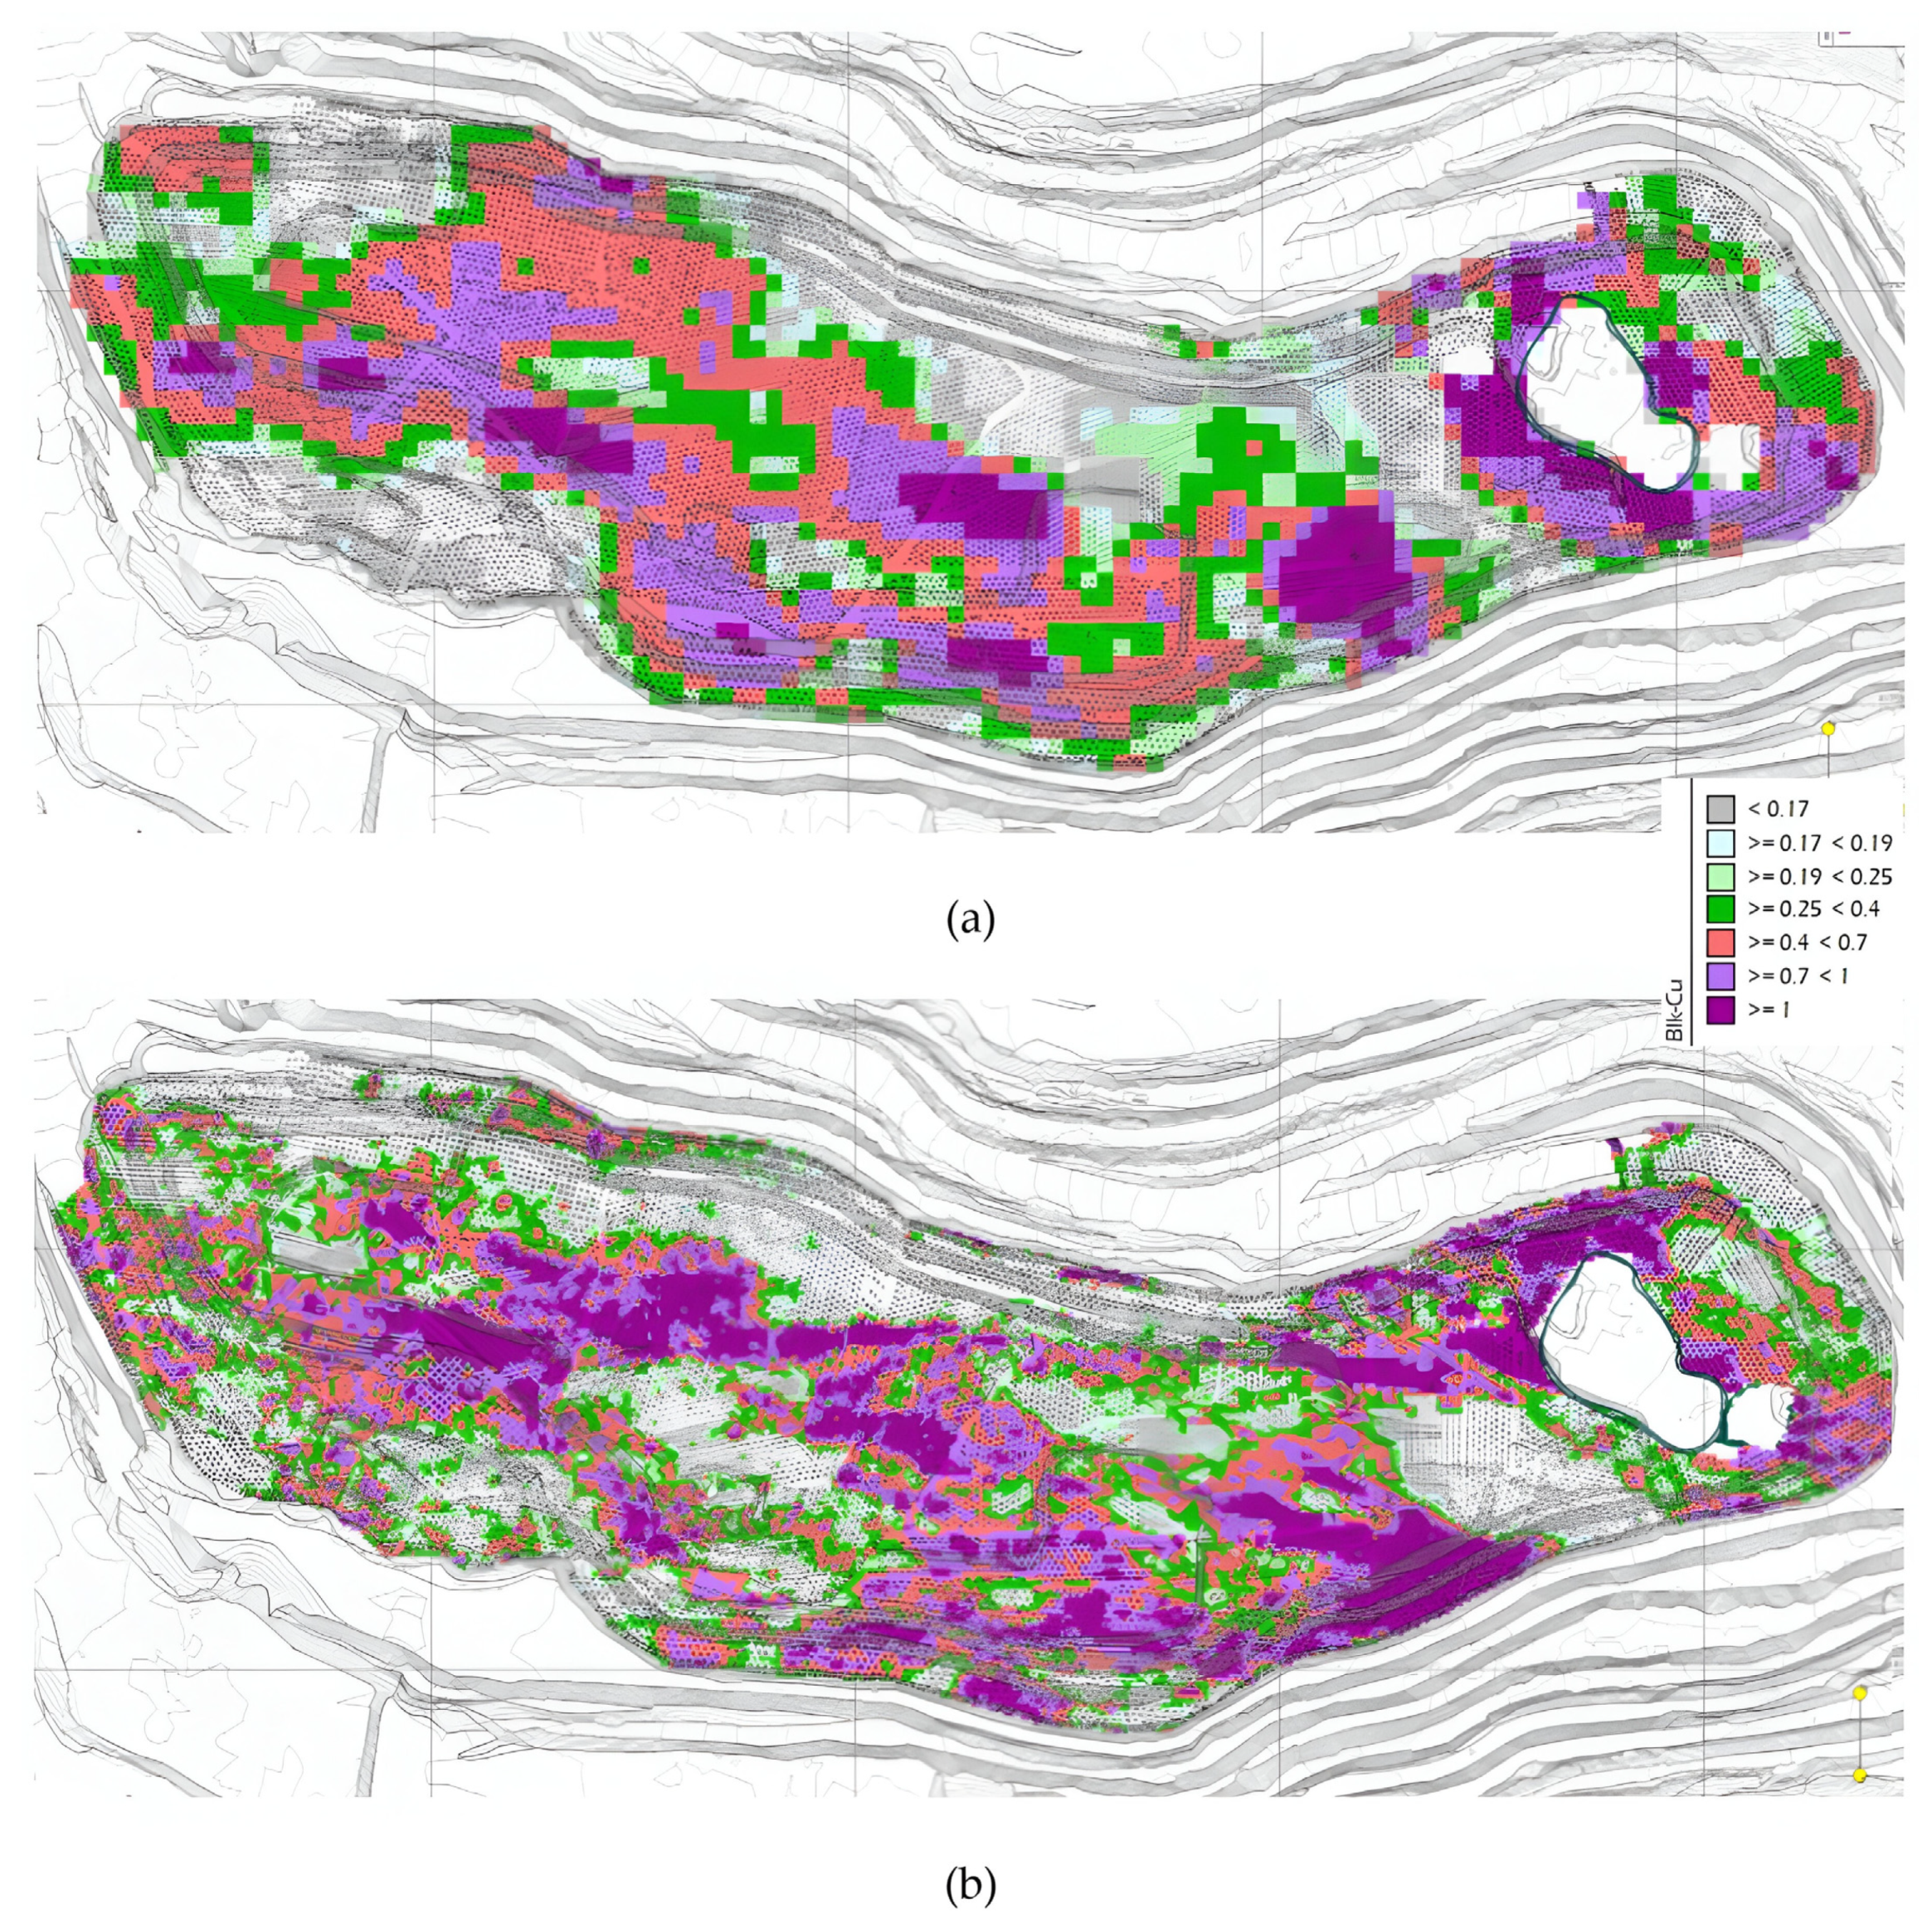
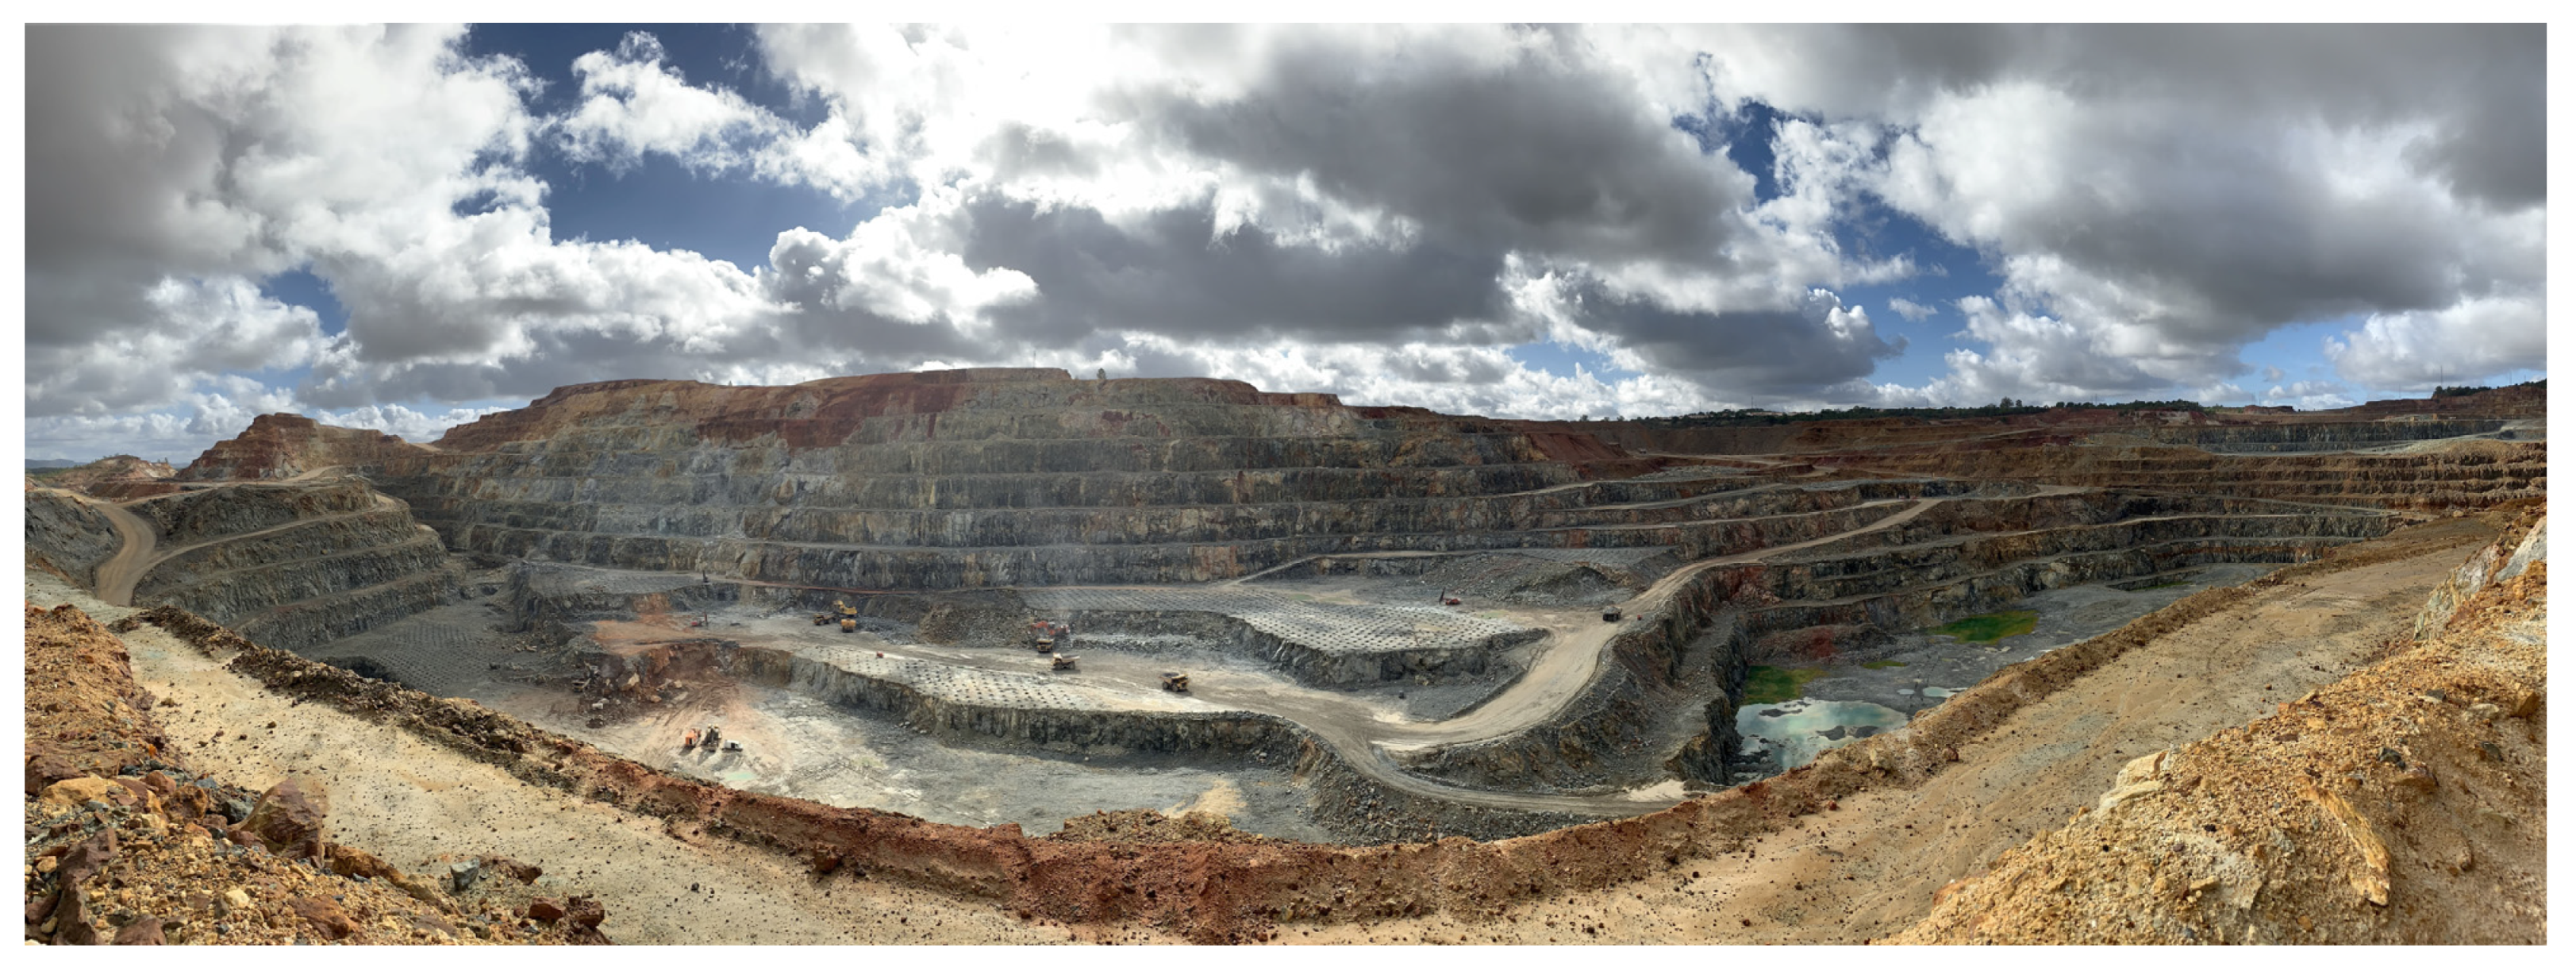
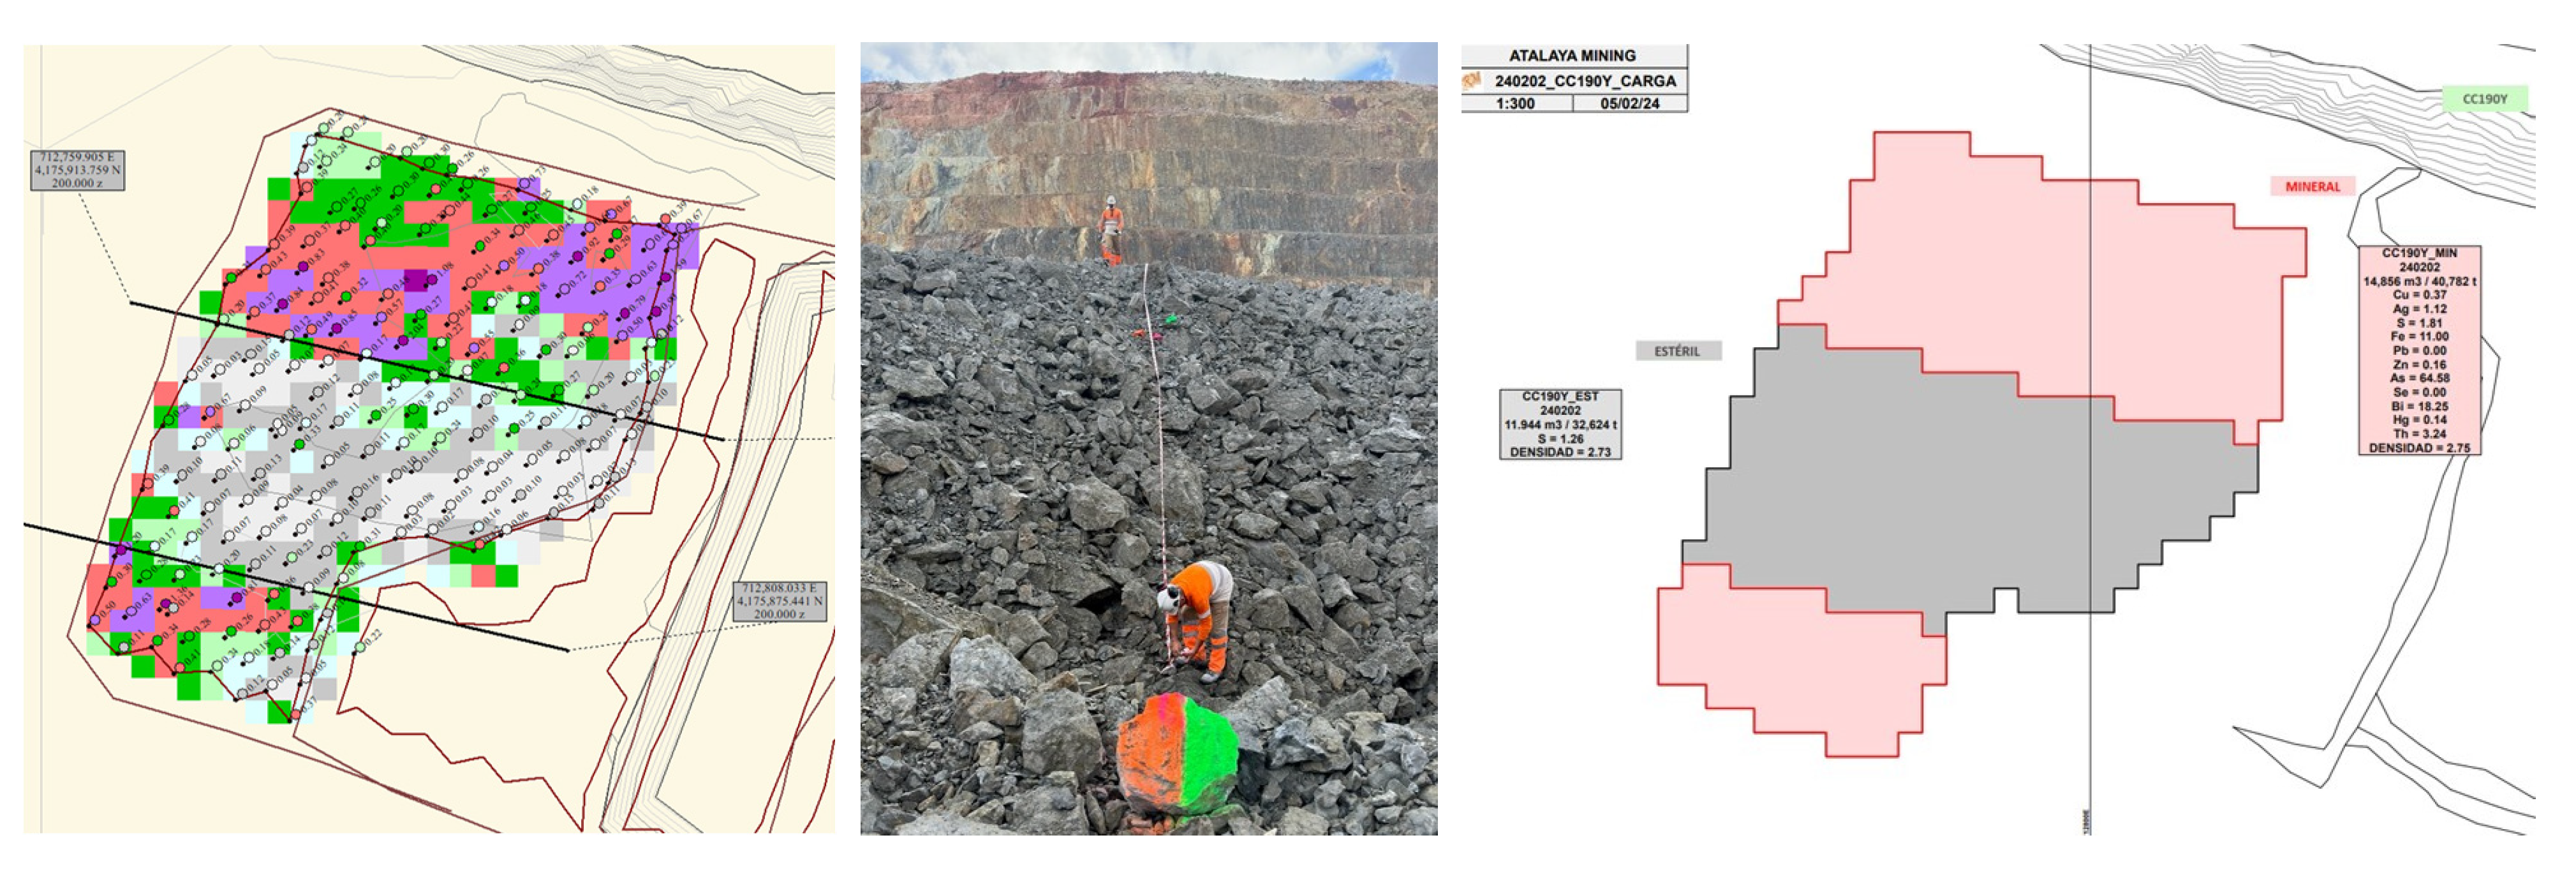
Figure 1 shows one of the benches of the pit. We will discuss details on the equipment, software, and methods used to discern ore from waste and establish possible improvement areas to enhance results.
The material coming from the drills used to blast the rock mass is sampled and tagged in order to be analyzed in the laboratory and obtain the metal grade.
Thousands of prospection samples guide the development of block models in the range of hundreds of thousands of blocks.
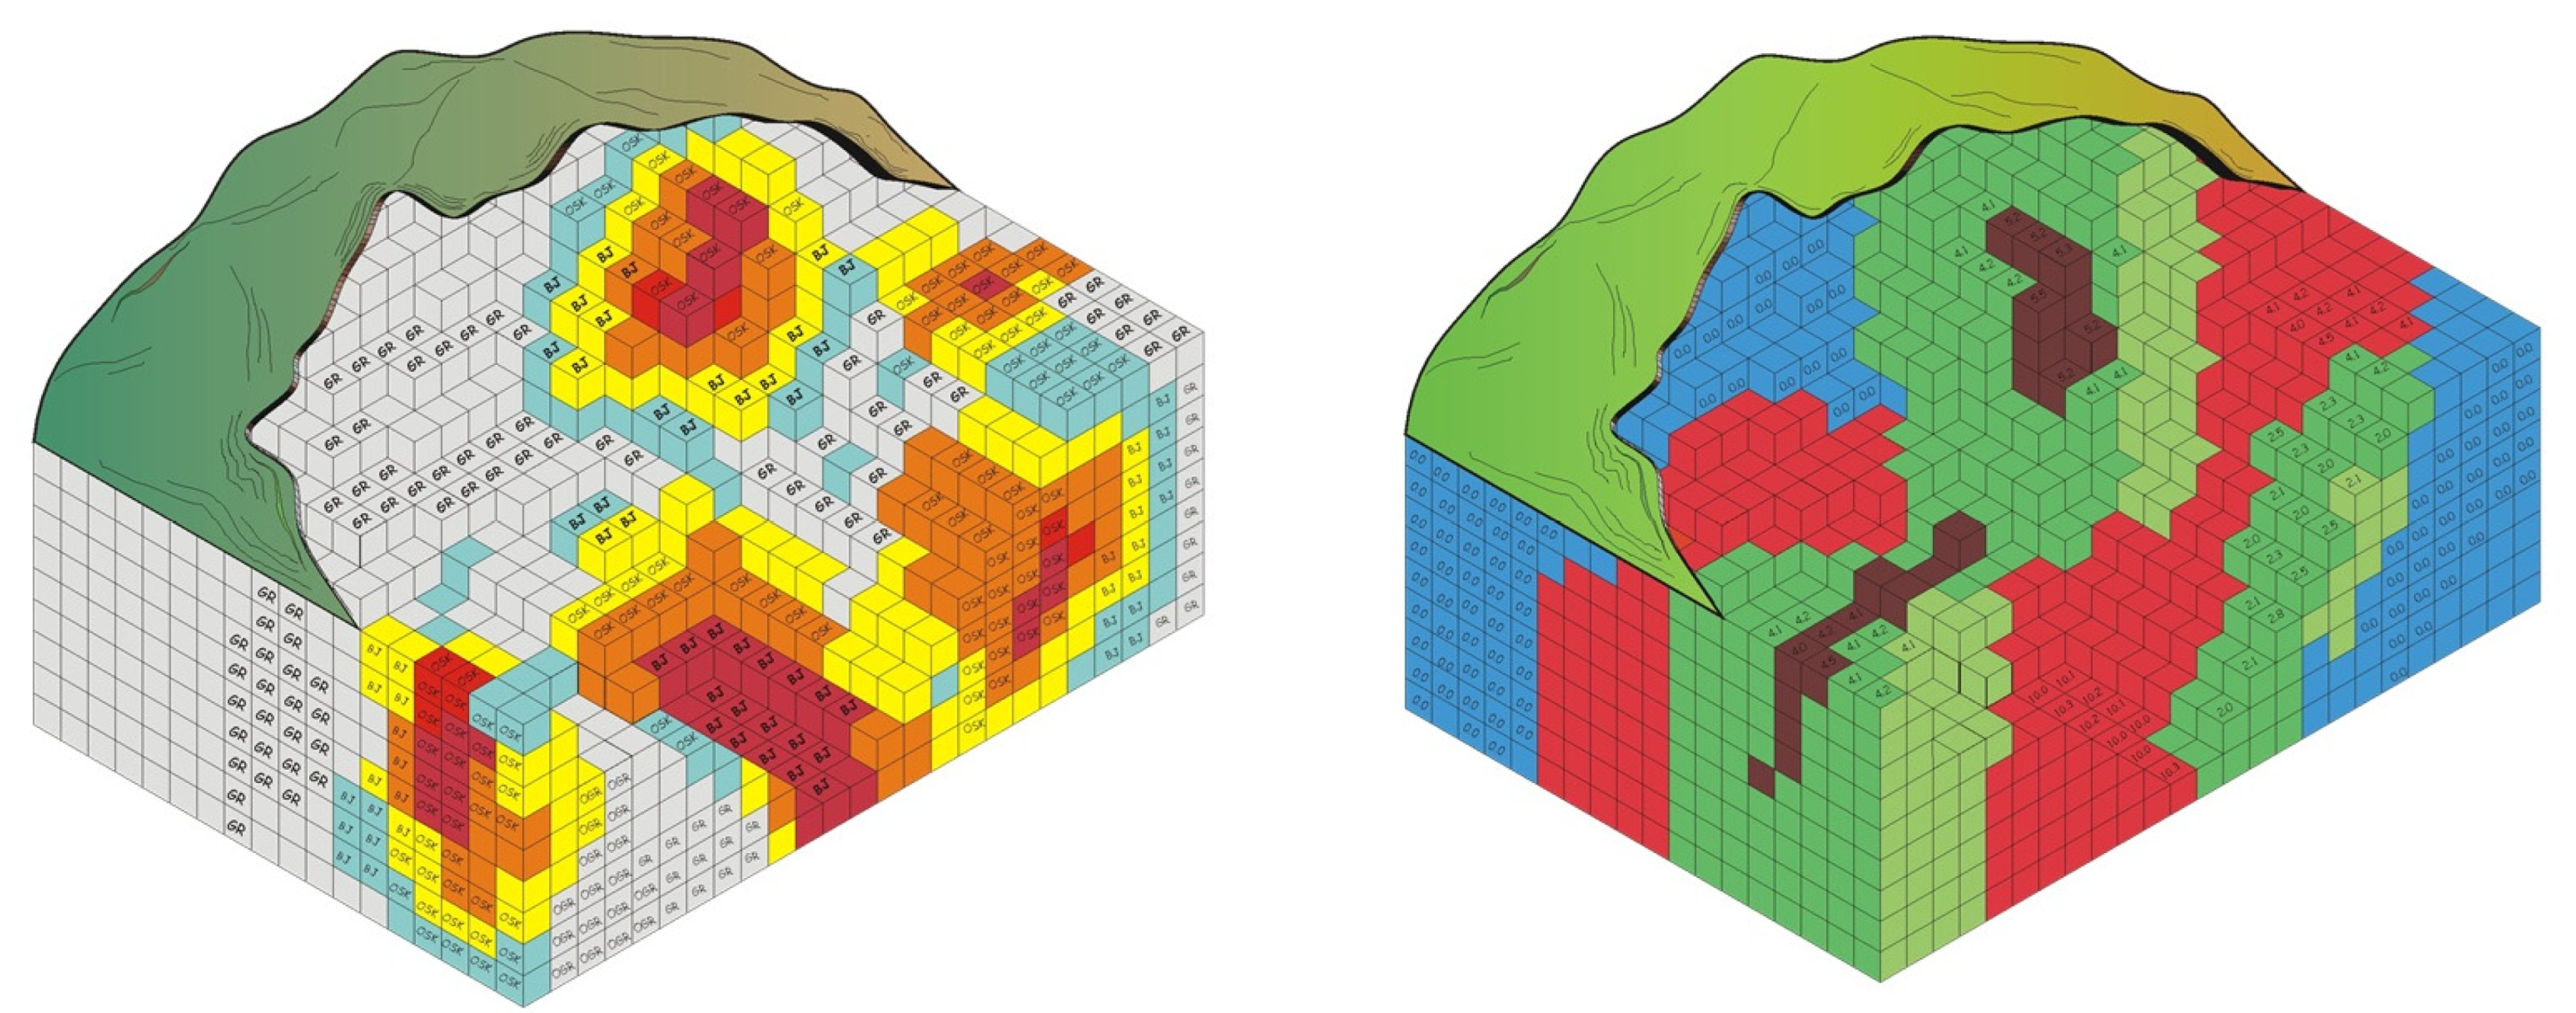
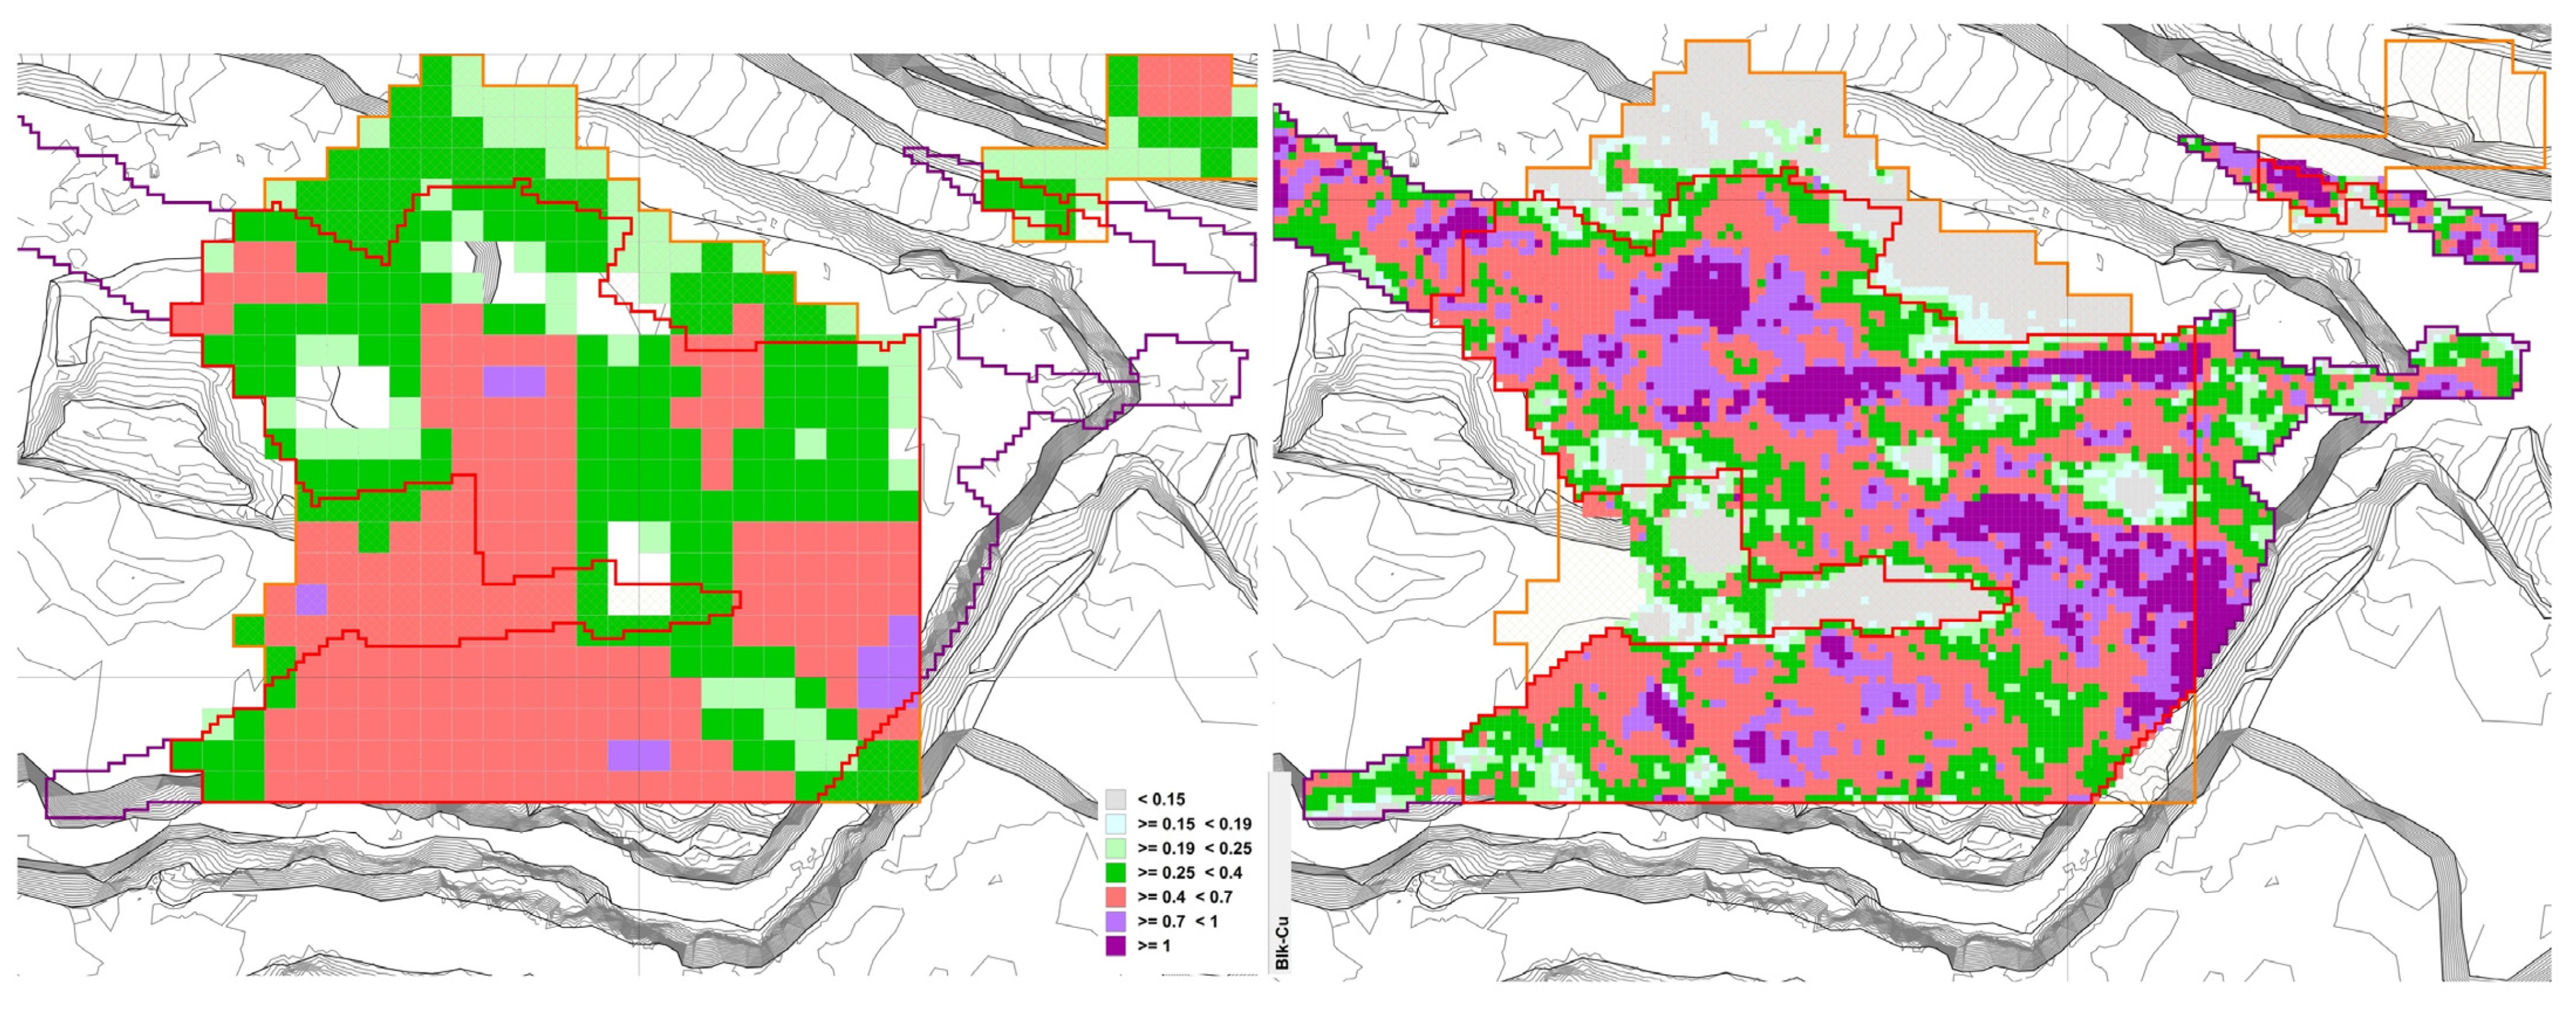
Figure 1a shows a horizontal slice of one of these models corresponding to one of the benches of an open pit.
Figure 1b shows the same bench but colored by the grade obtained by the samples obtained from the bench grade control process. There are evident differences between both datasets, and as the data density is much higher in the grade control data, with grid spacing between 3 and 5 m as compared to roughly 25 m in the prospection one, we must assume that the grade control data will be much closer to the actual values of tonnage and grade of the mineral deposit.
Regular reconciliations will be required between the estimated borehole grades and the grades indicated from sampling and those reported by the concentration plant. It is essential that this is undertaken so that modifications can be made to sampling practice or to the methods or parameters used to calculate grade, tonnage, or contained metal.
If the data from
Figure 1a are used to define the material destiny (ore/waste), there is a certain risk of sending high-grade material to the waste pile or sending to the plant mill low-grade material, as there are huge differences between datasets.
As Carrasco et al. [
2] show, it is imperative to correctly select the sampling density to be able to decide on a project’s feasibility, as well as define the size of the concentration plant (starting from the mill size) and the location and size of the waste dumpsites and the tailings dam. The best tool to do so is the geostatistical knowledge of the deposit using the variogram method, where an optimal distance between prospection samples will be determined according to the grade variation in the three-dimensional space.
Figure 1 shows a bench of 289,069 m
2, filled with 459 boreholes in a 25 m × 25 m spacing. Assuming a depth of the mineral body of 250 m, this implies 25 benches (bench height of 10 m) or 25 × 459 = 11,475 points to create the model. Using a 3.5 m × 3.5 m blasting mesh, this means 289,069/(3.5·3.5) = 23,597 data points per bench; this is 589,925 points for all the mineral body.
2. The Riotinto Mine
The Atalaya pit, located in Riotinto, Huelva, southern Spain, is one of the biggest open pits in Europe (
Figure 2). It is 1200 m in length, 900 m in width, and 345 m in depth; it mines mainly copper, although there are also recoveries of gold and silver. The concentration plant processed 15.8 million tons of ore in 2023 [
3] to obtain 49 thousand tons of copper concentrate, exceeding the production of other great European plants such as Veliki Krivelj [
4] (10.6 million tons) or Talvivaara (24 million tons scheduled [
5], although with limited production due to environmental issues [
6]), although not exceeding the biggest of Europe, Aitik in Sweden, that processed 43.3 million tons [
7] in 2022.
The Riotinto deposit is formed by seven lenses (mineral bodies) of massive sulfides (consisting of pyrite with accessory amounts of chalcopyrite, sphalerite, and galena) named San Dionisio, Filon Sur, Filon Norte, Salomon, Argamasilla, Planes, and San Antonio, with a total estimated tonnage of 600 Mt. The rocks in the footwall of the massif sulfides present an intense hydrothermal alteration, with pervasive chloritization and silicification in relationship with a pyrite and chalcopyrite stockwork [
8].
The Riotinto mineralization is enclosed in a transtensional basin of around 4.5 km long and 0.85 km wide, with direction NNW-SSE, of pre-Variscan age. In this basin was active bimodal volcanism with the development of the Riotinto Volcanic Massive Sulphide deposits. The inversion of the transtensional faults of the early basin was produced during the Variscan orogenesis [
9].
Mining is executed through the drill and blast method. The rock mass is divided into benches, 20 m in height in the waste lithologies and 10 m in height in the ore lithologies, drilled with borehole meshes of up to 600 units per blast. The lower the bench height, the higher the amount of data sampled in order to create the grade control block, trying to capture the vertical variability of grade. Heights lower than 10 m would be better for increasing data resolution, but it will harm the production rate. In the waste area, where no grade has to be captured, bench heights are higher than 20 m. After the explosion, the fragmented rock is loaded with backhoe excavators onto 100-ton Komatsu dumpers that will haul the ore to the storage area or the mill of the concentration plant or haul the waste to the dump sites or the tailings dam expansion project. The hauling fleet exceeds 32 units, helped by 2 motor graders, 2 bulldozers, and 8 front-wheel loaders to execute auxiliary works.
The monthly production ranges from 2500 to 3800 thousand ore tons with an average grade between 0.4% and 0.5%. The stripping ratio is around 2, with a cut-off grade of 0.2%. The concentration plant has a throughput capacity of 15 million tons per year. The mine blasts 1.5 million cubic meters per month, with at least three daily blasts. This means 260 blast holes are to be drilled using Sandvik DP1500i drillers. These 260 holes mean 7800 per month, which, if correctly sampled and analyzed, gives a unique opportunity to know the actual grade distribution of the deposit.
The concentration plant mills the material to the micron size and separates the concentrate of copper using hydrometallurgy. As and Sb are considered penalizing elements in the concentration process, so ore with a high content of these elements is flagged and stacked in independent piles near the concentrator crusher to be fed slowly to the plant input in order to maintain a low level of these penalizing elements. During the mining and concentration process, all Spanish national regulations are strictly applied in order to guarantee the workers’ health and safety conditions.
3. The Grade Control Process
In a coal mine or in a limestone quarry, it is easy to distinguish with the naked eye between the ore and the waste. An average skilled loader operator discriminates materials by their color, texture, and hardness. However, in metallic mining, the usual situation is that ore and waste are impossible to differentiate at a glance, even more so if the ore has a low grade. According to Calvo et al. [
10], the global average copper ore grade is around 0.62% of Cu. Northey et al. [
11] expect it to decrease towards the 0.49% level before 2050 as more and more mines are exhausted with the growing demand for a metal that plays a key role in the electrification of main economies.
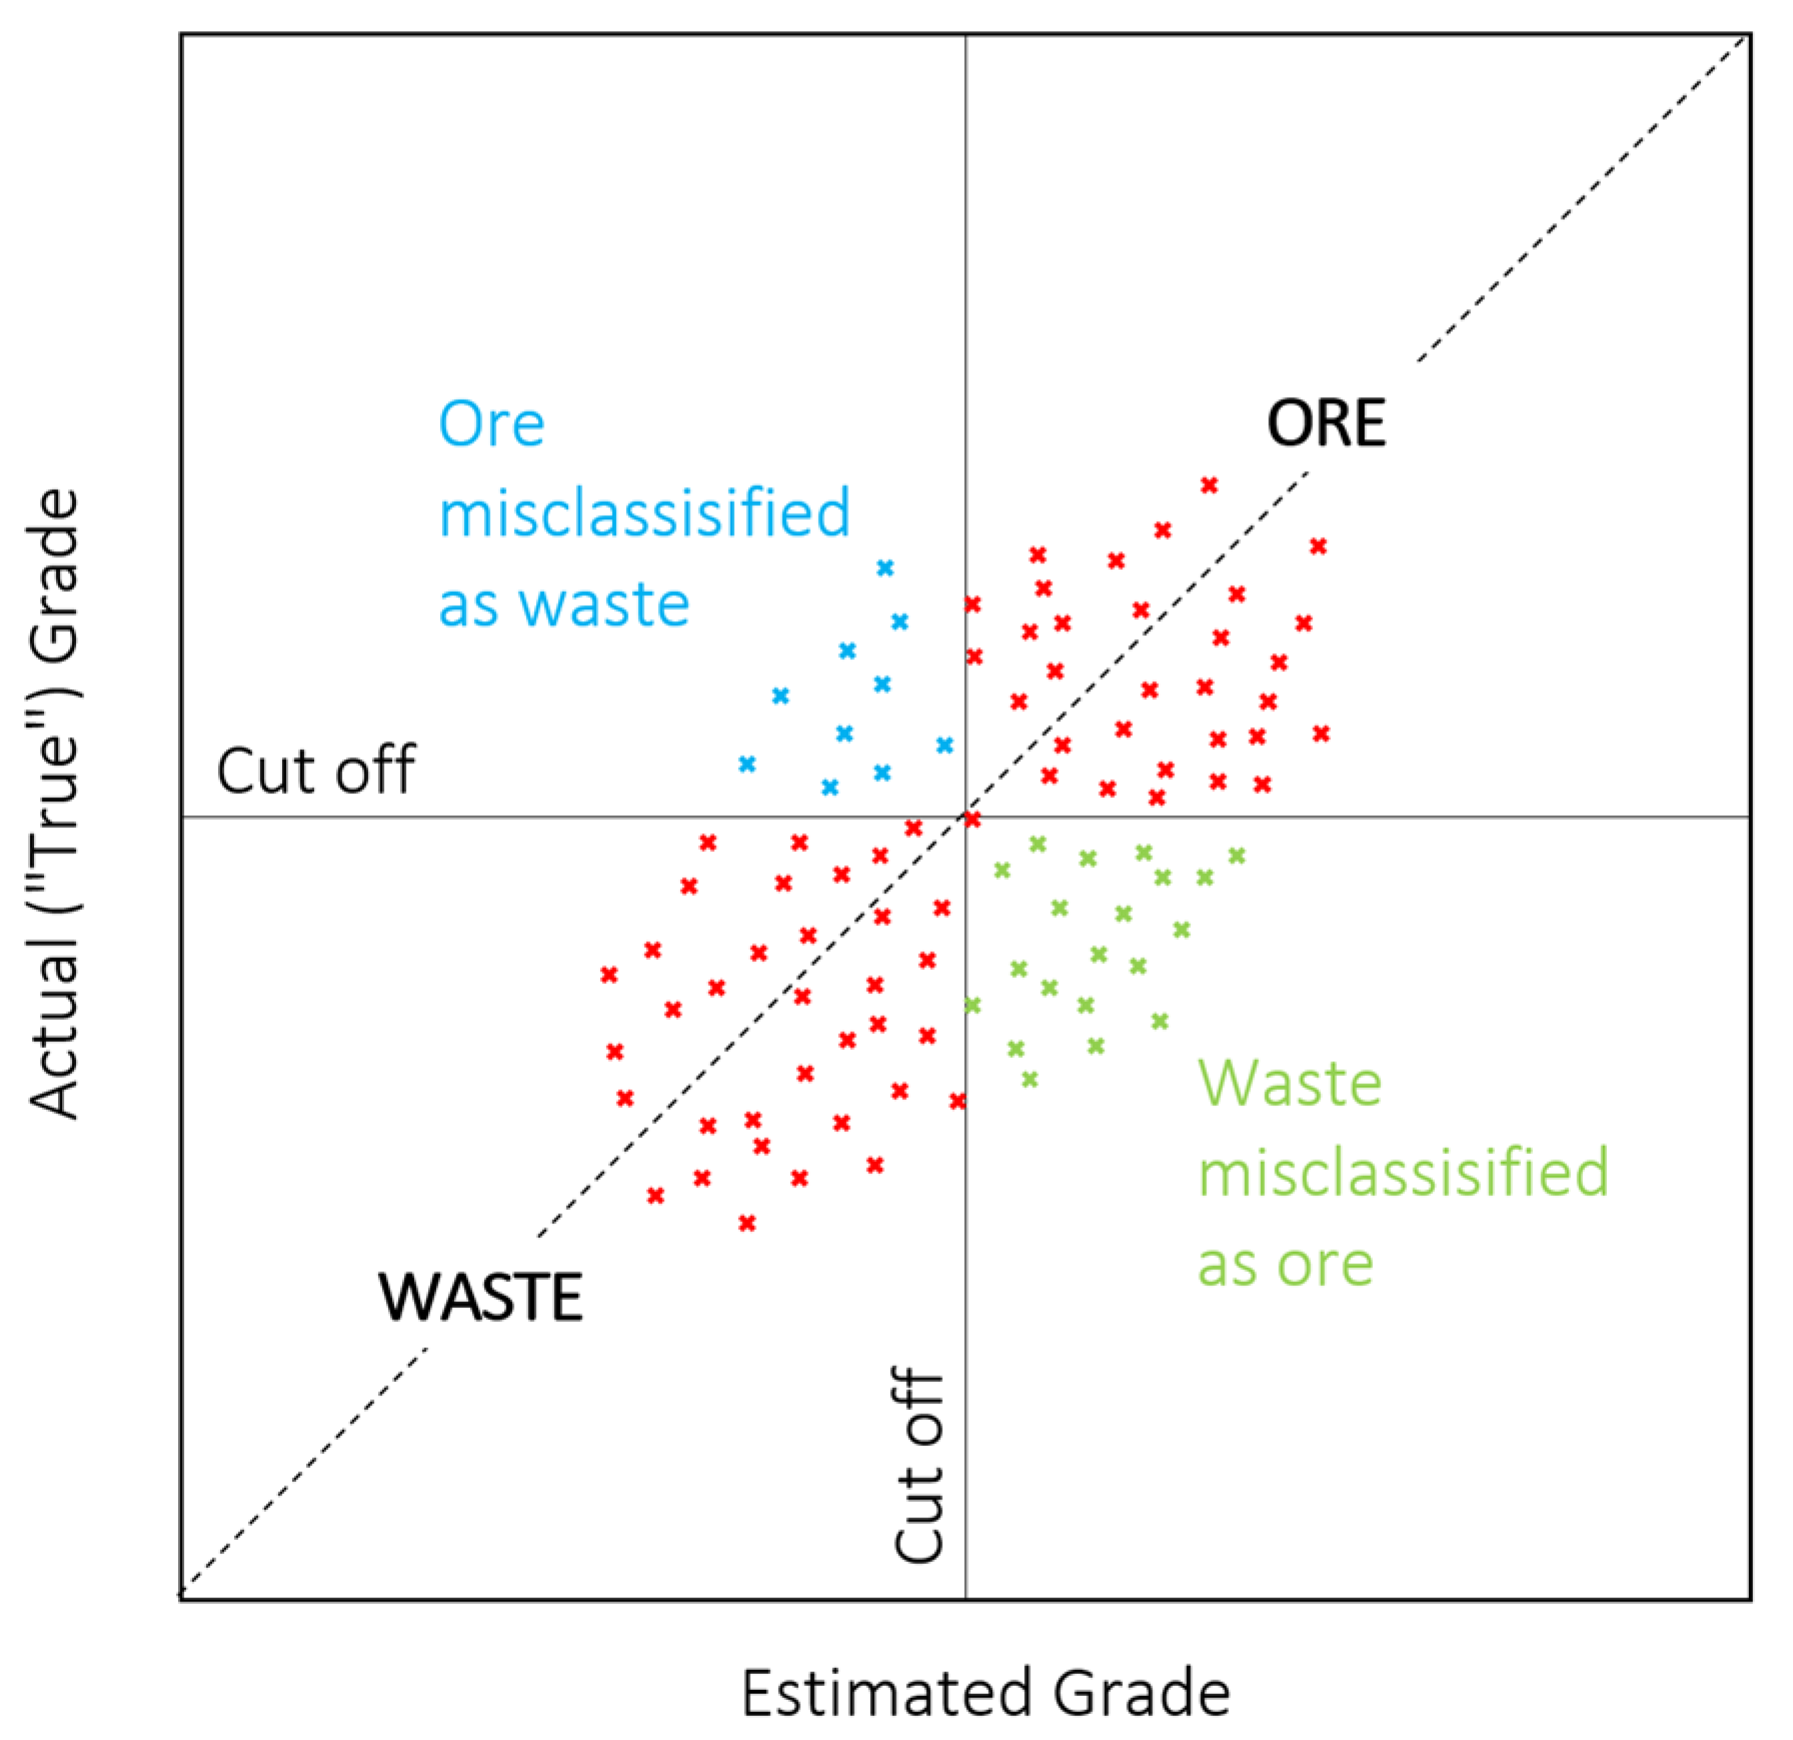
The grade control process pretends to establish a procedure to differentiate ore from waste, trying to diminish both the ore materials driven to dumpsites and the ore misclassified as waste and the waste material entered to the concentrator and the waste misclassified as ore (
Figure 3, below). By “true” grade, we mean the closest data to reality technically feasible, which will come from data obtained during the production phase, what is effectively called “grade control.”
Classical books such as Annels [
12] established several procedures to execute the grade control: at an open pit, sampling from the detritus of the boreholes, or trenching along the benches, even using specialized machinery; at underground mines, Dominy et al. [
13] give details of the sampling of the production stopes and gallery faces or the development of sampling borehole campaigns.
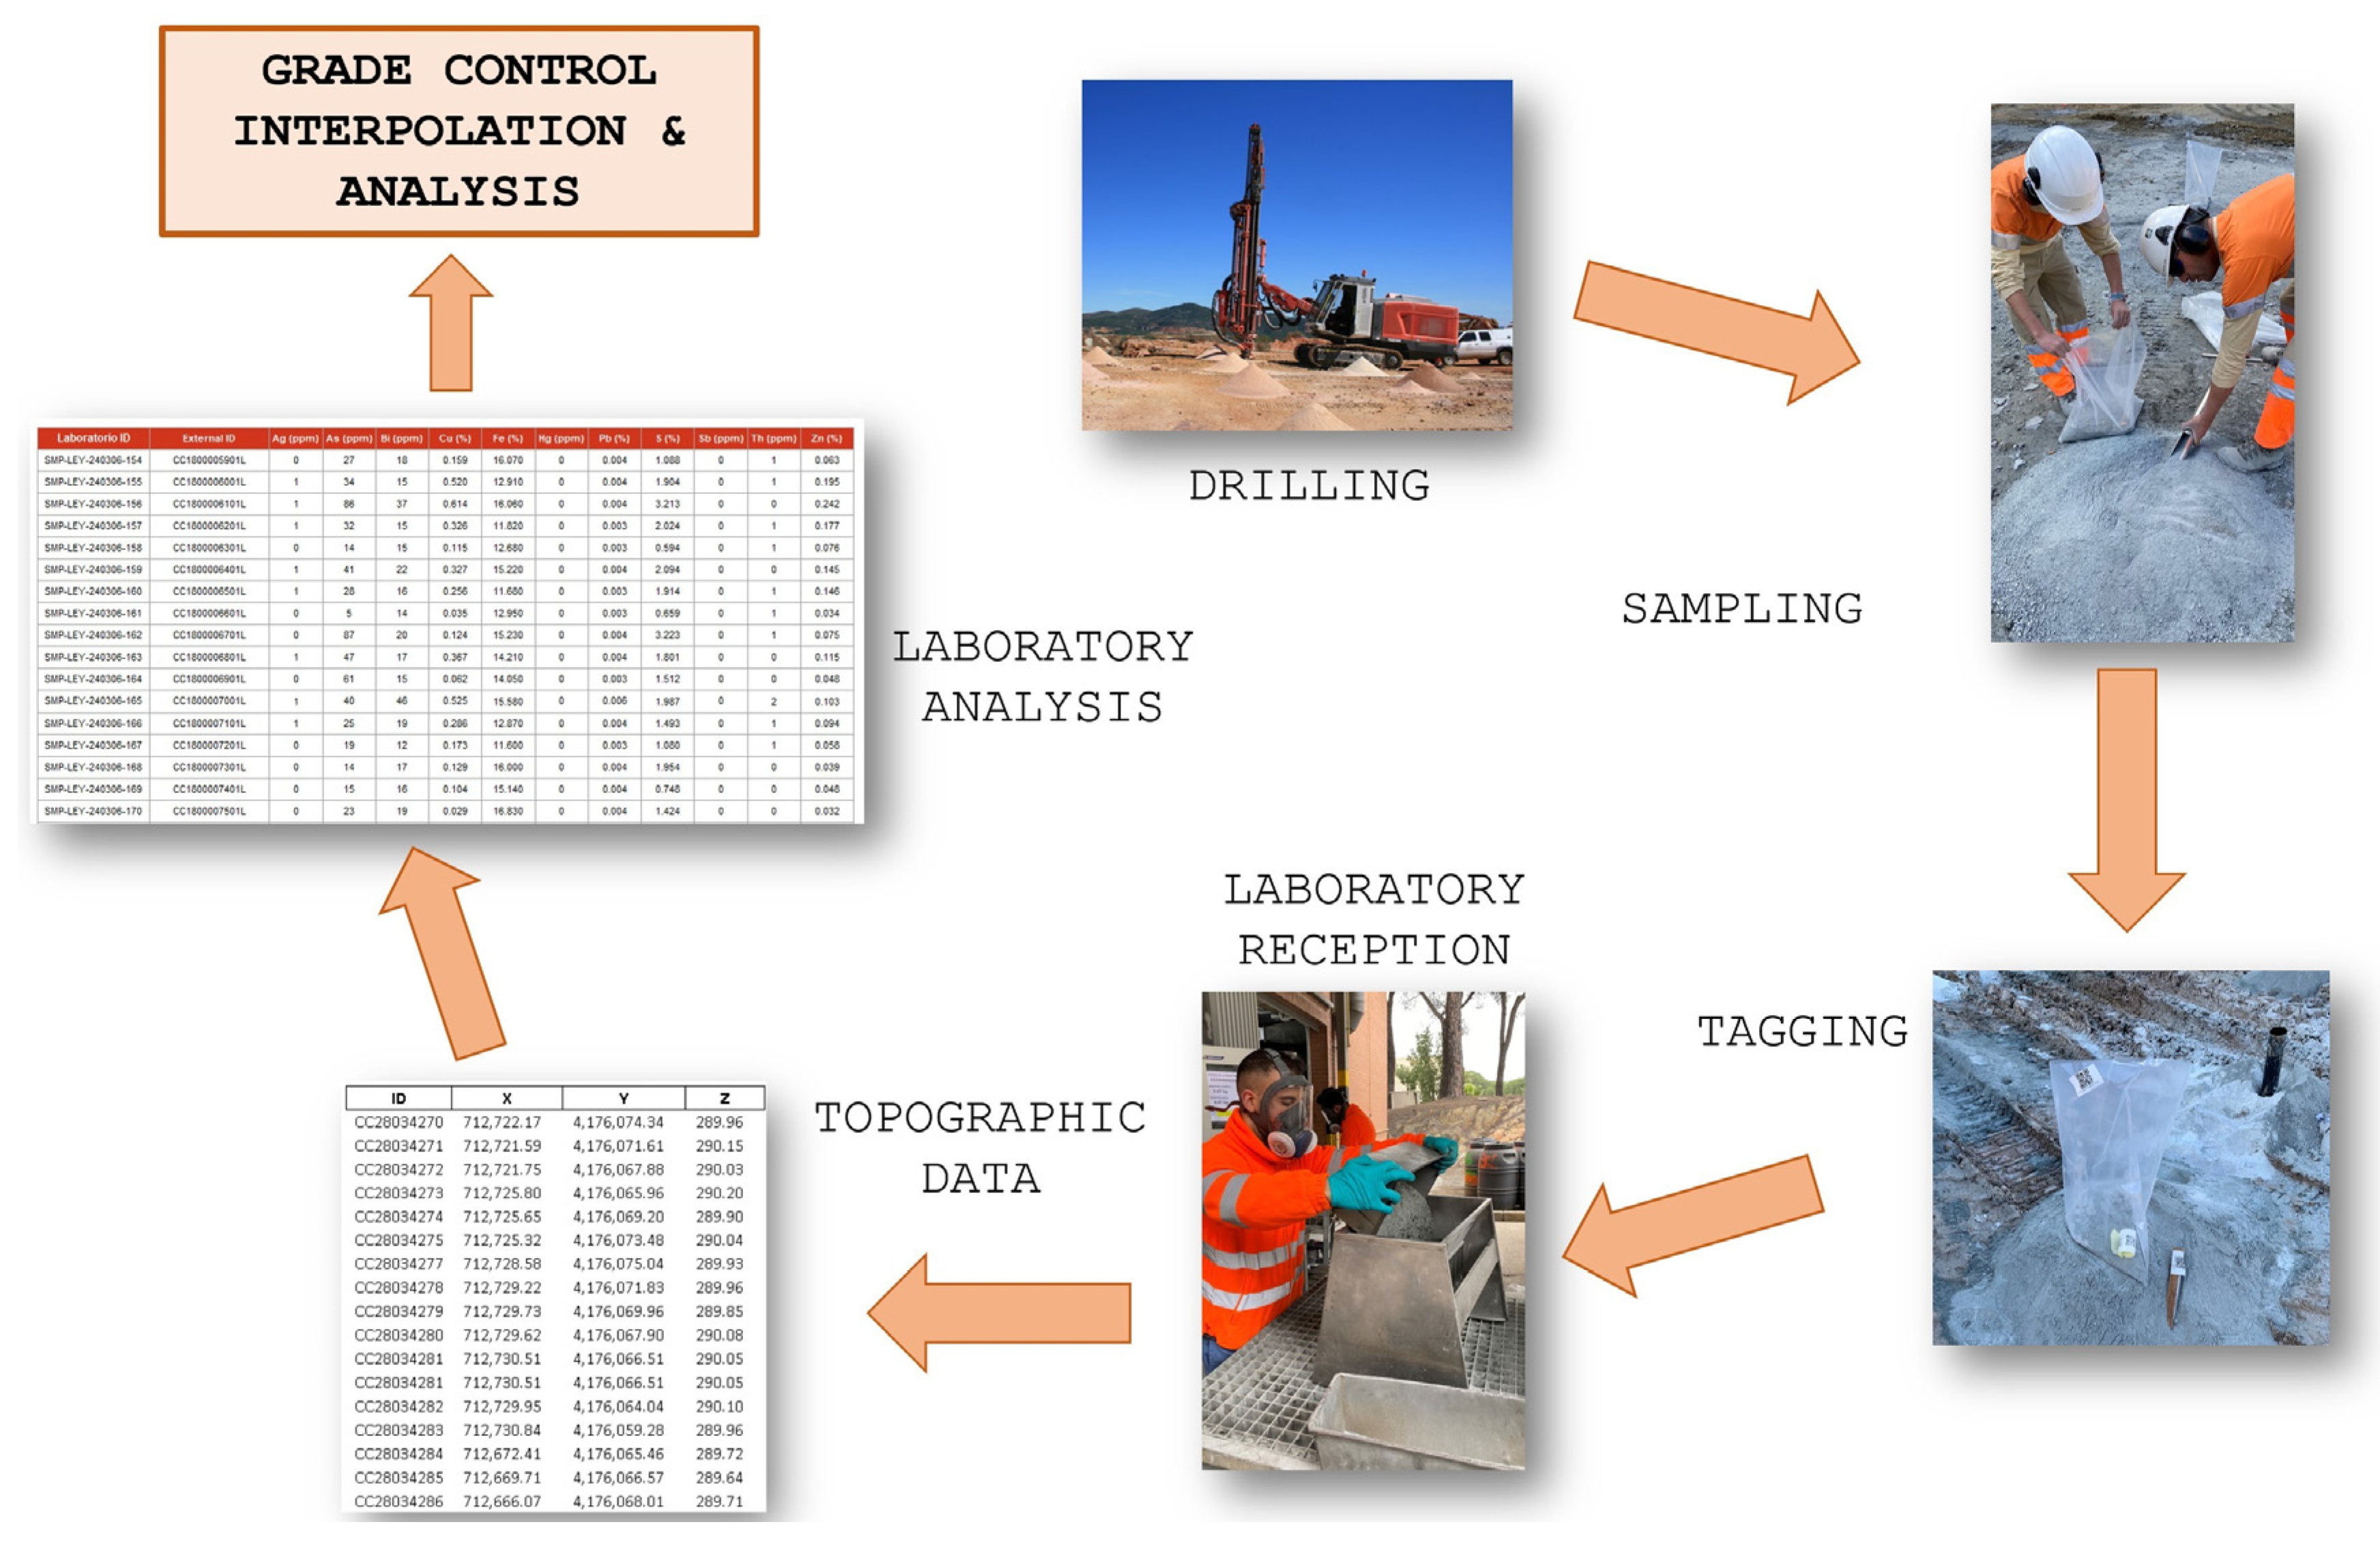
The grade control (
Figure 4) will take samples from the detritus of the drill rigs that are used for blasting the benches with explosives. Each hole is sampled manually and tagged by the grade control personnel. Samples are taken to the mine laboratory, where they are analyzed to measure the grades of the different elements. The laboratory sends the results in ASCII files to the grade control department, which will use the data to interpolate the closer-to-“reality” grade data to differentiate between ore and waste.
In order to define the grade control procedure, the following points must be addressed:
- -
Bench height, both ore and waste zones.
- -
Perforation parameters: drilling type, machinery selection, perforation mesh spacing.
- -
Sampling: procedures, location of the sample extraction, the weight of the sample, storage, and labeling.
- -
Sample preparation and analysis.
- -
Model block definition and interpolation method.
- -
Definition of the penalizing elements.
- -
Criteria of the economic areas.
- -
Limitation of the loading and destination zones.
This information will be presented throughout this paper text, explaining the way the grade control process is being developed in the Corta Atalaya mine.
The bench height is an open pit design parameter defined according to the local legislation, the security of the slopes, the machinery used, and the dilution control, which is closely correlated with the grade control procedures.
The bench height ranges from 5 m to 20 m, and the simplest method is to use, as in quarries, the same value all over the mine. In metallic mining, where mineralized veins can be narrow or mineralized bodies can be small, the bench height is diminished in order to decrease the dilution: the lower the bench is, the lower the risk of mixing the mineralized lithologies with the waste material conforming to the host rock.
But the lower the bench height, the higher the cost to excavate, as can be read, e.g., in Kose et al. [
14], load, and haul the material. So ideally, waste lithologies will be given high bench heights, and ore ones will be given low heights. There are other parameters that will also influence this value: the production rate and the type of the loader machine, the mineral morphology, the number of different loading areas that can be simultaneously operated, and finally, the scheduled time of the grade control cycle referred to in
Figure 4, which will be detailed below. A lower size is good for diminishing dilution, but it also diminishes the production rate.
Taking into account all these factors, the Riotinto mine has been working with 10 m as bench height in waste areas and 10 m in ore zones during the last 7 years. The final pit design will be given bench heights of 20 m and berm widths of 10 m.
4. Materials and Methods
4.1. Field Sampling and Marking
Sampling should be considered an art, which tries to obtain a faithful representation of reality with the added difficulty of measuring the characteristics of a material, in this case, the metal grade of a mineral, from a few milligrams measured in the laboratory that sample the hundreds of kilos of material that are drilled in the development of a hole, which in turn is representative of the thousands of kilos of material that that hole blasts.
Classic theory to determine the size of a sample is from Pierre Gy [
15], which can be consulted in several publications, such as Petersen [
16], Gerlach and Nocerino [
17], or Minnit [
18].
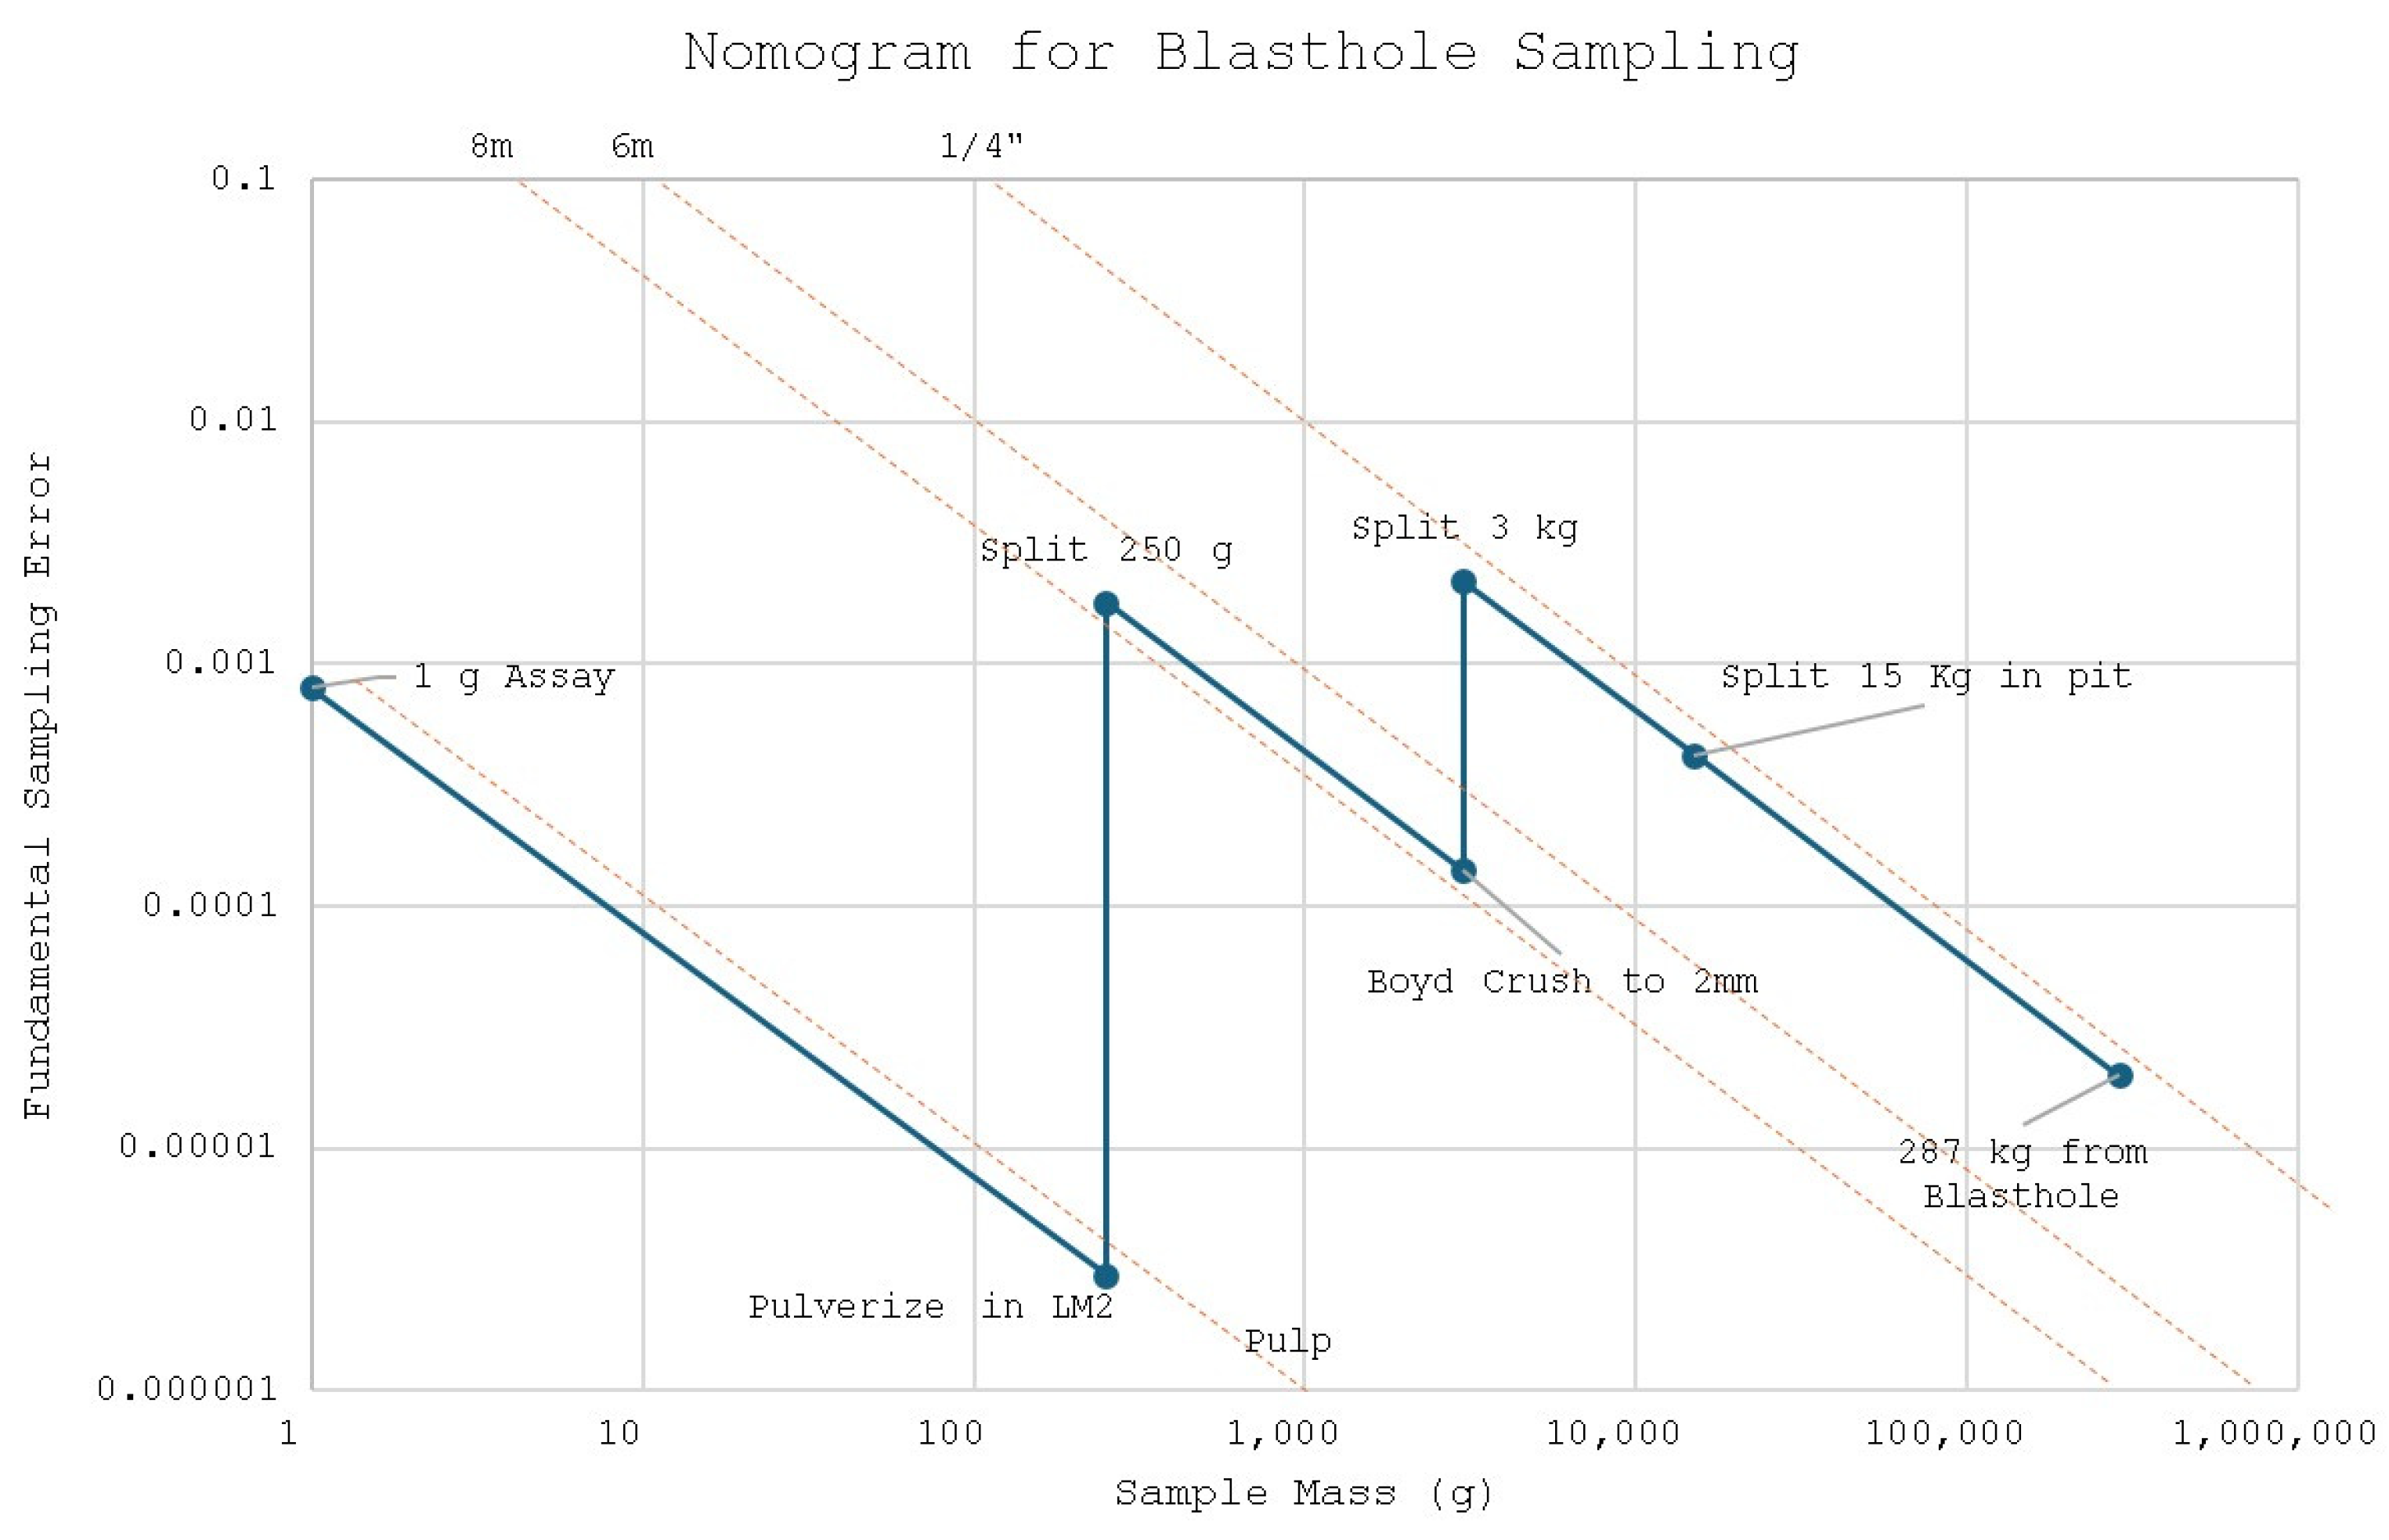
The figure above shows the process of sample size selection according to the classical equation for the fundamental sampling error (FSE) originally developed by Gy. The sampling nomogram is a useful tool for understanding the propagation of sampling errors for a sequence of subsampling and size reduction. The sampling nomogram is shown for the current method of grade control sampling in the figure above. This nomogram is constructed by computing the fundamental sampling error for each stage in the sampling process using the variance of the FSE equation.
If MS is the weight of the sample and ML is the weight of the original lot, this formula is applied experimentally by measuring the FSE at different particle sizes and then using a power curve to estimate constants K and α as a function of FSE divided by the quantity .
These points are then plotted on the nomogram (
Figure 5). When sample splits take place at the same particle size, they form a line with a slope (−1). Every time a size reduction is conducted, the curve drops down to a new level according to the new particle size. The incremental FSE for each split is equal to the FSE for the subsample mass minus the FSE for the previous (larger) subsample. There is no added error for a size reduction step. The FSE calculations show that the largest contribution to the splitting errors is in the splitting of the original coarse cuttings.
Considering the expected mineral production, as well as the height of the mineral bank and the type and hardness of the rock, the most suitable method for taking samples in the Riotinto mine would be the use of direct circulation drillings (where the same blasting boreholes can be used for both blasting and sampling), adapting the grade control needs to the blasting mesh, and if necessary, interspersing some boreholes in the mesh to increase the sample density, if needed. Only one sample is collected by boreholes (10 m drill length), although in some cases, 2 benches can be drilled at once, and then 2 samples are taken.
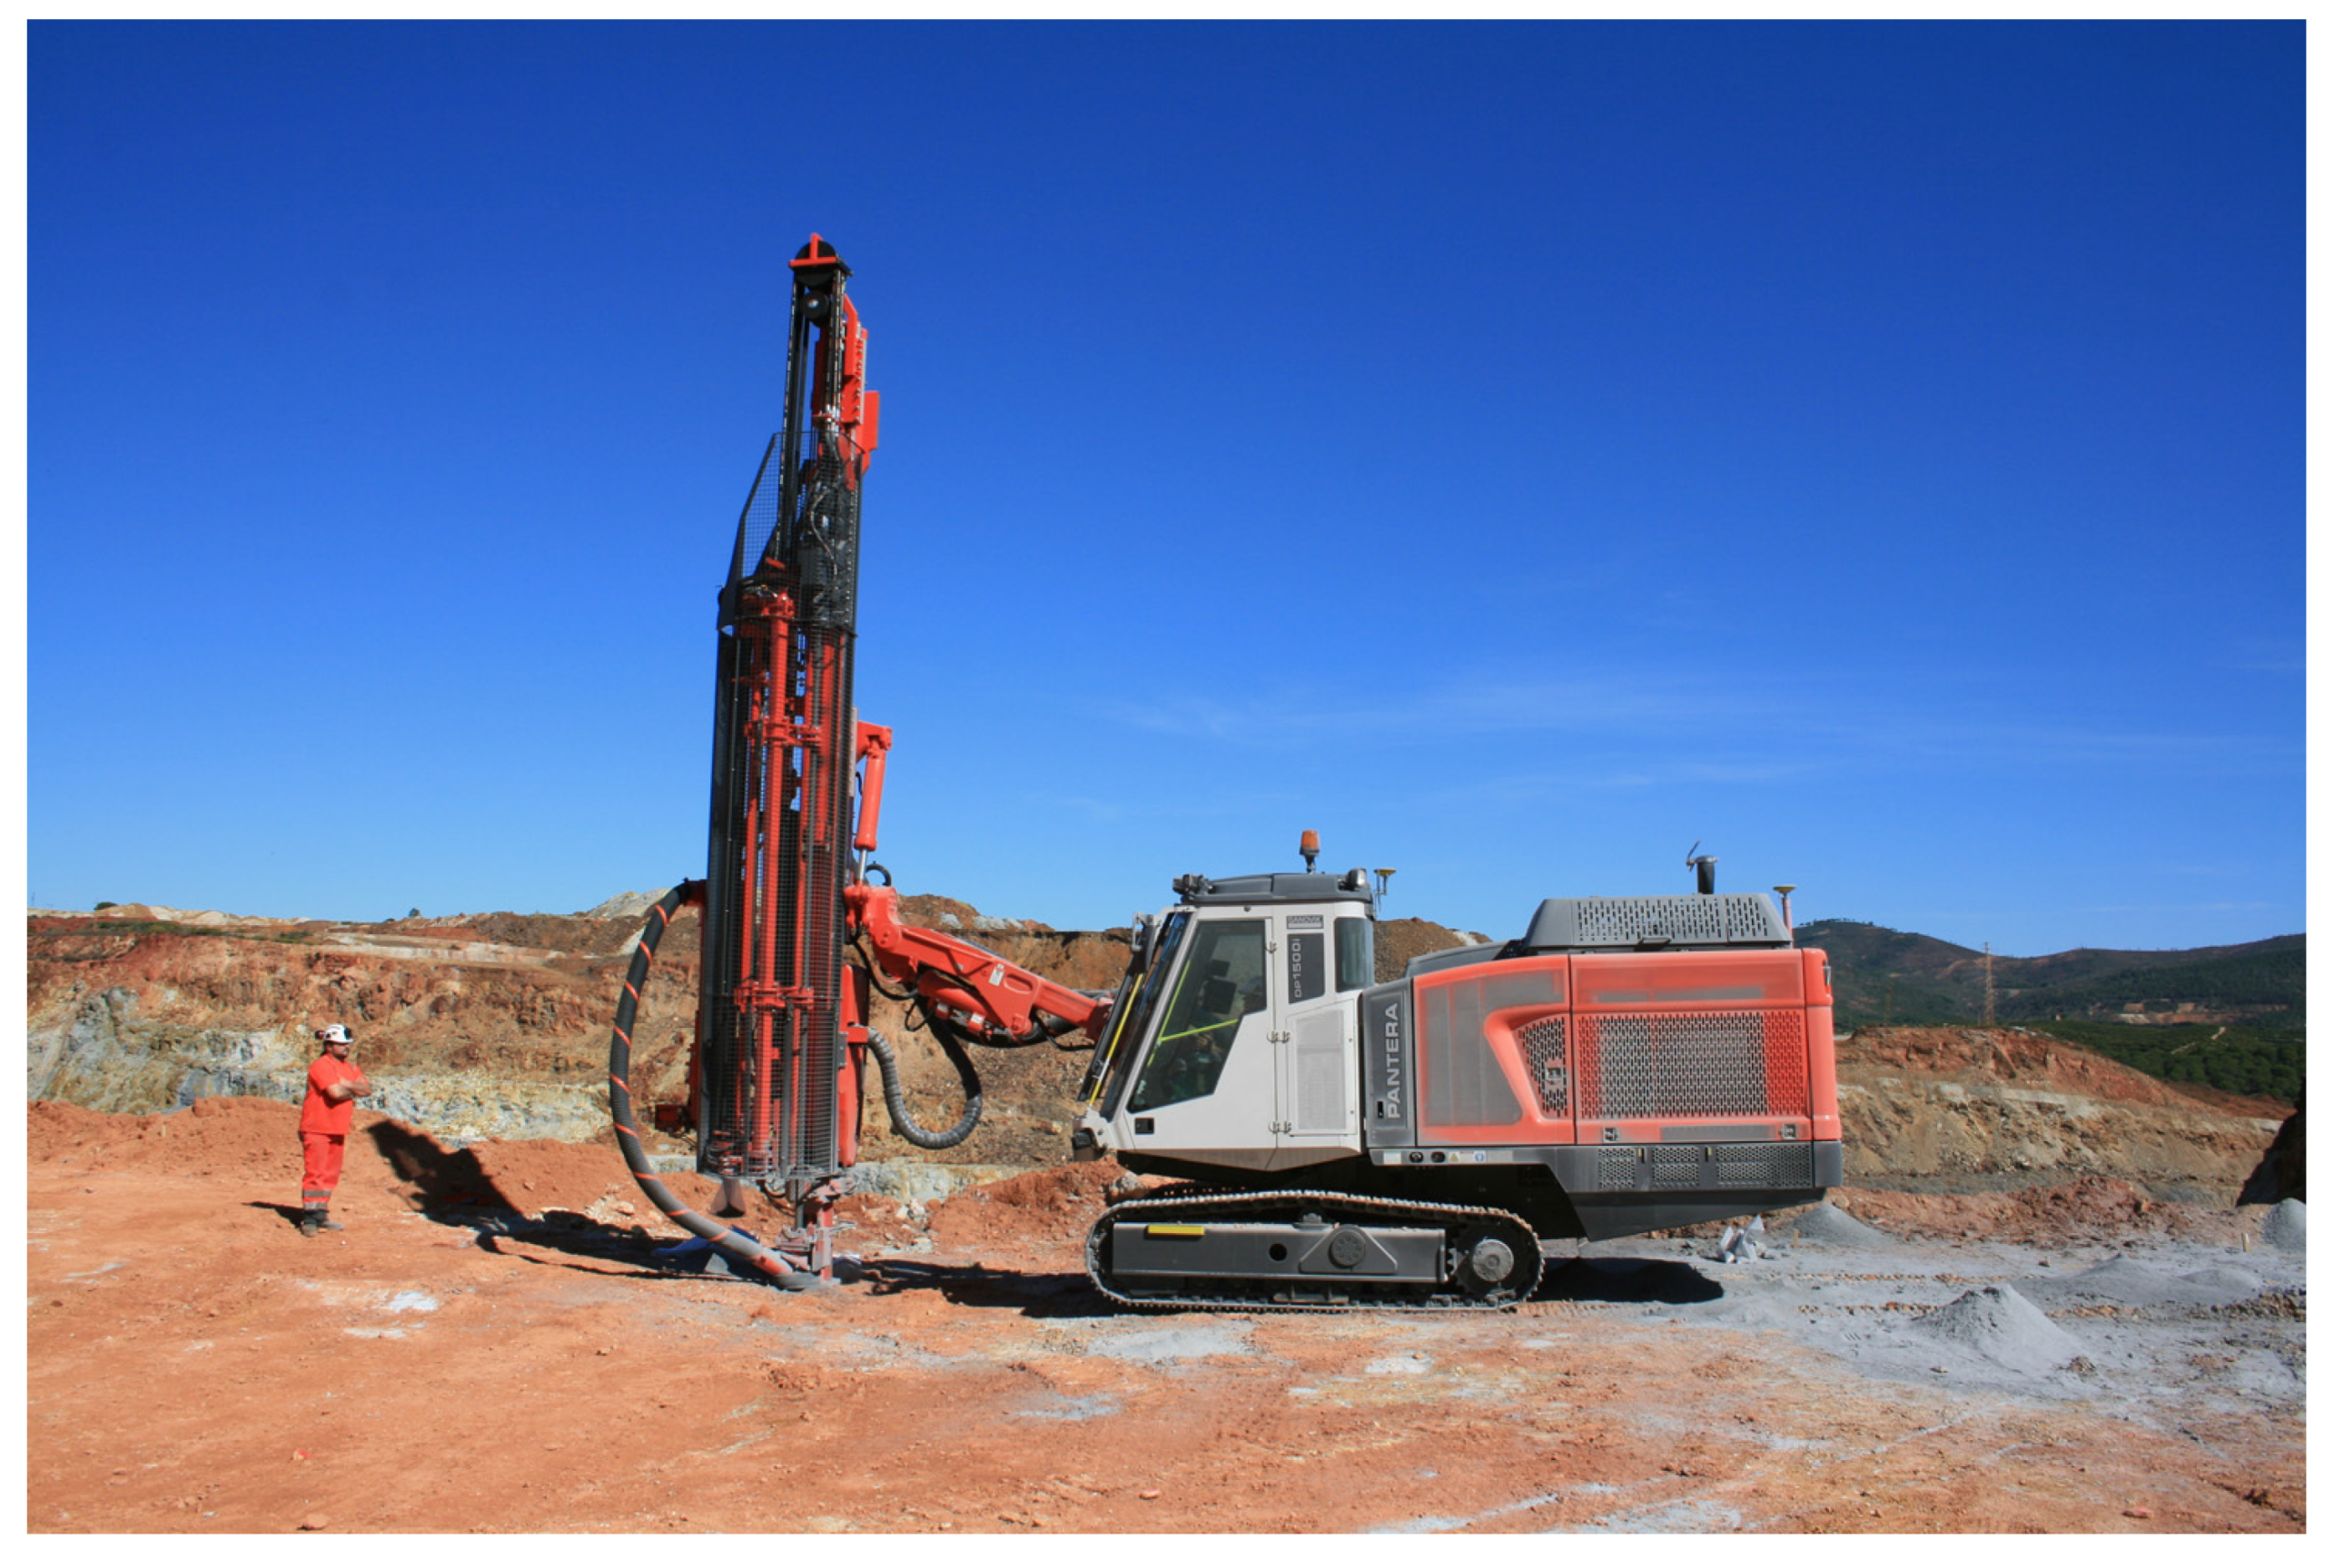
The considered mesh spacing is (burden × spacing): 3.25 m × 3.75 m/3.50 m × 3.50 m/3.50 m × 4.00 m/4.00 m × 4.50 m. Drills are executed by a fleet of 12 Sandvik Pantera DP1500i drill rigs equipped with a dust collection system, as shown in
Figure 6.
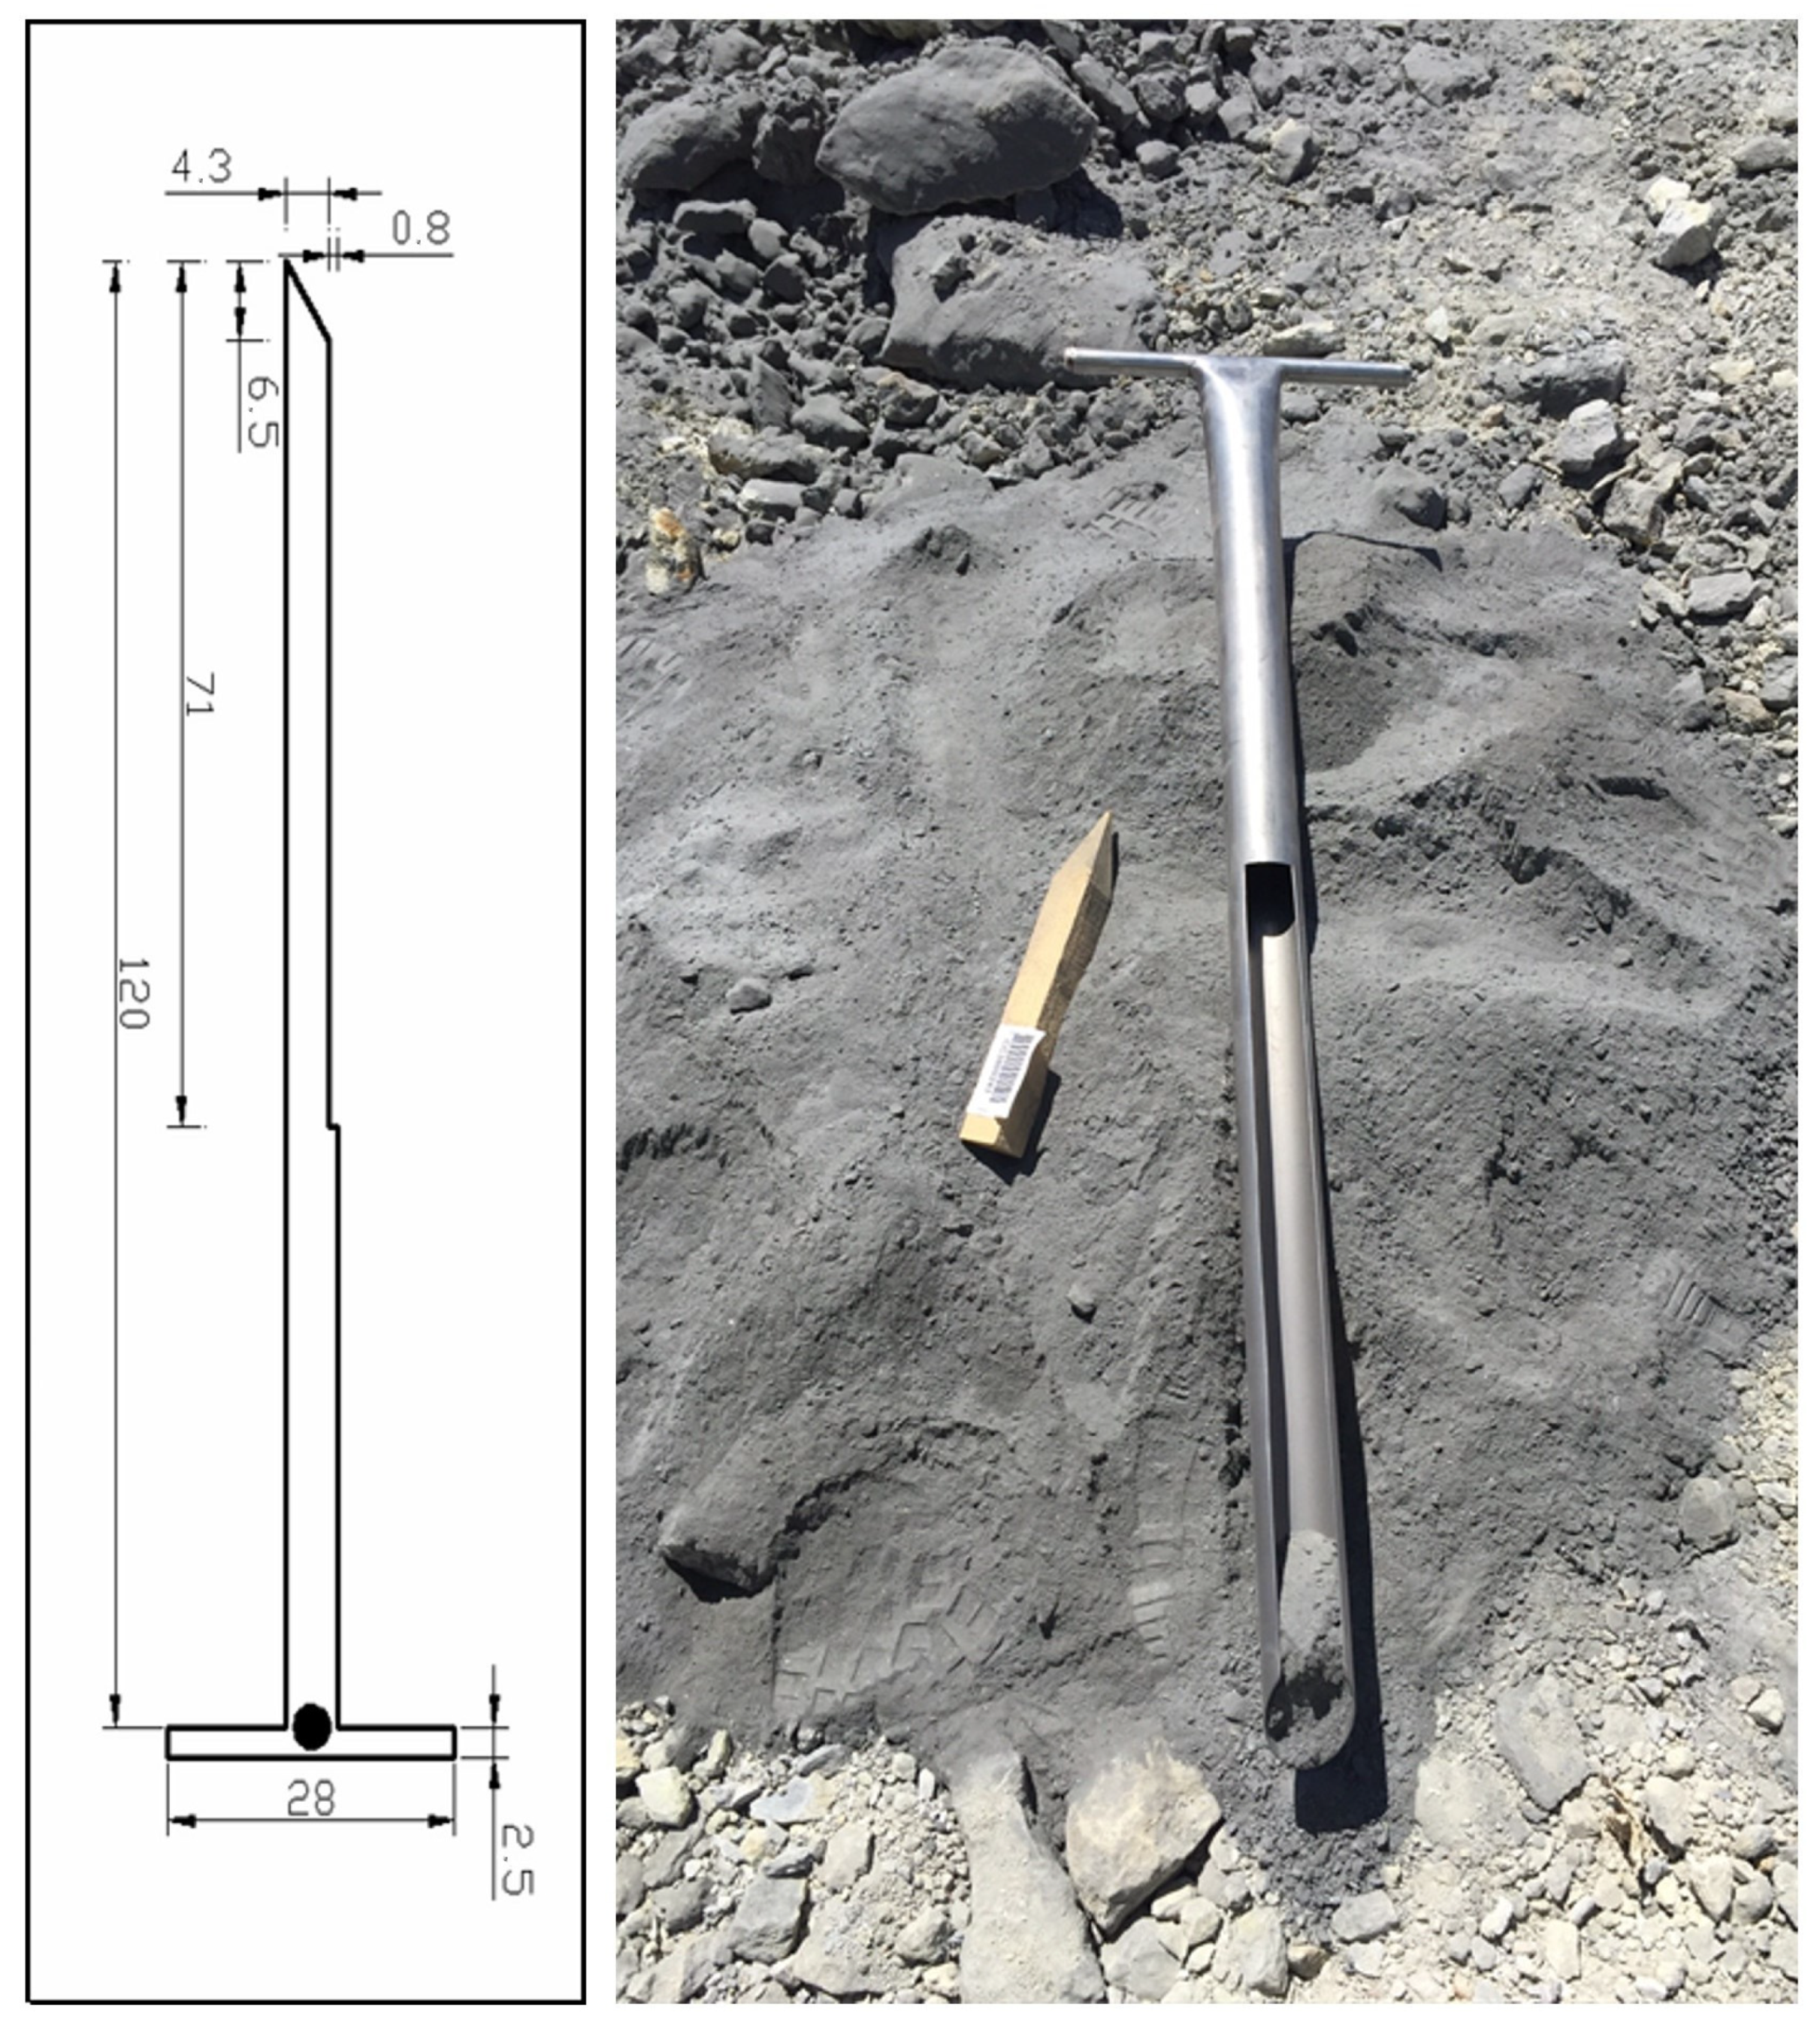
Since the bench to be blasted is 10 m in height, and the hole diameter is 4.5 inches, the total volume of the drilled hole is estimated at 0.1026 m3, and considering an average density for the ore of 2.8 t/m3, the total weight of the sample happens to be 287 kg, a big amount of material; hence the need to do a first quartering directly in site to facilitate the handling of such a quantity of sample.
The classic stainless steel hand probe sampling method is used (
Figure 7), complying with the JIS M 8101 standard, which is passed through the detritus cone generated by the drilling rig and thus obtaining a representative sample.
The grade control drilling mesh will take advantage of the blast drilling, interspersing some drilling if necessary. Our recommendation is to carry out the drilling in the longitudinal direction of the mineralization, with the distance being greater than in the perpendicular direction.
The drillings can be vertical or at a slight angle to facilitate blasting, and in some areas, two banks can be drilled at once, taking a sample of 10 m each by flying and loading each bank separately in order to confirm the grades that will be met later.
There is a part of the drilling detritus that is not sampled, the one the machine eliminates through another duct (a cyclone separation operating to guarantee the health insurance of workers), and that is around 5% of the material; it is the finest part of it (a.k.a. ultrafine), and to be sure that the error is not important when discarding it, comparative tests were carried out on the detritus from the cyclone and the ultrafine, giving very similar grades and close enough to consider that the error was not significant.
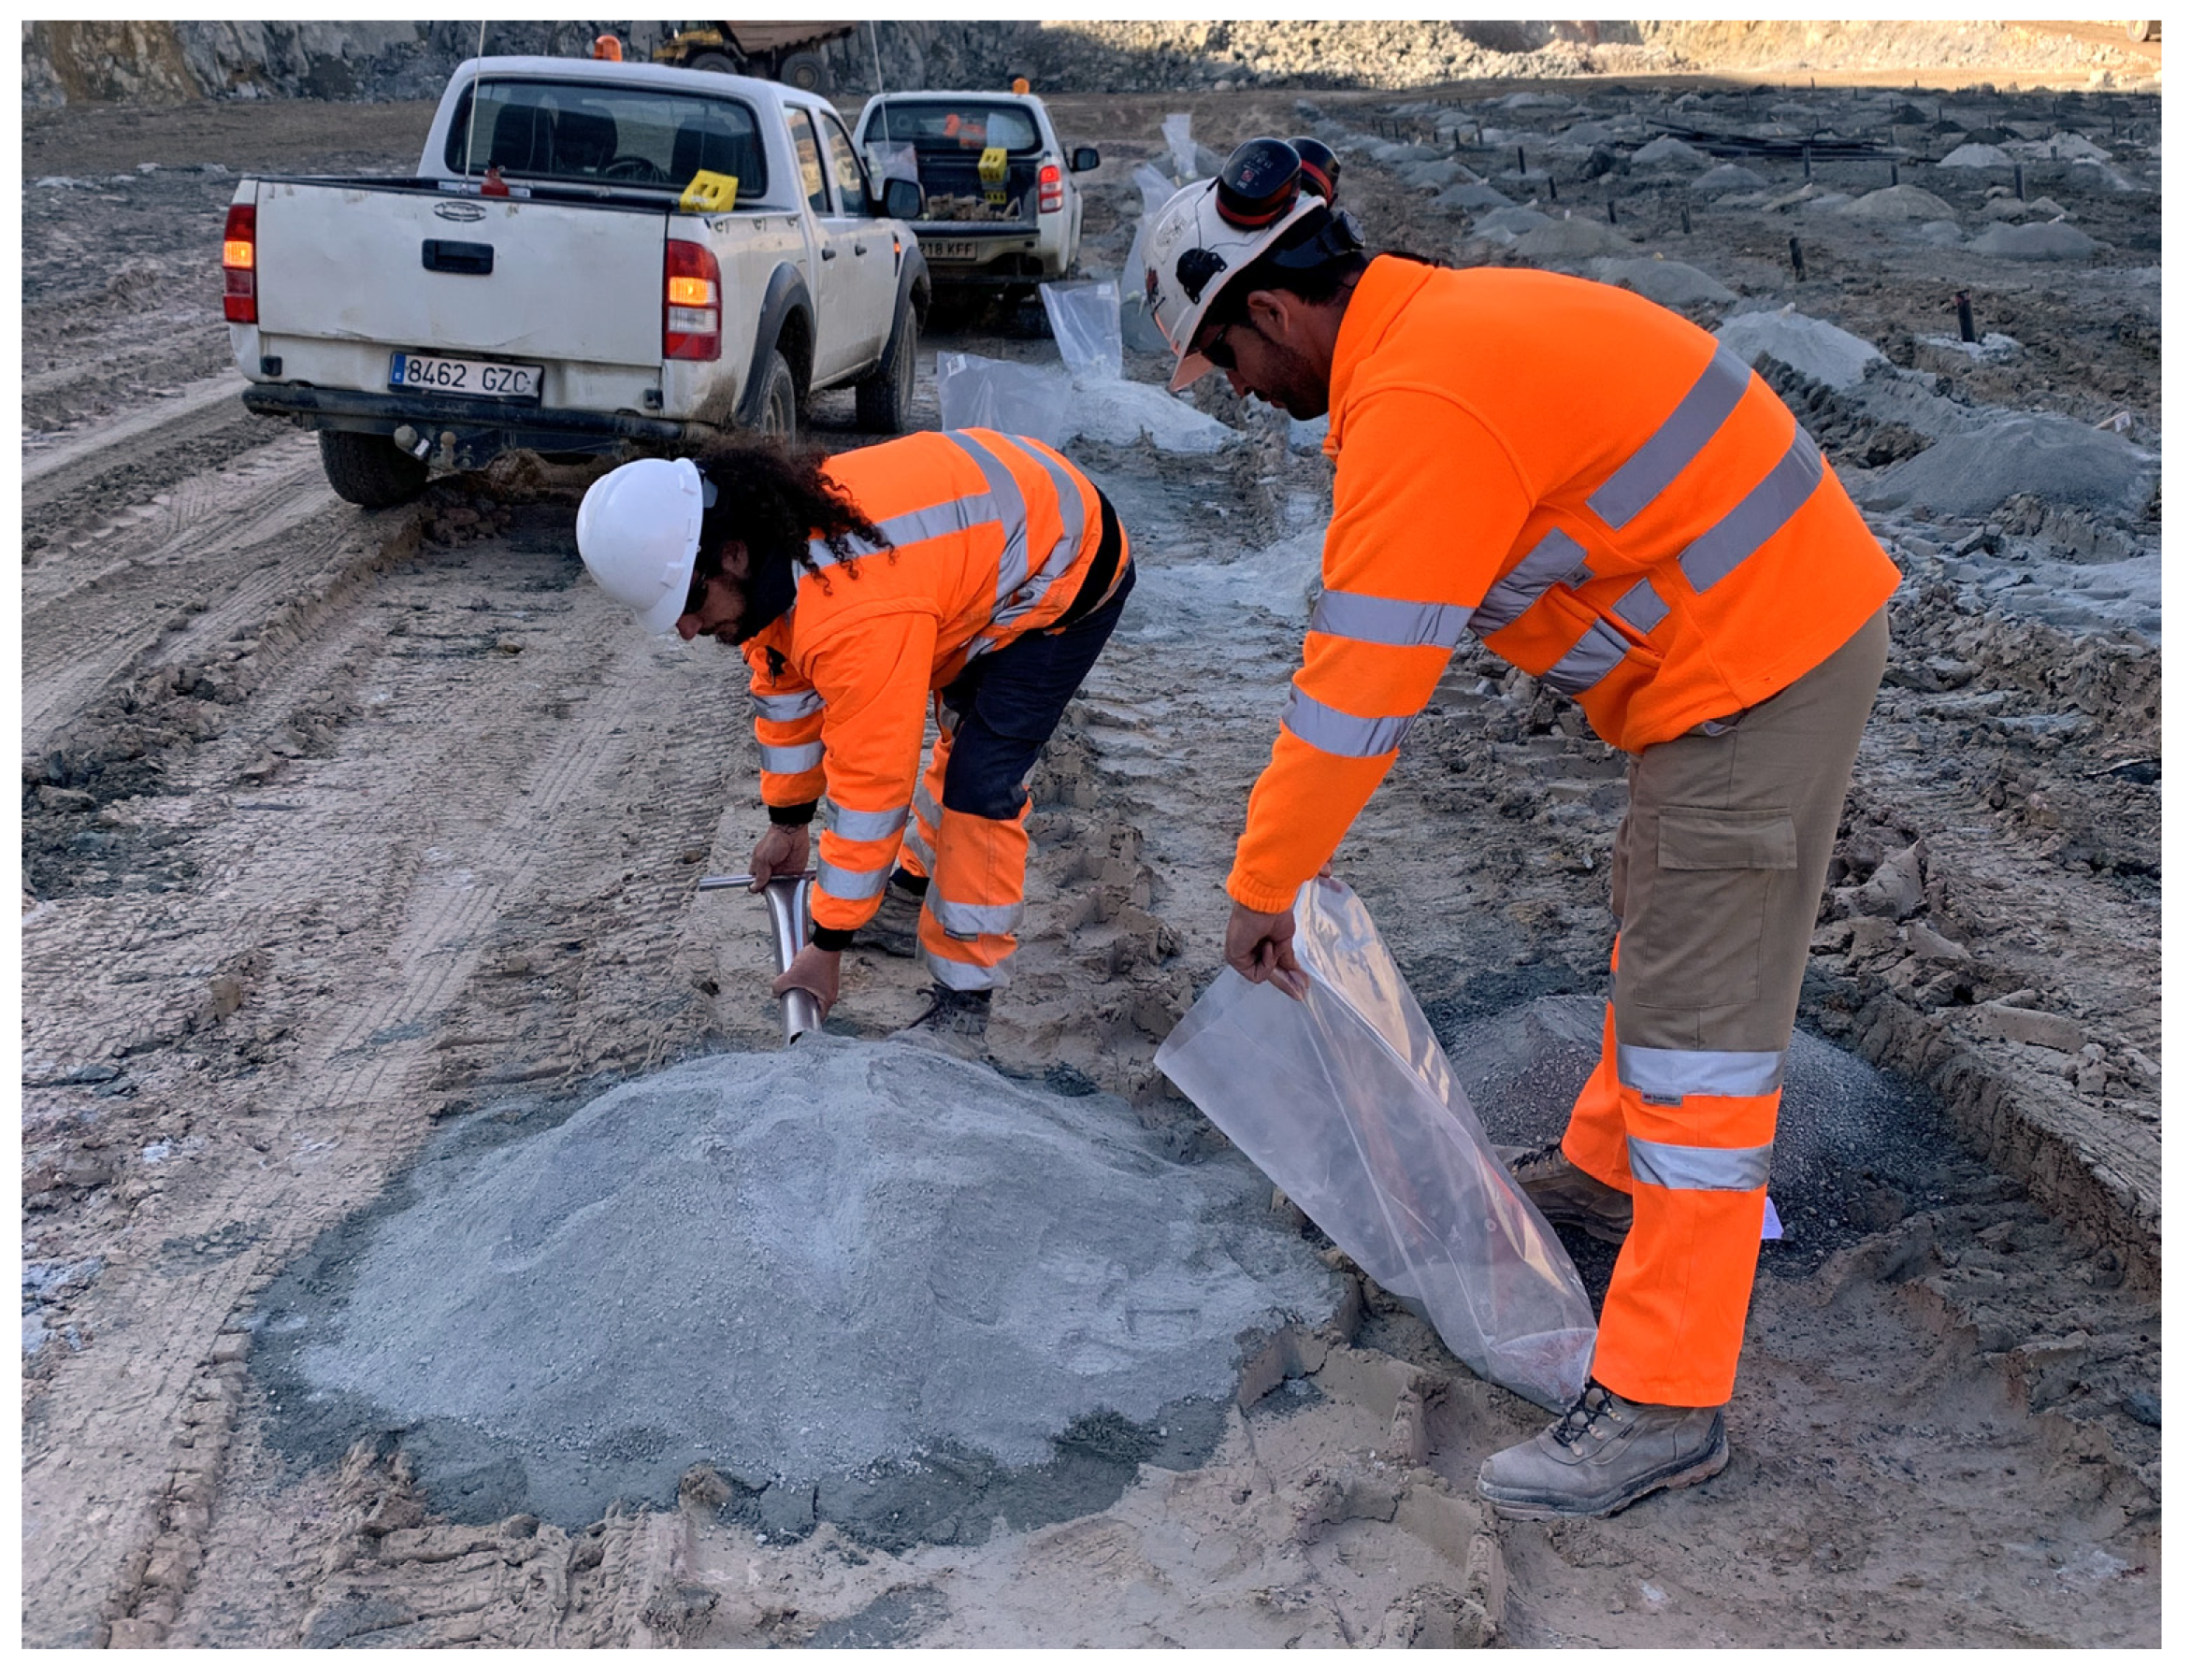
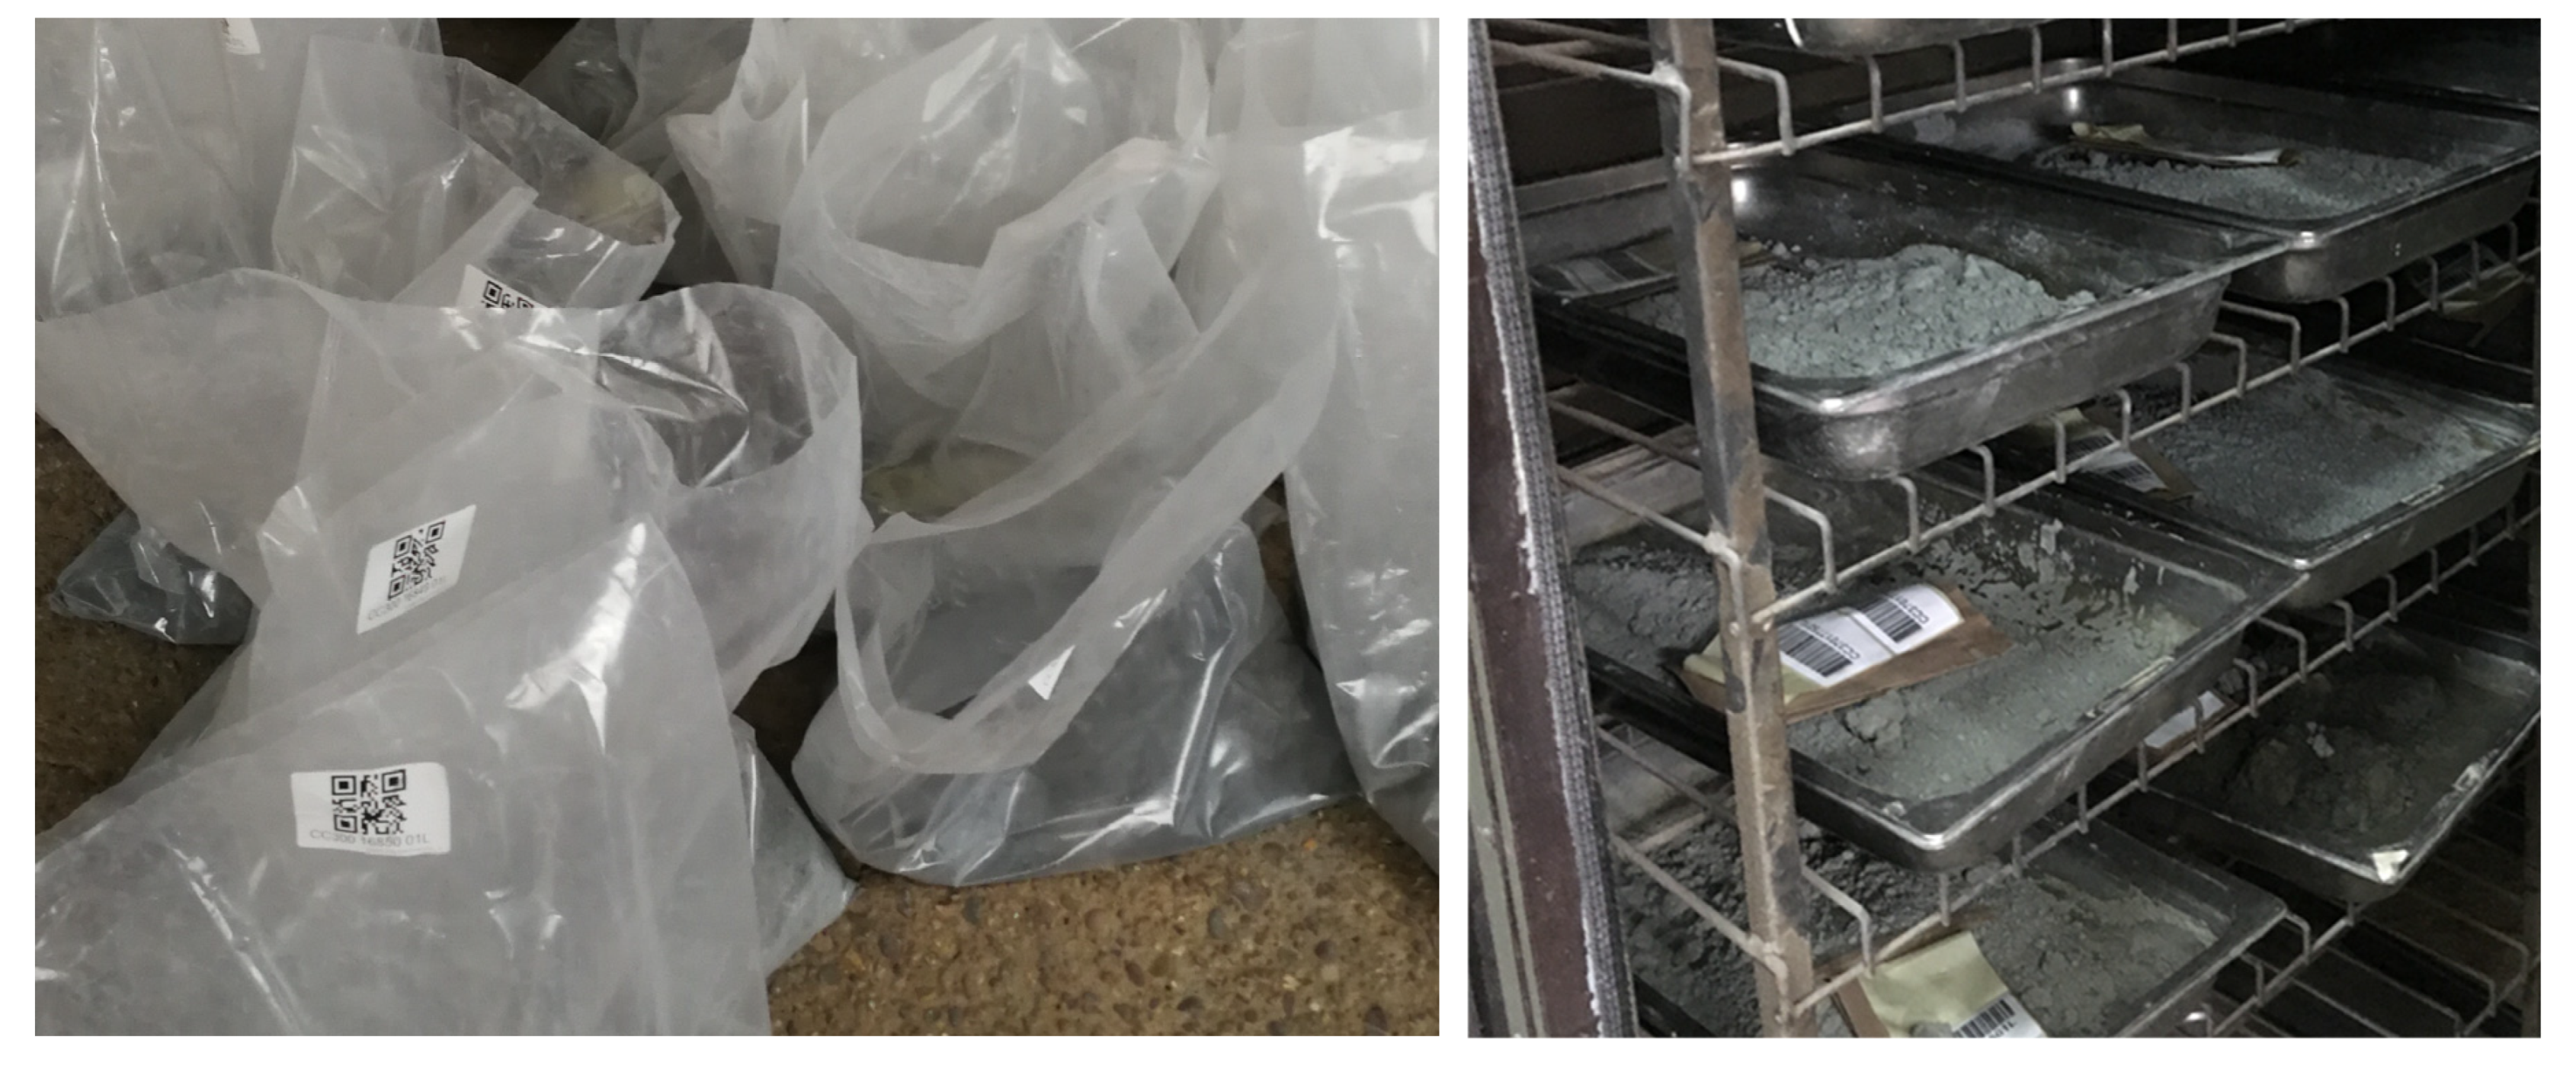
The samples are poured into individual plastic bags (
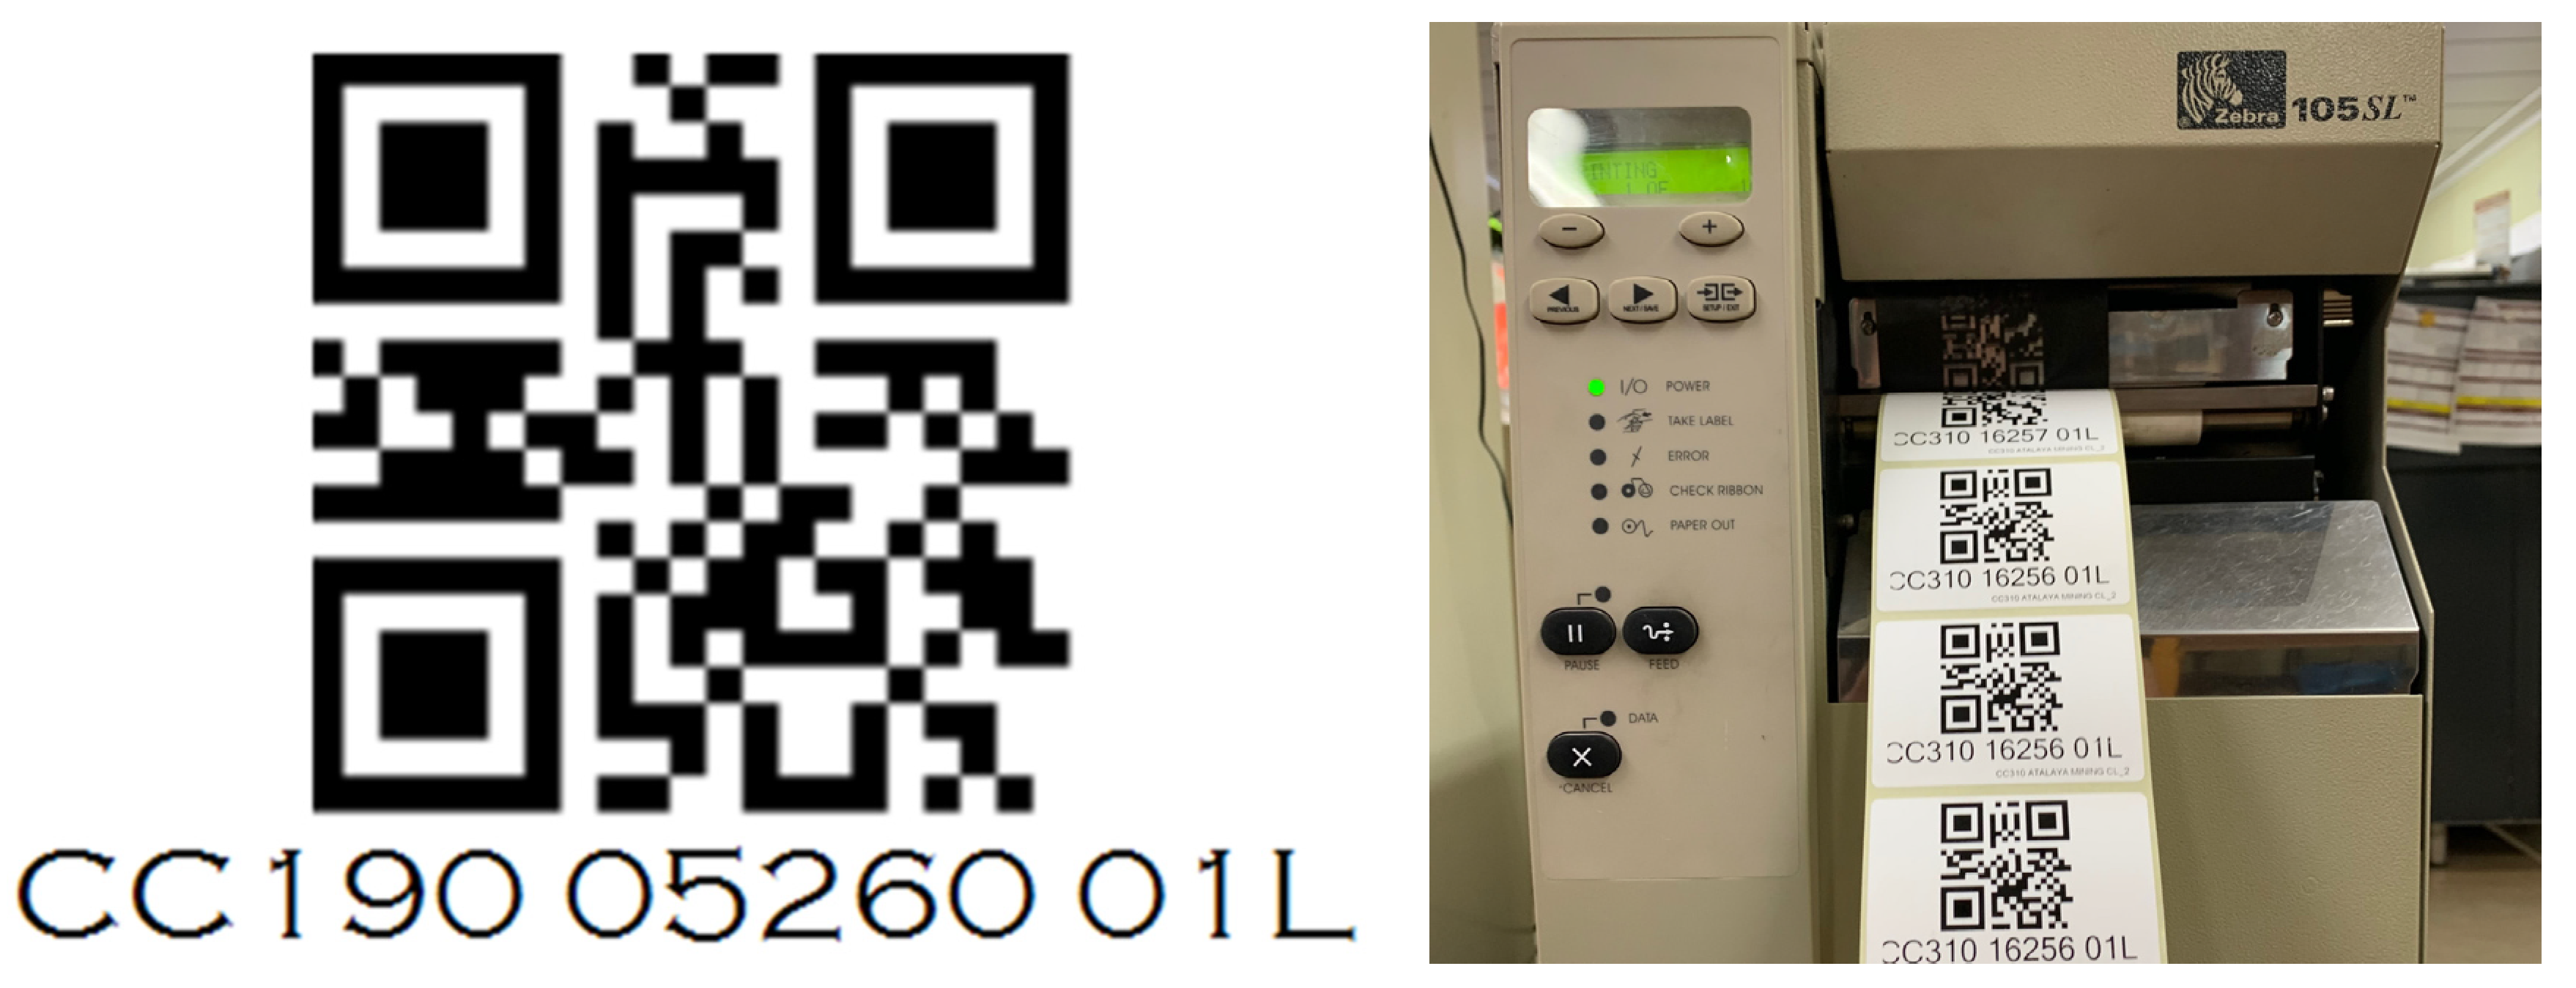
Figure 8) by trained operators, attaching several stickers with a unique identifying QR code inside of them that will accompany the sample on its way to the laboratory, as well as another identical tag attached to the outside of the bag.
The coding of the different samples taken is essential to maintain the traceability of the samples with the areas and benches in exploitation.
This coding consists of a series of letters and numbers (
Figure 9) that intuitively give the data necessary to identify the samples. The coding is printed on stickers along with a barcode that makes it easier to read in the sample preparation departments and in the analysis laboratory.
All samples must be perfectly identified, avoiding human error as much as possible throughout the entire process, from obtaining the sample to its analysis.
The number and letter coding we have developed is the following:
4.2. Laboratory Works
The sample taken in the pit by the grade control department is transported from the field to the sample preparation laboratory, where the code on the sample bag is read with a barcode reader. Upon arrival at the laboratory, the first step is to record the weight of the total sample. The sample is weighted, and the input weight is recorded automatically.
The personnel of the laboratory deal with thousands of samples weekly, so all the data processing should be highly automated in order to avoid mistakes. A computer application is used to control, register, and monitor all the tests conducted on a sample and will be exported to a report, in which they are recorded for later consultation.
If the sample arrives wet, the wet weight is recorded, and it is guided to the drying process by placing it in one or more stainless steel trays of appropriate size (360 mm × 250 mm × 65 mm,
Figure 10), depending on the resulting quantity, and introducing it into the ovens and drying it for 2–24 h at 85–95 °C. In each tray (or in the first one if there is more than one), the sticker is included with the corresponding identification of the sample. Once dried, the dry weight is recorded, and the software calculates the sample moisture. If the sample arrives dry, wet and dry weights will be equal, and humidity will appear as 0%.
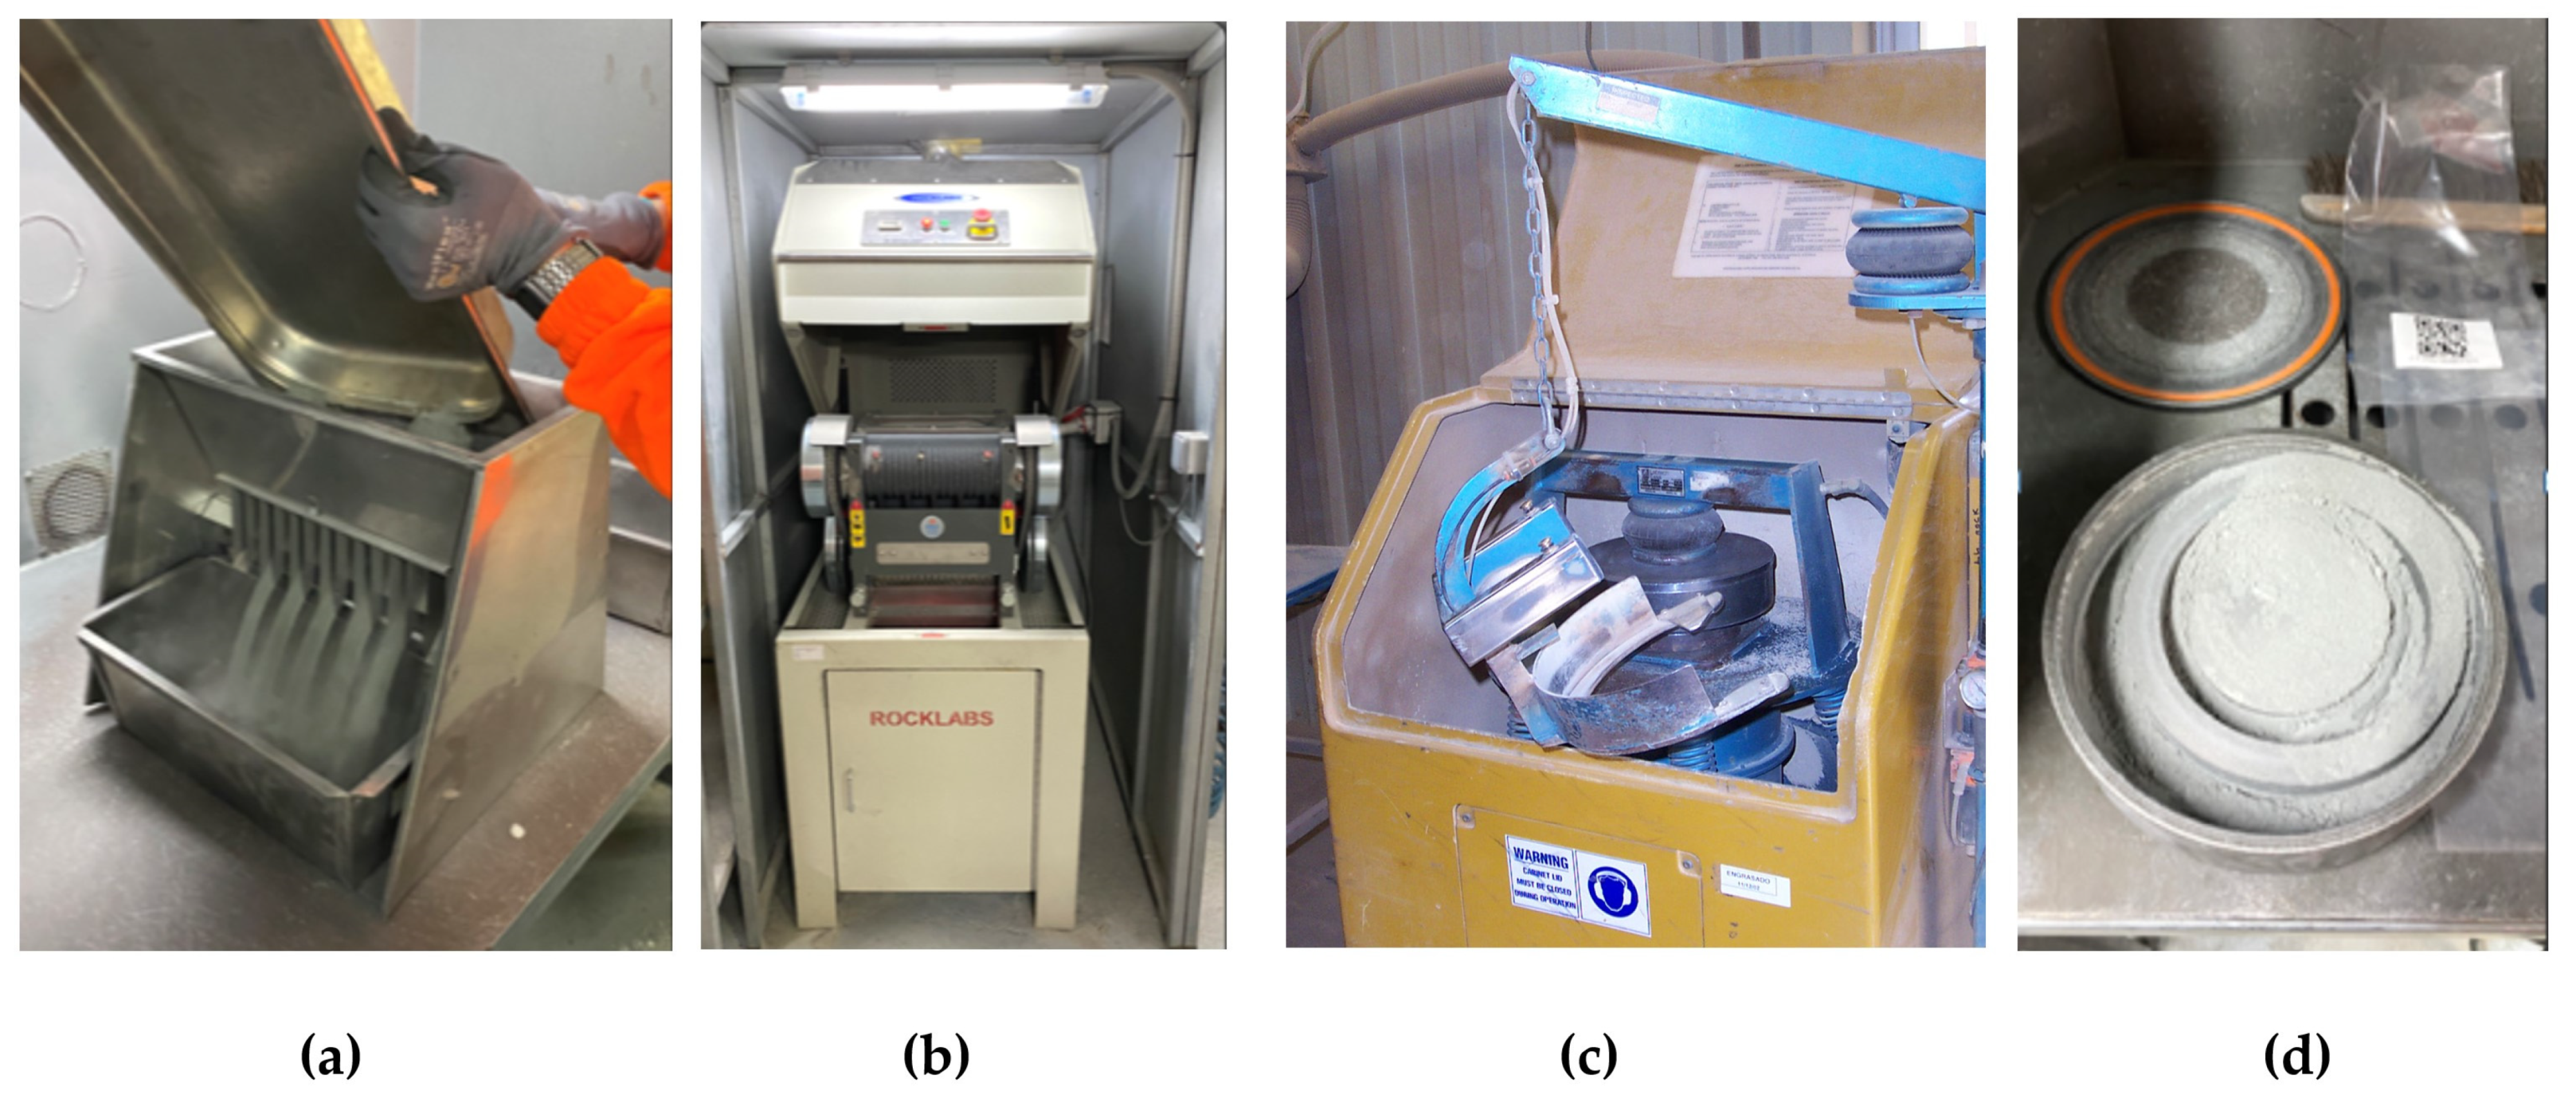
When the sample has been dried, the lab workers proceed to reduce it to 3 kg using a Jones splitter (
Figure 11a, and its weight is also recorded in the software), an operation through which the sample weight is significantly reduced. The splitter-rejected material is discarded.
Now, the particle size of the sample is reduced in the Boyd Crusher (
Figure 11b) so that it has the required particle size distribution: 80% less than 2 mm.
The final quartering is carried out with a medium-sized Jones splitter, where 250 g will be obtained. Again, the remaining amount of this quartering (750 g) is discarded.
The next step is pulverizing this 250 g sample so that in the subsequent analysis process, it is much easier and faster to put the elements present in it into solution. This operation is carried out in a pulverizer or ring mill (LM2,
Figure 11c).
The operation involves placing 250 g of the previously quartered sample in a chromed steel container of adequate volume, equipped with a cover sealed with a heat-resistant Viton O-ring, which has inside one or more rings (
Figure 11d). This mill vibration will pulverize more than 80% of the sample to a size of less than 50 ± 15 µm in 3 min. This pulverizing time, as well as the hardness of the sample, are the determining factors in achieving the desired granulometry, and this process must be optimized depending on the type of mineral to be treated.
Once this operation is carried out, the grade control samples are introduced in plastic bags adequately labeled to be sent to the laboratory for analysis.
4.3. Sample Chemical Analysis
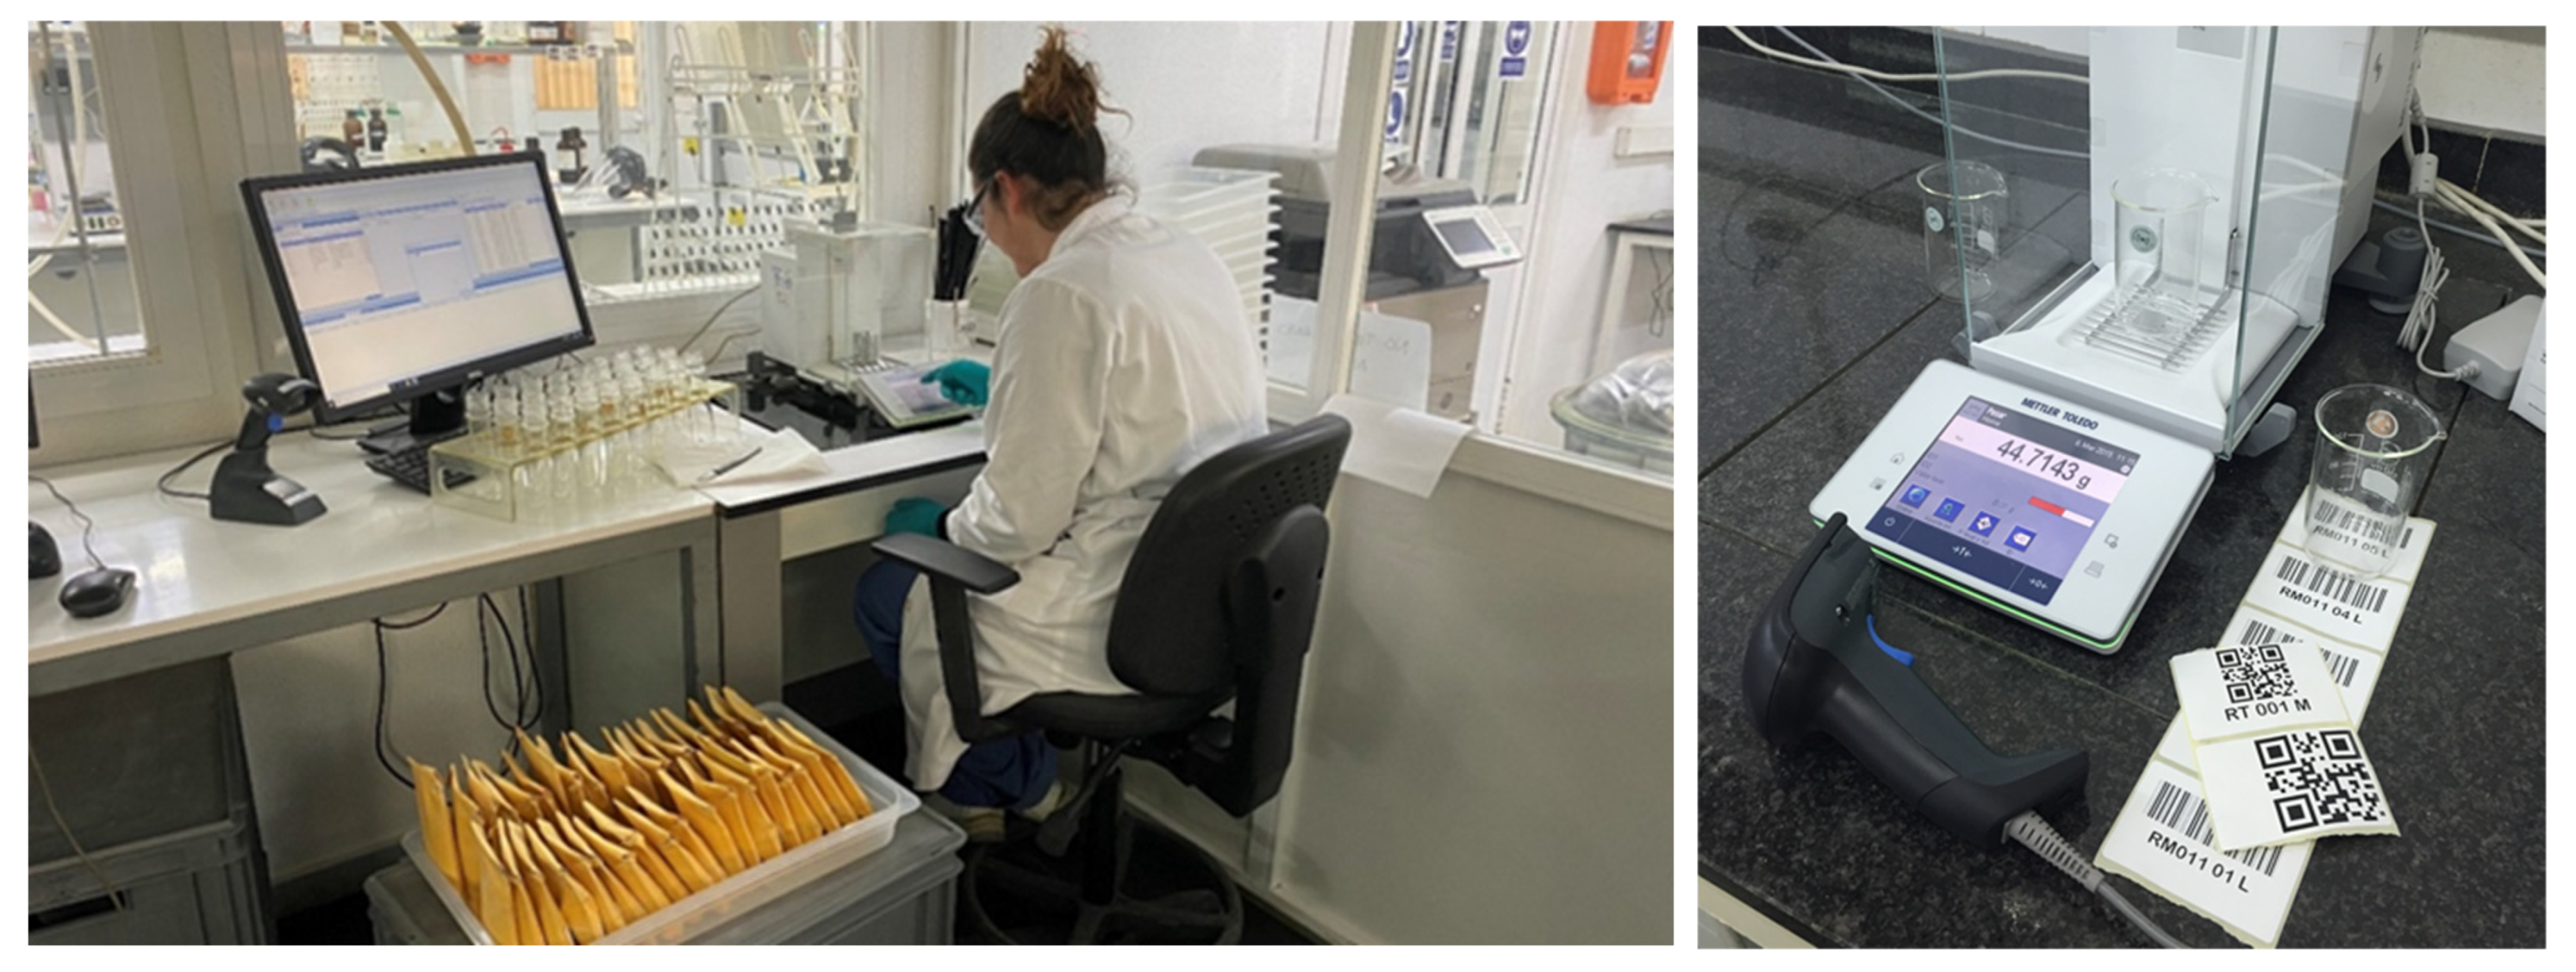
The sample is received conveniently pulverized (D80 < 50 μm) inside a plastic bag from the sample preparation plant. It is identified in the weighing area using a barcode reader. The analysis lots are 20 or 25 samples each.
The laboratory operator chooses one or two samples from each batch that are randomly duplicated. Also, a blank test solution and two certified concentration standards are included, one at the beginning and one at the end of each batch.
The process to follow involves placing the beaker on the balance sensor (
Figure 12), taking it, and weighing 1 g of the sample with a precision of ±0.01 g.
With the RFID code reader installed on the scale and following the instructions that appear on the screen, the actual weight and its identification code are assigned to the RFID chip attached to the same glass where the sample has been weighed.
With these data, a worksheet is automatically generated for any of the equipment with which the quantification of the analytes of interest present in the sample will be carried out according to the appropriate programs generated in said instruments.
A total of 15 mL of concentrated nitric acid is added to each of the beakers containing the samples. They are placed on the heating plate regulated at a temperature between 200 and 220 °C, covering them with a watch glass to avoid losses due to splashes.
It is heated to boiling point so all of the nitrogen oxides generated during the process are eliminated, evaporating to almost dryness. At this point, 10 mL of concentrated hydrochloric acid is added and heated to boiling, evaporating again to almost dryness.
Finally, 5 mL of concentrated hydrochloric acid is added, the watch glasses are removed, carefully washed with distilled water, and brought again to a gentle boil. A total of 5 mL of distilled water is added, and then the mixture is left to cool. Once the solution has cooled, it is brought to the mark in a 100 mL flask fitted with an RFID chip.
With the help of the reader, the sample code and its weight are transferred to it from the RFID tag that the beaker carried.
It is allowed to decant to finally fill the automatic sampler tubes of the ICP or AA equipment. The RFID reader will also provide us with the position of each sample in the rack of the AAS (Atomic Absorption Spectroscopy) or ICP-OES (Inductively Coupled Plasma Optical Emission Spectroscopy) automatic sampler.
The result of this entire process carried out in the laboratory is a data table in text format (ASCII) that is sent to the data server from where the Grade Control Department staff shall interpret the results.
5. Results: Data Interpretation and Block Model Interpolation
The grade control data in each borehole, once the laboratory analysis is available, give us the date in each borehole. Now is the time to divide the rock mass into ore, marginal ore, and waste, creating perimeters and polylines that can be translated to reality by topographers. In order to calculate the grade between the boreholes, a block modeling algorithm will be used.
Block models are today an essential tool when studying a deposit to calculate geological resources and mining reserves. It is based on dividing the study area below the surface into parallelepipeds (
Figure 13), each of which will be a record of a database and will have the properties that are needed for mine design, such as lithologies, densities, analysis data, geotechnical data, hydrogeological data, etc. The geology and the grade data that come from the prospection boreholes create, once the interpolation is conducted, a resource block model that will quantify the volume and weight of the ore. The block model is then fed with economic data such as metal prices, mining costs, concentrator costs, and concentrator efficiency, and once an optimization process is developed, a reserve block model is finished, which will be the base for the open pit mine design. Block model size in the prospection phase was considered at 25 m × 25 m × 25 m.
In order to develop the grade control procedure, the reserves block model (
Figure 14, left) is subdivided into a much denser mesh, with the same height as the exploitation bench, in this case 10 m, and dividing the size into X and Y to a manageable size that gives enough information to delimit the mineral zones after interpolation (
Figure 14, right). In the case of Riotinto, and taking into account the drilling mesh, blocks of size 2.5 m × 2.5 m × 10 m have been chosen.
After sampling and analysis, the interpolation process occurs to have data that identifies ore and waste. In addition to NN, IDW, and kriging, conditional [
19] simulation can be used. A possible line of research is the use of AI (artificial intelligence algorithms) in the interpolation process that allows zones to be delimited [
20].
Finally, it was decided to use an interpolation by the inverse of the distance raised to a power, using a search ellipsoid and the samples, not only of the berm in the calculation but also the previous berm in the case that the measurements of the ellipsoid encompass them. Comparisons between NN, IDW, and kriging were developed. IDW with a search ellipsoid that follows the mineralization was the most favorable method in terms of calculation time, simplicity, and accuracy.
The calculation parameters, such as the power of the inverse of the distance and the sizes of the axes of the ellipsoid, are defined through geostatistical interpretation of the results, parameters that are updated once or twice a year as more information is obtained. On average, power 3 is used, and the distances of the main axes of the ellipsoid are 6 m for the main one, 3.5 m for the secondary, and 1.5 m for the tertiary.
The situation of the ellipsoid in terms of the angles that place it in space is defined by geologists based on the position in the previous banks, its main direction, and the dip of the mineralization in each calculation zone, given that it changes depending on what area we are exploiting.
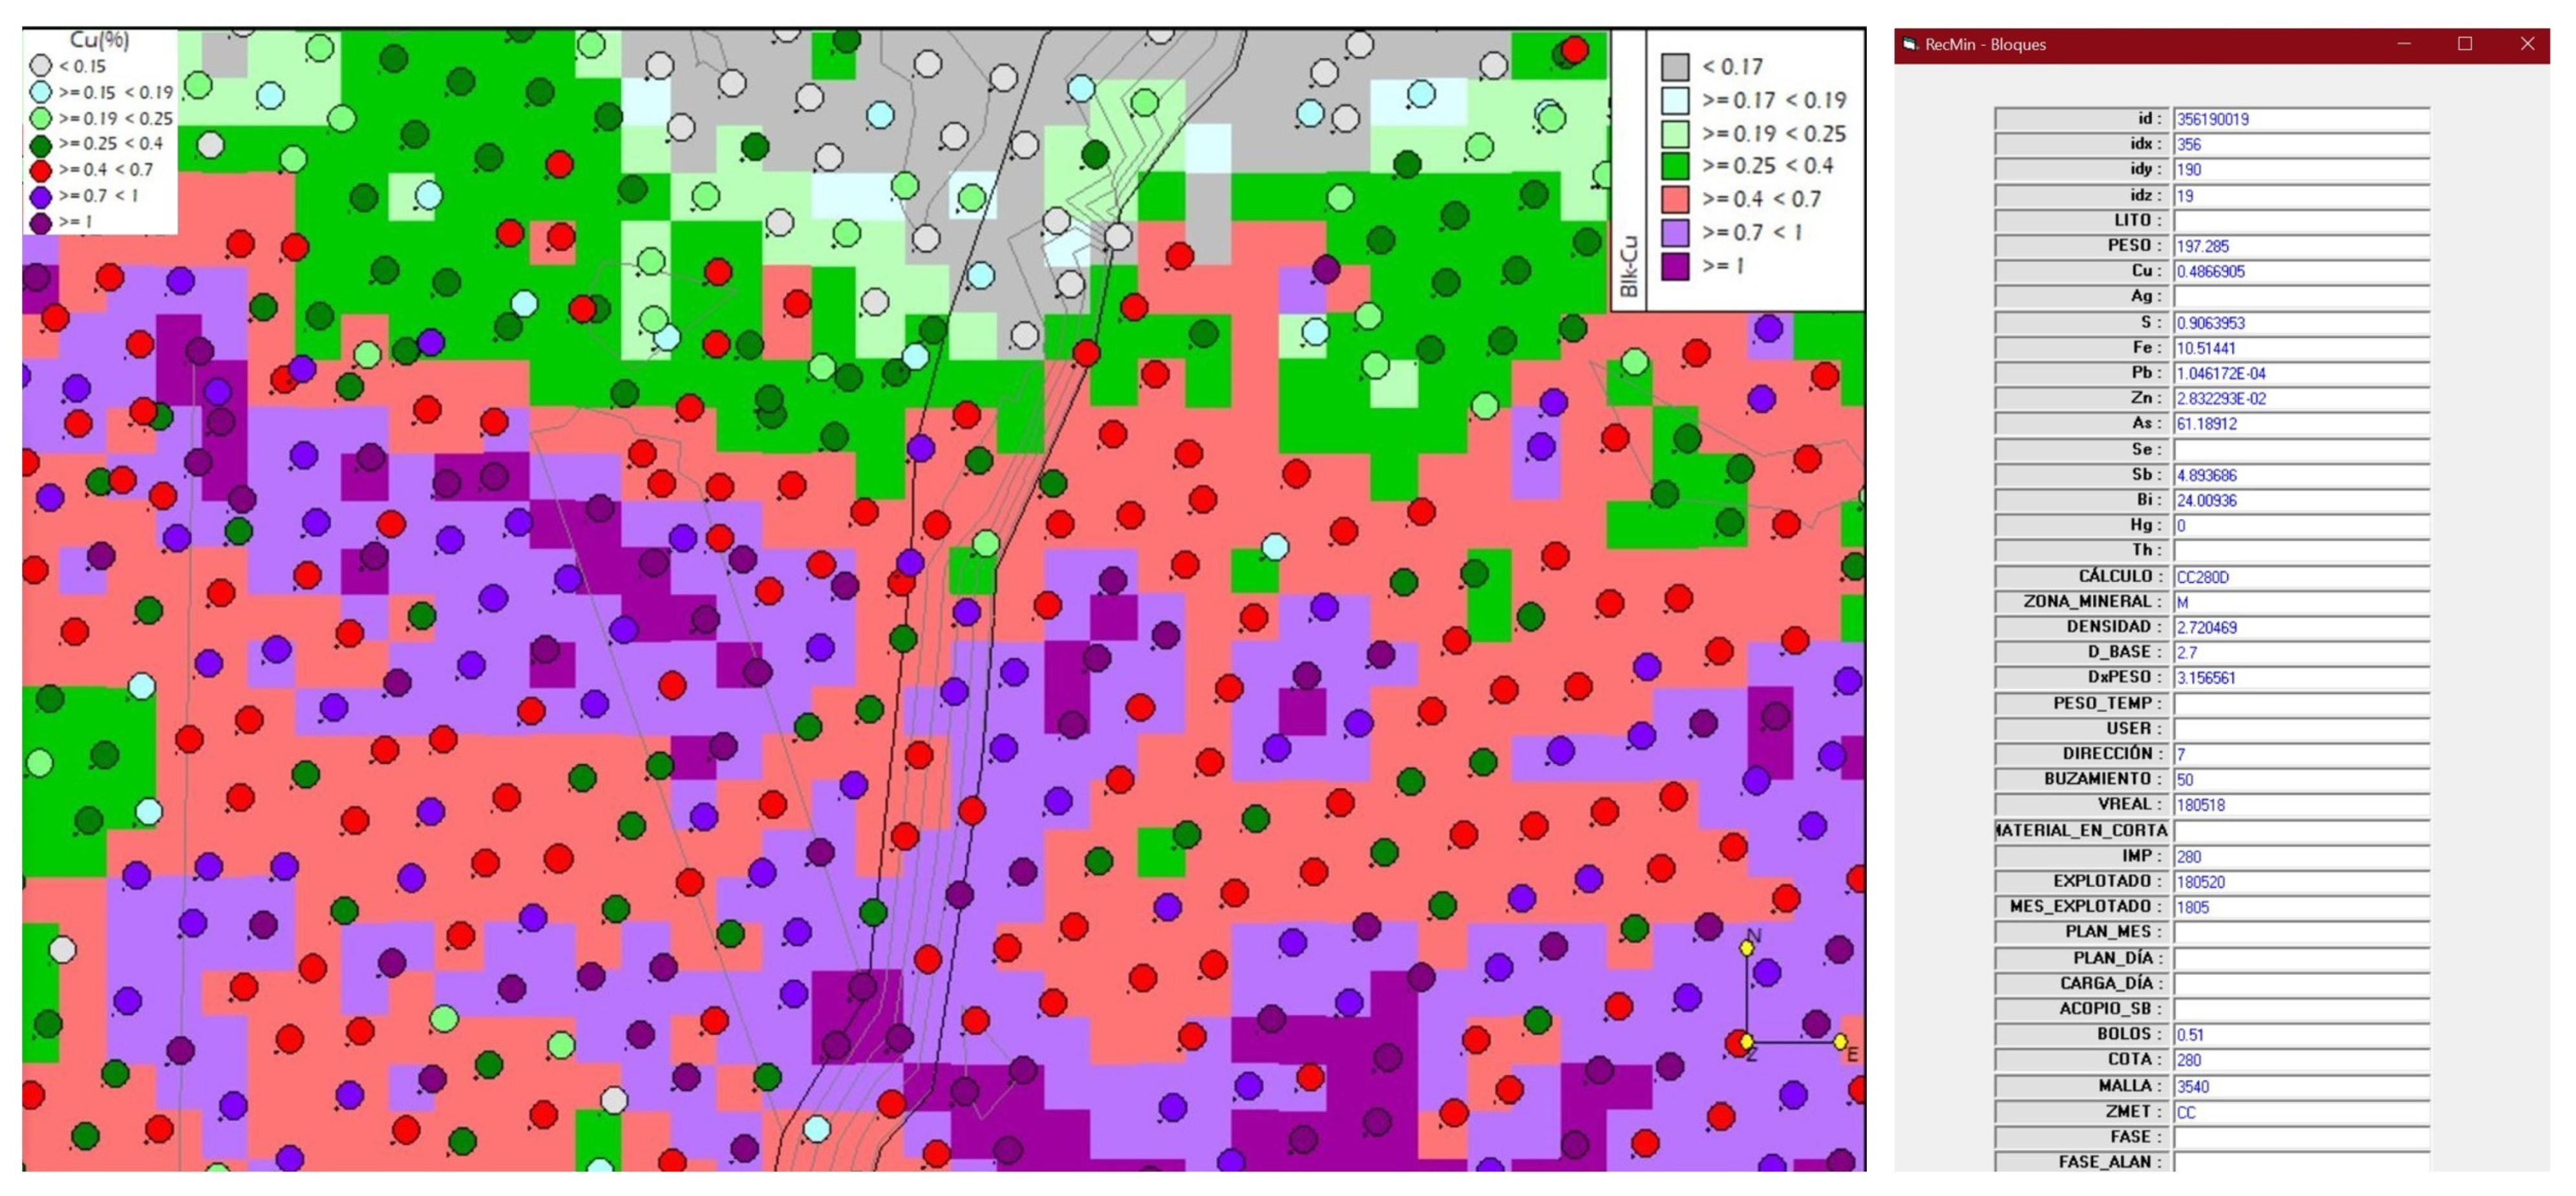
After the interpolation, we will be able to see on the screen the blocks with their grades, the drillings, the topography, and all the information that we need to define the lines that delimit the areas to be loaded as minerals, as can be seen in the figure below (
Figure 15). The blasts are separated by type; miners try to blast ore separately from waste in order to diminish dilution, and then the material is mucked at once using a backhoe loader.
The separation of the mineral from the waste is not as simple as separating the blocks according to a cut-off grade calculated based on operating costs and metal prices in the market; other factors must be taken into account, such as an operating cut-off grade, which defines the amount of marginal mineral that must be separated to be able to be treated in the plant when required. Given that the blasted material must be loaded and taken to the waste dump if they are not economical, if we consider only the cost of loading them and taking them to the plant stockpiles and the cost of treating them, the cut-off grade would be lower if the grade is between both cut-off grades, the one that includes all operating costs and the previous one, which would be what we call marginal mineral, which must be separated and stored separately.
On the other hand, normally, it is not only copper that gives us economic benefit; we must take into account other metals that can be recovered, such as Zn, for which we normally work with a fictitious law that we call equivalent copper, which would be the same as the copper grade plus the zinc grade represented in its equivalent as if it were copper, taking into account market prices, recoveries in the plant, and the value paid in the concentrates sold.
There are also some elements that, based on certain concentrations in flotation concentrates, generate penalties on sales and have a negative impact, such as arsenic and antimony; prior knowledge of these elements in the grade control phase allows us to prepare stocks with different concentrations of these elements that allow us the ideal mix in advance so that they do not generate penalties in sales. In some cases, a negative value has to be added to the equivalent copper number in relation to the laws of some of these elements.
Both the additional metals that add value, as well as the impurities or poisons that decrease it, can be formulated to calculate an equivalent grade in each block so that the NSR, net smelter return [
21], can be calculated. This equivalent law is the one that will be used to carry out the optimization process and define reserves in polymetallic deposits, as indicated by Osanloo and Ataei [
22].
It may also happen that the hardness of the mineral that we are defining in grade control forces us to separate it into different stockpiles regardless of its grade since they can generate grinding problems in the plant; a correct mixture of different hardnesses can improve production.
There are also limitations regarding the minimum size of an area of mineral to be loaded. SMU, selective mining unit, is defined as the minimum block size through which we can differentiate ore from waste. Chiquini and Deutch [
23] tell us that it will depend on the size of the loading tool, the geological limits of the ore, and a certain practical sense of this value. We cannot define small areas because depending on the size of the bucket of the machine that is going to load the mineral, the direction of loading, and the experience of previous areas, the geologist, depending on the information he has on the screen, can adjust these limits to minimums that reduce the dilutions with the waste that we have around us, but that in turn facilitate loading tasks in acceptable conditions.
Finally, if the variograms of the prospection samples are compared with the variograms of the grade control data, similar results are obtained in terms of range and gamma values.
Summarizing all the above, the grade control geologist work, who is the individual in charge of defining the different types of mineral and their destination in the stockpiles, is not only limited to managing the grades but must also take into account a series of circumstances such as those mentioned in the previous paragraphs, which makes experience an important factor in the grade definition lines position.
6. Discussion: Loading Areas Definition and Destination Allocation
6.1. Loading Areas Definition and Destination Allocation
After the definition of the different types of minerals and their destination in the stockpiles, as explained before, the data will be exported to the topographic equipment to mark them on the field and distribute the information among the operators and technicians who must work in loading and transportation tasks.
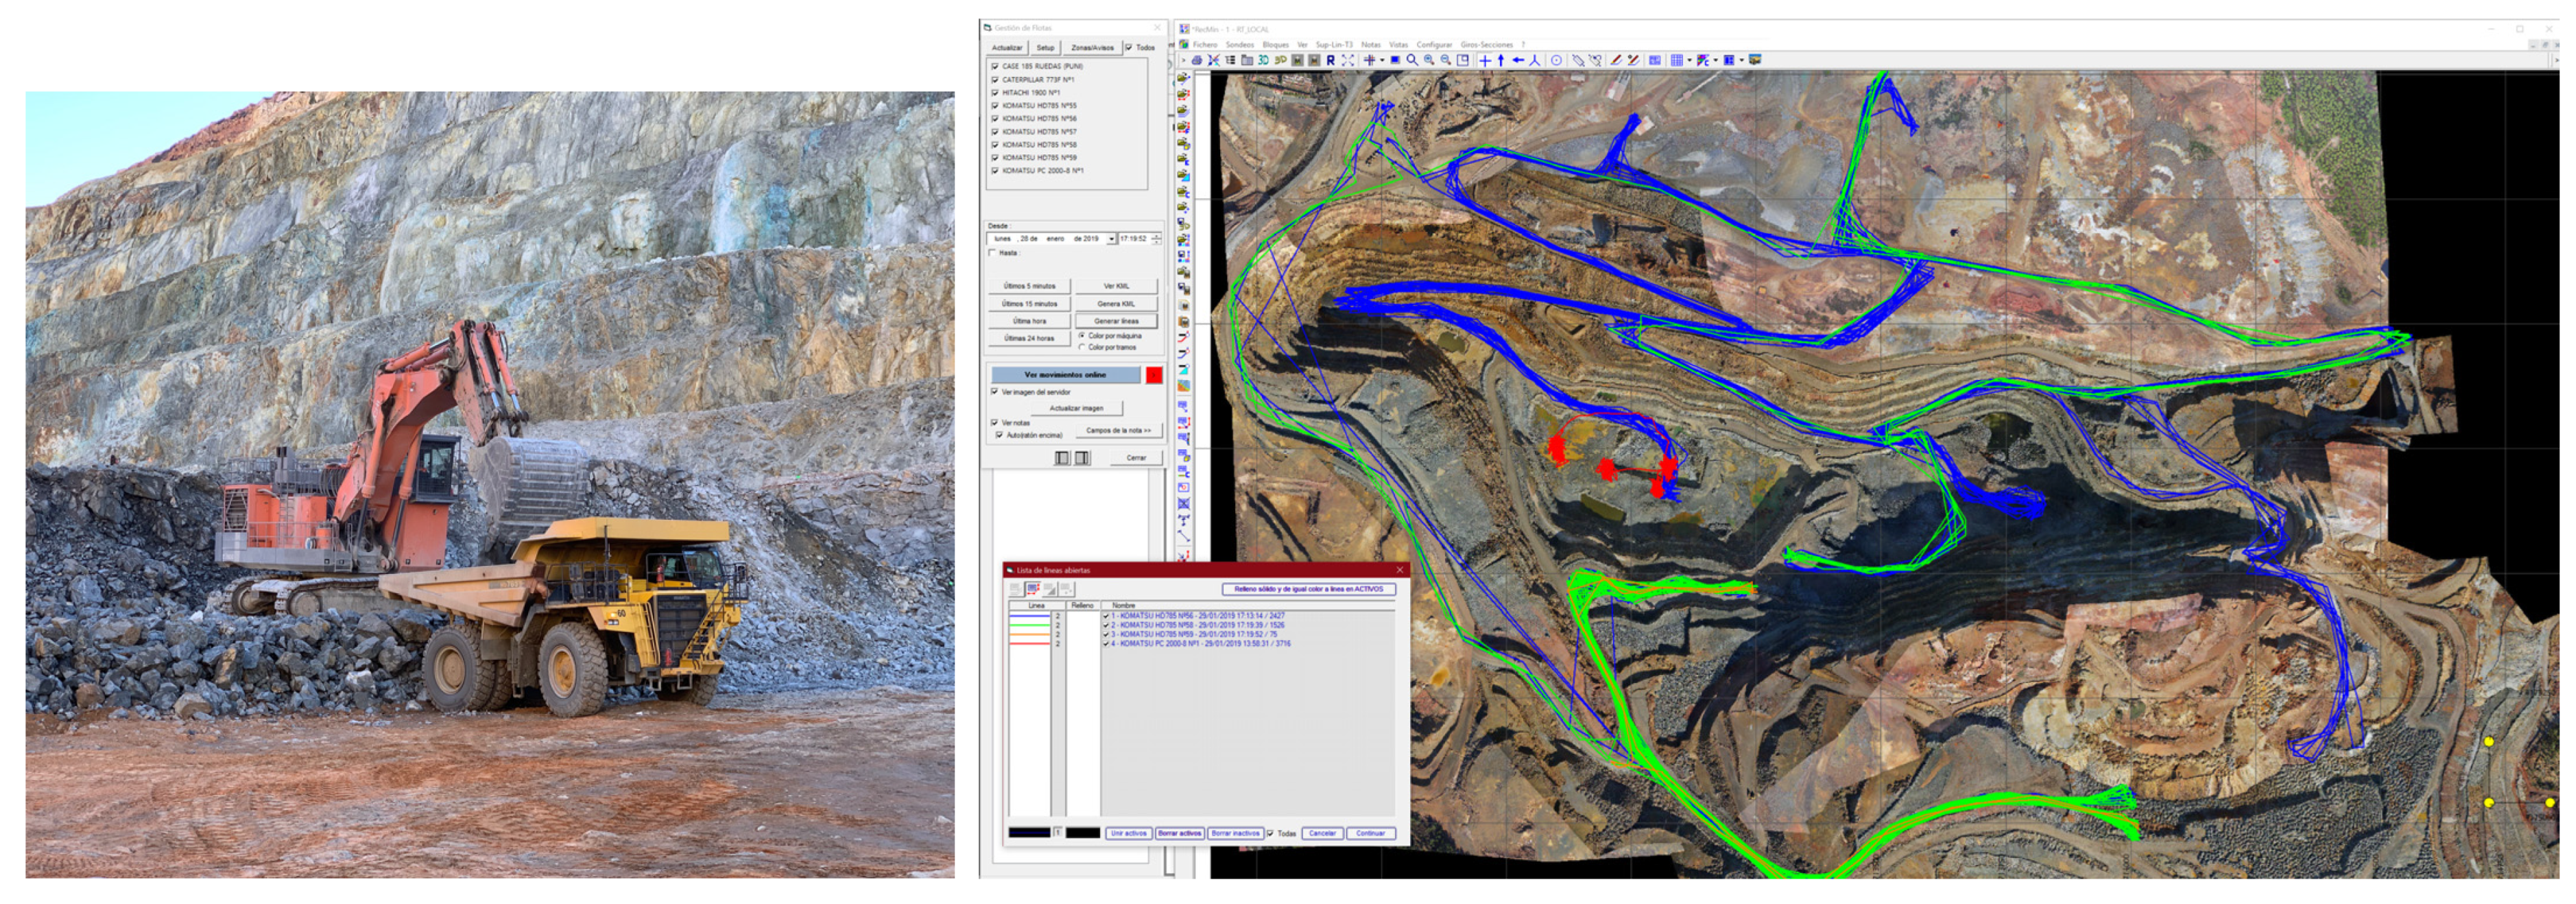
An important part of grade control is also that mineral loading and unloading operations are carried out as planned. At Riotinto, the earthmoving equipment has installed a Fleet Management System (MINERTRACK, see
Figure 16 below) that allows online and offline tracking in real time of equipment movements and also warning systems in which, intelligently, they are capable of detecting at the moment it occurs if, e.g., a dumper is taking the mineral to the wrong place.
Control and monitoring of the height of the platform in operation, using the levels placed for this purpose, must be followed by the loaders, either with automatic and/or acoustic load level systems or manually.
The following figure (
Figure 17) shows a typical example of defining mineral zones for loading and marking during the operation. The explosive blast should try not to move the material, just create enough fractures in it to ease the work of the loading excavator, as well as allow the input of the material through the entrance of the main crusher at the concentration plant. The areas are marked with topographical auxiliary material, both marking sprays or tapes.
6.2. Scheduling
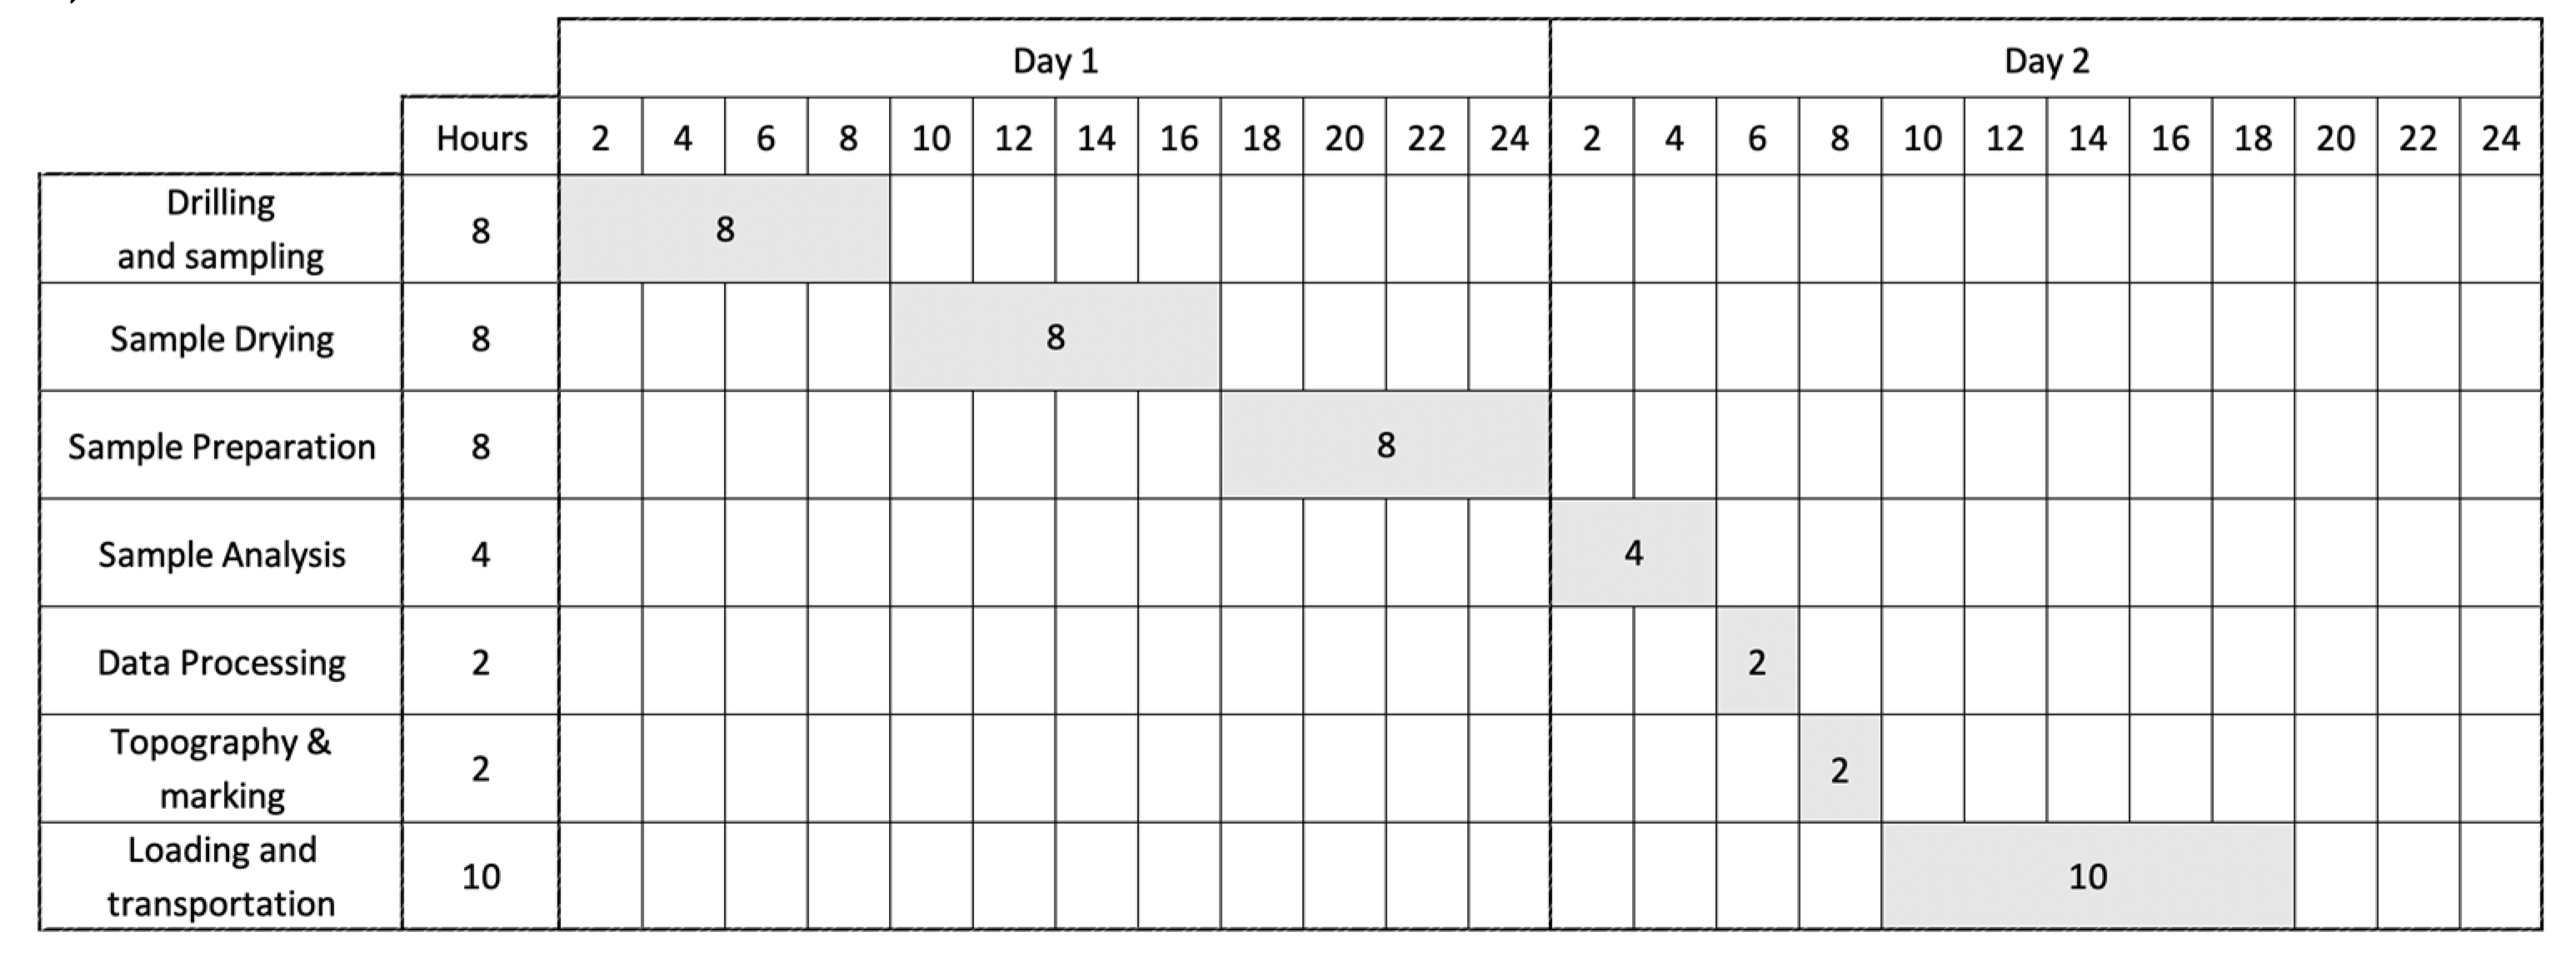
It is important to establish the total work cycle that measures the time necessary from the start of drilling until the loading areas have been delimited in the exploitation area. This time is very important since it will be the time we will have. You have to have an area of the exploitation waiting before loading and transport can begin. The typical turnaround time for a grade control model in an open pit is between 24 and 48 h, as Rossi states [
24].
During the production of a mine, the time factor is essential. In open pit operations, blasting takes place every day, so there is not much time to carry out analyses and decide what is ore and what is sterile. In underground methods, you can have between fifteen and thirty minutes of time for sampling the material in gallery and stope faces [
25], which must, therefore, be fast and efficient.
Depending on whether the work cycle is longer or shorter, we will need to have more or fewer exploitation areas that will allow us to provide the planned production. In operations with not very large work areas, it could be a major problem not to be able to load until all the information is available. Hence, it must be taken into account in planning.
The preparation of the sample was established in 16 h, 8 h on average for drying the mineral; if the sample is completely dry, if it is wet, it can take up to 24 h. For sample preparation, grinding, and quartering, just 8 h are considered.
The processing of the samples in the laboratory was established in 4 h of work: 2 h for reception, weighing, and acid digestion, and between 1.5 and 2 h for reading.
To process the data and define the mineral zones, a computer system was prepared, based on the RecMin program, which would allow processing of all the information, topographical of the location of the drillings, lithological interpretation of the debris, and analysis of the samples, which would allow the information to be interpreted and interpolated and the mineral zones defined in two hours.
Ore marking by the surveying equipment was established in two hours as well.
The total hours planned in each cycle are summarized in the following schedule (
Figure 18):
At an average daily production of 46,500 m3, four loading equipment are needed with a capacity of 11,600 m3, which represents four work areas of 1160 m2. Taking into account that the average density is 2.80 t/m3, the daily load is 130,200 t, of which 45,570 t would be typically ore.
Each day of loading is equivalent to about 260 holes drilled, taking into account that blasts occur 5 days a week, but loading is conducted 7 days a week. A total of 328 boreholes have to be drilled per day, having a total of 120,000 boreholes per year.
Then, weekly ore production is approximately 320,000 t.
6.3. Information Management
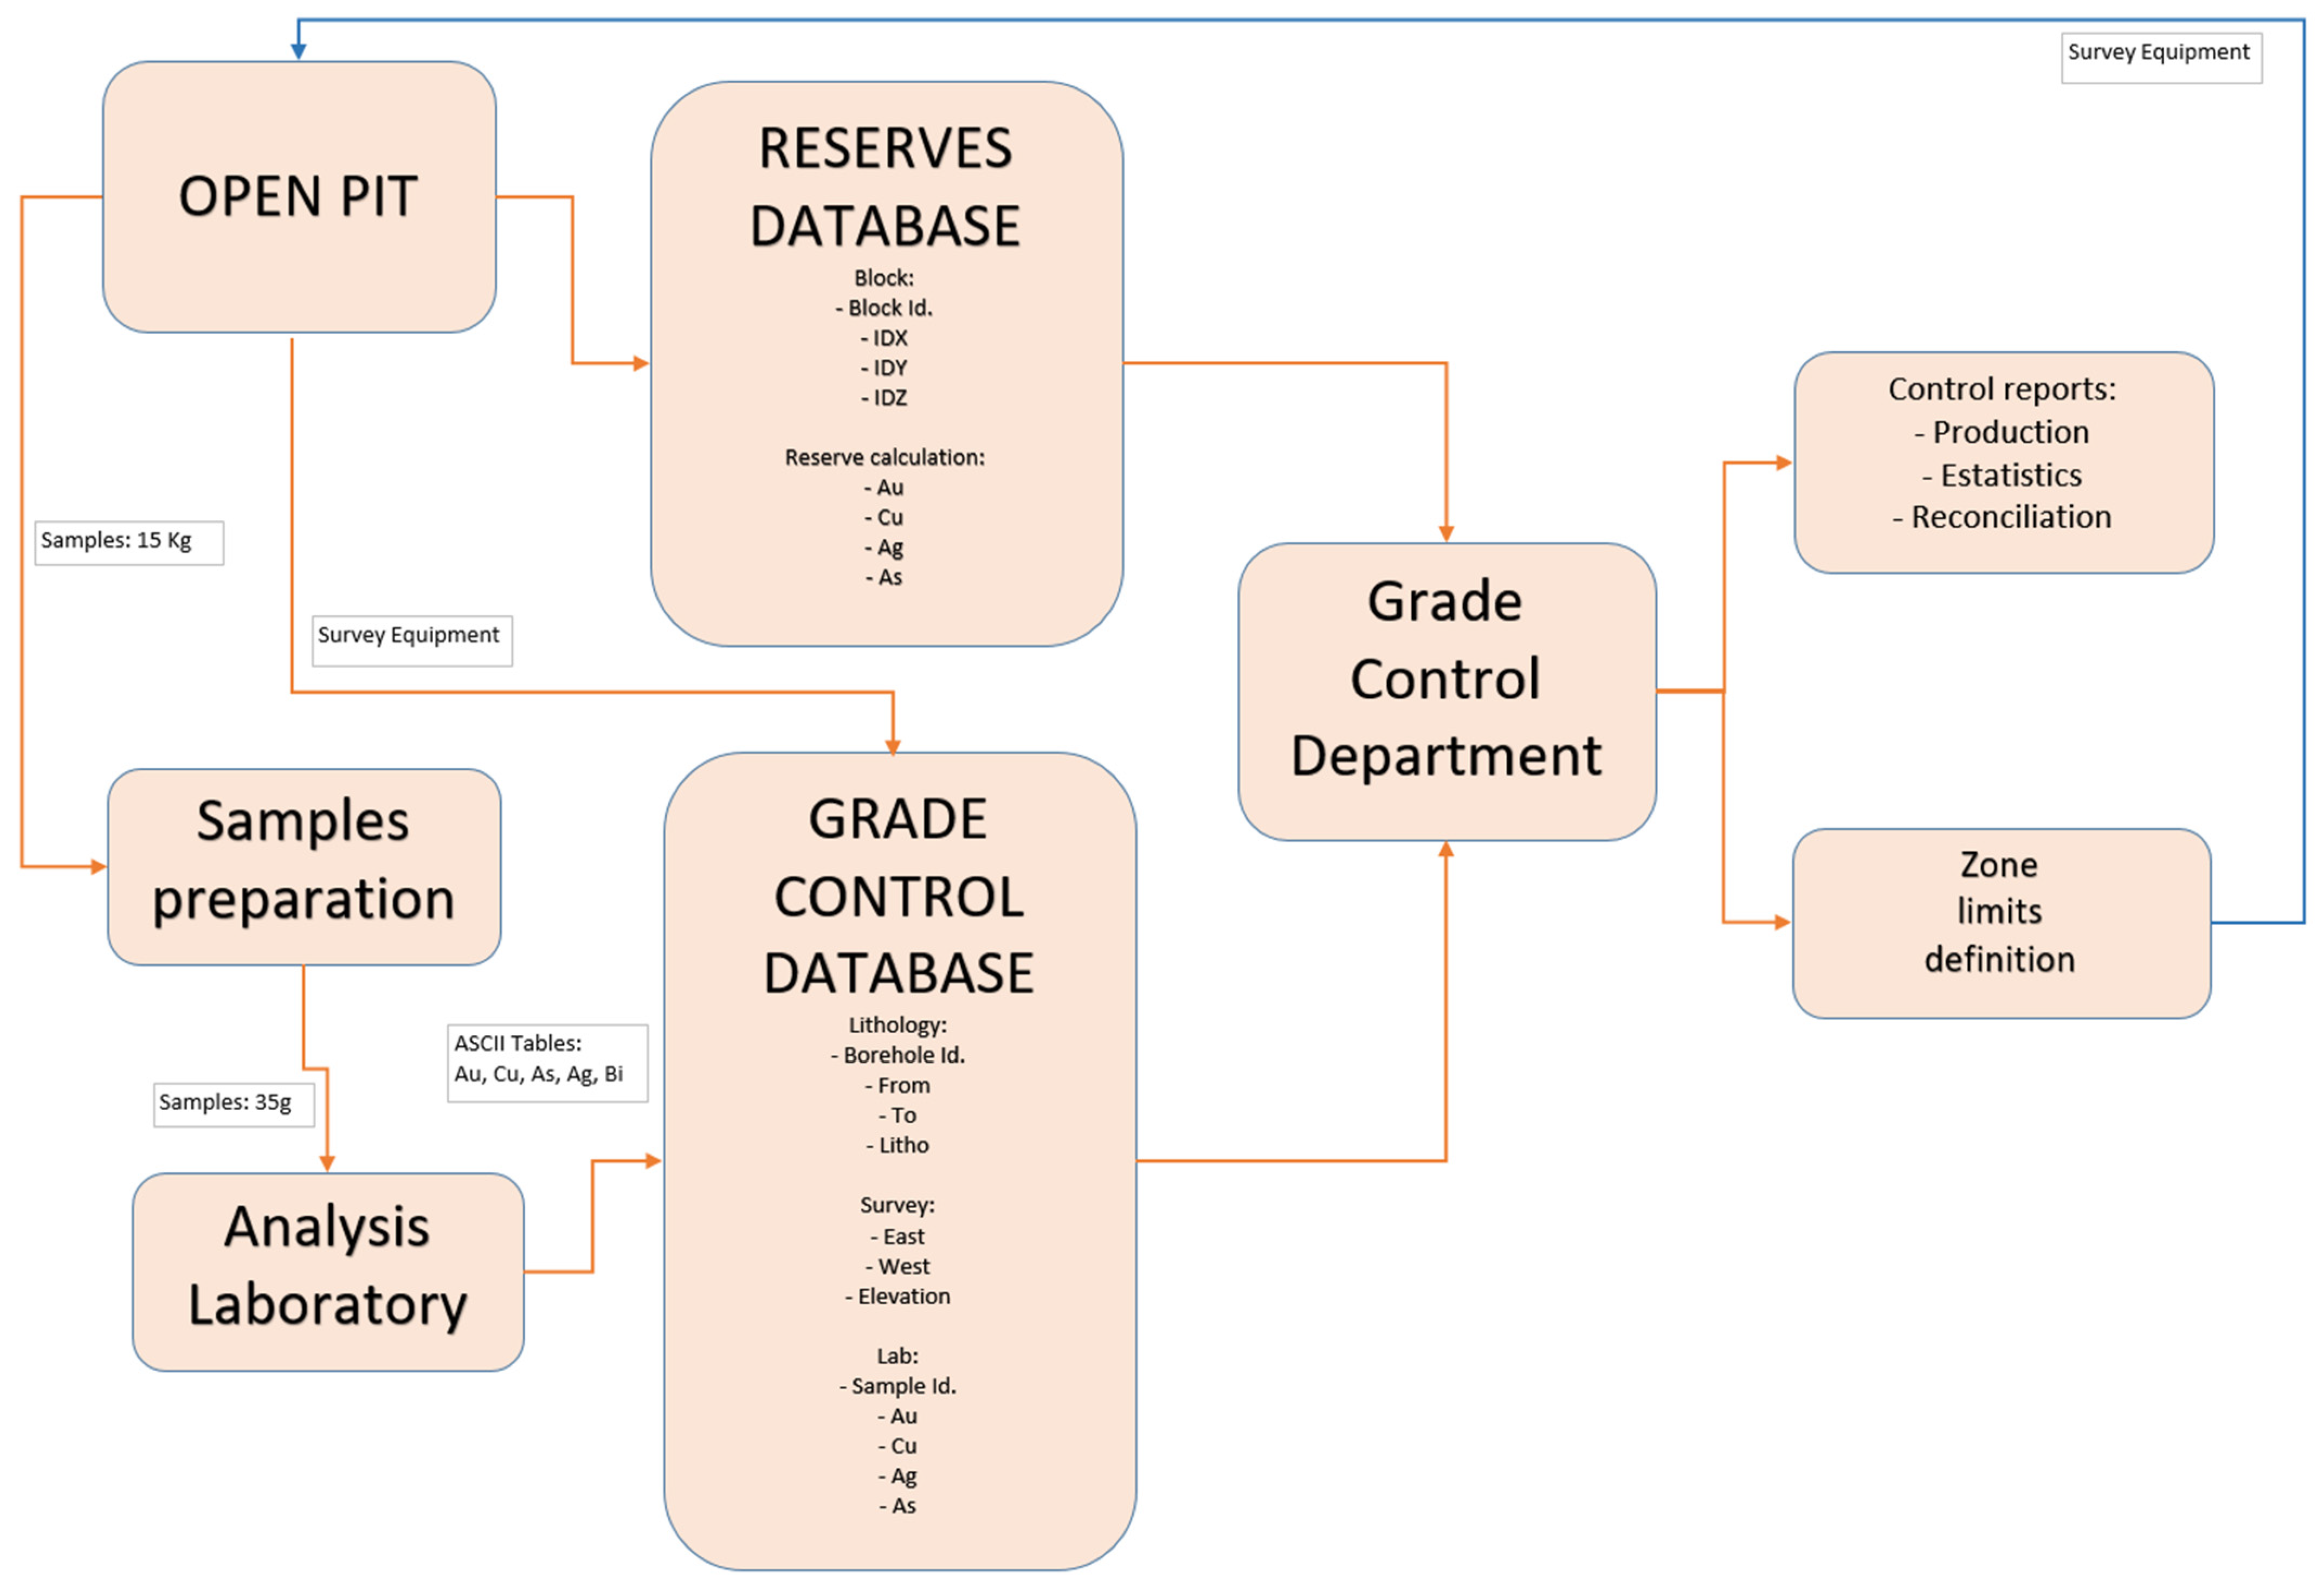
Handling about 200 samples daily is equivalent to transporting over 3000 kg of samples that must be dried, prepared, and analyzed. This means that large amounts of information are generated daily from borehole codes, sample codes, borehole coordinates, lithological information for each sample, and analysis data for various elements of each sample. In total, we can summarize that 3200 data must be processed daily, apart from the information that is generated later by processing that data in terms of interpolation with the block model, marking lines of the limits of the economic zones, etc.
In the following diagram (
Figure 19), we show the type of information that is generated and in what places.
The “OPEN PIT” generates the information that will feed the block models. First, before the mining operation takes place, the prospection borehole information is used to create a model that shows the reserves of the mine: the “RESERVES DATABASE,” stored in mdb files created by Recmin software v. 7.22. This database stores in its tables the identification of the block (idx, idy, idz) as well as the grade calculation data.
The survey team generates an ASCII table of the locations of the boreholes (East, West, Elevation) executed by the drill rigs in order to blast the rock mass. This table is included in the “GRADE CONTROL DATABASE,” which is again an mdb file inside Recmin software. The laboratory personnel include the grade analysis results inside this database.
The grade control department personnel check this information and proceed, on a daily basis, to create zone limit definitions that will be sent to the survey personnel to recreate these limits in the field using wooden stakes and marking tape (
Figure 17, center). On a monthly basis, the grade control departments also issue control reports comparing the tonnage and average grade of the grade control database with the reserves database as well as with the output of the concentration plant (the so-called “reconciliation”).
In order to manage all this information quickly and with minimal error, a system of coding, reading, and generating information with barcodes and QR codes was designed, all linked to the RecMin software that allows all departments to be coordinated. All workplaces are connected to a wired local network, and the personnel at the open pit have a wireless network in order to centralize all the information in a single database at the server. The use of QR codes has tried to eliminate having to type the codes again in each department, since, apart from the loss of time, it is very easy to make a mistake in one.
The coding was designed in such a way that the generated reports are placed in the corresponding place in the database automatically.
7. Conclusions and Future Research
If there is no grade control system in metallic mining, it entails a significant reduction in the grade at the plant head by increasing dilution.
The comparisons between the exploration block model and the grade control model after interpolating with the analysis of the blasting drillings show that this dilution can become very important since, with the block model of exploration, we can know the exploitable areas; their real situation can vary by many meters.
Perhaps the most important conclusion that can be drawn from all the tests and comparisons carried out is that everything spent on grade control in deposits of this type will have its economic benefit by reducing the dilution of the mineral that we send to the plant. Thus, the economic cost involved in expanding the samples and control would not be the problem; the main problem will be in the production cycle. The more control, surveys, etc., the more we will increase the time necessary to carry out the control tasks of laws, processing data, etc., which means that we will reduce the tons we can produce.
The automation of processes, therefore, acquires great importance; in short, the processing of information, the ability to unite machines in such a way that all the information generated is processed by computer programs to which we have introduced the logic of the process.
This work will be continued by future research that will include, first, the enhancement of the database systems in order to use efficiently the massive loads of data generated; secondly, the use of conditional simulation to make the interpolation over the benches; thirdly, a study of the different ways on how to develop the delicate process of reconciliation, using the huge amount of data available; and finally, the use of automatic algorithms to draw the lines that separate ore from waste, which could be based on image recognition software, artificial intelligence, or big data algorithms.

