Article

Mineralogical Characteristics and Genesis of Trapiche-like Sapphire in Changle, Eastern North China Craton

1
School of Gemmology, China University of Geosciences, Beijing 100083, China
2
Frontiers Science Center for Deep-Time Digital Earth, State Key Laboratory of Geological Processes and Mineral Resources, China University of Geosciences, Beijing 100083, China
3
School of Earth Sciences, China University of Geosciences, Beijing 100083, China
4
Shandong Institute of Geological Sciences, Jinan 250013, China
5
Shandong Bureau of China Metallurgical Geology Bureau, Jinan 250101, China
*
Authors to whom correspondence should be addressed.
Minerals 2024, 14(4), 364; https://doi.org/10.3390/min14040364
Submission received: 20 February 2024 / Revised: 18 March 2024 / Accepted: 27 March 2024 / Published: 29 March 2024
(This article belongs to the Section Mineral Deposits)

Abstract

:
“Trapiche-like” texture is distinct from “trapiche” texture as typically observed in emeralds, amethysts, and aquamarines. It is also occasionally encountered in sapphires from Changle, eastern North China Craton. The advent of the trapiche-like texture has enhanced the ornamental value of sapphire, although its origin is still unclear. In this study, techniques, such as Fourier transform infrared (FTIR) spectroscopy, ultraviolet–visible (UV-Vis) spectroscopy, Raman spectroscopy, electron probe microanalysis (EPMA), and laser ablation inductively coupled plasma mass spectrometry (LA-ICP-MS), have been applied to test the spectroscopic data of the cores, arms, and blue sectors of trapiche-like sapphires from Changle and explore the mineralogical characteristics of different domains. The main component of the core, arms, and blue sectors of trapiche-like sapphire is corundum (Al2O3), with trace elements including Fe, Ti, Mg, Cr, V, Ga, etc. From arms to cores to sectors, trace elements show a trend of increasing and then decreasing. Nb and Ta elements are more enriched in the arms than in the sectors, indicating the existence of rutile. With changes in physicochemical conditions during magma evolution, rutile melted, and related voids were filled with glassy inclusions, which formed the arms of trapiche-like sapphires. Field observations of primary deposits, as well as petrological and geochemical analyses, reveal that the trapiche-like sapphire of Changle belongs to magmatic sapphire.

Graphical Abstract

1. Introduction

Trapiche texture is a unique occurrence in minerals. It emerges as a pattern formed of fixed opaque stars in a transparent matrix, with the arms of six rays extending from the core to the margins of the crystal [1]. The trapiche phenomenon was first discovered in Colombian emeralds, taking its name from the Spanish word “wheel”, which vividly represents the appearance of this gemstone. It appears as a hexagonal core produced perpendicular to the c axis, six arms, and identical sectors separated by arms. The trapiche phenomenon tends to occur in highly symmetrical crystals such as garnet in isometric systems, emerald in hexagonal systems, and tourmaline in trigonal systems. It is occasionally observed in orthorhombic system minerals such as chiastolite. Similar textures have developed in olivine with lower symmetry levels. Natural sapphires also have white cloud-shaped trapiche inclusions that are flat and parallel to each other [2].
Two types of minerals can be distinguished from one another in their “Trapiche” patterns, namely “trapiche” and “trapiche-like”. The key to comprehending the link between the above terms is understanding the relationship between arm and color division. Trapiche-like mineral arms grow along the crystal axis from the crystal core to the prismatic surface. The polygonal rays of trapiche minerals are scattered around the crystal edges, connecting the corners of the polygonal growth region from the center of the crystal. Ingredients of trapiche minerals include quartz from Inner Mongolia [3], muscovite from Japan [4], and rhodochrosite from Argentina’s Catamarca Province [5]. As a representative, the trapiche structure is manifested as a sharp boundary of the inclusion dividing the equivalent sector [6], with the arm perpendicular to the prism edge. The trapiche-like structure is generated by the dispersion of chromogenic factors or the alternating appearance of inclusions in crystal [7], with arms perpendicular to the prism surface. Some instances include Pakistani emerald [1], Brazilian amethyst [8], and Namibian aquamarine [9].
Corundum is a mineral derived from the mantle that acts as a “lithoprobe” and “window” for exploring deep Earth. Its chemical composition is Al2O3. The formation of corundum is closely related to the evolution of basalt magma, the material composition of the lower crust and mantle [10], providing possibilities for investigating the evolution process of the deep Earth [11]. Corundum is colorless in its pure form, but with the addition of chromogenic ions, it may display various hues. Ruby is a gem-quality corundum that has been tinted red by Cr, whereas sapphire is colored by other ions.
The sole location where trapiche sapphires are produced is Mogok, Myanmar, and trapiche structure is more prevalent in rubies than sapphires. Trapiche-like sapphires are commonly found in countries with alkaline basalt, such as Australia, Vietnam, and Iran. The majority of sapphires harvested in Mogok are either gray in hue or have a strong blue–black saturation. Only high-quality ones exhibit a snow-white body color and bright blue arms [12]. LA-ICP-MS was used to analyze the trace elements of arms, cores, and the blue sectors between the arms of trapiche sapphires from Tasmania, Australia [13]. It was found that the concentration of most elements (Mg, V, Fe, Zr, Nb, and Ta) increased sequentially from sectors to arms to the core, indicating the presence of micro-inclusions. Color bands and crystal growth explain the variations in zones. According to preliminary research, the arms of Changle trapiche-like sapphires are made up of tiny fissures and thin-film-shaped fluid inclusions that are generally parallel to the elongation direction of sapphire. Most of the fluid inclusions are two-phase gas–liquid inclusions, while some are three-phase gas–liquid–solid inclusions [14]. The aforementioned work provided a good foundation for the findings presented in this article. Overall, research on the geological and geochemical properties of Changle trapiche-like sapphires is still not well documented, which limits our understanding of their formation process, as well as their development and exploitation. Thus, the mineralogical characters and formation mechanism of Changle trapiche-like sapphires require further investigation.
Based on petrographic observations, this study employs techniques such as FTIR spectroscopy, UV-Vis spectroscopy, Raman spectroscopy, EPMA, and LA-ICP-MS to investigate the mineralogical properties of Changle trapiche-like sapphires, which intend to reveal its formation mechanism and its formation process. This article provides new insights into the metallogenic hypothesis of trapiche-like sapphires in crust–mantle interactions, laying the groundwork for future research.

2. Regional Geological Setting

The global distribution of corundum deposits is tightly linked to geodynamic events such as plate collisions and subduction. The majority of sapphire deposits exist along intraplate rifts and extensional continental borders [15]. Chinese corundum deposits are located in the Circum-Pacific tectonic zone in eastern China. They primarily occur in the South China Sea Basin, fault damage zones along the southeastern continental margin of China, and the Cenozoic Rift Valleys in northern and northeastern China and their surrounding areas [16]. Corundum crystals are typically carried by Cenozoic basalts.
The Changle volcanic area in Shandong Province is located in the southeast of the North China Craton, on the west edge of the Tanlu Fault Zone [17,18]. Cenozoic volcanic rocks are primarily located along the fault (Figure 1a). During the Cenozoic period, the Pacific Plate squeezed China’s eastern block, and fault activity in the Tanlu Fault Zone stretched deep into the upper mantle [19], producing a dramatic fall in pressure surrounding the mantle and decompression melting. Under local straining circumstances, basaltic magma brought unmelted mantle components upwelling and overflowing, resulting in a vast region of Miocene basalt of the Niushan Formation. Volcanic activity eventually decreased and the Shanwang Formation was deposited in a tiny lake basin between mountains above the Niushan Formation. In the Upper Miocene, basaltic magma spilled again, resulting in the basalt of the Yaoshan Formation [20].
Basalt in the area is mostly exposed in Niushan and Yaoshan in Linqu County, as well as Beiyan Town and Qiaoguan Town in Changle County, and Daliushu Town in Weicheng District (Figure 1b). K–Ar dating determined that volcanic activity mainly occurred during the Niushan Period (21.0 ± 2.5 Ma), Shanwang Period (18-17 Ma), and Yaoshan Period (17.3 ± 1.5 Ma) [21]. A large amount of corundum is present in the Niushan and Yaoshan Formations. The basalt of the Niushan Formation is widely distributed, and the upper part is covered by the slight angular unconformity with the Yaoshan Formation. The lithology of the Niushan Formation is dominated by dense block-like or vesiculate olivine basalt, which is layered with gray–green silty clay and loose gravel layers. The Yaoshan Formation, on a smaller scale, is made up of alkaline to normal olivine basalt [22]. Corundum megacrysts are only irregularly and intermittently dispersed in the top section of the Yaoshan Formation, mostly concentrated in the lens-like thin alkaline basalt containing an enormous amount of mantle xenoliths. The distribution of corundum and peridotite is closely related, and layers containing sapphire/corundum typically include mantle peridotite xenoliths and mineral megacrysts, while basalt levels lacking xenoliths do not contain corundum. The phenomenon is indicative of the fast eruption features of host basalt [23]. Corundum secondary deposits exist in ancient riverbeds in Fangshan and its surrounding areas [24].
Figure 1. (a) Location of Changle in the North China Craton [25]. (b) Geological map of sample locations for the Fangshan area in Changle, Shandong [26].
Minerals 14 00364 g001
Basalt only outcrops well within a few tens of meters from the muntaintop, and the middle and lower parts of the mountain slope are mostly covered by the Quaternary sediments (Figure 2a). Gray–black basalt develops beneath the Quaternary weathering layer near the top of Fangshan Mountain, with well-developed and oriented pores ranging in size from 0.5 cm to 3 cm. The fillings in the pores have been leached (Figure 2b). The interlayering of porous basalt and dense basalt is a consequence of replacing the early magma layer during the later eruption of magma flow, exhibiting multiple periods of magma eruption [27].
Primary sapphires are located at a distance of 30 m from the mountaintop. The Fangshan gray–black sapphire-bearing basalt has developed a porphyritic texture and massive structure, with square and hexagonal columnar joints (Figure 2c). Irregular horizontal joints are developed. At the bottom of the basalt sequence, the volume of enclaves is rather substantial, with many megacrystals and mantle-derived xenoliths. Megacrystals are mainly composed of olivine, pyroxene, corundum, spinel, titanium magnetite (Figure 2d,e,g), etc., with a particle size of 0.5~4 cm. The xenoliths include peridotite (Figure 2f) and pyroxenite, with a particle size of 1~9 cm. There are visible traces of xenolith detachment on the rock wall. Olivine is mostly yellow–green in hue, with strong iddingsite alteration. Pyroxenite is darker in color, appearing dark green. Corundum is hosted in basalt and presents as a rim-rounded, barrel-columnar crystal with distinct cracks (Figure 2h). It has a clear boundary with basalt and a black spinel corona in the middle of the two, demonstrating the imbalance between corundum and the basaltic magma that transported it, implying that corundum is a deep-source xenocryst.

3. Materials and Methods

The samples were collected from villagers near the sapphire deposits. Six samples are all trapiche-like sapphires, with white “arms” developing around the core (Figure 3). Various sections of the samples were distinguished by visual observation. Detailed inspection of the raw stone reveals subtle changes in different zones. Further polishing made the phenomenon more visible. The arms are generally white, reaching from the mineral’s border to the center and aborting at the cores. The cores are substantially darker in color, typically dark blue or black, whereas the sectors are blue. Among them, the trapiche-like structure of S06 is the most obvious. All samples were cut vertically along the c axis and polished. Since the samples show differences in transparency, reflectance and transmission experiments were operated for the low-transparency samples (S01, S02, and S03) and high-transparency samples (S04, S05, and S06), respectively.
The ultraviolet–visible (UV-Vis) spectroscopy test was conducted at the Gemology Experimental Teaching Center of China University of Geosciences (Beijing), with a UV-3000 UV–visible spectrophotometer. The testing technique scans and analyzes the samples using the reflection and transmission method and then utilizes a computer to automatically determine the absorption value and relative content of each element in various spectral intervals. The testing range was 300~800 nm, with a light-source conversion wavelength of 310 nm, a grating conversion wavelength of 720 nm, a detector conversion wavelength of 830 nm, and a sampling interval of 0.5 s.
The Fourier transform infrared (FTIR) spectroscopy test was conducted at the Gemology Experimental Teaching Center of China University of Geosciences (Beijing). The apparatus was a BRUKER Tensor27, with the following specifications: 85–265 V power supply voltage, 47–65 Hz power supply frequency, testing temperature range of 18–35 °C, humidity of less than 70%, 8 scans for scanning, 1 cm−1 resolution, 6 mm grating, 50–100 sample scanning times, reflection and transmission method testing mode, and 400–3600 cm−1 testing range.
The Raman spectroscopy test was conducted at the Gemology Experimental Teaching Center of China University of Geosciences (Beijing). The instrument used was a Horiba LabRAM HR Evolution, with a testing range of 200–1200 cm−1. The excitation light source was an Ar+ laser with a wavelength of 532 nm, a 50× eyepiece, and a beam spot of 1 μm. The resolution was 2.5 cm−1, and the counting time for full-wave peak detection was 3 s. Monocrystalline silicon was used for calibration with an error of ±0.5 cm−1.
The electron probe X-ray microanalysis (EPMA) test was conducted at Shandong Institute of Geological Sciences, using the Japanese electronic JXA-8230 as the experimental instrument. The operating conditions were as follows: acceleration voltage of 20 kV, acceleration current of 2 × 10⁻⁸ A, beam spot of 1 μm. The detection limit was 0.001%. The laser ablation plasma mass spectrometer test was carried out at the Institute of Geochemistry, Chinese Academy of Sciences. The instruments used were a Geo Las Pro 193 nm excimer laser ablation system and an Agilent 7900 plasma mass spectrometer. The carrier gas was helium, and argon was used as a compensation gas to adjust sensitivity. The working wavelength was 193 nm, and the beam spot size was 12 μm. The laser frequency was 5 Hz, and unevenness was <±3.5%. The international glass standard substances including NIST610, BHVO-2G, BCR-2G, BIR-1G, and NIST610, were used and measured twice after the tests each color zone. Offline processing of analytical data was performed using ICPMS Data Cal software (V4.6) [28,29].

4. Results

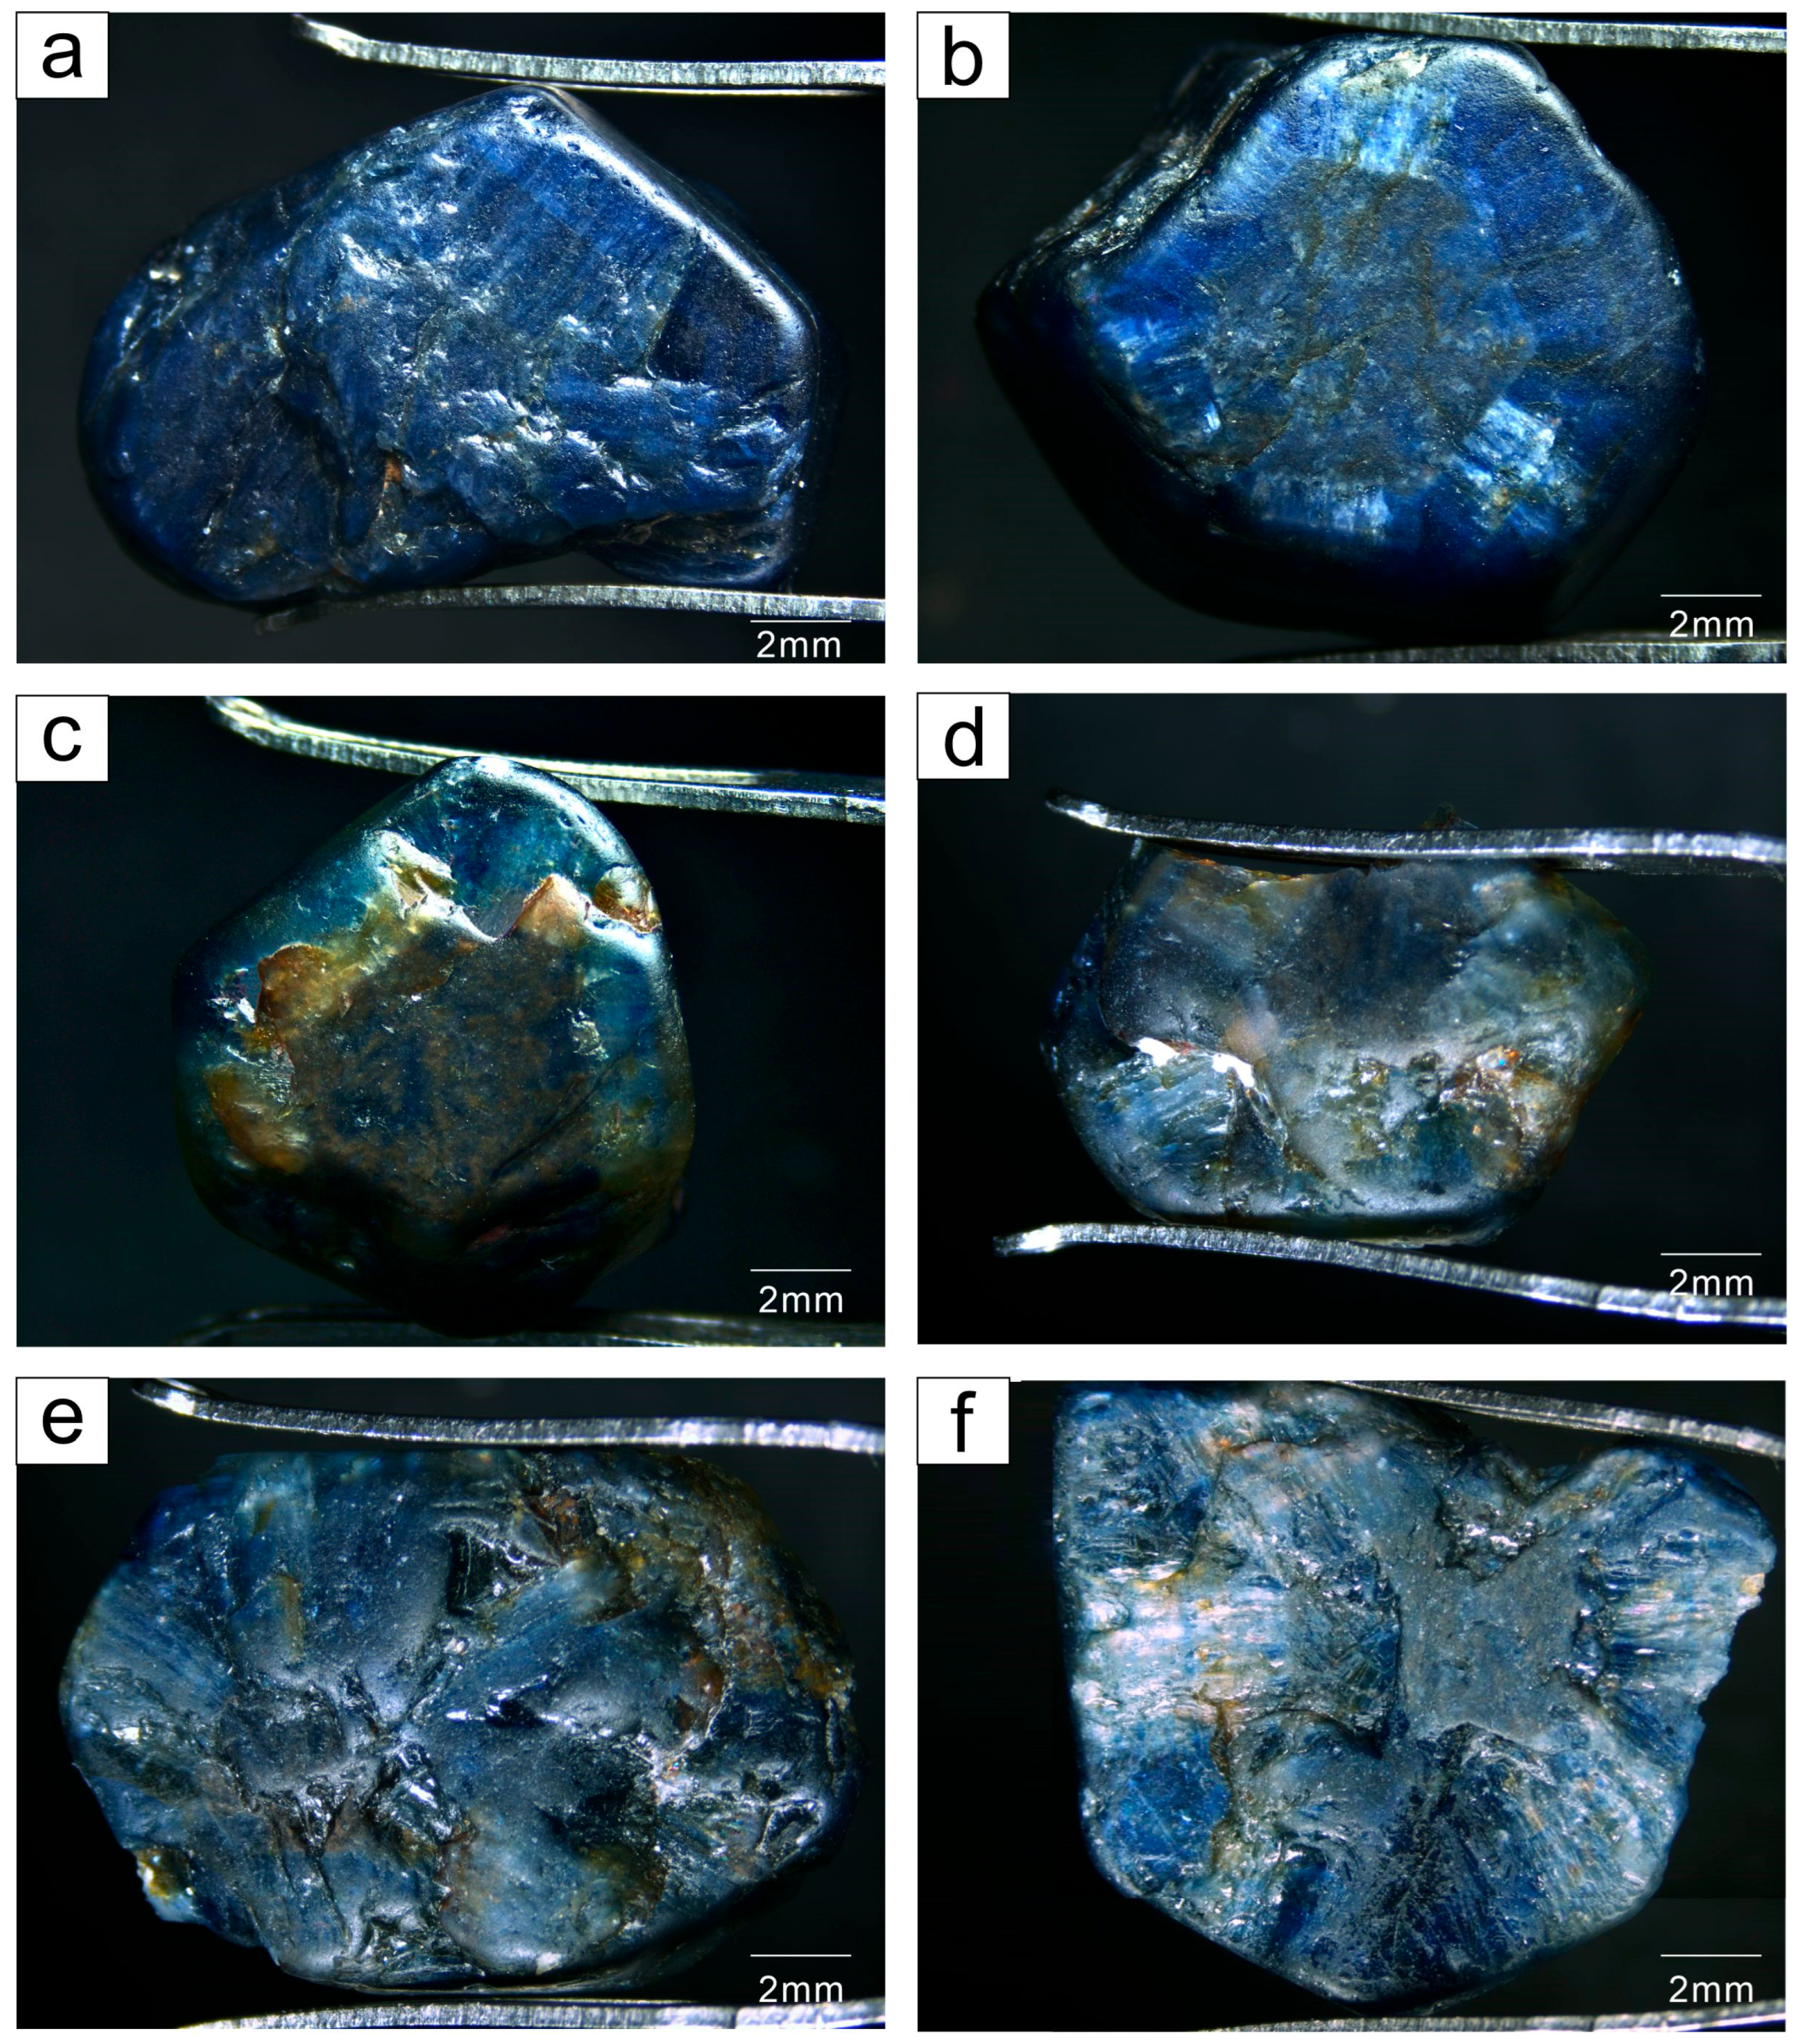
4.1. Conventional Gemological Features

The trapiche appearance of S01, rough stone with a saturated blue color and a glassy luster, is subtle, with white arms visible on the surface (Figure 3a and Figure 4a). The crystals have the shape of fractured hexagonal sheets with hexagonal bands of deep and light blue color at the rim, as well as solution pits on the pinacoid. The sample has a relative density of 3.97, a refractive index of 1.762–1.770, a birefringence of 0.008, and is non-fluorescent. The arm has a silky luster and is composed of white fibrous inclusions.
Sample S02 is a hexagonal prism with a distinct trapiche-like texture (Figure 3b). Its color is blue with a glassy luster. The color of the core is darker than that of the sectors, the arms are white, and the borders between the core, arms, and sectors are distinct (Figure 4b). Sample S02 has a relative density of 3.98, a refractive index of 1.762–1.771, a birefringence of 0.009, and is non-fluorescent. When the stone is rotated around, trapiche-like arms appear as dazzling reflections.
The trapiche-like effect of sample S03 is obvious, with a brown core, white arms, yellowish brown margins, and treasure-blue sectors (Figure 3c). The crystal is in the form of hexagonal columns with glassy luster. Hexagonal color bands have developed and iron impregnation is present on the surface (Figure 4c). The sample has a relative density of 3.99, a refractive index of 1.763–1.771, a birefringence of 0.008, and is non-fluorescent.
Iron penetration and dissolution can be observed on the surface of sample S04, a hexagonal crystal (Figure 3d). It exhibits a characteristic trapiche-like phenomenon, with a less translucent black core that is instantly distinguished from its embraces (Figure 4d). Some of the arms have a brownish yellow appearance near the surface due to late-stage infection. S04 has a specific gravity of 3.96, a refractive index of 1.761–1.771, and a birefringence of 0.010.
Sample S05 is a hexagonal columnar crystal with heavy erosion on the surface (Figure 3e). It is remarkable for its trapiche-like appearance (Figure 4e), developing a hexagonal color band that is perpendicular to its arms. The arms have a pale yellowish white hue, the sector is a deep blue, and the core is black. It has a specific gravity of 3.99 and a refractive index of 1.762–1.771 and a birefringence of 0.009.
The S06 crystal is formed in a regular pattern, with the core in the middle of the crystal, an expansive region (Figure 3f and Figure 4f), and six outwardly radiating white arms showing glassy luster. The specific gravity of the sample is 3.98, and it has a refractive index of 1.762–1.770 and a birefringence of 0.008.

4.2. Spectroscopy

4.2.1. FTIR Spectra

The photometric mode in the crystal structure of corundum-group minerals can be expressed as Tg = 2A1g + 3A2g + 5Eg + 2A1u + 2A2u + 4Eu, where 2A2u + 4Eu is infrared-active. Therefore, there should be six infrared-active vibrational modes in corundum, producing absorption between 380 and 800 cm−1 [30]. As shown in Figure 5, all samples in this study tested by the reflectance method exhibit absorption peaks at 483 and 630 cm−1, and the core of sample S01 also exhibits absorption peaks at 513 cm−1, which are attributed to the stretching and bending vibrations of Al–O. The composition of different sections tends to be consistent.
The emission of the 3309 cm−1 peak is attributed to defect clusters including Ti and OH [31] and is connected to OH (Figure 5b,d,f). It is estimated that the peaks at 3234 cm−1 represent the absorption of stretching vibrations of Ti–OH in various crystallographic orientations [32]. Most natural, untreated blue basalt-related sapphires have an absorption peak near 3309 cm−1, indicating that the sapphire was grown in strongly reducing conditions. After heat treatment in an oxidizing atmosphere, these absorption peaks weaken to varying degrees or even disappear [33]. Consequently, the existence or lack of 3309 cm−1 series absorption is crucial in identifying whether heat treatment has been applied to blue basalt-related sapphires.

4.2.2. Raman Spectra

Corundum has seven Raman-active vibrations: the O2− axial displacements A1g and Eg, the O2− oblique displacement Eg, the O2− vertical quadratic axial displacement Eg, and the A1g and two Eg vibrational modes for the R3+ displacement [30].
The 417 cm−1 absorption peak, which is the strongest peak of all samples, is induced by Al3+ displacement (Figure 6). The Eg vibration of Al3+ displacement is also responsible for the 381 cm−1 absorption peak. The absorption around 575 cm−1 is caused by the oblique displacement Eg of O2 in the octahedron [AlO6], and the vibration of the axial displacement Eg of O2 causes an absorption peak of 750 cm−1. The absorption of 247 cm−1 and 501 cm−1 is induced by the Eg vibration of Fe3+ displacement, and the absorption peak intensity is higher in the cores (Figure 6b) than that in arms (Figure 6a) and sectors (Figure 6c), indicating a high Fe3+ content.
The arms revealed typical rutile peaks (Figure 6a), with the peak at 447 cm−1 generated by the Eg vibration of TiO2. The absorption peaks at 611 cm−1 and 804 cm−1 were caused by the A1g and B2g vibration of TiO2, respectively. It demonstrates the existence of rutile inclusions in the arms of trapiche-like sapphires.
Yellow inclusions in the core of samples S01 and S03 (Figure 6b) have absorption peaks at 211 cm−1, 550 cm−1, and 975 cm−1, implying sapphirine. The existence of 789 cm−1 absorption in the cores and sectors indicates the presence of diaspore.

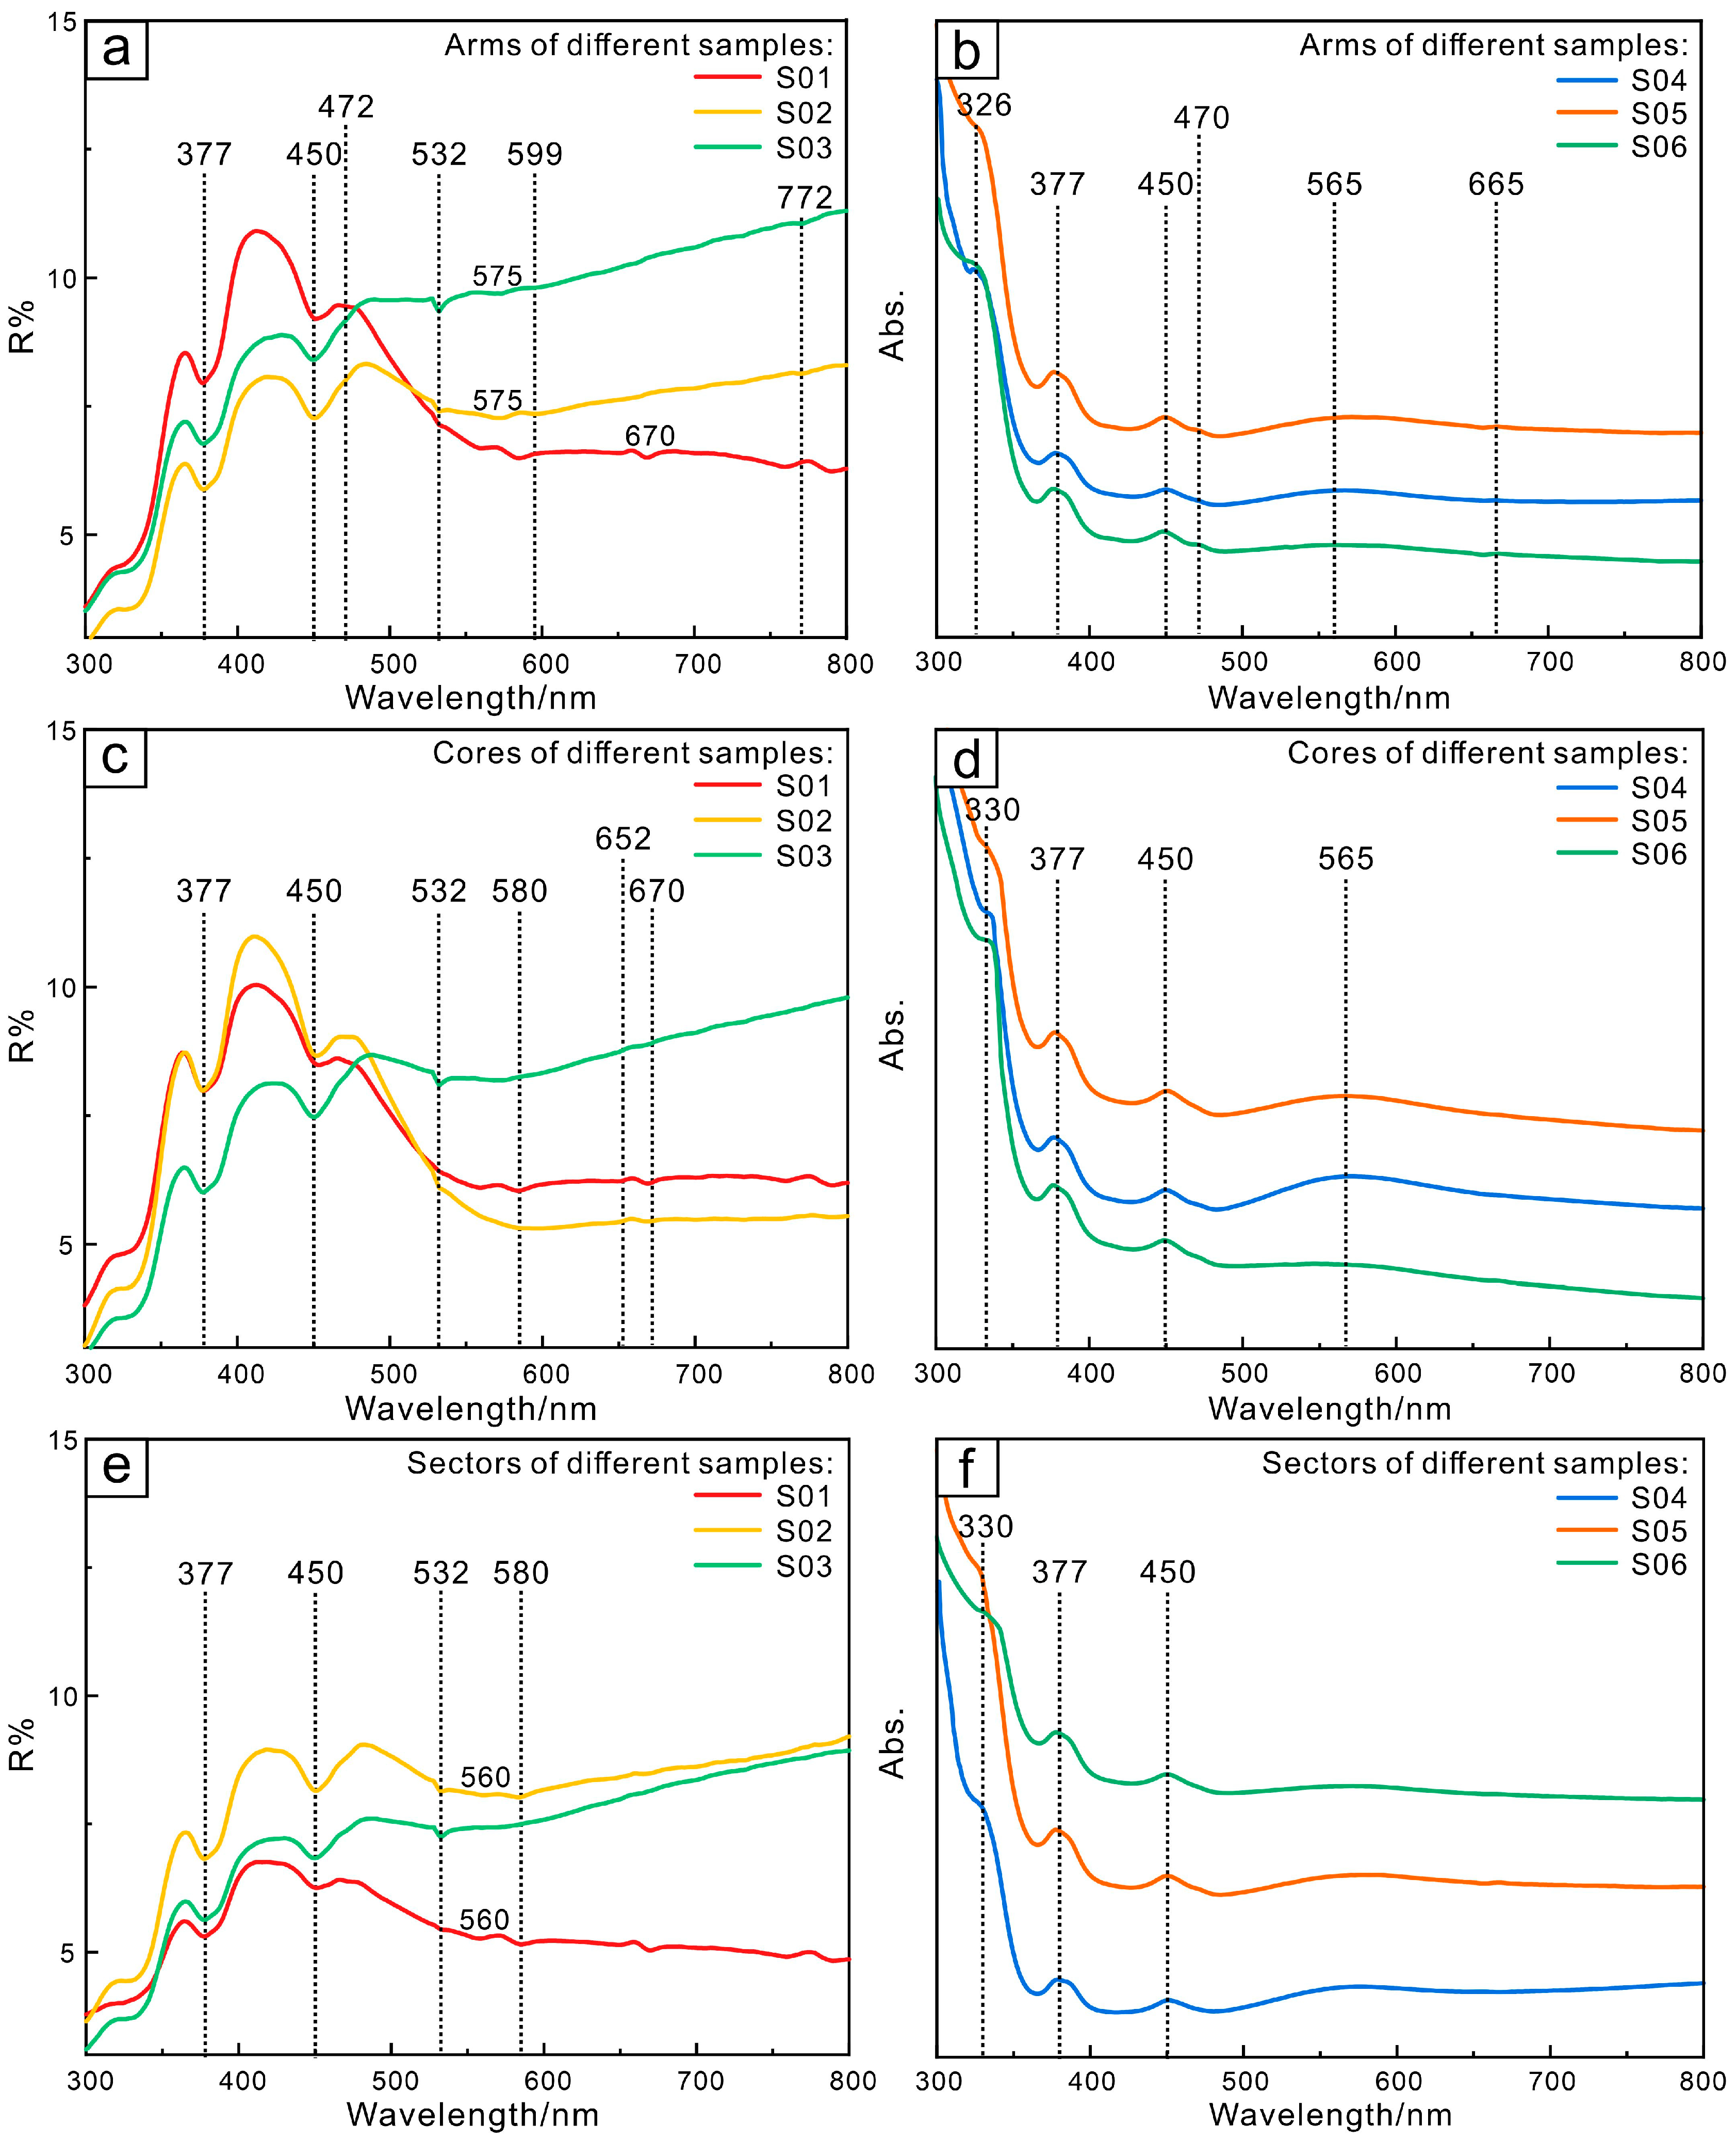
4.2.3. UV-VIS Spectrum

Iron has a significant impact on the generation of different colors in sapphire, which can lead to the occurrence of yellow and blue hues. The six-coordinate radius of Fe2+ is 0.83 Å, which is larger than that of Al3+ by 0.61 Å, and the valence states of the two are different. To penetrate the sapphire lattice, Fe2+ cannot replace Al3+ alone. Instead, it must be replaced by Al3+ with the support of Ti4+ for isovalent replacement. The hexacoordinate radius of Fe3+ is very close to the 0.61 Å of Al3+, making it easier to be incorporated into the lattice. In sapphire, Fe is mainly Fe3+ [34]. Fe3+ exists in sapphire in different ways, such as individual Fe3+/h-Fe3+ pairs, Fe3+–Fe3+ ion pairs, Fe3+–O2− charge transfer, etc. The absorption of trapiche-like sapphire at 377 nm, 450 nm, and 532 nm (Figure 7a–f) is assigned to Fe3+–Fe3+ pairs, while the absorption at 560 nm, 580 nm, and 599 nm is generated by Fe2+–Ti4+ charge transfer (Figure 7a,c,e).
The absorption peaks of 472 nm and 670 nm can be observed in the arms of trapiche-like sapphires (Figure 7a), which are induced by Fe3+–Fe3+ coupled ion pairs. The transition of the coupled ion pairs is the basic reason for the yellow color [35]. The bright blue hue that results from Fe2+–Ti4+ absorption and the black–blue color produced by Fe3+ absorption combine to give the distinctive deep blue color of Changle sapphires.

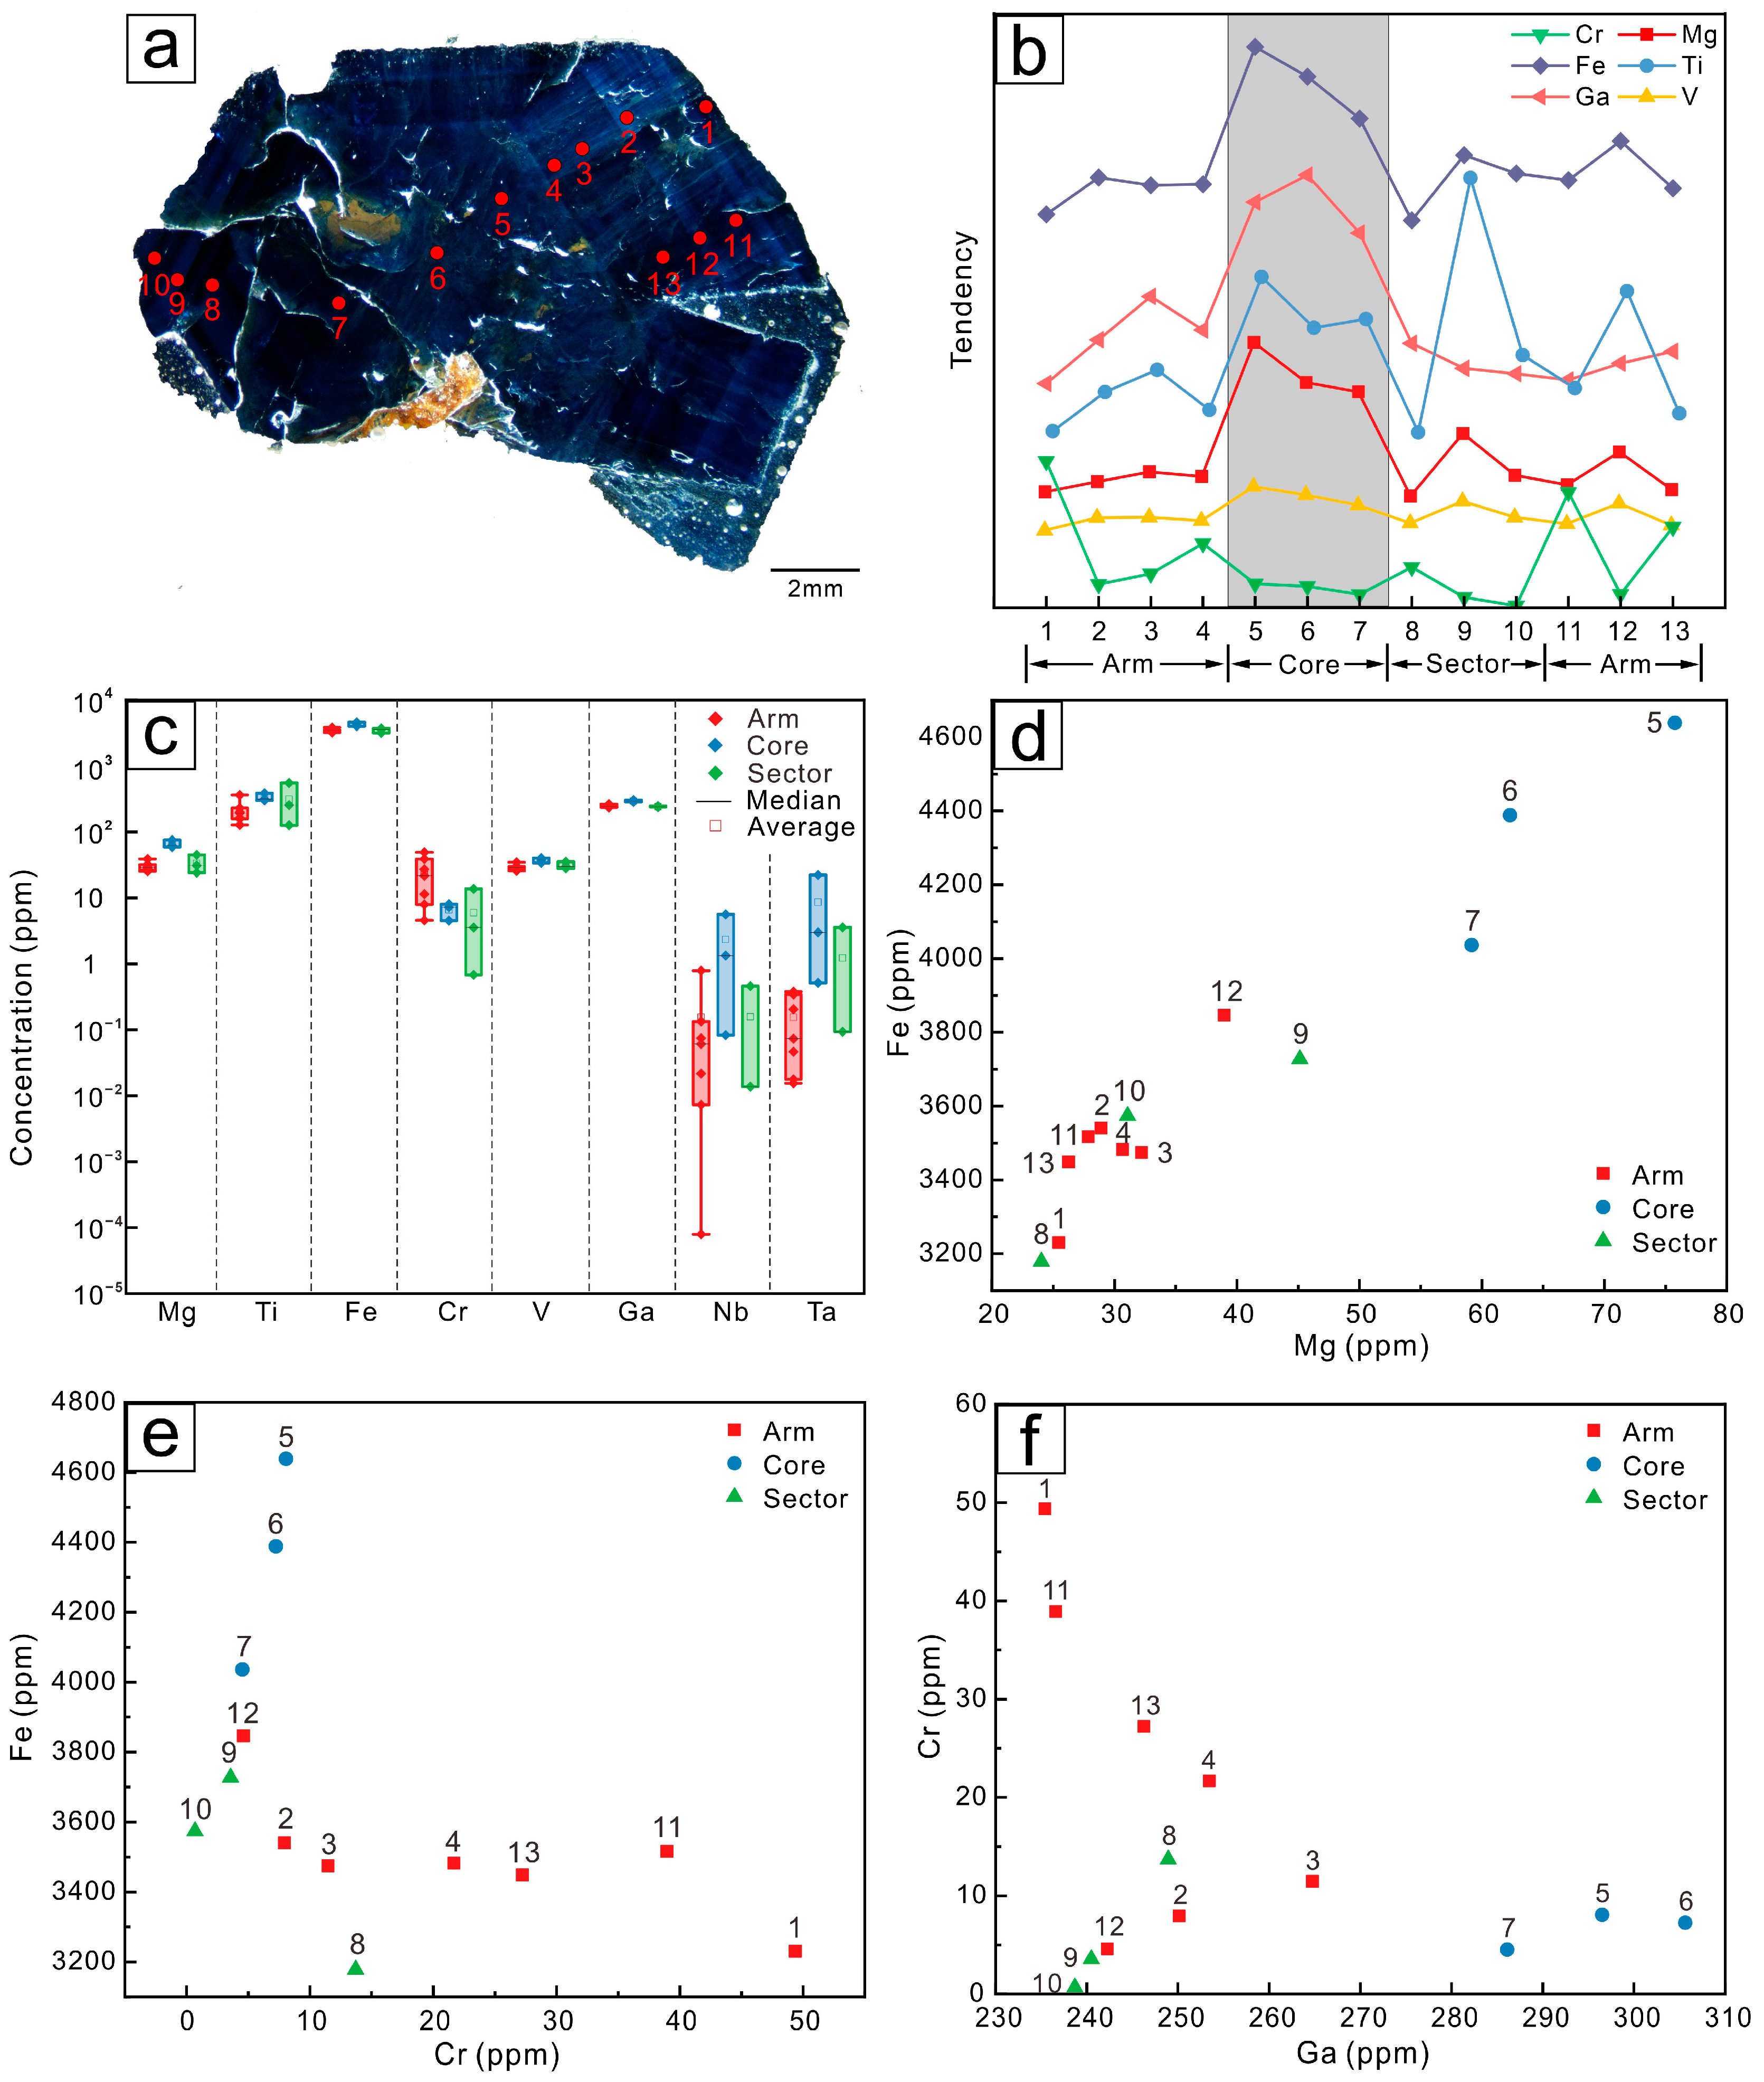
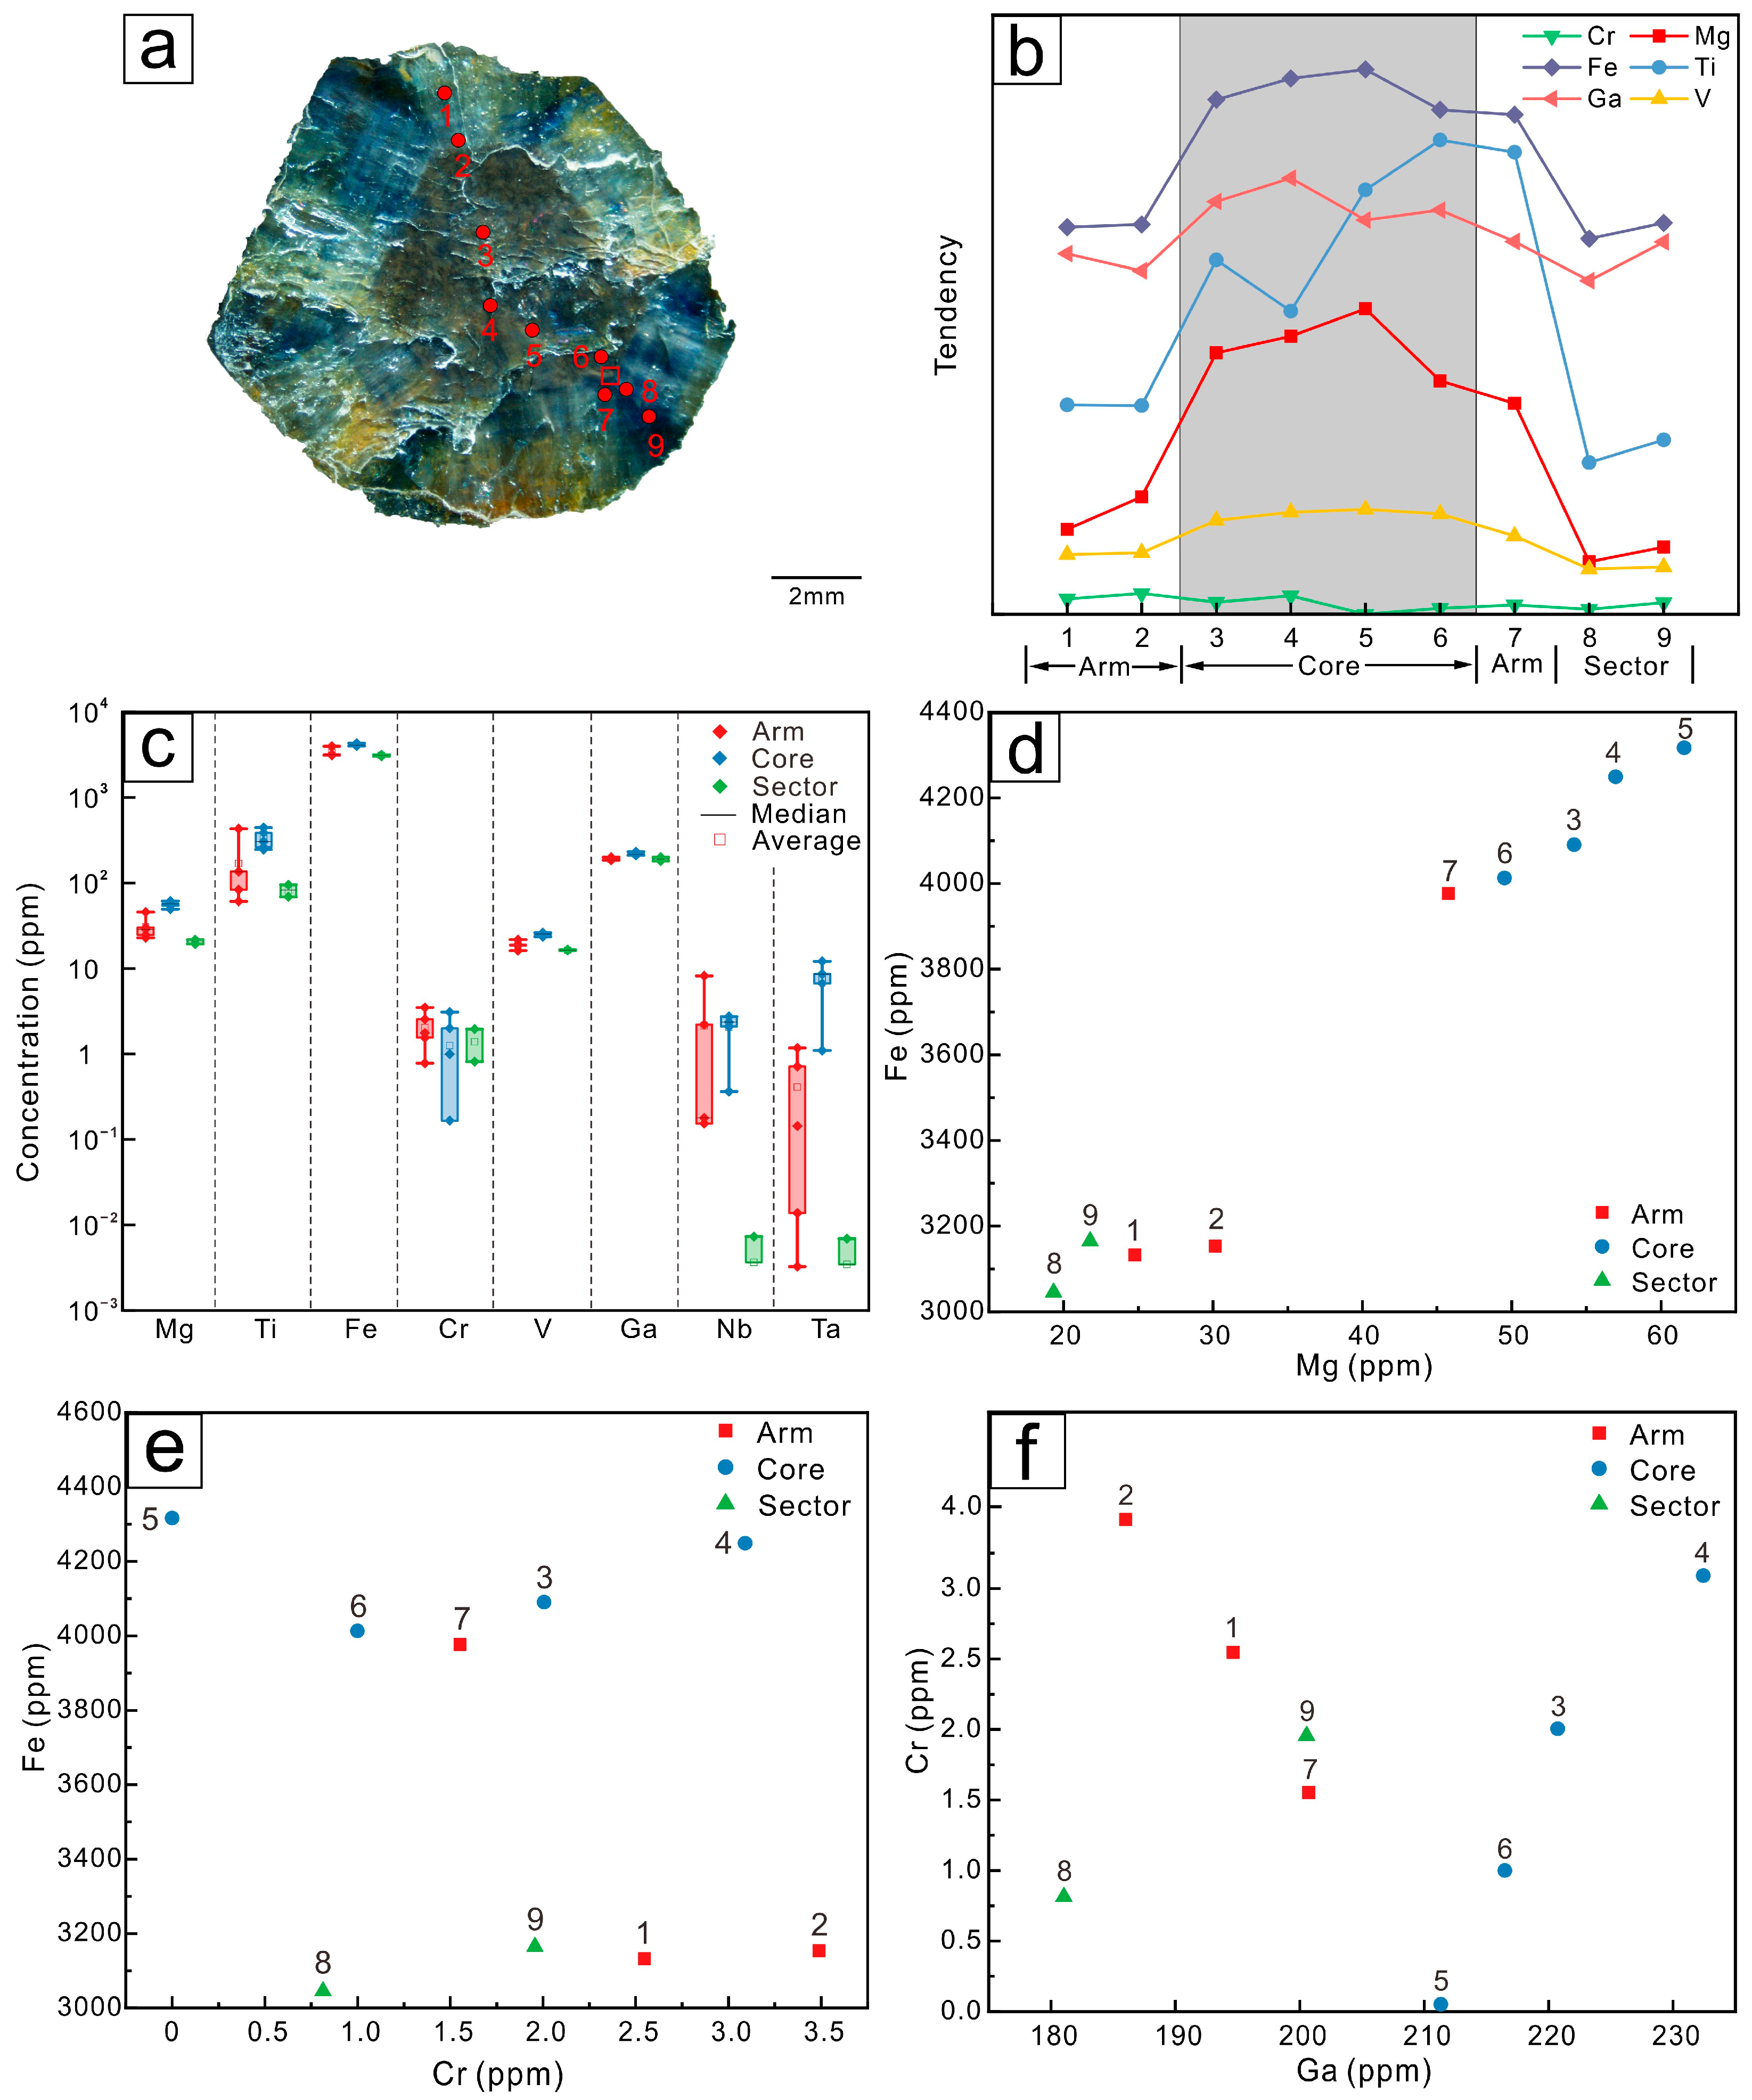
4.3. Major and Trace Elements

The Al2O3 component is above 98% in all samples of this study and can be designated as sapphire. No significant differences are presented in the main elements of the sectors, cores, and arms, indicating that they are composed of the same mineral see Table 1.
The trace elements in trapiche-like sapphires are Fe, Ti, Mn, Cr, V, Si, Mg, Ga, etc. Fe and Ti contribute to the blue color of the sapphires together, while the concentration of Fe also influences the hue of the sapphires. Sapphire appears pure blue when the TiO2 quantity is 0.50 wt.% and the Fe3O2 is 1.50 wt.% [36]. Sapphire in Changle has a high Fe concentration and a low Ti value, resulting in a deep blue–black hue. Elements are enriched in the core, with Fe and Ti having the highest concentrations at 1.26 wt.% and 0.04 wt.%, respectively. No significant differences have been confirmed in the average Fe content between the arms and the sectors, with average Fe contents of 1.00 wt.% in the arms and 1.05 wt.% in the sectors. The average Ti value in the arms is 0.02 wt.%, whereas the average of the sectors is 0.03 wt.%. The core is the section with the greatest Fe concentration in the sample, which might be owing to the high Fe ion density during nucleation [13]. The Mg content in the arms, cores, and sectors is 22.88~45.75 ppm, 47.91~75.76 ppm, and 19.33~45.14 ppm, respectively, while the V content is 16.16~30.12 ppm, 23.51~40.38 ppm, and 16.26~35.46 ppm, respectively.

5. Discussion

5.1. The Color Mechanism of Changle Sapphire

The color of sapphire is the result of the combined action of various elements dissolved in the lattice (Fe, Ti, Mg, Cr, V, Si). Six major chromophores are present in natural corundum and show various colors: Cr3+, h-Cr3+, Fe3+/h-Fe3+, Fe2+–Ti4+ and V3+ lead to red, orange, yellow, blue, and blue or green, respectively [37]. Fe2+–Ti4+ and V3+ are the chromophores of blue sapphire, when the V content is higher, sapphire can display grayish blue to purple hues [38]. The low V content (16~40 ppm) of the Changle samples (Table 2, Table 3 and Table 4) has no discernible effect on the blue color. If corundum contains Si, Mg, Ti, and Fe, Si will preferentially couple with Mg. When the Si4+ reaction is complete, Mg will combine with Ti. Upon completion of the above reaction, if Ti still exists, it will combine with Fe to form Ti4+–Fe2+ pairs. Fe is an element that has a significant impact on the coloration of blue sapphire, as demonstrated by the Changle sample in this article. The darkening of samples’ color is typically accompanied by an increase in Fe content (Table 2, Table 3 and Table 4). Fe2+ enhances the brilliant hue of sapphire; instead, Fe3+ has the reverse effect. Three coloring mechanisms, in which Fe participates, have been proposed: (1) crystal field theory, which refers to the electronic transition of Fe3+ [39]; (2) electron transfer absorption, which includes Fe3+–O2− charge transfer [40], intervalence charge transitions between Fe3+–Fe3+ ion pairs [41], and intervalence charge transfer between Fe2+–Ti4+ ion pairs [42]; and (3) hole color center, which represents h-Fe3+ pairs [37].
The peaks of 330 nm belong to the d–d electron leaps of Fe3+ from 1A64E(D) and 1A64A + 4E(G) (Figure 7b,d,e). From the UV–visible spectrum, it can be noted that the cores, arms, and sectors of all samples exhibit blue light absorption at the main wavelengths of 377 nm and 450 nm (Figure 7a–f). This can be attributed to the Fe3+–Fe3+ pairs, resulting in a yellow hue. The absorption may be caused by the connection of two Fe ions at the octahedral apex [43]. Samples S01, S02, and S03 show an absorption band created by Fe3+–Fe3+ ion pairs at approximately 532 nm (Figure 7a,c,e), which is only seen in sapphires with a high Fe concentration.
The 575 nm absorption band corresponds to the defect cluster center generated by the combination of Fe, Ti, and V, which replaces the Al site with oxygen vacancies and hydroxyl groups [44]. In the defect center, Fe2+ and Ti4+ replace Al3+ in two co-rhombic [AlO6] octahedra in the direction of the vertical c axis, producing Fe2+–Ti4+ ion pairs. Their atomic orbitals overlap to create the molecular bonds σ and σ3, which allow charge transfer to absorb visible light at about 570 nm and generate a blue tint. The absorption peak at 772 nm is induced by the charge transfer between homonuclear atoms Fe2+ and Fe3+ [45].
The elements in the cores are relatively enriched, with an absorption peak near 652 nm (Figure 7c) produced by rare chromium elements [46]. The wide absorption band of 665 nm (Figure 7b) is also a sensitive indicator of the amount of Cr3+. The sample’s color is blue due to increased absorption in the red and yellow portions of the UV spectrum.
The blue color of sapphire is generated by Fe2+–Ti4+ pairs. In the yellow–green region of the UV spectrum, the absorptions at 560 nm (Figure 7e), 565 nm (Figure 7b,e), 580 nm (Figure 7c), and 599 nm (Figure 7a) are considered to be caused by Fe2+–Ti4+ charge transfer [47]. It is necessary to transfer Ti4+ with divalent ions like Fe2+ and Mg2+, which also replace Al3+, into the lattice when it enters owing to charge imbalance. When Fe2+ and Ti4+ form an octahedron with two linked faces, their d orbitals overlap with the optical-axis direction. After being energized by light, Fe2+ and Ti4+ undergo charge transfer, resulting in Fe2+ + Ti4+ Fe3+ + Ti3+. During the charge transfer, a wide absorption band centered around 560 nm will be generated, presenting blue in the direction perpendicular to the optical axis. When Fe2+ and Ti4+ are located in two octahedra connected by edges, a blue–green huge will be produced due to different absorption energies in the visible spectrum. In addition to the previously indicated coloring process generated by Fe and Al substitution, iron inclusions can make the sample appear yellow–brown (such as sample S03). The various coloring mechanisms dominated by Fe3+ can lead to absorption in the blue–purple region of the UV–visible spectrum, affecting blue light transmittance, with the Fe2+–Ti4+ pair controlling the color of Changle sapphire. The absorption spectra of deep blue sapphire from Changle, Shandong, are mostly created by the superposition of Fe2+–Ti4+ and Fe3+ absorption bands.

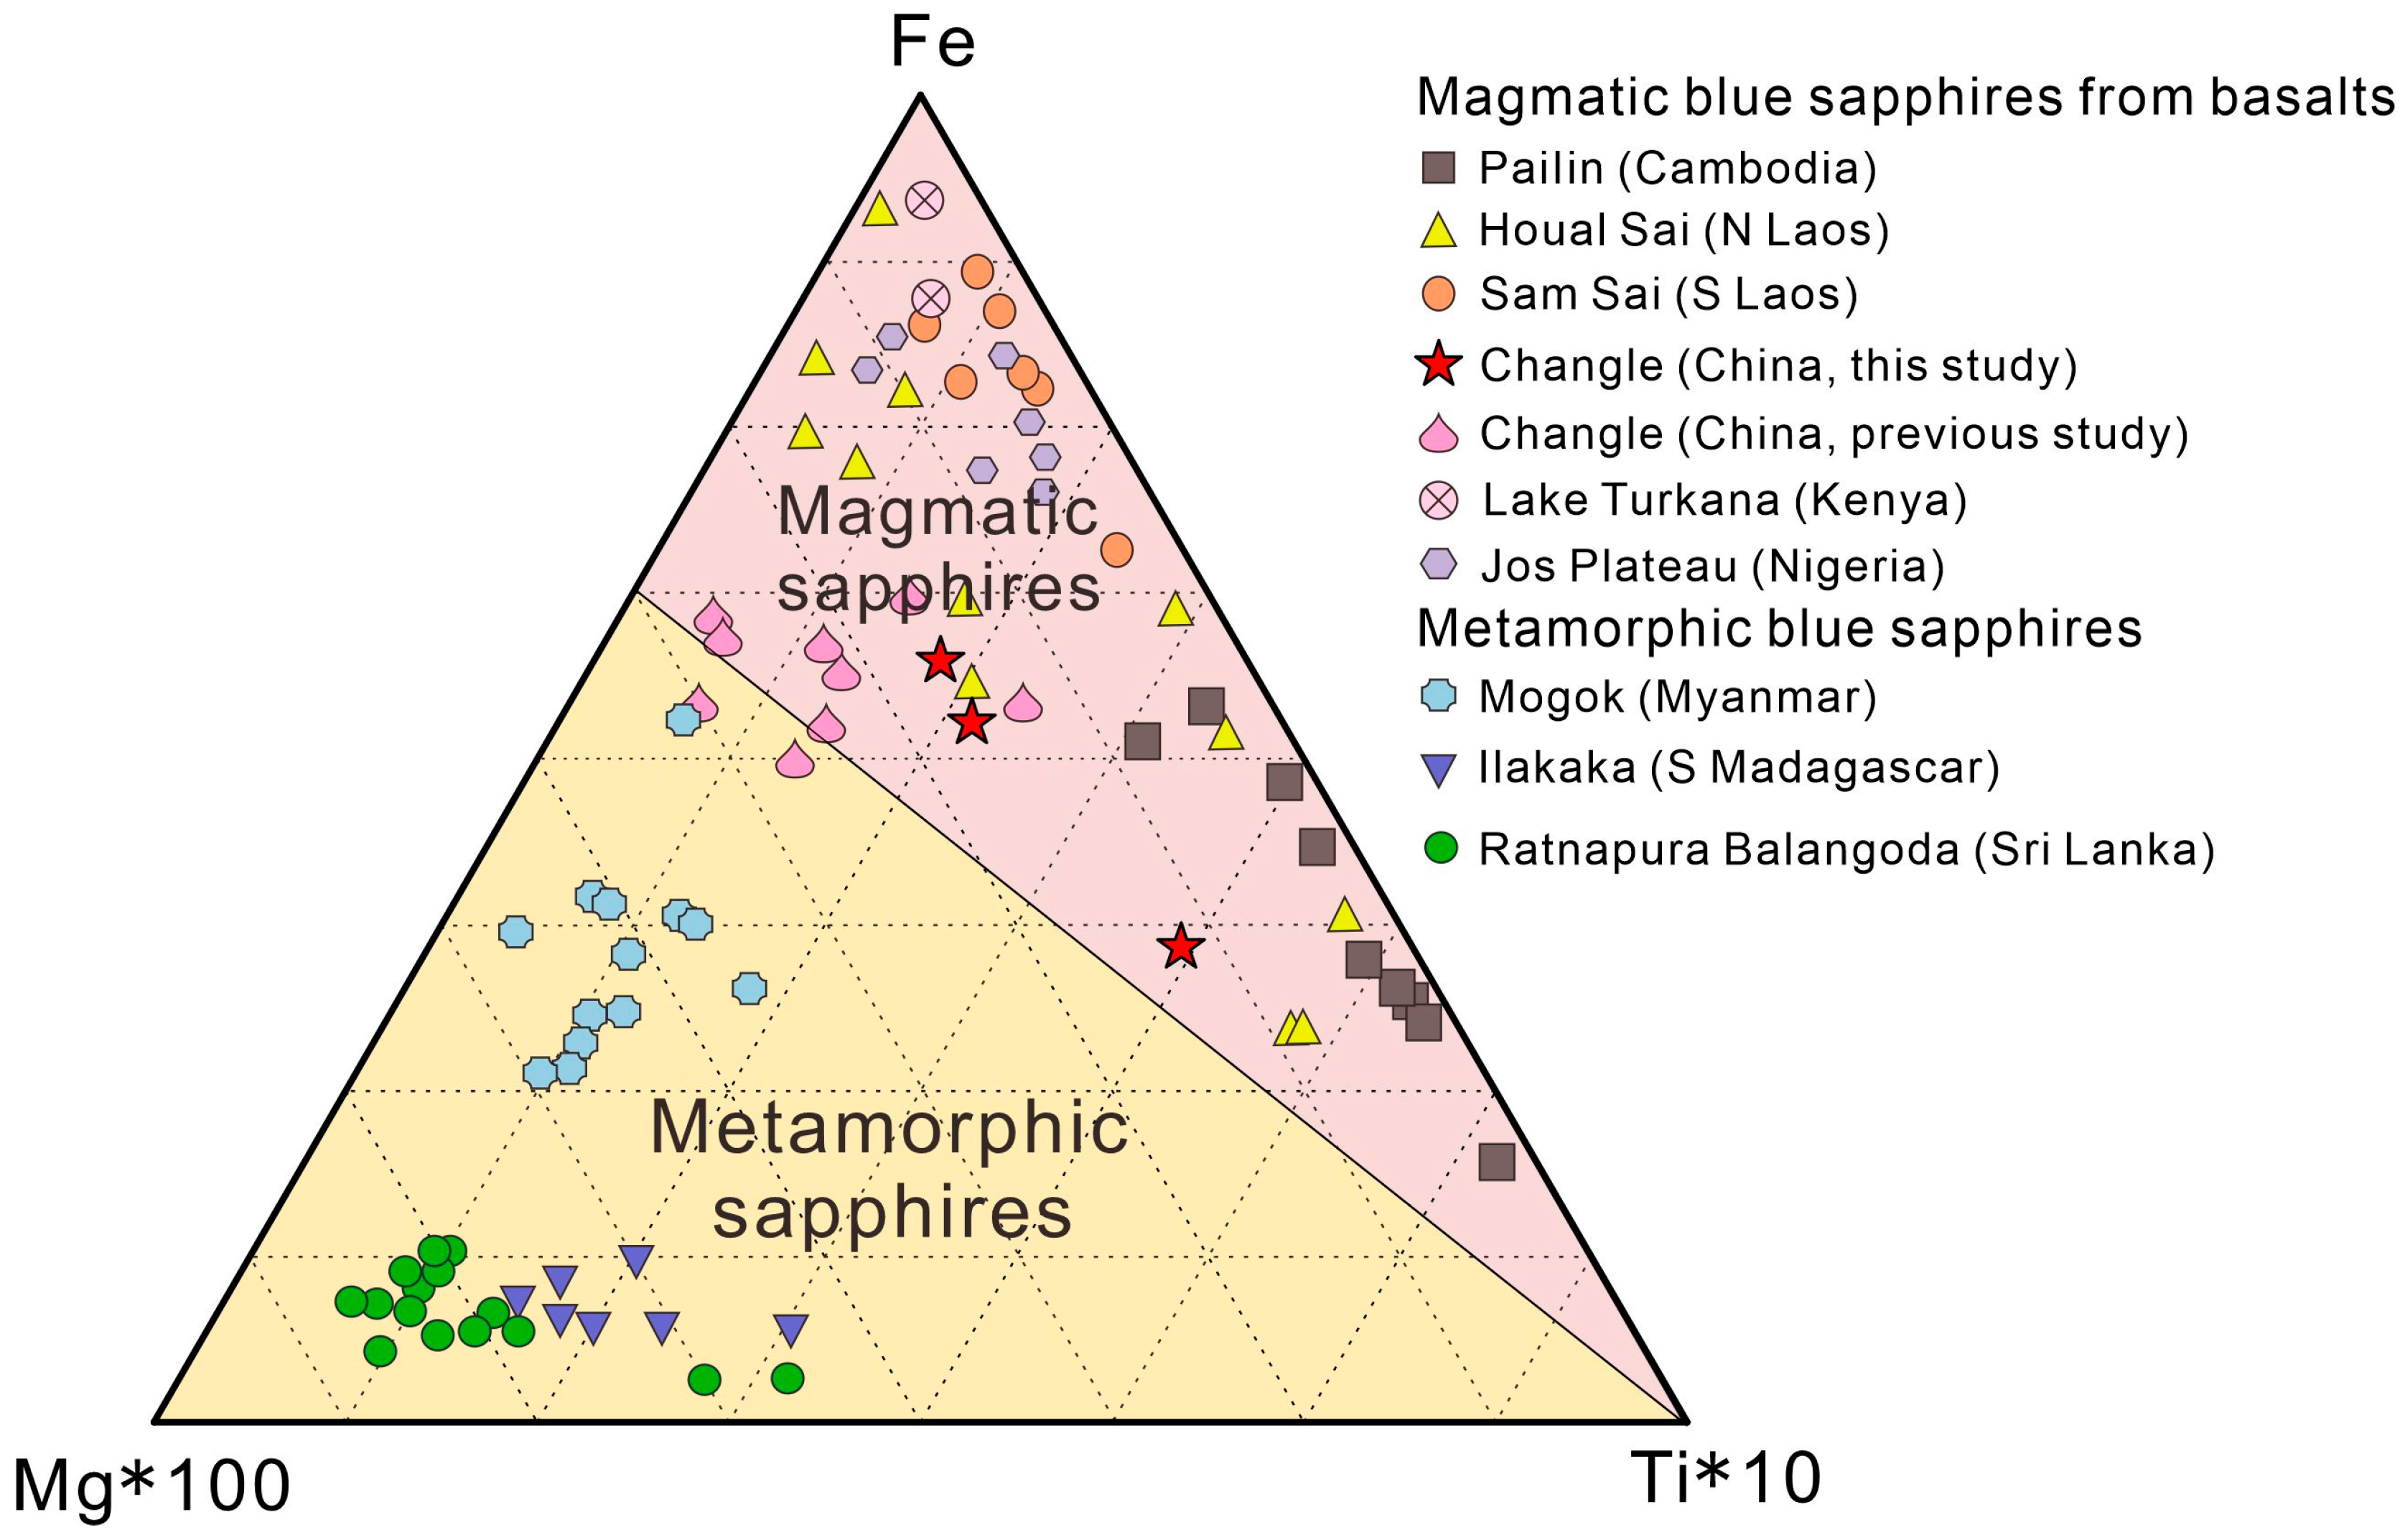
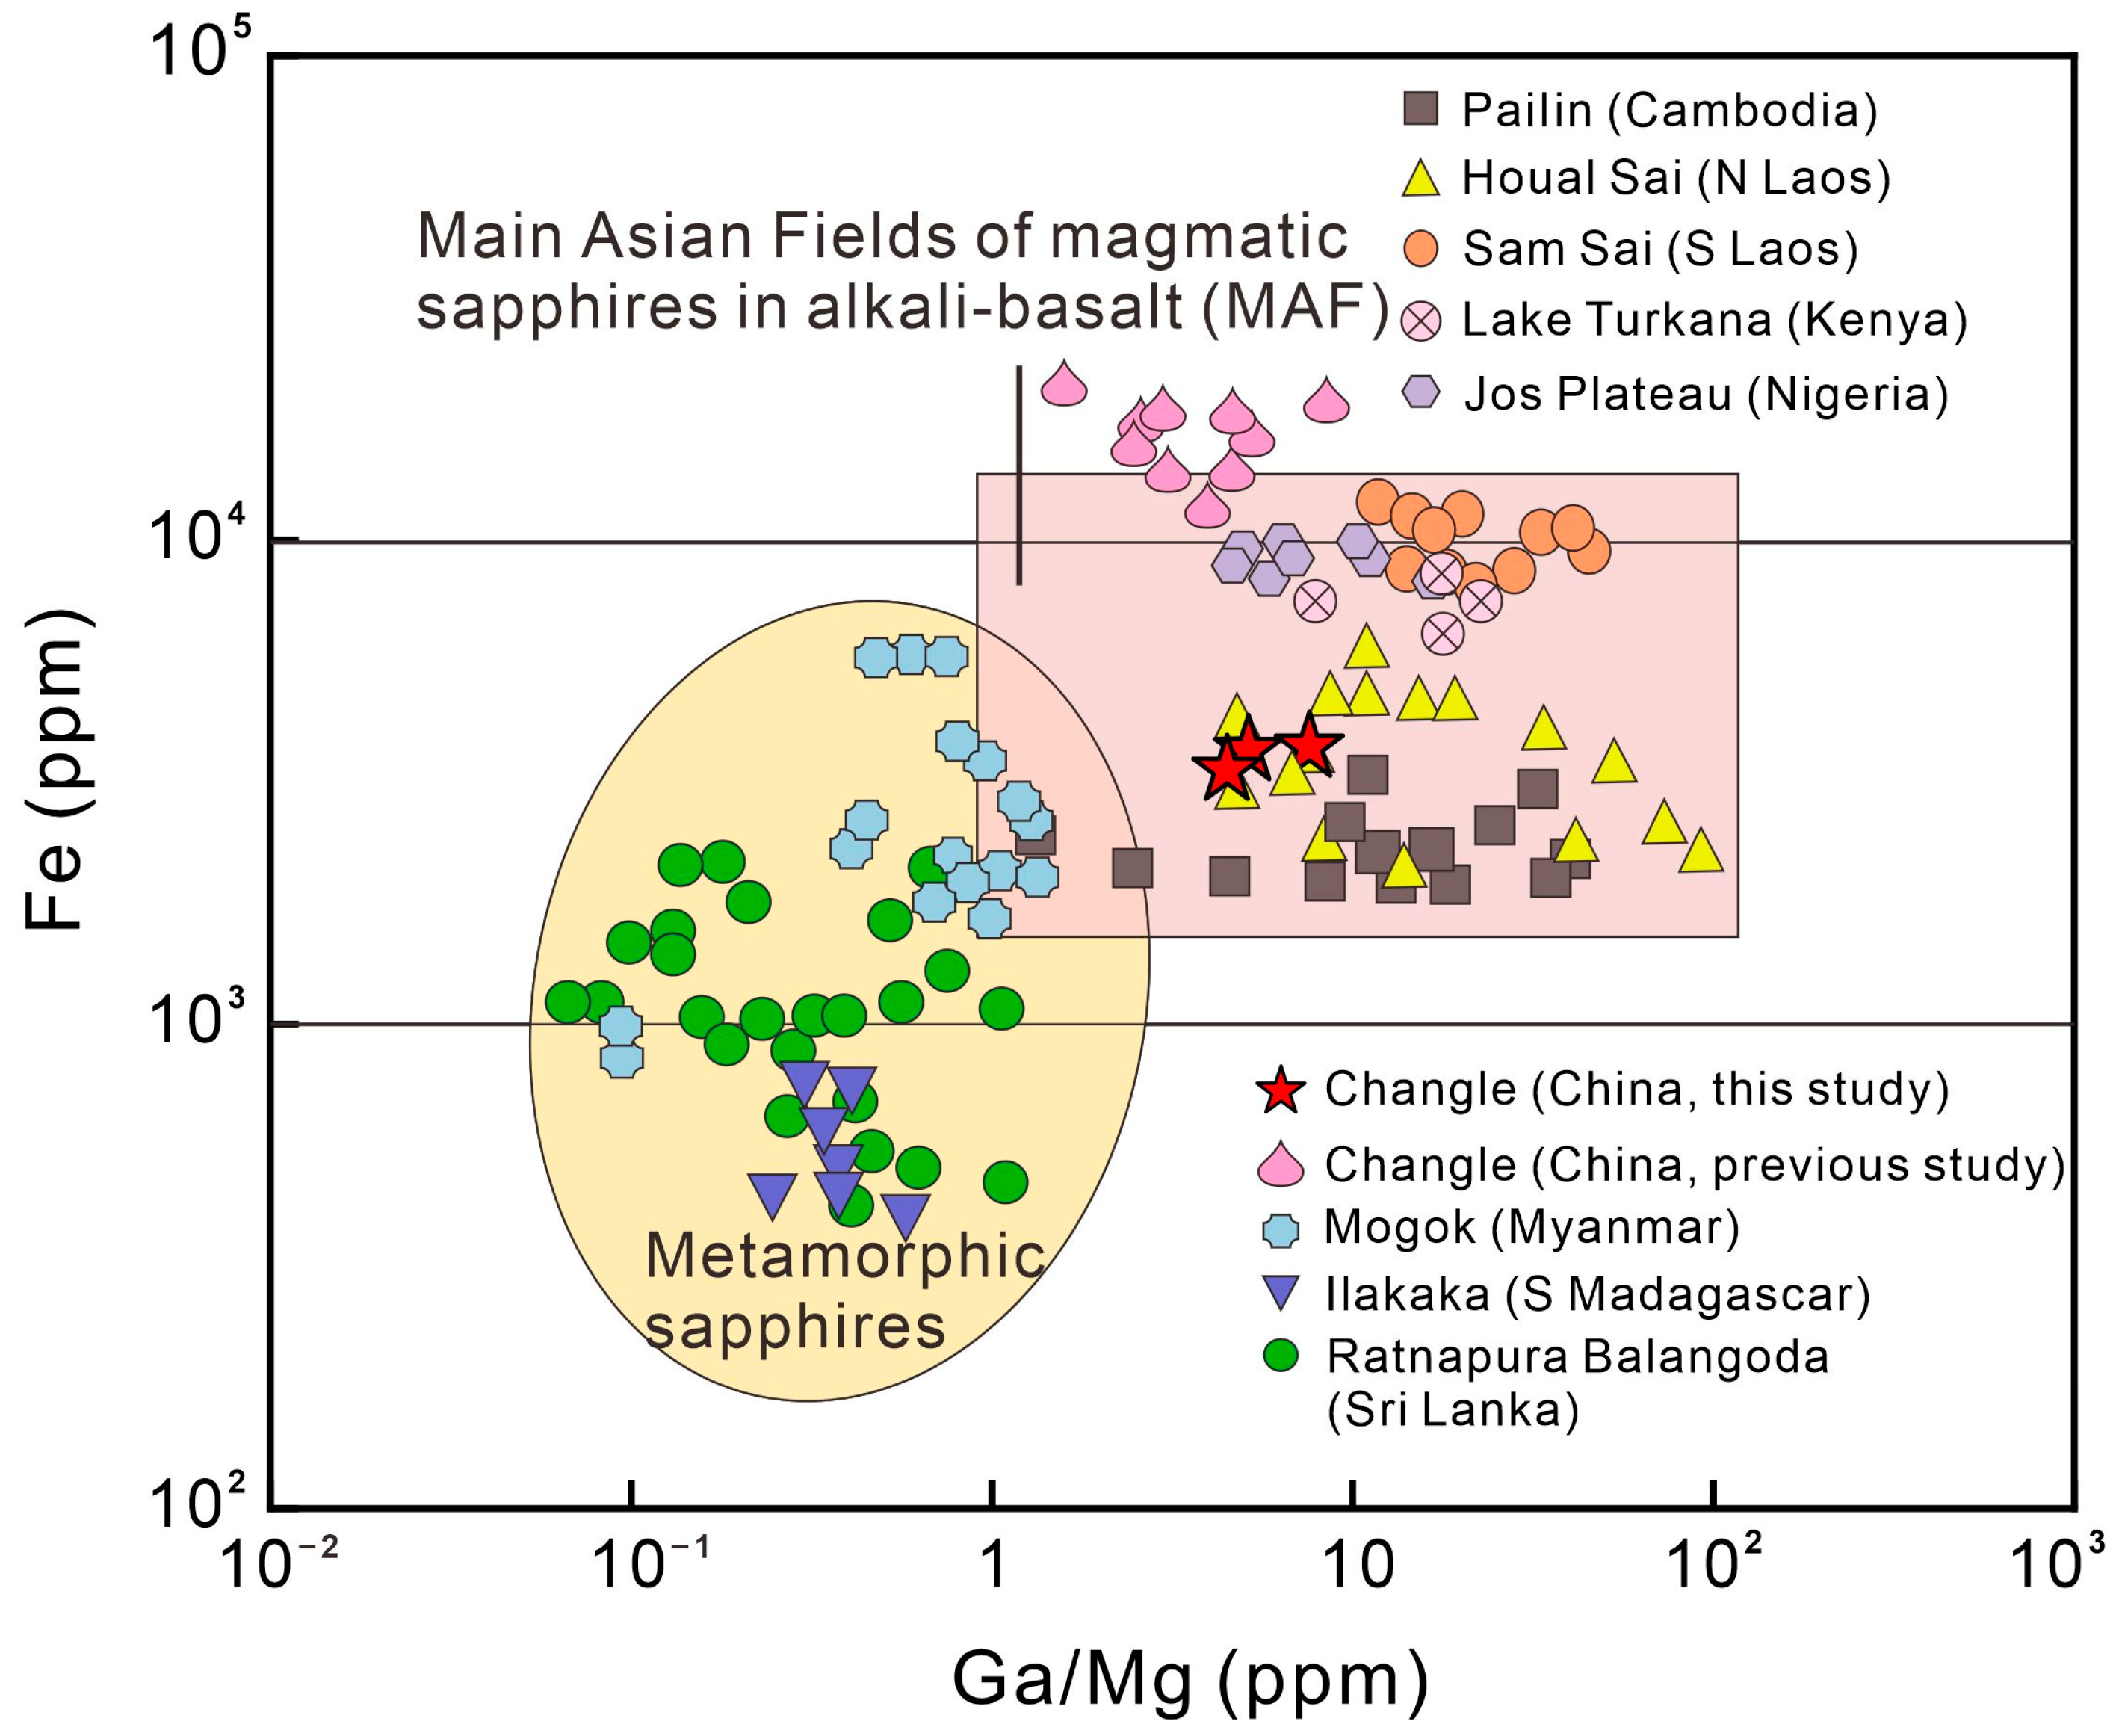
5.2. Geochemical Characteristics of Different Parts of Trapiche-like Sapphire

The distribution of elements in Changle trapiche-like sapphires follows a certain pattern. As illustrated in the line graphs (Figure 8b, Figure 9b and Figure 10b), there is a tendency of elements to ascend and then descend from the arms to the cores. Fe, Ti, Mg, Cr, Ga, and V are highly concentrated in the cores, with the arms’ position having a slightly lower concentration than the sectors. Cr3+ and Fe3+ have comparable radii and chemical properties, and both can be substituted by Al3+. Thus, the changing trend of Cr is contrary to that of Fe. As can be viewed in the box plots (Figure 8c, Figure 9c and Figure 10c), a greater range of elemental variation is presented in the arms of trapiche-like sapphire compared to the cores and sectors. The contents of Nb and Ta vary more obviously at different sections, decreasing sequentially from the cores to sectors and then to the arms.
Points at separate locations on the same color band were selected for analysis (P2, P12, and P9 for sample S01 and P3 and P12 for sample S02). The hue of sapphire is mostly determined by Fe concentration. Without any additional impact, the Fe contents of P9 and P12 in sample S01 and P3 and P12 in sample S02 on the same band are nearly identical.
There is a loss of trace elements from the sectors to the arms, indicating that the trapiche-like texture is formed by late-stage processes. Analytical spots of sample S01 were selected in the same area with distinct development of trapiche-like arms. As can be seen from the scatter plot (Figure 8d–f), the content of elements in domains near points P2, P3, and P4 is more compact compared to that around P11 and P12 and in the sample S01. A subsequent equilibrium process is speculated to occur during the development of trapiche-like sapphire arms, resulting in element redistribution and a decrease in the impact of the original band on the elements. The data points of sample S02 (P3 and P4 with P11 and P12) also show the same contraction trend (Figure 9d–f) as described above.
The core of sample S03 has a high iron concentration and is dark brown in hue. The representative data points for the core, arms, and sectors are relatively dispersed in the scatter plot (Figure 10d–f). It can be inferred that certain components were eliminated as a result of subsequent modifications. The core is the first to form at the highest temperature and pressure. At this time, iron-rich materials exhibited the least amount of crystallization when compared to other temperature and pressure settings, leading to the maximum iron content in the melts. After a certain period, the temperature and pressure began to decrease to the crystallization point of some iron-rich minerals. A considerable quantity of iron preferentially penetrates iron-rich materials. The iron concentration of the melt reduced dramatically, which resulted in a decrease in the contents of iron that had been incorporated into the sapphire lattice.

5.3. The Formation Process and Genesis of Trapiche-like Sapphires

In general, the “trapiche-like” effect might form in three ways: (1) cavities caused by defects during mineral growth [48]; (2) a mineral structure or chromogenic ions that cause parts of the arm to be different in color from the main body [49]; and (3) the formation of inclusions by exsolution. A detailed inspection was performed under a gem microscope on the arm of the trapiche-like sapphire sample S01, which consists of a large number of white filamentary inclusions. Even in the same arm section, the appearance of trapiche-like phenomena varies, with white filamentous inclusions of different lengths and thicknesses. This excludes the possibility that the arms and sectors developed simultaneously, where lattice defects formed dislocations leading to the formation of trapiche structure. According to EPMA, LA-ICP-MS, FTIR spectroscopy, and Raman spectroscopy tests, the arms, cores, and sectors are all composed of corundum and have no notable differences in chemical compositions. No substantial change in the strong absorption in the UV–visible spectrum rules out the hypothesis that chromogenic ions cause the creation of the trapiche-like texture of Changle sapphire. Microscopic observation shows that the arms of trapiche-like sapphires contain many white filamentous inclusions with a bright luster. This feature hints at the possibility of glassy melt inclusions in their interior.
Based on trace element data, it can be concluded that the arms are enriched in Nb and Ta elements, more so than the sectors. High-field-strength elements, such as Nb, Ta, W, and Zr, have different ionic radii or cation charges compared to Al3+, making them less likely to enter the corundum lattice. However, these elements are highly compatible in rutile, and the charge substitution mechanism is as follows: 3Ti4+ = 2 (Nb5+, Ta5+) + (Mg2+, Fe2+) [50]. When rutile co-crystallizes with corundum, it absorbs high-field-strength elements in magma and then exists as tiny inclusions in corundum. The hypothesis states that the arms of the trapiche-like sapphire are associated with rutile inclusions, as the sapphire crystals remained in their original orientation to form vitreous inclusions following the dissolution of the continuously forming rutile. Rutile inclusions form alongside corundum and then vary with crystallization conditions, such as magma upwelling and temperature rise during subsequent capture of corundum. The melting of needle-like rutile in the crystal orientation results in the release of Ti4+, which combines with Fe2+ in the sapphire lattice, modifying the color band and darkening the color of specific places in the orientation relative to the original color (P11, P12, and P13 of sample S01). After the dissolution of rutile, it left voids that were filled with a glassy melt to produce white arms of a trapiche-like structure.
Field observation shows that Changle sapphire is sourced from a Cenozoic volcanic crater. The orebody is controlled by the volcano, showing a volcanic cone structure, and is produced in layers. Sapphires occur as isolated single crystals in basalt, with surface dissolution and distinct boundaries with the host basalt. Mineral-bearing basalt has a porphyritic texture and vesicular structure. Corundum megacrysts are strongly connected with mantle-derived peridotite xenoliths, and basalts with richer mineralization have more peridotite xenoliths. Observation of field specimens reveals that the corundum megacrysts are distinctly bounded by basalt, indicating that they did not crystallize from it. The major and trace elemental composition of corundum demonstrates that it is low in Mg, rich in Fe and Ga, and relatively low in rare earth and incompatible elements (U, Th, Zr, Nb, and Ta). Corundum megacrysts originate immediately from a melt that is closely connected to the host basalt but is not basaltic magma.
The content of the trace elements Fe, Ti, Cr, V, Mg, and Ga reflects the geological conditions in which the sapphire was formed. Magmatic sapphires contain high contents of Fe and Ga (1800–13,000 ppm Fe, 70–570 ppm Ga) and low contents of Mg and Cr (typically less than 40 ppm) [51]. The Fe concentrations in samples S01, S02, and S03 range from 3000 ppm to 5000 ppm, whereas the Ga concentrations were 235–306 ppm, 168–210 ppm, and 181–232 ppm, respectively. In general, the trapiche-like sapphires in Changle exhibit the features of magmatic sapphires identified by the values of their characteristic element ratios and content. According to previous research [52,53,54], sapphire classified as magmatic has a Cr/Ga ratio of less than 0.1, whereas metamorphic sapphire has a Cr/Ga ratio of more than 1. The Cr/Ga ratios of samples S01, S02, and S03 are 0.06, 0.11, and 0.08, respectively. For magmatic sapphire, Fe/Mg is generally >>100, but for metamorphic sapphire, Fe/Mg is <100. Specifically, Fe/Mg ratios in samples S01, S02, and S03 are 104, 94, and 102, respectively.
The Fe–Mg*100–Ti*10 diagonal diagram distinguishes basaltic sapphires from metamorphic sapphires based on the difference in Fe/Mg ratios, with basaltic sapphires having a higher proportion of Fe and a lower proportion of Mg than metamorphic sapphires. Chen [55] studied sapphire samples with developed fractures in Changle and mapped them. The Fe–Mg*100–Ti*10 triangle diagram’s mapping of the samples in the metamorphic rock region raises the possibility that sapphires underwent melt metasomatism at a later stage of production, overlaid on metamorphism. Peucat [52] conducted an intense study of sapphires from various sources, creating a Ga/Mg–Fe diagram. The data of Changle trapiche-like sapphires in this article were all plotted in the magmatic sapphire region in the Fe–Mg*100–Ti*10 triangle (Figure 11) and Ga/Mg–Fe diagrams (Figure 12), which is distinguishable from metamorphic sapphires.
This perception is compatible with the conclusions of the field and petrographic observations. The content of Mg in sapphire depends on the Mg content in its crystallization environment. The fact that Changle alkaline basalt has a greater Mg concentration suggests that sapphire is a xenocryst that formed during the alkaline unsaturated melt stage in the mantle or lower crust rather than a byproduct of basalt magma crystallization. The δ18O value of sapphires approximates those of upper-mantle and lower-crustal magmatic rocks [56]. Temperature–pressure and fluid immiscibility investigations on melt inclusions have demonstrated that Changle sapphires were formed in fluid-rich conditions in the lower crust, with a temperature of 1000–1100 °C and a depth of ~23 km where the parental melt evolved into phonolitic composition [57,58].

6. Conclusions

Field observations of trapiche-like sapphires from Changle, eastern North China Craton, reveal that the origin of Changle sapphire is closely related to Cenozoic volcanic activity. It is not a product of basaltic magma crystallization but is more likely derived from the lower crust and is classified as magmatic sapphire. UV-Vis spectroscopy reveals that the deep blue hue of trapiche-like sapphire is mostly generated by the absorption of Fe2+–Ti4+ and Fe3+–Fe3+ pairs. FTIR spectroscopy measured the tensile and bending vibrations of Al–O, and Raman spectroscopy experiments suggested the presence of rutile and diaspore inclusions in sapphire. The main component of trapiche-like sapphire is Al2O3, while the trace elements are Fe, Ti, Mg, Cr, V, Ga, Nb, and Ta, with no significant differences in major elements in the core, arms, or sectors. The trace elements increase and subsequently decrease from the arms to cores to sectors. Most elements are concentrated in the cores, whereas the arms are richer in high-field-strength elements like Nb and Ta. Based on the appearance and trace element data of Changle sapphires, the formation of trapiche-like sapphires is connected to the dissolution of rutile with newly formed holes filled by glassy inclusions during magma evolution.

Author Contributions

Conceptualization, Y.S.; methodology, Y.S., Y.Z. and Z.L.; software, Y.S., G.C. and X.S.; validation, Y.S. and L.Z.; formal analysis, Y.S., L.Z., L.Y. and H.W; investigation, Y.S., L.Z., H.W. and L.Y.; resources, Y.S., D.L. and Z.L.; data curation, Y.S. and X.S.; writing—original draft preparation, Y.S.; writing—review and editing, Y.S., L.Z. and L.Y.; visualization, Y.S. and Y.W.; supervision, Y.S., D.L. and L.Z.; project administration, L.Z.; funding acquisition, L.Z. and L.Y. All authors have read and agreed to the published version of the manuscript.

Funding

This research was financially supported by the National Key Research Program of China (Grant No. 2019YFA0708603), the 111 Project of the Ministry of Science and Technology, China (Grant No. BP0719021), the “Deep-time Digital Earth” Science and Technology Leading Talents Team Funds (Fundamental Research Funds for the Central Universities; grant number: 265202300), and the MOST Special Fund from the State Key Laboratory of Geological Processes and Mineral Resources, China University of Geosciences (Grant No. MSFGPMR201804).

Data Availability Statement

Data is contained within the article.

Acknowledgments

We thank Jun Deng of the China University of Geosciences (Beijing) for his comments and suggestions for this project. The Professional Committee of Tectonophysicochemistry, Chinese Geophysical Society, provided theoretical support.

Conflicts of Interest

The authors declare no conflicts of interest.

References

  1. Schmetzer, K. Trapiche-Type Emeralds from Pakistan. Gems Gemol. 2020, 56, 438. [Google Scholar]
  2. Gao, Y.; Ju, D.; Zhao, Y. Natural Sapphire with Trapiche Pattern Inclusions. Gems Gemol. 2019, 55, 440. [Google Scholar]
  3. Jiang, L.; Liu, Y. Trapiche-like Quartz from Dongwuqi Area, Inner Mongolia, China. Minerals 2023, 13, 967. [Google Scholar] [CrossRef]
  4. Koivula, J.I. Trapiche Muscovite. Gems Gemol. 2015, 51, 323. [Google Scholar]
  5. Behnke, R.E. Trapiche Rhodochrosite. Gems Gemol. 2016, 52, 323. [Google Scholar]
  6. Schmetzer, K.; Bernhardt, H.J.; Hainschwang, T. Chemical and Growth Zoning in Trapiche Tourmaline from Zambia—A Re-Evaluation. J. Gemmol. 2011, 32, 151. [Google Scholar] [CrossRef]
  7. Pignatelli, I.; Guiliani, G.; Ohnenstetter, D.; Agrosi, G.; Mathieu, S.; Morlot, C.; Branquet, Y. Colombian Trapiche Emeralds: Recent Advances in Understanding Their Formation. Gems Gemol. 2015, 51, 222–259. [Google Scholar] [CrossRef]
  8. Sun, Z.-Y.; Muyal, J.; Hand, D. Trapiche-like Amethyst from Brazil. Gems Gemol. 2018, 54, 237. [Google Scholar]
  9. Huang, H.-Z.; Luo, J.; Xu, Y.-L.; Zou, X.-Z.; Jin, J.-W.; Huang, Y.-Q. Spectral Characteristics and Structure of Trapiche Aquamarine. Laser Optoelectron. Prog. 2021, 58, 410–416, (In Chinese with English Abstract). [Google Scholar]
  10. Ding, Z.-H. Study on Inclusions in Megacryst Corundum from Shandong Province II: Chloride and the Composition of Mantle Liquid. Mineral. Petrol. 1999, 1, 17–20. (In Chinese) [Google Scholar]
  11. Mo, X.-X. Magmatism and Deep Geological Process. Earth Sci. 2019, 44, 1487–1493, (In Chinese with English Abstract). [Google Scholar]
  12. Vertriest, W. Trapiche Gems. Gems Gemol. 2020, 56, 170–172. [Google Scholar]
  13. Vertriest, W.; Sangsawong, S.; Pardieu, V. Trapiche-Type Sapphire from Tasmania. Gems Gemol. 2016, 52, 430–431. [Google Scholar]
  14. Lai, X.-J.; Xia, S.-Q. Volcano-Shaped Internal Feature in Trapiche-Like Sapphire. Gems Gemol. 2022, 58, 488–490. [Google Scholar]
  15. Giuliani, G.; Ohnenstetter, D.; Fallick, A.E.; Groat, L.; Fagan, A.J.; Sabatier, U.P. The geology and genesis of gem corundum deposits. In Geology of Gem Deposits; Groat, L.A., Ed.; Mineralogical Association of Canada: Tucson, AZ, USA, 2014; Volume 44, pp. 29–112. [Google Scholar]
  16. Zhao, L.-Q.; Kong, F.-M.; Li, X.-P.; Chen, S.; Wang, W.; Huang, Y.Q. Metallogenic Mechanism of Corundum Megacrysts in Cenozoic Alkaline Basalt. J. Shandong Univ. Sci. Technol. (Nat. Sci.) 2015, 34, 7–27, (In Chinese with English Abstract). [Google Scholar]
  17. Wang, H.-S.; Yang, L.-Q.; Chu, Z.-Y.; Zhang, L.; Li, N.; He, W.-Y.; Zhang, Y.-N.; Wang, Y.-Q. Ancient Metasomatism in the Lithospheric Mantle, Eastern North China Craton: Insights from In-Situ Major and Trace Elements in Garnet Xenocrysts, Mengyin District. Minerals 2023, 13, 1106. [Google Scholar] [CrossRef]
  18. Yang, L.-Q.; Deng, J.; Groves, D.I.; Santosh, M.; He, W.-Y.; Li, N.; Zhang, L.; Zhang, R.-R.; Zhang, H.-R. Metallogenic ‘Factories’ and Resultant Highly Anomalous Mineral Endowment on the Craton Margins of China. Geosci. Front. 2022, 13, 101339. [Google Scholar] [CrossRef]
  19. Deng, J.; Wang, Q.; Zhang, L.; Xue, S.; Liu, X.; Yang, L.; Yang, L.; Qiu, K.-F.; Liang, Y. Metallogenetic Model of Jiaodong-Type Gold Deposits, Eastern China. Sci. China Earth Sci. 2023, 66, 2287–2310. [Google Scholar] [CrossRef]
  20. Jiang, J.; Liu, D.; Zhang, R.-X.; Zhu, X.-C.; You, H. Distribution Characteristics and Metallogenic Conditions of Primary Sapphire Ore in Changle. Inn. Mong. Petrochem. Ind. 2018, 44, 1–3. (In Chinese) [Google Scholar]
  21. He, H.; Deng, C.; Pan, Y.; Deng, T.; Luo, Z.; Sun, J.; Zhu, R. New 40Ar/39Ar Dating Results from the Shanwang Basin, Eastern China: Constraints on the Age of the Shanwang Formation and Associated Biota. Phys. Earth Planet. Inter. 2011, 187, 66–75. [Google Scholar] [CrossRef]
  22. Yu, X.-Y.; Yao, X.-M.; Wang, Y.-F.; Han, P. Characteristics of Tertiary Period Basalt of the Middle Tanlu Fault Belt and the Relationship of Corundum. Geol. Explor. 2000, 3, 28–31. (In Chinese) [Google Scholar]
  23. Yui, T.-F.; Wu, C.-M.; Limtrakun, P.; Sricharn, W.; Boonsoong, A. Oxygen Isotope Studies on Placer Sapphire and Ruby in the Chanthaburi-Trat Alkali Basaltic Gemfield, Thailand. Lithos 2006, 86, 197–211. [Google Scholar] [CrossRef]
  24. Dong, Z.-L.; Chen, X.-M.; Hu, W.-X.; Wang, R.-C.; Zhao, M. Coronas of Corundum Megacrysts in the Neogene Changle Basalt and Its Forming Model. Acta Petrol. Sin. 2006, 86, 197–211, (In Chinese with English Abstract). [Google Scholar]
  25. Deng, J.; Yang, L.-Q.; Groves, D.I.; Zhang, L.; Qiu, K.-F.; Wang, Q.-F. An Integrated Mineral System Model for the Gold Deposits of the Giant Jiaodong Province, Eastern China. Earth-Sci. Rev. 2020, 208, 103274. [Google Scholar] [CrossRef]
  26. Chen, G.-D.; Li, H.-K. Textbook of Research on the Development and Utilization of Geological and Mineral Resources in Changle County; Geology Press: Beijing, China, 2014; p. 248. (In Chinese) [Google Scholar]
  27. Liu, X.-H. The Mineral Chemistry Characteristics and Indication Significance of clinopyroxenes in Cenozonic Alkalic Basalt from Changle, Shandong Province. Master’s Thesis, Shandong University of Science and Technology, Shandong, China, 2019. (In Chinese with English Abstract). [Google Scholar]
  28. Liu, Y.-S.; Hu, Z.-C.; Gao, S.; Günther, D.; Xu, J.; Gao, C.-G.; Chen, H.-H. In situ analysis of major and trace elements of anhydrous minerals by LA-ICP-MS without applying an internal standard. Chem. Geol. 2008, 257, 34–43. [Google Scholar] [CrossRef]
  29. Chen, L.; Liu, Y.; Hu, Z.; Gao, S.; Zong, K.; Chen, H. Accurate determinations of fifty-four major and trace elements in carbonate by LA-ICP-MS using normalization strategy of bulk components as 100%. Chem. Geol. 2011, 284, 283–295. [Google Scholar] [CrossRef]
  30. Wan, Q. The Study on Gemological Characteristics of Nigerian Sapphire. Master’s Thesis, China University of Geosciences, Beijing, China, 2020. (In Chinese with English Abstract). [Google Scholar]
  31. Chen, C.-Y.; Shao, T.; Shen, X.-T. Study on the Relation between the Intensity Distribution of Infrared Absorption Peak at 3309 cm−1 and Trace Elements in Color Zones of Changle Sapphire. Spectrosc. Spectr. Anal. 2020, 40, 2138–2142, (In Chinese with English Abstract). [Google Scholar]
  32. Phlayrahan, A.; Monarumit, N.; Satitkune, S.; Wathanakul, P. Role of Ti Content on the Occurrence of the 3309cm−1 Peak in FTIR Absorption Spectra of Ruby Samples. J. Appl. Spectrosc. 2018, 85, 385–390. [Google Scholar] [CrossRef]
  33. Hughes, E.B.; Perkins, R. Madagascar Sapphire: Low-Temperature Heat Treatment Experiments. Gems Gemol. 2019, 55, 184–197. [Google Scholar] [CrossRef]
  34. Zhang, Z.-J.; He, Y.; Yue, K.-F.; Liu, W.-F. Character of Girdle Band and Its Comparison of Sapphire from Changle, Shandong Province and Penglai, Hainan Province. Miner. Depos. 2002, 21, 938–940. (In Chinese) [Google Scholar]
  35. Cheng, Y.-F. The influence of impurity elements on color of Shandong sapphire. Master’s Thesis, Shandong University, Shandong, China, 2006. (In Chinese with English Abstract). [Google Scholar]
  36. Yu, X.-Y. Gem mineralogical characteristics of Shandong sapphires. Rock Miner. Anal. 1999, 18, 41–45. (In Chinese) [Google Scholar]
  37. Dubinsky, E.V.; Stone-Sundberg, J.; Emmett, J.L. A Quantitative Description of the Causes of Color in Corundum. Gems Gemol. 2020, 56, 2–28. [Google Scholar] [CrossRef]
  38. Zaw, K.; Sutherland, L.; Yui, T.-F.; Meffre, S.; Thu, K. Vanadium-Rich Ruby and Sapphire within Mogok Gemfield, Myanmar: Implications for Gem Color and Genesis. Miner. Depos. 2015, 50, 25–39. [Google Scholar] [CrossRef]
  39. Yu, X.-Y.; Wu, G.-Z.; He, X.-M. Color formation mechanism and improvement of Shandong sapphire. Miner. Depos. 1996, 15, 153–157. (In Chinese) [Google Scholar]
  40. Tippins, H. Charge-Transfer Spectra of Transition-Metal Ions in Corundum. Phys. Rev. 1970, 1, 415. [Google Scholar] [CrossRef]
  41. Fritsch, E.; Rossman, G.R. An Update on Color in Gems. Part 3: Colors Caused by Band Gaps and Physical Phenomena. Gems Gemol. 1988, 24, 81–102. [Google Scholar] [CrossRef]
  42. Zhang, P.-Q. Study on the Relation between Colors and Chemical Compositions of Changle Sapphires in Shandong Province. Shandong Land Resour. 2000, 36–43. (In Chinese) [Google Scholar]
  43. Emmett, J.L.; Douthit, T.R. Heat Treating the Sapphires of Rock Creek, Montana. Gems Gemol. 1993, 29, 250–272. [Google Scholar] [CrossRef]
  44. Moon, A.R.; Phillips, M.R. Defect Clustering and Color in Fe,Ti: Alpha-Al2O3. J. Am. Ceram. Soc. 1994, 77, 356–367. [Google Scholar] [CrossRef]
  45. Han, X.-Z.; Guo, S.-G.; Kang, Y.; Li, Y.-S.; Feng, X.-Q. Colorizing Role of lron and Titanium in Dark Blue Sapphire from Changle, Shandong. J. Chin. Ceram. Soc. 2018, 46, 1483–1488, (In Chinese with English Abstract). [Google Scholar]
  46. Lin, J.-T.; Xin, C.-X.; Li, Y. Spectral Characteristics of “Trapiche Like Sapphire” from Changle, Shandong Province. Spectrosc. Spectr. Anal. 2023, 43, 1199–1204. (In Chinese) [Google Scholar]
  47. Chen, Z.-Y. Gemological characteristics of Shandong Changle sapphire and the influence of heat treatment on it. Master’s Thesis, Hebei GEO University, Hebei, China, 2022. (In Chinese with English Abstract). [Google Scholar]
  48. Li, Y.-Q. “Trapiche Gemological Characteristic of ruby and sapphire. Master’s Thesis, China University of Geosciences, Beijing, China, 2016. (In Chinese with English Abstract). [Google Scholar]
  49. Song, J.-J.; Guo, S.-G. Texture Formation and Spectroscopy Study of Element Partitioning in Trapiche Sapphire. Appl. Laser 2009, 29, 64–67, (In Chinese with English Abstract). [Google Scholar]
  50. Palke, A.C.; Breeding, C.M. The Origin of Needle-like Rutile Inclusions in Natural Gem Corundum: A Combined EPMA, LA-ICP-MS, and nano SIMS Investigation. Am. Mineral. 2017, 102, 1451–1461. [Google Scholar] [CrossRef]
  51. Uher, P.; Giuliani, G.; Szakáll, S.; Fallick, A.; Strunga, V.; Vaculovič, T.; Ozdín, D.; Gregáňová, M. Sapphires Related to Alkali Basalts from the Cerová Highlands, Western Carpathians (Southern Slovakia): Composition and Origin. Geol. Carpath. 2012, 63, 71–82. [Google Scholar] [CrossRef]
  52. Peucat, J.J.; Ruffault, P.; Fritsch, E.; Bouhnik-Le Coz, M.; Simonet, C.; Lasnier, B. Ga/Mg Ratio as a New Geochemical Tool to Differentiate Magmatic from Metamorphic Blue Sapphires. Lithos 2007, 98, 261–274. [Google Scholar] [CrossRef]
  53. Chen, S.; Li, X.-P.; Kong, F.-M.; Zhao, L.-Q.; Chen, H.-K. Mineral Characteristics and Origin Discussion of Corundum/Sapphire in Cenozoic Alkali Basalts of the Changle, Western Shandong, China. Adv. Geosci. 2016, 6, 115. [Google Scholar] [CrossRef]
  54. Niu, X.-W. LA-ICP-MS Analysis and Zoning Research of Sapphire from Changle, Shandong. Master’s Thesis, China University of Geosciences, Beijing, China, 2014. (In Chinese with English Abstract). [Google Scholar]
  55. Yu, X.; Niu, X.; Zhao, L. Characterization and Origin of Zonal Sapphire from Shandong Province, China. JOM 2015, 67, 391–397. [Google Scholar] [CrossRef]
  56. Giuliani, G.; Fallick, A.; Ohnenstetter, D.; Pegere, G. Oxygen Isotopes Composition of Sapphires from the French Massif Central: Implications for the Origin of Gem Corundum in Basaltic Fields. Miner. Depos. 2009, 44, 221–231. [Google Scholar] [CrossRef]
  57. Song, Y.-C.; Hu, W.; Jin, Z.-Y.; Chen, Y. Fluid and Melt Inclusions and their Fluid Species in Corundum Megacrysts from the Basalts in Changle, Shangdong Province, Eastern China. Geochimica 2006, 4, 377–387. [Google Scholar]
  58. Baldwin, L.C.; Tomaschek, F.; Ballhaus, C.; Gerdes, A.; Fonseca, R.O.C.; Wirth, R.; Geisler, T.; Nagel, T. Petrogenesis of Alkaline Basalt-Hosted Sapphire Megacrysts. Petrological and Geochemical Investigations of in Situ Sapphire Occurrences from the Siebengebirge Volcanic Field, Germany. Contrib. Mineral. Petrol. 2017, 172, 43. [Google Scholar] [CrossRef]
Figure 2. (a) Volcanic neck facies, (b,c) hexagonal joints of basalt, (d) vesiculate basalt, (e) magnetite xenolith, (f) peridotite xenolith, (g) feldspar xenolith, (h) sapphire megacryst hosted in basalt. The sample is owned by a local jewelry company.
Minerals 14 00364 g002
Figure 3. Images of rough stone of S01 (a), S02 (b), S03 (c), S04 (d), S05 (e), S06 (f).
Minerals 14 00364 g003
Figure 4. Images of polished samples of S01 (a), S02 (b), S03 (c), S04 (d), S05 (e), S06 (f).
Minerals 14 00364 g004
Figure 5. Infrared reflectance and absorption spectra of different parts of Changle trapiche-like sapphires: arms (a,b), cores (c,d), sectors (e,f).
Minerals 14 00364 g005
Figure 6. Raman spectra of different sections of trapiche-like sapphires in Changle: arms (a), cores (b), sectors (c).
Minerals 14 00364 g006
Figure 7. UV–visible reflectance and absorption spectra of different parts of Changle trapiche-like sapphires: arms (a,b), cores (c,d), sectors (e,f).
Minerals 14 00364 g007
Figure 8. (a) LA-ICP-MS analytical spots of sample S01. (b) Trace element changes of the different domains of the Changle trapiche-like sapphire, from arms to cores to sectors, it shows a trend of increasing and then decreasing. (c) Box plots of trace elements in the core, arms, and sectors. Arms demonstrates a wider range of content. (d) Scatter plot of Mg–Fe elements. (e) Scatter plot of Cr–Fe elements. (f) Scatter plot of Ga–Cr elements.
Minerals 14 00364 g008
Figure 9. (a) LA-ICP-MS analytical spots of sample S02. (b) Trace element changes of the different domains of the Changle trapiche-like sapphire, the core has the highest concentration. (c) Box plots of trace elements in the core, arms, and sectors. The range of elements in the cores is quite variable. (d) Scatter plot of Mg–Fe elements. (e) Scatter plot of Cr–Fe elements. (f) Scatter plots of Ga–Cr elements.
Minerals 14 00364 g009
Figure 10. (a) LA-ICP-MS analytical spots of sample S03. (b) Trace element changes of the different domains of the Changle trapiche-like sapphire, from arms to cores to sectors, it shows a trend of increasing and then decreasing. (c) Box plots of trace elements in the core, arms, and sectors. Arms demonstrates a wider range of content. (d) Scatter plot of Mg–Fe elements. (e) Scatter plot of Cr–Fe elements. (f) Scatter plot of Ga–Cr elements.
Minerals 14 00364 g010
Figure 11. Fe–Mg*100–Ti*10 triangulation of magmatic and metamorphic sapphires [53,54,55].
Minerals 14 00364 g011
Figure 12. Fe vs. Ga (ppm) graphs illustrate the origins of blue sapphires in terms of geology and geography [50,51,52].
Minerals 14 00364 g012
Table 1. Major elements of different sections of samples S01, S02, and S03 from Changle (arms, cores, sectors) (wt.%).
PositionArms CoresSectors
SamplesS01S02S03Av.S01S02S03Av.S01S02S03Av.
MnO0.000.040.010.020.000.030.020.020.000.030.000.01
Cr2O30.000.020.030.010.000.060.030.030.000.000.030.01
V2O30.030.010.010.020.070.000.020.030.000.040.000.01
K2O0.000.000.000.000.030.000.000.010.010.010.000.01
Na2O0.000.010.010.000.030.010.000.010.000.000.010.00
MgO0.010.020.010.010.000.010.010.010.000.020.000.01
Al2O399.3498.6999.0699.0398.8499.2598.8998.9998.6497.6498.8998.39
FeO1.020.981.011.001.341.171.271.260.951.250.941.05
TiO20.020.030.010.020.020.050.040.040.020.060.010.03
SiO20.020.010.020.020.080.040.020.040.010.020.020.01
CaO0.000.010.000.000.020.010.000.010.010.000.000.00
P2O50.000.000.010.000.000.010.000.000.000.000.020.01
Total100.4499.81100.17100.14100.42100.63100.31100.4599.6399.0599.9299.54
Table 2. Trace element content of different sections of sample S01 from Changle (arms, cores, sectors) (ppm).
PositionArmsCoreSectors
PointsS01-1S01-2S01-3S01-4S01-11S01-12S01-13S01-5S01-6S01-7S01-8S01-9S01-10
Mg25.4528.9232.2130.6626.2638.9727.8675.7662.3059.1724.0345.1431.08
Si0.00675.851265.141022.82769.361015.56861.87976.811686.31278.00397.76840.41682.62
P144.93316.45303.15374.74345.76290.96501.59268.2299.35275.42327.96251.24409.69
K0.000.000.000.000.000.000.003.420.000.000.000.000.00
Ti128.25194.25231.46163.99158.05363.84200.51387.82302.14317.06126.32554.33256.36
V25.6629.9430.1228.8927.3934.8027.8740.3837.6234.1528.1135.4630.12
Cr49.377.9511.4721.6927.234.5938.938.077.254.5213.713.570.68
Fe3230.353540.483474.703482.673448.683846.913517.274638.834388.394036.443178.573727.503573.75
Ga235.41250.14264.74253.45246.26242.25236.60296.51305.62286.11248.94240.50238.69
Ge0.001.400.910.140.000.990.300.670.041.110.140.000.36
Rb0.000.030.010.000.030.000.000.010.020.000.000.010.00
Sr0.010.000.000.010.000.000.000.020.010.010.030.020.00
Y0.000.000.000.000.000.000.000.000.010.010.000.000.00
Zr0.020.010.000.020.010.000.000.010.040.000.000.040.01
Nb0.130.060.000.790.020.070.015.641.340.080.000.460.01
Sn0.440.000.510.310.271.160.520.470.680.380.101.830.47
Ba0.000.060.050.210.050.000.000.000.000.030.000.000.08
Hf0.010.010.010.010.000.000.010.000.000.000.010.010.00
Ta0.020.340.050.070.020.380.2022.343.010.510.003.590.09
Th0.020.010.010.180.000.010.000.060.210.000.000.000.00
U0.000.000.000.060.000.000.000.010.030.000.000.000.00
Table 3. Trace element content of different sections of sample S02 from Changle (arms, cores, sectors) (ppm).
PositionArmsCoreSectors
PointsS02-1S02-2S02-3S02-4S02-5S02-6S02-7S02-8S02-9S02-10S02-11S02-12
Mg23.7725.2827.4326.4926.6262.5747.9167.0662.2452.5930.0940.14
Si364.91317.72451.53630.58691.690.00833.69434.1058.44528.67409.71867.82
P169.94349.660.0072.34556.080.00219.3074.05369.97172.79170.87234.78
Ti51.8272.27155.79131.49146.98217.98306.58369.58409.76163.97149.23241.52
V18.4618.5618.2620.8619.0231.5427.2730.9329.6127.4422.2122.49
Cr8.638.336.9634.4455.2524.738.8721.3218.9727.3814.1911.07
Fe3068.583098.703289.863003.393021.743820.533484.543747.093663.463447.313426.763801.26
Ga191.71185.88183.66179.70167.62206.48189.30200.74189.85210.30193.16184.00
Ge0.000.720.280.140.000.480.000.000.170.000.000.27
Rb0.010.010.000.000.010.000.020.010.000.030.010.00
Sr0.020.020.020.040.000.010.000.000.010.010.000.00
Y0.000.000.000.000.000.000.000.000.020.020.000.01
Zr0.030.000.070.000.040.040.020.050.030.040.000.00
Nb0.190.190.150.010.110.900.061.242.421.030.000.00
Sn0.080.000.410.190.000.490.330.360.330.240.320.60
Ba0.000.030.000.030.000.060.020.000.000.000.110.08
Hf0.000.010.010.010.000.010.010.020.020.000.010.00
Ta0.020.010.010.010.013.850.024.068.014.480.020.08
Th0.210.020.070.000.020.080.020.060.080.460.000.01
U0.020.010.030.000.020.010.000.020.020.040.000.00
Table 4. Trace element content of different sections of sample S03 from Changle (arms, cores, sectors) (ppm).
PositionArmsCoreSectors
PointsS03-1S03-2S03-7S03-3S03-4S03-5S03-6S03-8S03-9
Mg24.7730.1645.7554.1856.9661.5449.5219.3321.77
Si210.22600.051020.09559.38608.71716.30379.52812.35609.90
P0.00422.87356.9094.4896.6689.34379.51297.56250.45
Ti136.54135.61431.63305.81245.99387.55445.8469.1695.61
V18.6618.9921.7824.4025.7526.2425.4716.2616.62
Cr2.553.491.552.013.090.001.000.811.96
Fe3132.313153.373976.464090.564249.064316.644013.053045.353164.71
Ga194.64186.01200.72220.73232.43211.44216.48181.04200.55
Ge0.000.360.430.000.730.650.000.000.10
Rb0.000.000.000.000.000.000.000.010.01
Sr0.020.000.000.010.000.000.020.020.00
Y0.000.000.000.010.010.010.000.000.00
Zr0.000.270.000.080.100.000.020.000.00
Nb0.008.210.182.362.742.730.360.000.01
Sn0.060.450.390.560.790.680.120.400.17
Ba0.060.000.000.030.030.030.020.000.00
Hf0.000.040.010.010.000.000.000.010.01
Ta0.010.711.176.688.6512.121.100.010.00
Th0.010.230.020.340.510.030.020.000.00
U0.000.040.010.050.050.000.010.000.00
Disclaimer/Publisher’s Note: The statements, opinions and data contained in all publications are solely those of the individual author(s) and contributor(s) and not of MDPI and/or the editor(s). MDPI and/or the editor(s) disclaim responsibility for any injury to people or property resulting from any ideas, methods, instructions or products referred to in the content.

