Abstract
The drop ball test (DBT) is a common quality control procedure used in many grinding media manufacturing units to evaluate the quality of manufactured balls. Whilst DBTs have provided reasonable data over many years, the quantitative comparison of the energy that the balls are subjected to during the DBT and in high-impact loading environments such as semi-autogenous grinding (SAG) mills remains a grey area. To that end, DBT experiments were conducted, and the discrete element method (DEM) was used to assess the grinding media collision behaviour and the extent of ball impact loading to determine the impact energy spectra of the ball collisions. The impact energy spectra data obtained were used to quantify the energy that the grinding balls are exposed to in the DBT environment. The results showed that larger balls were exposed to relatively higher energy levels and had a higher probability of fracture than smaller balls. Furthermore, early ball breakage in a grinding environment is mostly attributed to the existence of imperfections or pre-existing defaults within the ball, whilst continuous wear is a gradual consequence that deplete balls in the mill.
1. Introduction
In many ore processing plants, comminution is usually a major operating cost component; not only is the size reduction process costly in terms of energy consumption, but it also requires costly media and liner replenishment. For this reason, liner wear and media consumption have been matters of research attention [1,2,3].
With the recent introduction of large SAG mills with diameters reaching over 12 m, the size of balls used has also increased, with diameters of up to 150 mm. The high-stressing conditions resulting thereof have necessitated the use of grinding media with significant fracture toughness, such as forged low-alloy carbon steel balls as compared to wear-resistant high-chrome-white-cast-iron balls. Hence, over the years, more grinding media manufacturers have been looking into improving the fracture toughness of grinding media during production to increase their service life in those high-stressing conditions. The stressing conditions that are responsible for ore fracture, also cause grinding media wear and occasional media fracture, and consequently requiring their replenishment during the grinding process. Grinding media replenishment is the highest above-the-ground cost of operating SAG mills.
However, it is interesting to note that research studies to improve the understanding of the high-impact loading environments in SAG mills and quality control processes such as the drop ball test are sparse in the literature [4,5,6]. The availability of such information is imperative for improving the understanding of the wear and toughness requirements of the grinding media. Furthermore, the information offers an opportunity to reduce the possibility and frequency of grinding media fracture during SAG operations, as well as improve SAG mill efficiency and product quality.
In many grinding operations, the loss of media constitutes a significant cost, and, thus, over the years, methods for estimating and modelling media loss have been developed [1,3,7]. These models assume media of a certain known quality, and, thus, manufacturers have devised standard tests that ensure grinding media of consistent quality is produced. The quality is influenced by the microstructure, hardness, and fracture toughness of the grinding media. The tests used to assess the quality of grinding media are the pin-on-belt (POB) test which determines the resistance of the manufactured balls to wear [8], the dry rubber wheel abrasion test (DRAWT) which evaluates the abrasive wear behaviour of the manufactured grinding media under three-body conditions [9], and the drop ball test (DBT) which estimates the fracture toughness of the manufactured balls [2]. Contrary to the high-stress POB abrasion test, the DRAWT is a low-stress scratching-abrasion test, which closely relates to the attrition or cascading regions within grinding mills [9]. The DBT is a quality control procedure used in typical grinding media manufacturing units to estimate the manufactured balls’ response to fracture. The test involves repeatedly dropping the balls from a certain height onto a hardened platform for a specific number of drops and evaluating their response to fracture.
The DBT has long been considered a reliable tool, determining the quality of manufactured balls by conducting a repeated failure test using a method that is discussed in this work. From this test, the fraction of balls that are damaged at the end of the test indicates the expected performance of the balls in the mill. However, little has been done to quantify the energy that the balls are exposed to in the DBT to predict the ball fracture and how it is related to high-impact loading environments such as semi-autogenous grinding (SAG) mills.
With the current availability of computer-based numerical modelling tools such as the discrete element method (DEM), it is possible to capture in detail the full cycle of events involved in a DBT and relate it to expected ball performance in a milling environment. Using the DEM approach provides a new and exciting prospect that has the potential of further enlightening threshold stress within the manufactured grinding balls. It will also increase the possibility of quantifying the energy, forces, or stresses subjected to the balls in high-impact loading environments such as DBTs. In addition to that, the modelling of such mechanical environments at micro-levels provides an interesting insight into energy transfer during ball collisions, the extent of plastic and elastic deformations, and interactions that can potentially fracture the balls.
Scientists have successfully applied computer-based tools to study the particle collisions, load behaviour, power draw, and impact energy distribution in grinding mills [10,11,12]. However, to date, the use of the DEM to quantify the energy, stress, and forces that grinding balls are exposed to in DBTs and SAG mills has not been studied in depth. Most of the DEM mill research has focused on the effects of grinding variables such as the speed of mill rotation, mill charge level, and size distributions of both the ore and grinding media on output factors such as power draw, grinding rates, and the quality of product [13,14]. The present study aims to apply the DEM to quantify the stress that grinding media are exposed to in the DBT to gain a better understanding of conditions that are responsible for the ball damage and fracture rate. Moreover, from the grinding media manufacturers’ perspective, understanding the mechanical environment under which the grinding media operates aids in evaluating the capabilities of the manufactured grinding media relative to its target service environment. This information also helps the manufacturers to adjust the production parameters accordingly, to produce grinding media that can survive longer in a specific grinding environment.
In some previous work, Bwalya and Chimwani [15] studied the breakage response of particles to repeated impact breakage attempts and found that the breakage probability could be correlated to the material, energy input, and number of breakage attempts. These results were well described by a model that was proposed [16], and is given in Equation (1):
where Pb is the probability of ball fracture, E is the impact energy as given in Equation (1), n is the number of drops, and a and b are model fit constants. Ex0 is the minimal energy required to cause ball fracture given by Equation (2):
x is the particle size.
It must, however, be noted that this formula applies to brittle particles that require only a few breakage attempts, while steel balls have a large capacity to elastically deform and recover, and fatigue failure is only observed after thousands of impact attempts.
2. Materials and Methods
The first part of the experiment involved DBTs at a Scaw local foundry in South Africa on three different ball sizes, 100, 115, and 125 mm, over 1 year. The DBT equipment used is illustrated in Figure 1a and the specifications of the equipment are summarised in Table 1. It should be noted that this is not a tube, but an assemblage of six round bars, that are arranged to create a hollow cross-section as illustrated in Figure 1c. From the DBT, the number of failed balls versus the number of drops were compiled, and this was followed by a DEM simulation to provide a numerical analysis of the DBT.
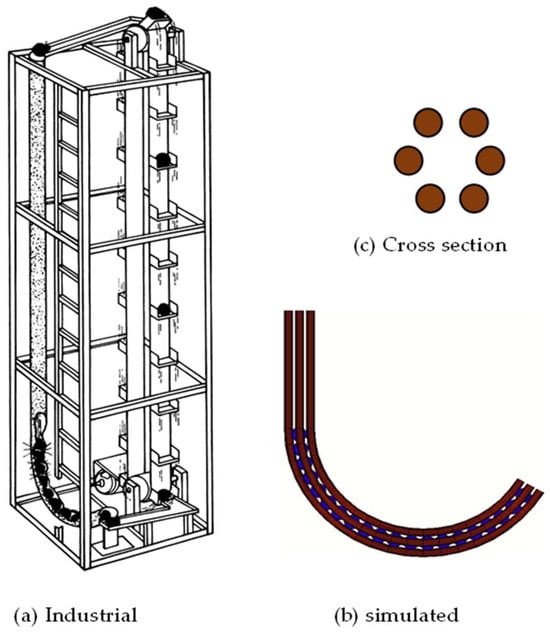
Figure 1.
Schematic cross-section of a drop ball test.

Table 1.
DBT geometrical dimensions for the simulations.
2.1. The DBT Experiment
While there are other ball quality tests available such as the wear test [2], the DBT is a methodology that has been developed by the US Bureau of Mines [16] to estimate the fracture toughness of the manufactured balls based on their response to repeated impact loading as the basis for determining quality.
The DBT used in this work constitutes twenty balls of the same size which are continuously recirculated during the test period. During the test, a ball is dropped from a 10 m height onto a line of 20 balls arranged in a curved section. The shockwave resulting from the impact energy of the free-falling ball is transmitted from the first of the stationary balls. This transmission is repeated through all the balls to the last ball on the free end of the tube, with some energy loss during this process but with enough left to eject the last ball. The ejected ball is rolled down a channel and hoisted back to the top by some conveying mechanism to repeat the cycle. During the test, ejected balls are continuously inspected for damage. Damage can either be by spalling, where a layer of the ball’s surface peels off, or total fracture, which splits the ball into two semi-spheres. Those that are damaged are removed and the number of drops the ball has been subjected to is noted. Meanwhile, a new ball is added to replace the damaged ball.
The energy (E) in J/kg of the free-falling ball on impact can be calculated using the potential energy (PE) given in Equation (3):
where m is the mass of the ball (in kg), g is the acceleration due to gravity (9.81 ms−2), and h is the vertical height through which the ball falls (in m).
E = mgh
Once a collision happens, most of the energy is converted to elastic, wave, and other forms of energy which is transmitted from ball to ball with energy, being continuously dissipated until the last ball is ejected with the remainder of the energy.
DBTs are widely used in grinding media production units and laboratory facilities worldwide and have provided reasonable qualitative data over the years. The data can be about a particular batch of manufactured balls, and, based on the results, a batch can be rejected or approved for use. However, milling environments tend to vary, particularly in SAG mills. The ball and SAG mills used tend to vary in terms of diameters, liner profile, and other operating conditions, making it difficult to predict the performance of a given batch, apart from relying on experience.
2.2. The DEM Simulation of the DBT Experiment
The DEM is a numerical tool that can capture the events in the DBT, and, with the application of appropriate models, the performance of balls of estimated quality can be predicted by simulating any milling environment and computing the energy-loading events each ball experiences. This becomes important with the current larger diameters of mills and balls that are being used nowadays.
To that end, a code was written in Itasca’s Particle Flow Code (PFC) Fish language to generate the DBT geometry, with its lower part shown in Figure 1b. Otherwise, the straight column was 10 m, from which the drop ball was released to fall freely until it encountered the balls that had been generated in the lower curved column.
Since the free-fall time was uneventful, the data capturing of the simulation was only triggered before the falling ball collided with the first ball in the curved column. The sampling of data continued until the end ball had been ejected. Figure 2 summarises the simulation process.
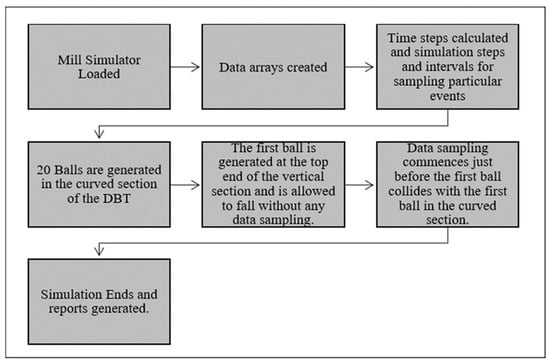
Figure 2.
DBT computational scheme.
The linear spring–dashpot Model, the description of which is given elsewhere [17], was used to model collisions during the simulation. The simulation parameters used, which are coefficient of restitution, coefficient of friction, and material stiffness, among other important parameters, are presented in Table 2.
Table 2.
DBT parameters applied for the simulations.
The number of cycles, i.e., the simulation cycles required up to the time just after collision, are calculated using Equation (4):
where n is the number of cycles, tf is the free flight time, and δt is the time step.
If the number of cycles selected is not enough, the simulation will end before impact occurs; hence, there will be no useful data recorded. The selected number of cycles ensured that the data recording exceeded the impact time since the most important data were from the point of impact onwards.
The time sampling interval refers to the regularity of data recording. The sampling rate used was 0.02 s. This means that data were recorded every 0.02 s and impact occurred after 1.42 s, which would be between the 71st and 72nd intervals. The positions that the balls occupy within the DBT are described below:
- -
- Ball 1 (B1) is the ball dropped off from the top end of the vertical section.
- -
- Ball 2 (B2) is the ball sitting on top in the curved section.
- -
- Balls 3–20 are the balls occupying positions below B2 in the curved section.
- -
- Ball 21 (B21) is the last ball sitting in the curved section. This is the ball that will be projected out after the impact between Ball 1 and Ball 2.
3. Results
3.1. Drop Ball Test (DBT) Results
The results of the DBT experiments are discussed in this section. The three main sizes under study were 100 mm, 115 mm, and 125 mm forged steel balls, and the ball failures were described as either total fracture or spalling. Total fracture is a mode of failure in which the ball breaks into two semi-spheres across either its polar or equatorial diameter. Spalling is described as the chipping off of the ball’s outer surface, exposing the inner part of the ball. After spalling, the ball sometimes retains its shape but with a loss in mass. Table 3 shows the DBT data for the three ball sizes, the graphical presentation of which is shown in Figure 3.
Table 3.
Raw DBT fracture data of various ball sizes.
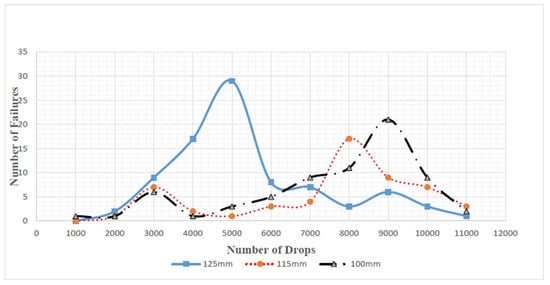
Figure 3.
DBT failure trends—different ball sizes [18].
It is seen from the data in Table 3 that the behaviour of steel balls is very different to that of ore particles that only require a few impacts to break [15], and it is also seen in Figure 3 that defective balls register failure earlier as depicted by the peaks. Once all the defective balls have failed, the rest of the balls are expected to survive the rest of the impact breakage attempts.
During the collision, the large balls are exposed to a higher energy than the smaller balls, while the specific energy per unit mass will be the same based on the PE of the balls being dropped from the same height as given in Equation (1). However, at the point of contact, the larger the ball, the greater the stress, based on the Hertzian contact stress theory that is discussed in the following paragraph.
If two spheres were subjected to some external Force F as illustrated in Figure 4, the point of contact is flattened, creating a circular contact area.
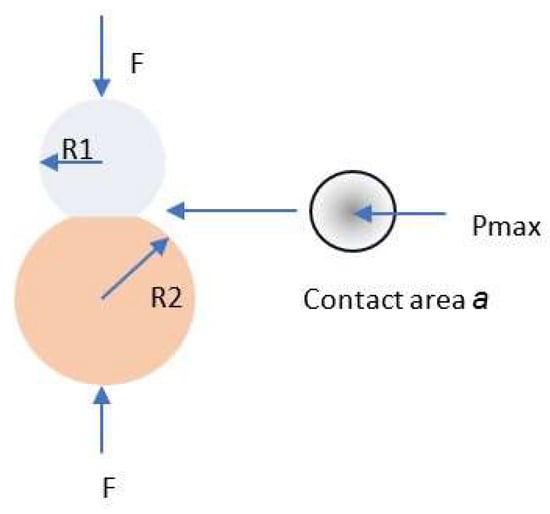
Figure 4.
Deformational contact of two spheres subjected to some external force.
It has been shown that, for two spheres with Young’s moduli and Poisson ratios of En and vn, the area of contact is calculated as follows:
For identical spheres, Equation (5) then simplifies to the following:
It has also been shown that the maximum pressure on the contact point can be represented as follows [19]:
For the steel balls being used in the DBT, the Young’s modulus and Poisson ratio have been given as 210 GPA and 0.28, [20] respectively. If these values are inserted into Equation (7), then the maximum pressures Pmax, for the three ball sizes will be as presented in Table 4:
Table 4.
Maximum pressures at points of contact.
It can be observed that there is an almost perfect linear correlation between the radius and Pmax as shown in Figure 5. However, most importantly from the theoretical perspective, it is shown that larger balls will experience greater stress at the point of contact in a collision.
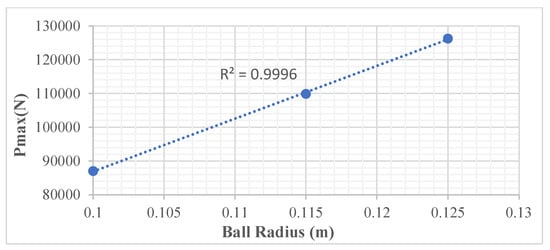
Figure 5.
Maximum contact pressure of different diameter balls.
During the manufacturing of balls, there are probabilities of some balls being flawed in a particular batch, and a DBT can render that batch a reject if an unacceptably high percentage of balls does not survive in 10,000 or so set number of ball drops.
Bigger balls with flaws have a higher propensity to failure than flawed smaller balls due to the higher pressure intensity at contact and the higher likelihood of inherent flaws; thus, the failure occurs in fewer drops than their smaller counterparts.
3.2. Modelling DBT Ball Failure
In Figure 3, it is seen that the number of failed balls is both a function of ball size and number of drops carried out. For brittle particles, the model given in Equation (1) has been used to characterise the breakage probability of failure. A similar approach is proposed for modelling the breakage of the balls in the DBT equipment. However, as discussed by Bwalya and Chimwani [16], different energy input levels are required to determine Ex0, while, in this case, for all the three different ball sizes, the drop height is fixed. Thus, Ex0 is unknown but is, however, a critical parameter that accounts for the size effect on the breakage probability. To fix this problem, Equation (1) was modified, as shown in Equation (8):
where n is a number in thousands of drop attempts and X is the ball size in mm.
Microsoft Excel Solver was used to find the most suitable a, b, and e values. The a, b, and e values obtained for the three tests were 0.00023, 3.36, and 0.88, respectively. It is, thus, apparent that the size effect is not so significant, but more data are required to verify this.
Figure 6 and Figure 7 show the failure cumulative frequency plotted with the probability of fracture model against the number of drops.
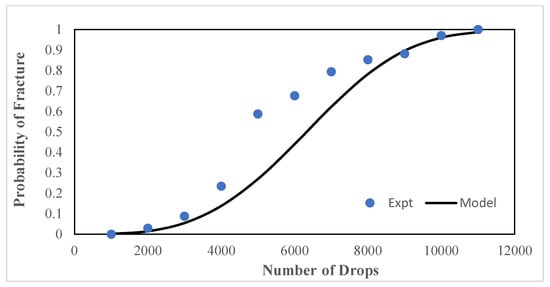
Figure 6.
Probability of failure for 125 mm balls.
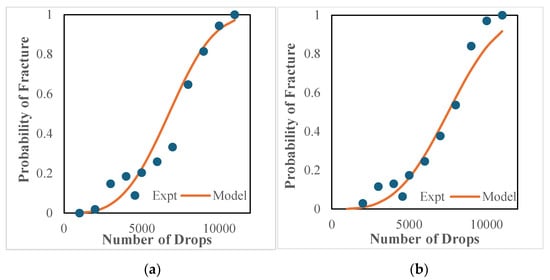
Figure 7.
Probability of failure for (a) 115 mm balls and (b) 100 mm balls.
While the model prediction for 125 mm balls does follow the trend, the actual DBT results exhibit a higher number of ball failures than expected and, thus, deviate substantially in the middle part of the curve.
For Figure 7, the model tracking of the test data is much better for both 115 and 100 mm balls, apart from the expected random test data fluctuations. It can be thus concluded that the model is a good descriptor of the DBT.
3.3. Drop Ball Test (DBT) Simulation
In this section, the details of events that occur from the moment the ball is released at the top of the DBT are captured. From the moment the ball is released, the ball continuously loses its PE as it becomes converted into kinetic energy (KE) until it impacts ball B2 at the top of the curved portion of the tester. In the collision, more than 50% of the energy is transferred to B2, which is instantaneously transferred from ball to ball to the final ball B21. During this transfer, each ball undergoes elastic deformation and recovery but with energy being dissipated in each transfer process. The following figures trace the key energy conversion events that are taking place during the DBT, starting with the history of the first ball from a 10 m height. The set of results for each DBT simulation conducted for the 125 mm, 115 mm, and 100 mm balls were potential, kinetic, and elastic energy, energy loss, and impact energy spectra. Figure 8 shows the PE behaviour of the various ball sizes as they were dropped off from the top end of the vertical section during their respective DBT simulations. Each ball initially possessed its maximum PE prior to drop-off. As the ball falls, the PE gradually drops until the point of impact. After impact, the PE starts to rise again, indicating a rebound after impact.
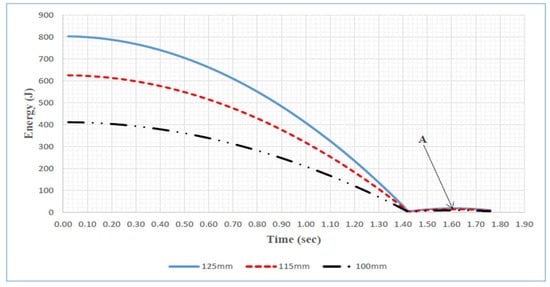
Figure 8.
PE behaviour of the various ball sizes [18].
It is also seen in Figure 8 how all three ball sizes lose their PE over a flight of 1.43 s until a collision occurs with balls in the curved section. Although not clearly defined in Figure 8, it is seen that there is a rebound of balls as shown by a rise in PE indicated at point A. The ball rebound heights presented in Table 5 were more accurately calculated using the KE that has been captured for all the balls in Figure 9. It is apparent from these values that the rebound height is more or less the same for all three sizes.
Table 5.
Various ball-size rebound heights.
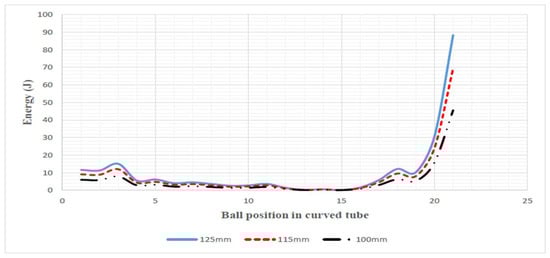
Figure 9.
KE distribution after impact for the various ball sizes [18].
From the KE profile, it was observed that the balls experienced some limited movement, except the central balls: 12–16. It was also observed that the last ball (B21), which is ejected, has the highest KE for all three sizes and that, the bigger the balls, the higher the energy involved at all levels. However, when the velocities are computed as shown in Table 6, they remain almost similar for all the ball sizes at all positions.
Table 6.
Highlights of the KE distribution in the DBT system after Ball 1 impact.
The balls sitting in positions 12–16 barely move, partly because those positions are central and represent the centre of mass of the curved section. The cumulative weight of the balls from either side of B12−B16 is centralised at these positions. However, Ball 3 and Ball 17 have local peaks, which could probably be points where the entire system tries to relieve some energy.
3.4. Elastic Energy
Elastic energy refers to the energy stored by the ball in a state of compression. Physically, this will cause temporal deformation, but shape recovery occurs immediately after the forces are removed. The DEM simulator accounts for these losses by using the linear-spring–dashpot to calculate energy dissipation, and, thus, there is a decreasing elastic energy trend due to losses at each point of contact as you move from Ball 1 to Ball 21 as seen in Figure 10. The losses are correspondingly steeper for bigger balls. This happens because, the bigger the balls, the higher the level of interaction with the guard rails hosting the balls, thus resulting in higher energy loss. This is also confirmed by the energy transfer data given in Table 7, where it is shown that, the smaller the ball, the higher the percentage of energy transferred from Ball 1 to Ball 2. This may be mostly due to the contact angle at collision, which is discussed further later.
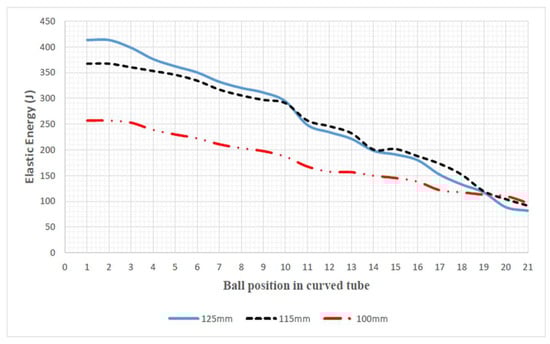
Figure 10.
Elastic energy distribution after the collision for the various ball sizes [18].
Table 7.
Energy transfer between Ball 1 and Ball 2 after collision for the various ball sizes.
3.5. Effect of Structural Misalignment
During or after DBT machine maintenance, the vertical and curved sections might be misaligned by a few millimetres. This results in a cushioning of the impact energy between the colliding balls. Simulations were conducted for the three ball sizes with a 10 mm misalignment between the vertical and curved sections. This resulted in a 3.2%, 3.7%, and 4.3% drop in the elastic energy transferred to the next ball for 125 mm, 115 mm, and 100 mm balls, respectively. Further misalignment between the two sections resulted in more energy being cushioned, which, in turn, decreased the energy that the balls are exposed to in the collision impacts.
From all the energy transmissions and conversions, it is observed that the main contributor to ball damage in a DBT test process is the direct impact when the free-falling ball collides with the first ball at the beginning of the curve section. It is, thus, possible to theoretically compute the main energy levels without the use of a simulator. However, relating this to the actual intensity of a comminution environment would require DEM simulations, as this tool can capture all the ball interactive events represented by the simulation period.
4. Conclusions
Using the DEM, it has been possible to analyse the collision behaviour of different ball sizes and energy involved during ball collisions in the DBT. It has been shown that the most significant contributor to ball damage is at the point of a free-falling ball hitting the first ball in the curved section, and, thus, a simple calculation based on PE can adequately determine the maximum impact energy that the ball would experience. The quality of the balls plays a role, and an unusually high failure rate can be experienced during the DBT routine and can indicate a corresponding poor performance in a milling environment. The DEM can be used to predict ball performance in mills by simulating the collision events that a ball would be subjected to and, thus, apply DBT data more effectively. However, even in the absence of the DBT, DEM simulations can be used to test balls of different diameters and different mill diameters. This would, however, rely on other qualitative ball tests. This early work shows that there is future potential for linking these simulation results to other qualitative tests and minimising the DBTs required.
Author Contributions
Conceptualisation, M.M.B., N.C. and O.S.S.; methodology, M.M.B. and O.S.S.; software, M.M.B.; validation, M.M.B., N.C. and O.S.S.; formal analysis, M.M.B., N.C. and O.S.S.; investigation, O.S.S.; resources, M.M.B.; data curation, M.M.B. and O.S.S.; writing—original draft preparation, O.S.S.; writing—review and editing, M.M.B., N.C. and O.S.S.; visualisation, M.M.B.; supervision, M.M.B. and N.C.; project administration, M.M.B.; funding acquisition, M.M.B. All authors have read and agreed to the published version of the manuscript.
Funding
This research received no external funding.
Data Availability Statement
Data will be shared upon request.
Conflicts of Interest
The authors declare no conflicts of interest.
References
- Bond, F. Metal wear in crushing and grinding. In Proceedings of the 54th Annual Meeting AIME, Houston, TX, USA, 3 December 1963; pp. 1–10. [Google Scholar]
- Blickensderfer, R.; Tylczak, J. A large-scale impact spalling test. Wear 1983, 84, 361–373. [Google Scholar] [CrossRef]
- Sepúlveda, J.E. Methodologies for the evaluation of grinding media consumption rates at full plant scale. Miner. Eng. 2004, 17, 1269–1279. [Google Scholar] [CrossRef]
- Muzinda, A.; Muvunzi, R.; Maware, C. Quality improvement in the production process of grinding balls. Int. J. Eng. Sci. Res. Technol. 2013, 2, 2319–2323. [Google Scholar]
- Aldrich, C. Consumption of steel grinding media in mills—A review. Miner. Eng. 2013, 49, 77–91. [Google Scholar] [CrossRef]
- Chenje, T.; Simbi, D.; Navara, E. The role of corrosive wear during laboratory milling. Miner. Eng. 2003, 16, 619–624. [Google Scholar] [CrossRef]
- Austin, L.; Klimpel, R. Ball wear and ball size distributions in tumbling ball mills. Powder Technol. 1985, 41, 279–286. [Google Scholar] [CrossRef]
- Moema, J.S.; Papo, M.J.; Slabbert, G.A.; Zimba, J. Grinding media quality assurance for the comminution of gold ores. In Proceedings of the World Gold Conference 2009, Johannesburg, South Africa, 26–30 October 2009; The Southern African Institute of Mining and Metallurgy: Johannesburg, South Africa, 2009. [Google Scholar]
- Stevenson, A.N.J.; Hutchings, I.M. Development of the dry sand/rubber wheel abrasion test. Wear 1996, 195, 232–240. [Google Scholar] [CrossRef]
- Radziszewski, P.; Tarasiewicz, S. Simulation of ball charge and liner wear. Wear 1993, 169, 77–85. [Google Scholar] [CrossRef]
- Guerrero, F.; Bouchard, J.; Poulin, É.; Sbarbaro, D. Real-Time Simulation and Control of a SAG Mill. IFAC-Pap. 2016, 49, 61–66. [Google Scholar] [CrossRef]
- Salazar, J.-L.; Valdés-González, H.; Vyhmesiter, E.; Cubillos, F. Model predictive control of semiautogenous mills (sag). Miner. Eng. 2014, 64, 92–96. [Google Scholar] [CrossRef]
- Sun, Y.I.; Dong, M.; Mao, Y.; Fan, D. Analysis on Grinding media Motion in Ball Mill by Discrete Element Method. Manuf. Eng. Qual. Prod. Syst. 2009, 1, 227–231. [Google Scholar]
- Deniz, V. The effects of ball filling and ball diameter on kinetic breakage parameters of barite powder. Adv. Powder Technol. 2012, 23, 640–646. [Google Scholar] [CrossRef]
- Bwalya, M.M.; Chimwani, N. Development of a More Descriptive Particle Breakage Probability Model. Minerals 2020, 10, 710. [Google Scholar] [CrossRef]
- Blickensderfer, R.; Tylczak, J.H.; Madsen, B.W. Laboratory Wear Testing Capabilities of the Bureau of Mines; Bureau of Mines: Washington, DC, USA, 1985; pp. 1–53.
- Cleary, P. Modelling comminution devices using DEM. Int. J. Numer. Anal. Methods Geomech. 2001, 25, 83–105. [Google Scholar] [CrossRef]
- Samukute, S.O. Using the DEM to Relate Drop Ball Tests to Semi-Autogenous Grinding. Master’s Dissertation, University of the Witwatersrand, Johannesburg, South Africa, 2019. Available online: https://hdl.handle.net/10539/29062 (accessed on 15 October 2023).
- de Souza, J.; Nascimento, I.; Moreira, S.; Cavalcanti, S.; Medeiros, J. Hertz theory × experiment: Contact parameters in sphere-plan configuration for composites of polyester/glass fiber against a steel sphere in quasistatics tests. In Proceedings of the 21st Brazilian Congress of Mechanical Engineering, Natal, Brazil, 24–28 October 2011. [Google Scholar]
- Nozdrzykowski, K.; Grządziel, Z.; Dunaj, P. Analysis of Contact Deformations in Support Systems Using Roller Prisms. Materials 2021, 14, 2644. [Google Scholar] [CrossRef]
Disclaimer/Publisher’s Note: The statements, opinions and data contained in all publications are solely those of the individual author(s) and contributor(s) and not of MDPI and/or the editor(s). MDPI and/or the editor(s) disclaim responsibility for any injury to people or property resulting from any ideas, methods, instructions or products referred to in the content. |
© 2024 by the authors. Licensee MDPI, Basel, Switzerland. This article is an open access article distributed under the terms and conditions of the Creative Commons Attribution (CC BY) license (https://creativecommons.org/licenses/by/4.0/).