


Ore Genesis of the Lower Urgen Porphyry Molybdenum Deposit in the Northern Great Xing’an Range, Northeast China: Constraints from Molybdenite Re-Os Dating, Fluid Inclusions, and H-O-S-Pb Isotopes

 ,
,
Abstract
:1. Introduction
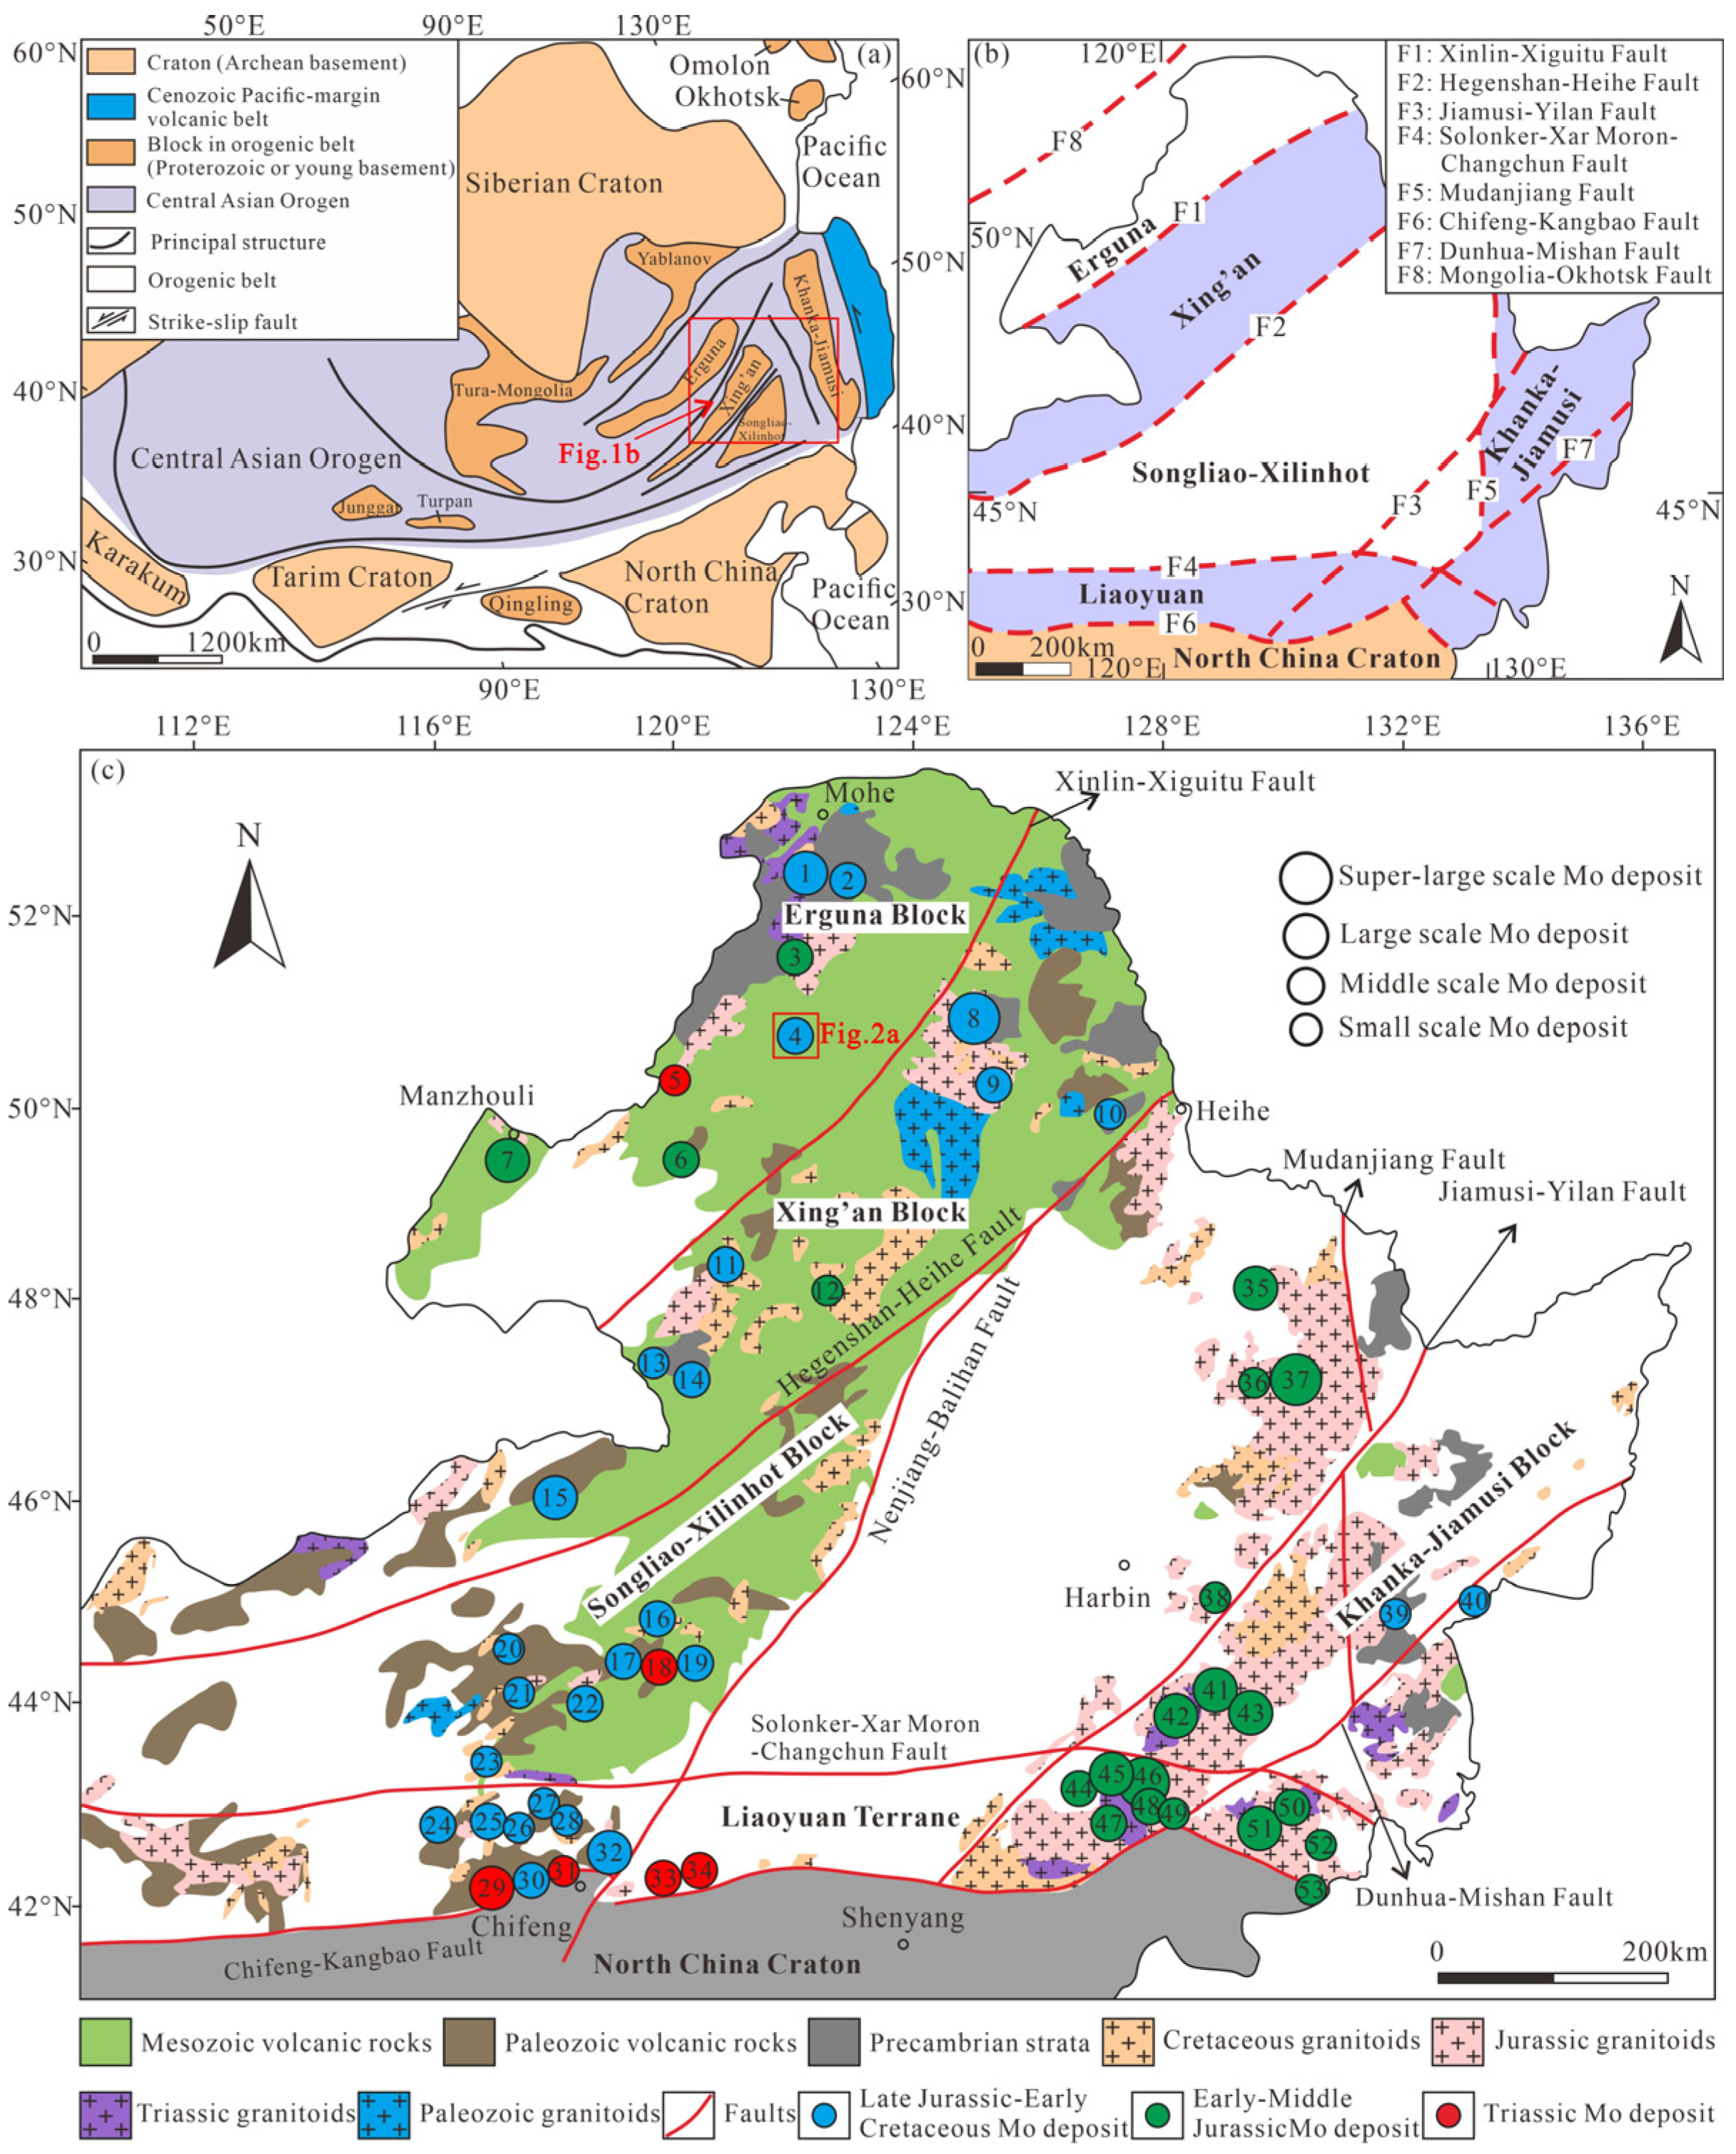
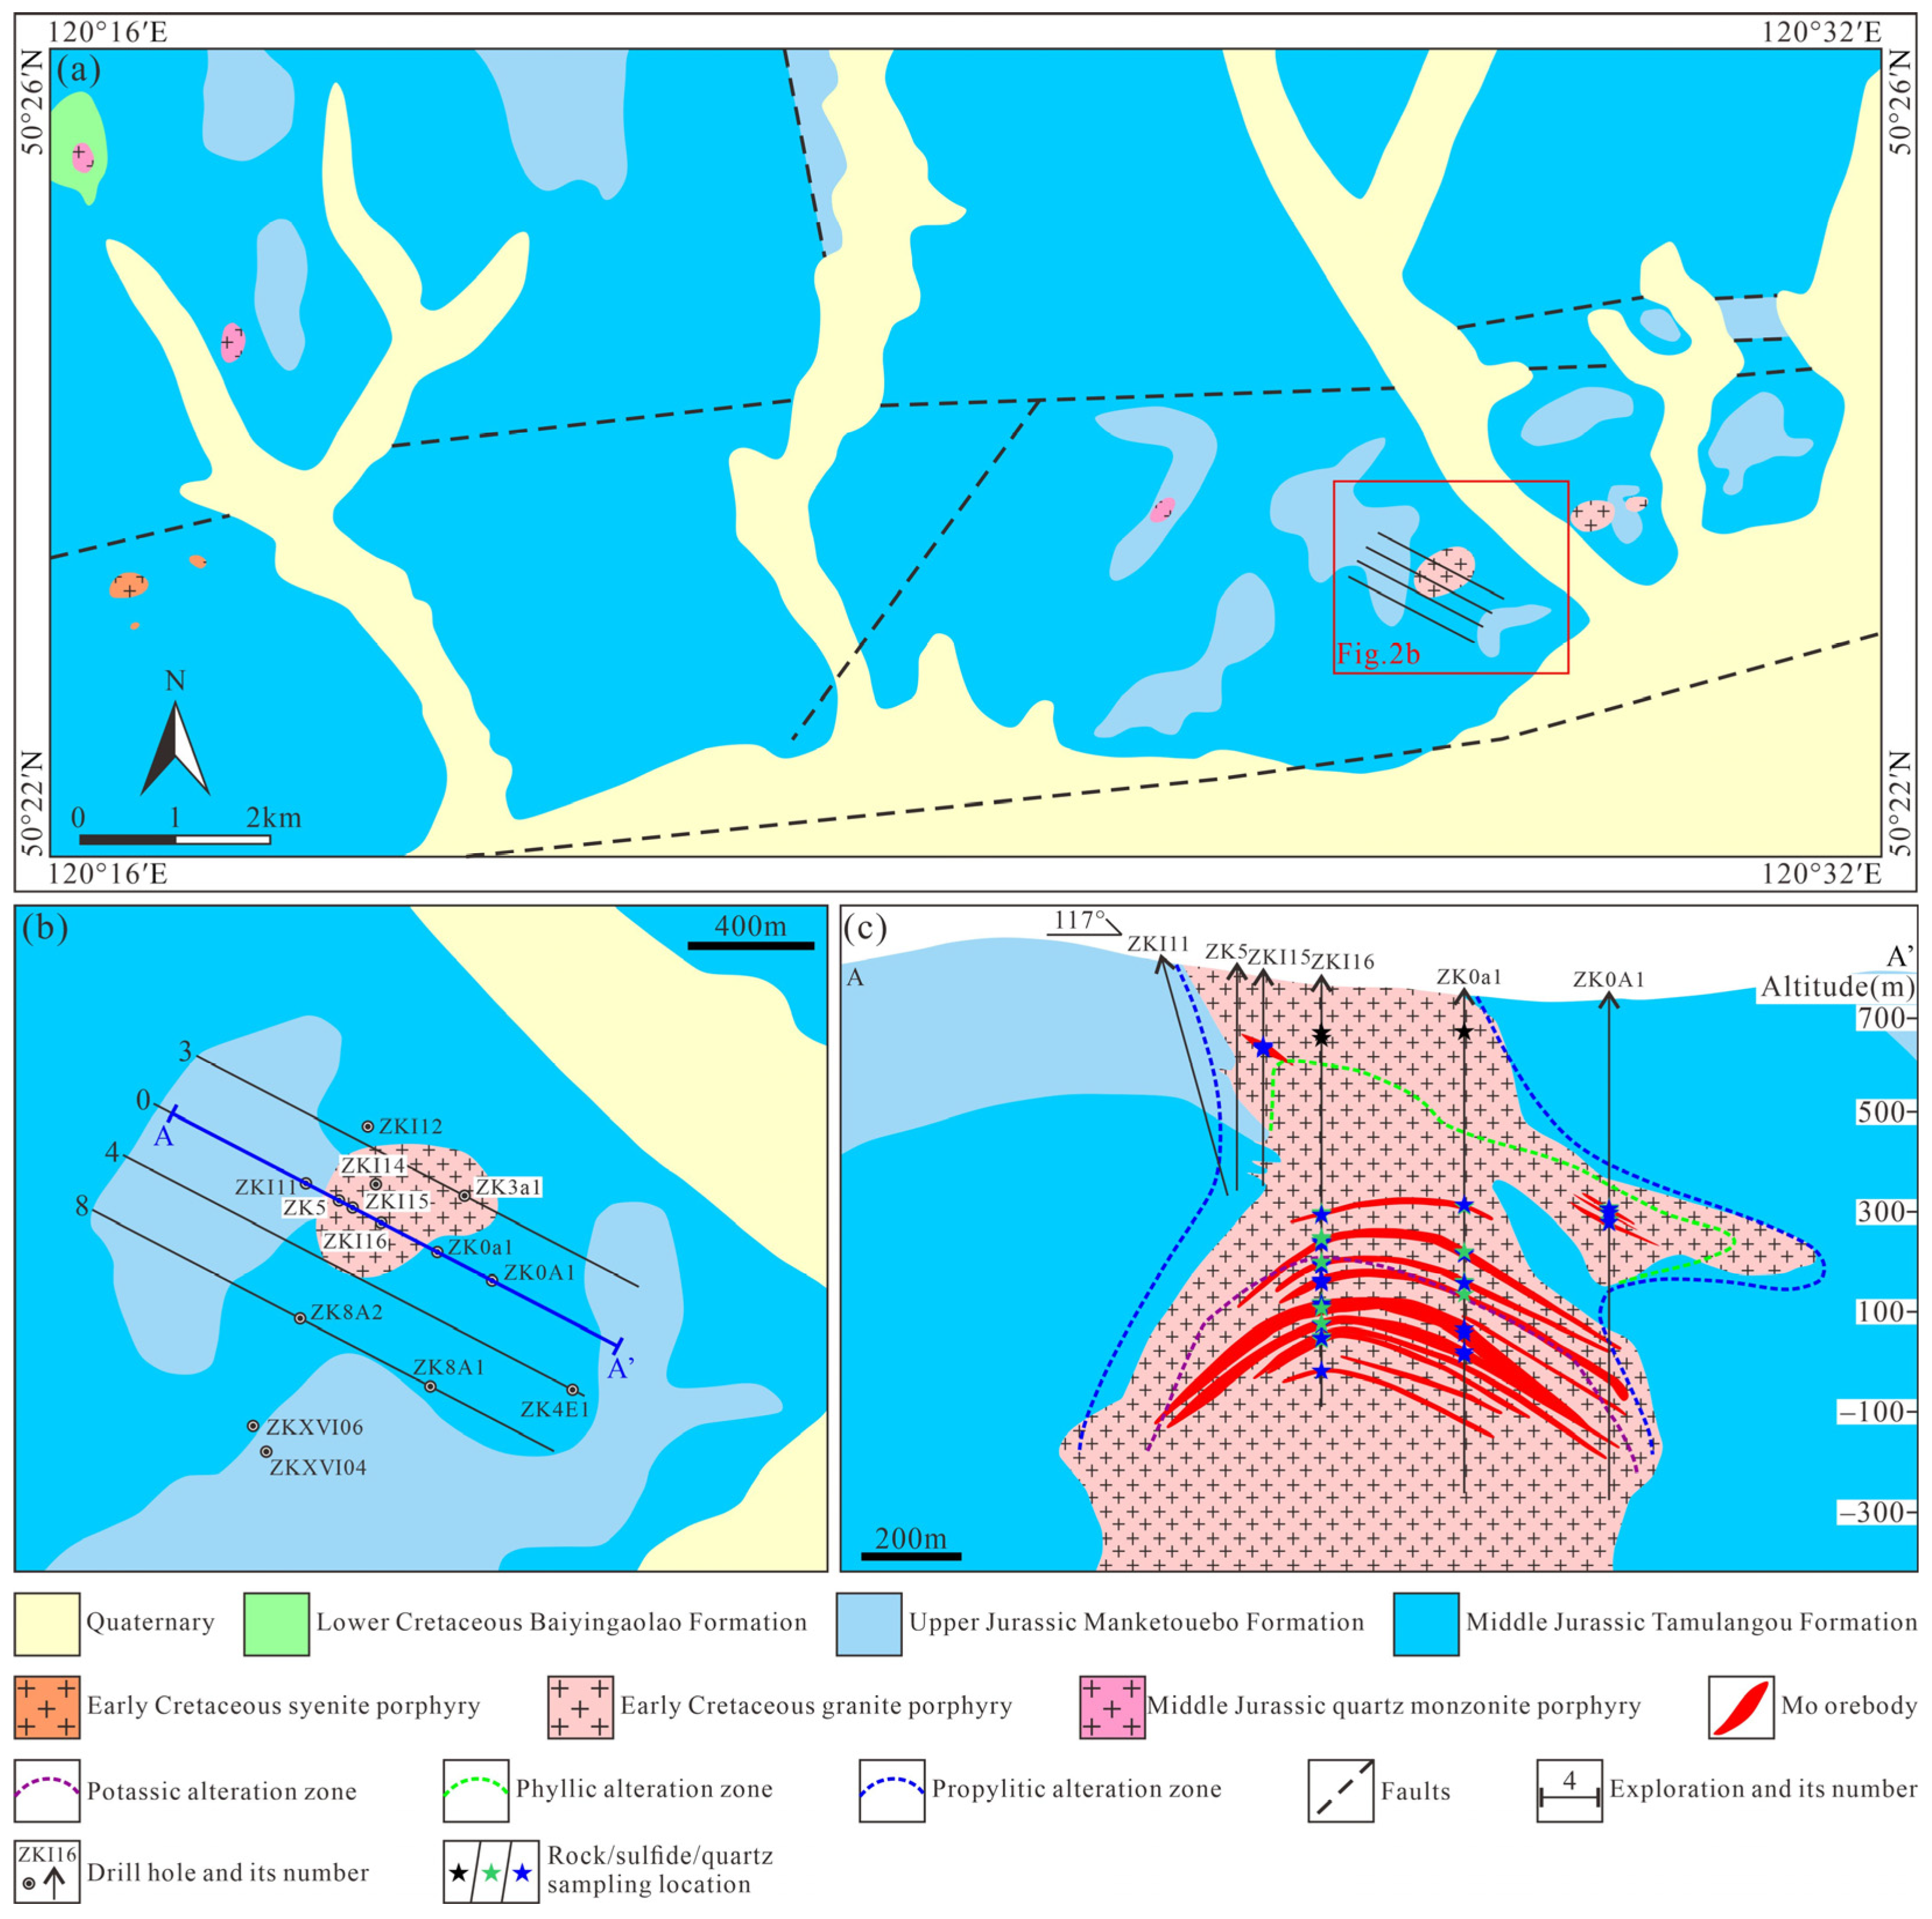
2. Regional Geology
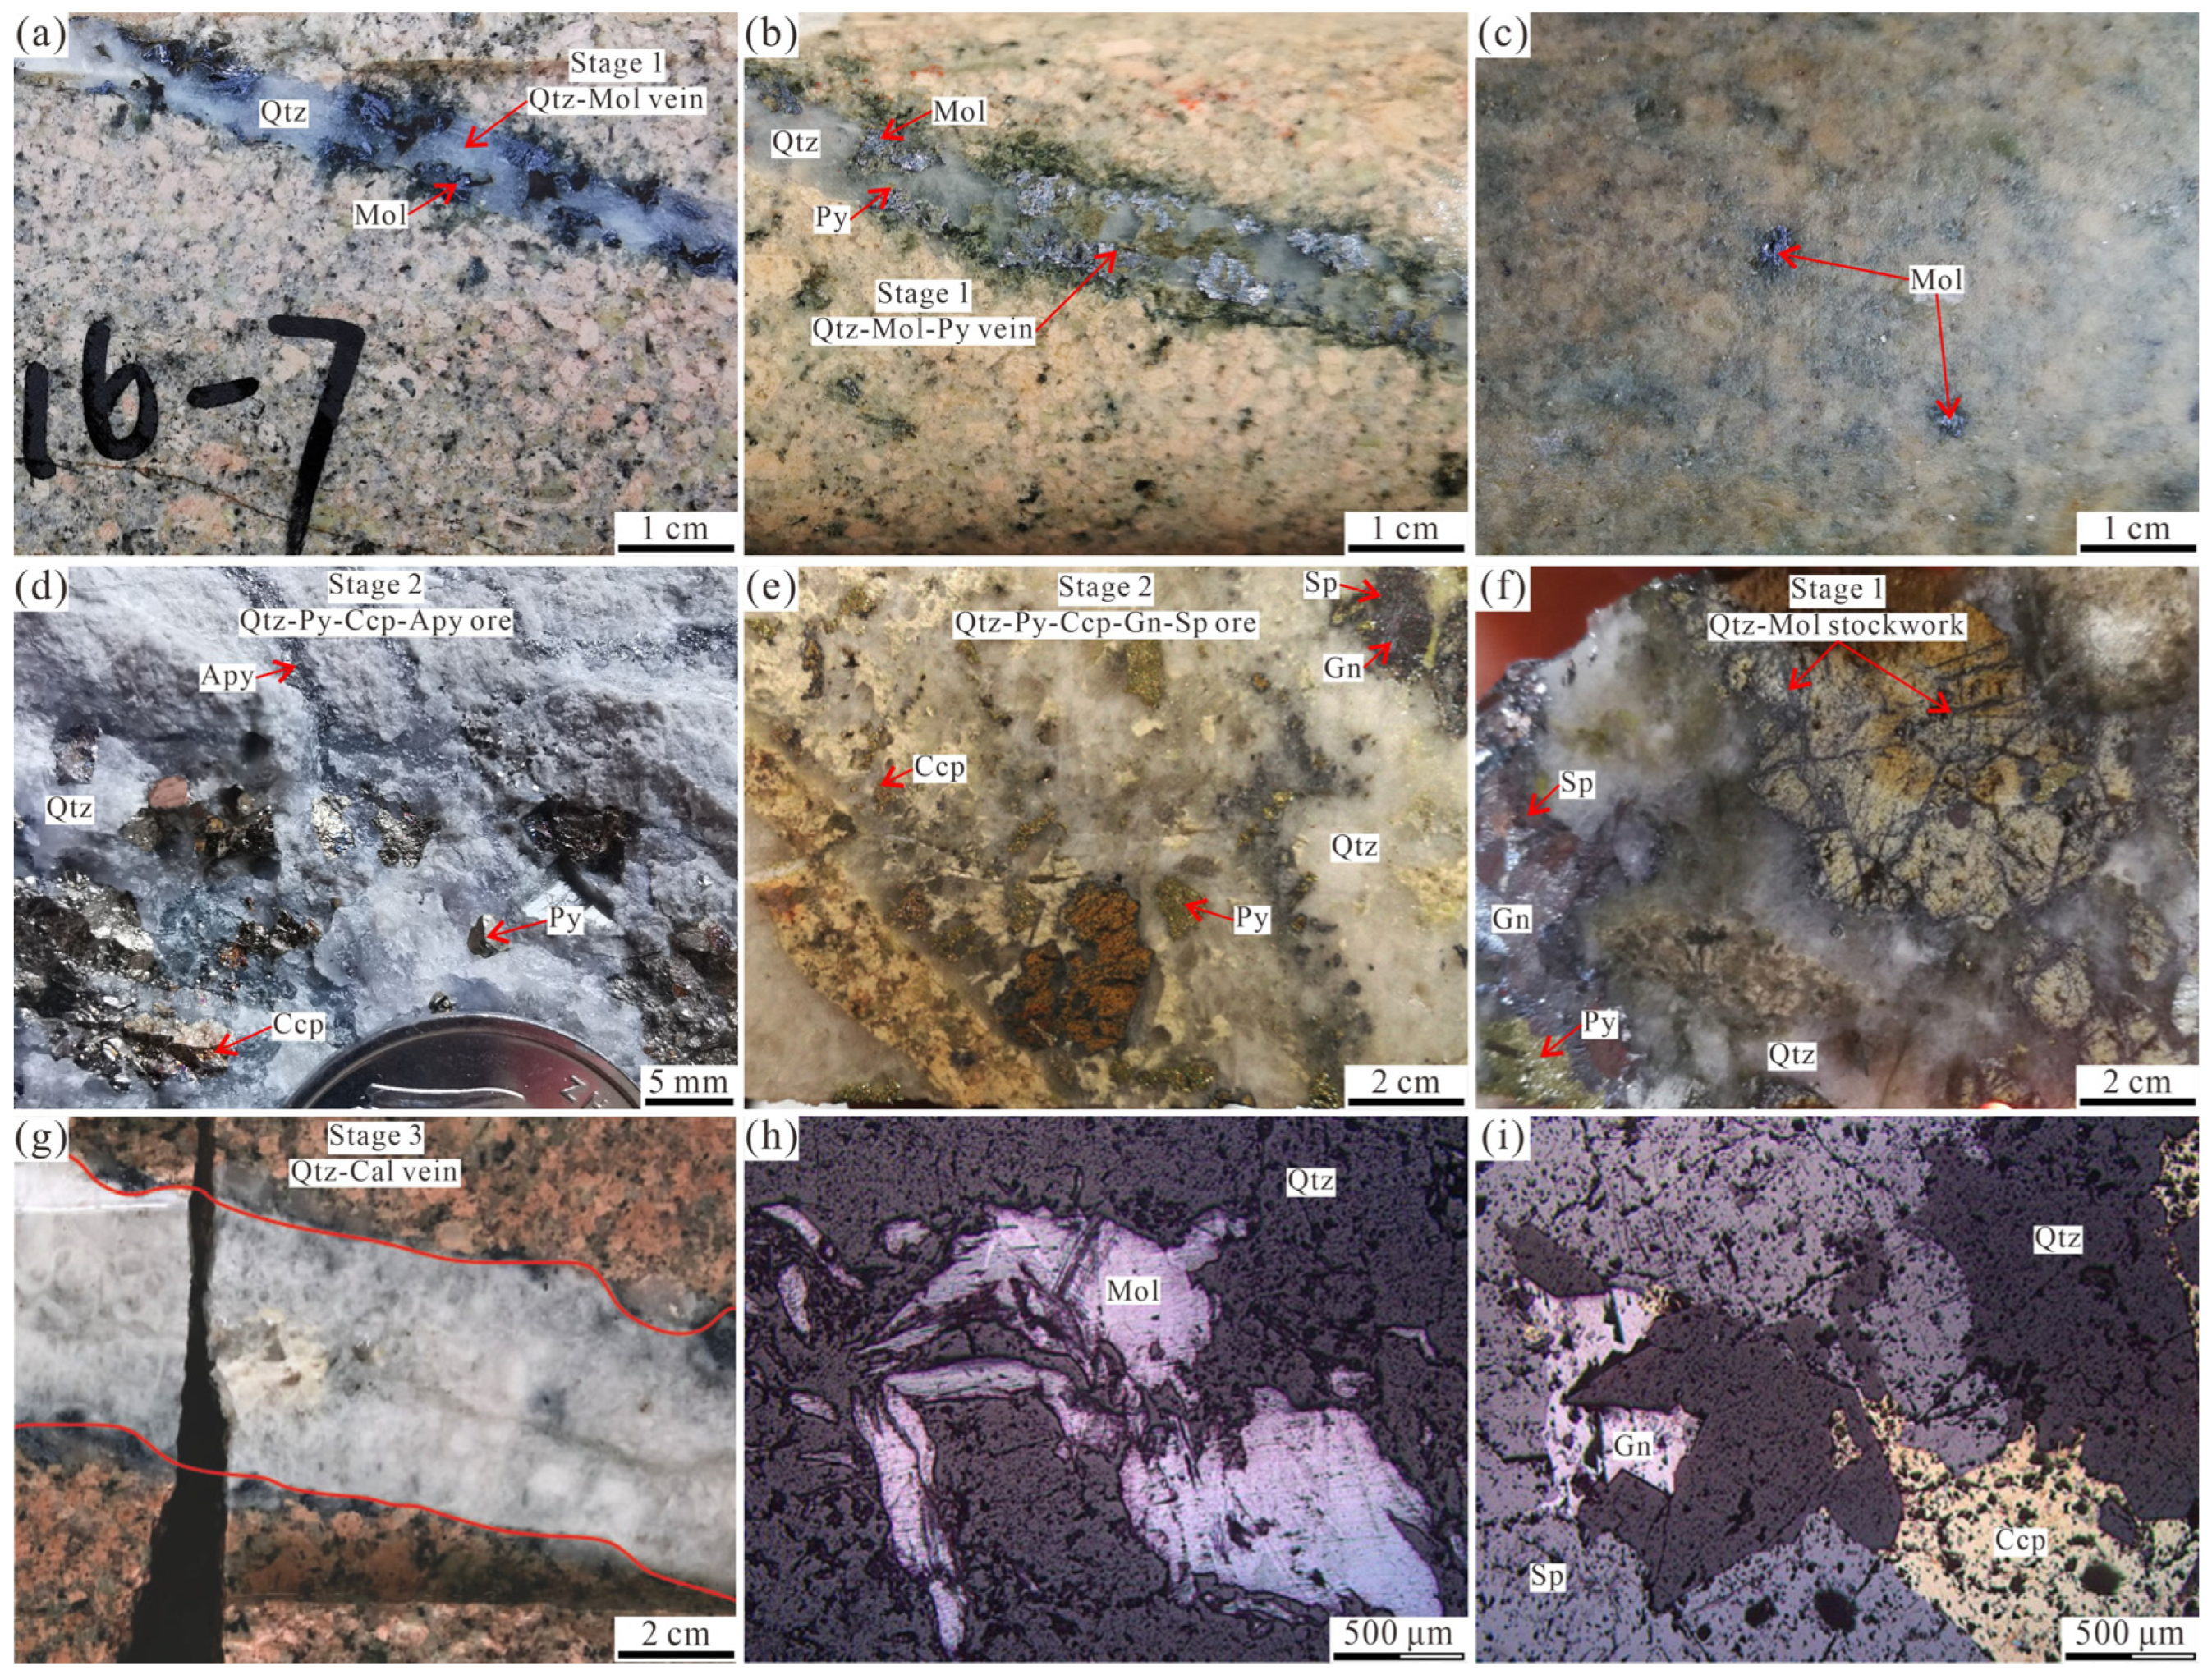
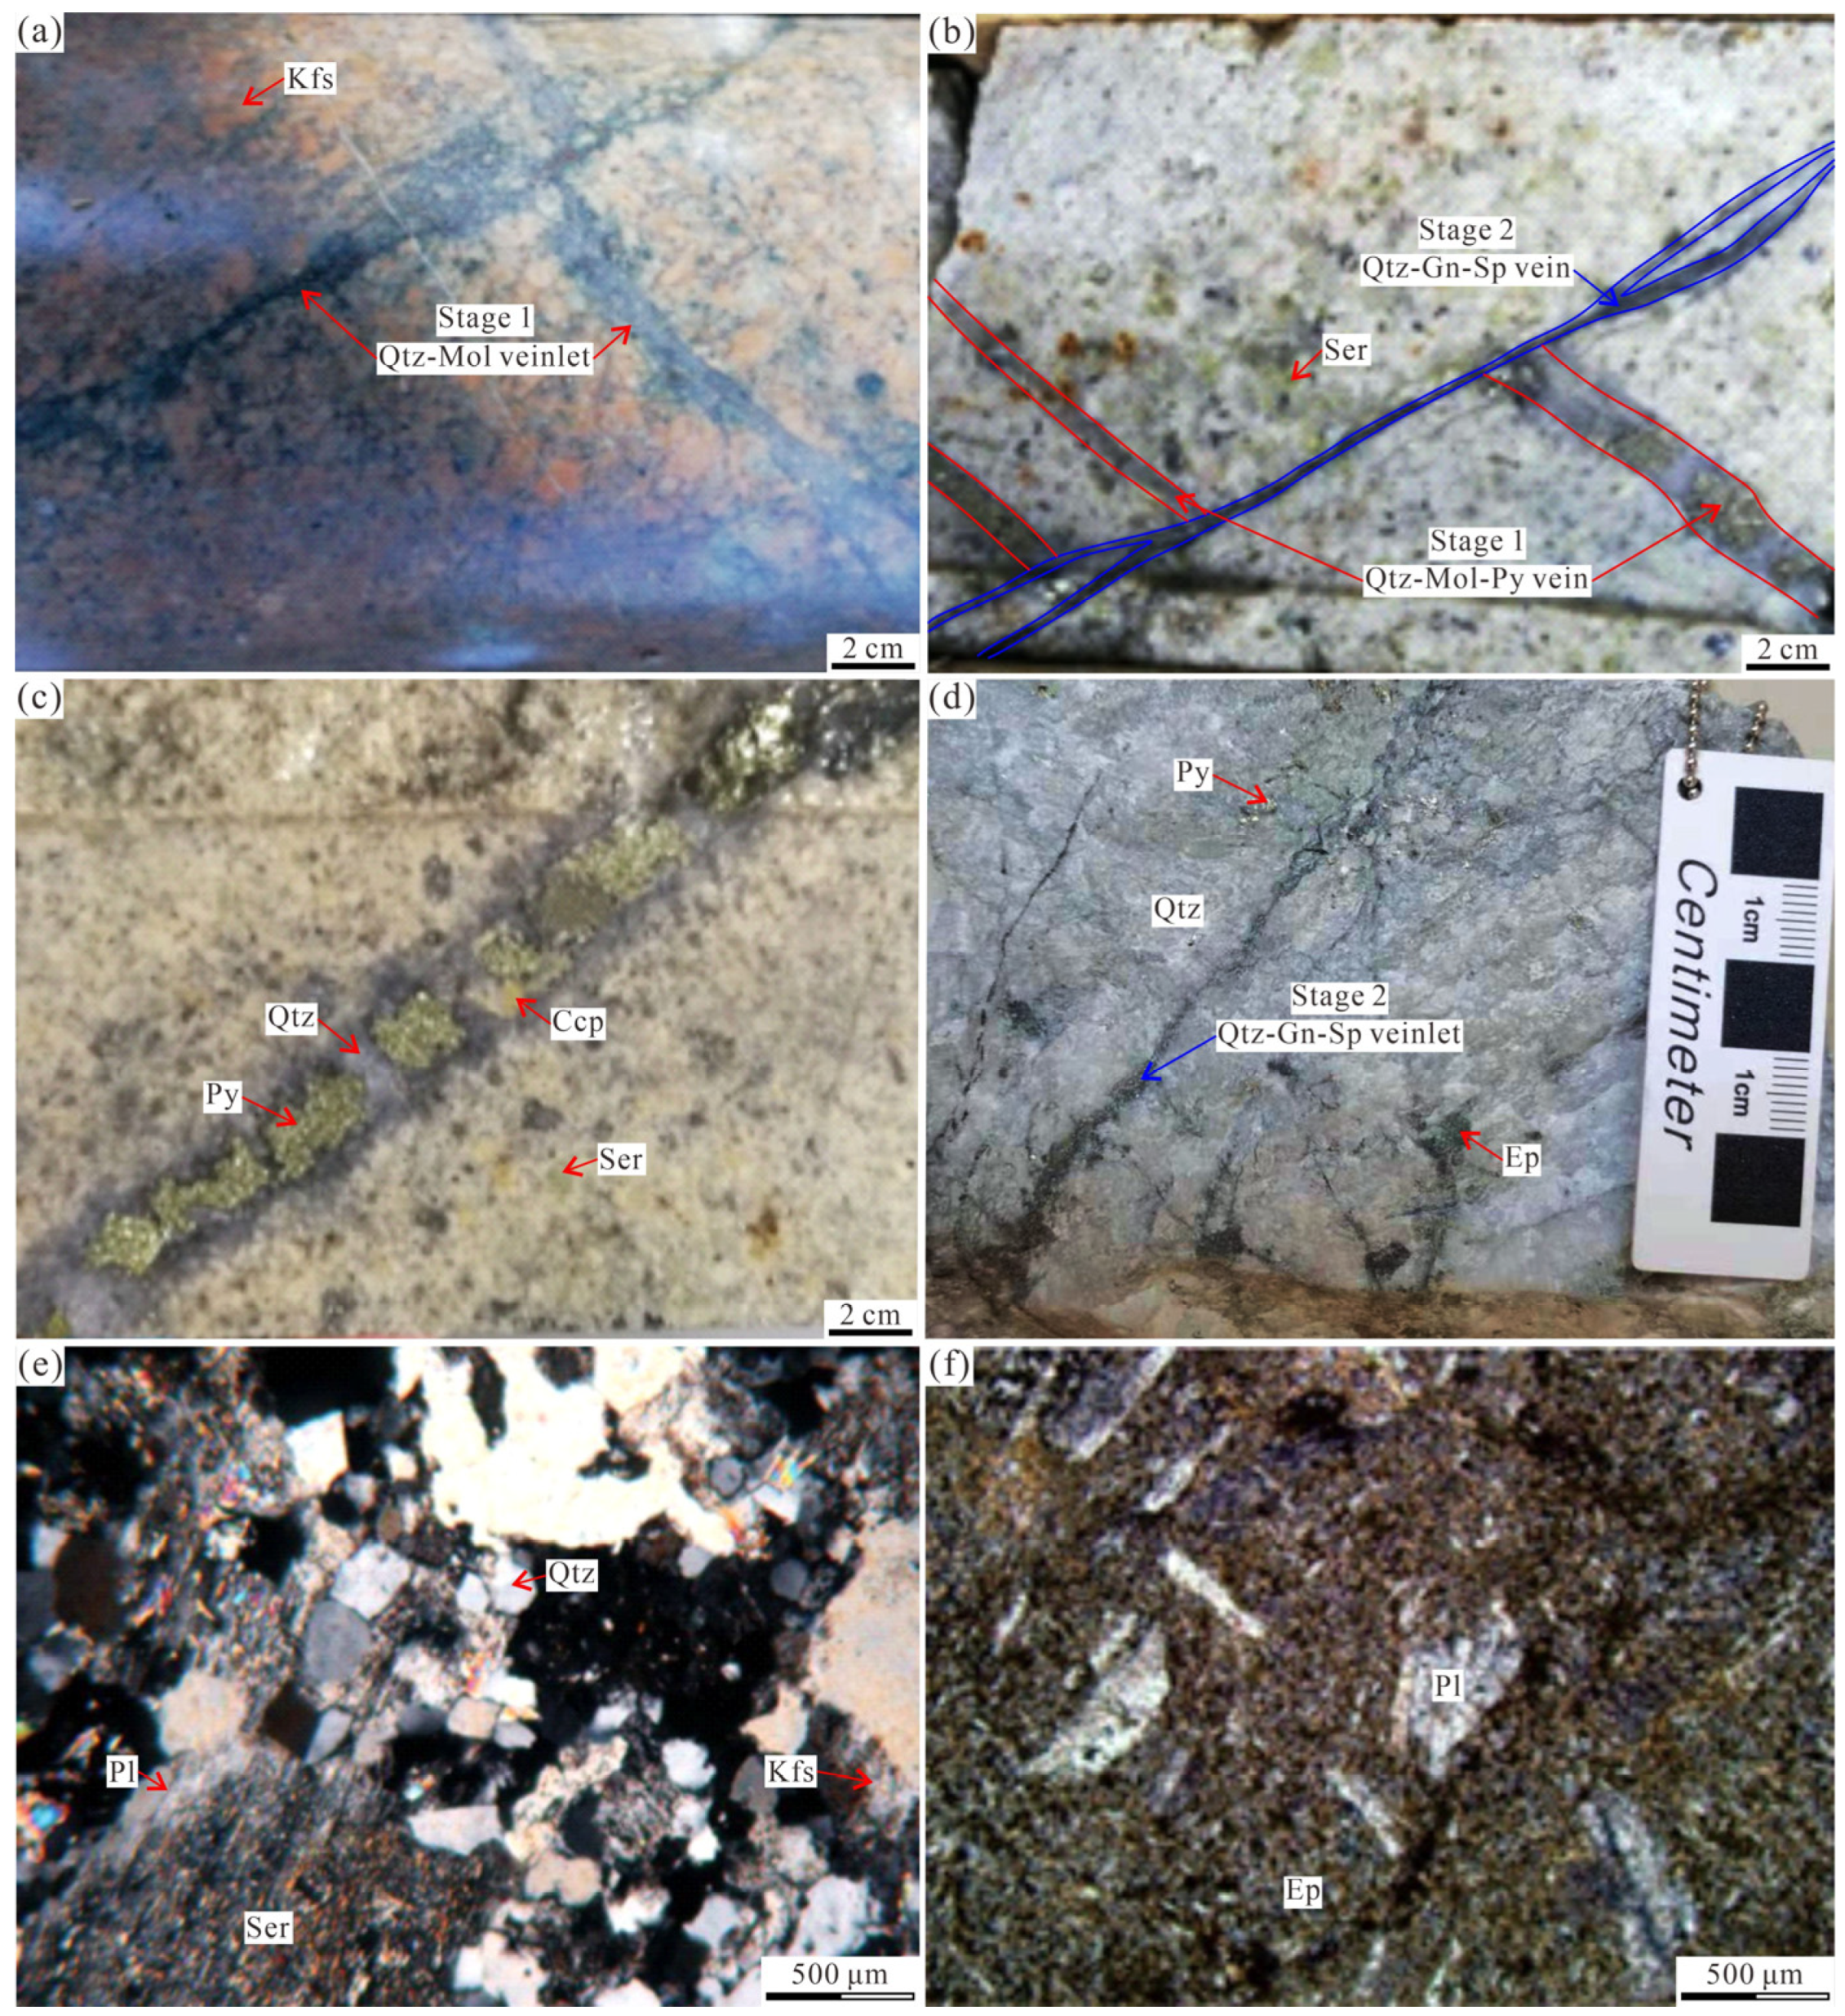
3. Ore Deposit Geology
4. Sampling and Analytical Methods
4.1. Samples
4.2. Molybdenite Re-Os Isotope Dating
4.3. FIs Laser Raman Spectroscopy
4.4. FIs Microthermometry
4.5. Quartz H-O Isotopes
4.6. S-Pb Isotopes
5. Results
5.1. Molybdenite Re-Os Ages
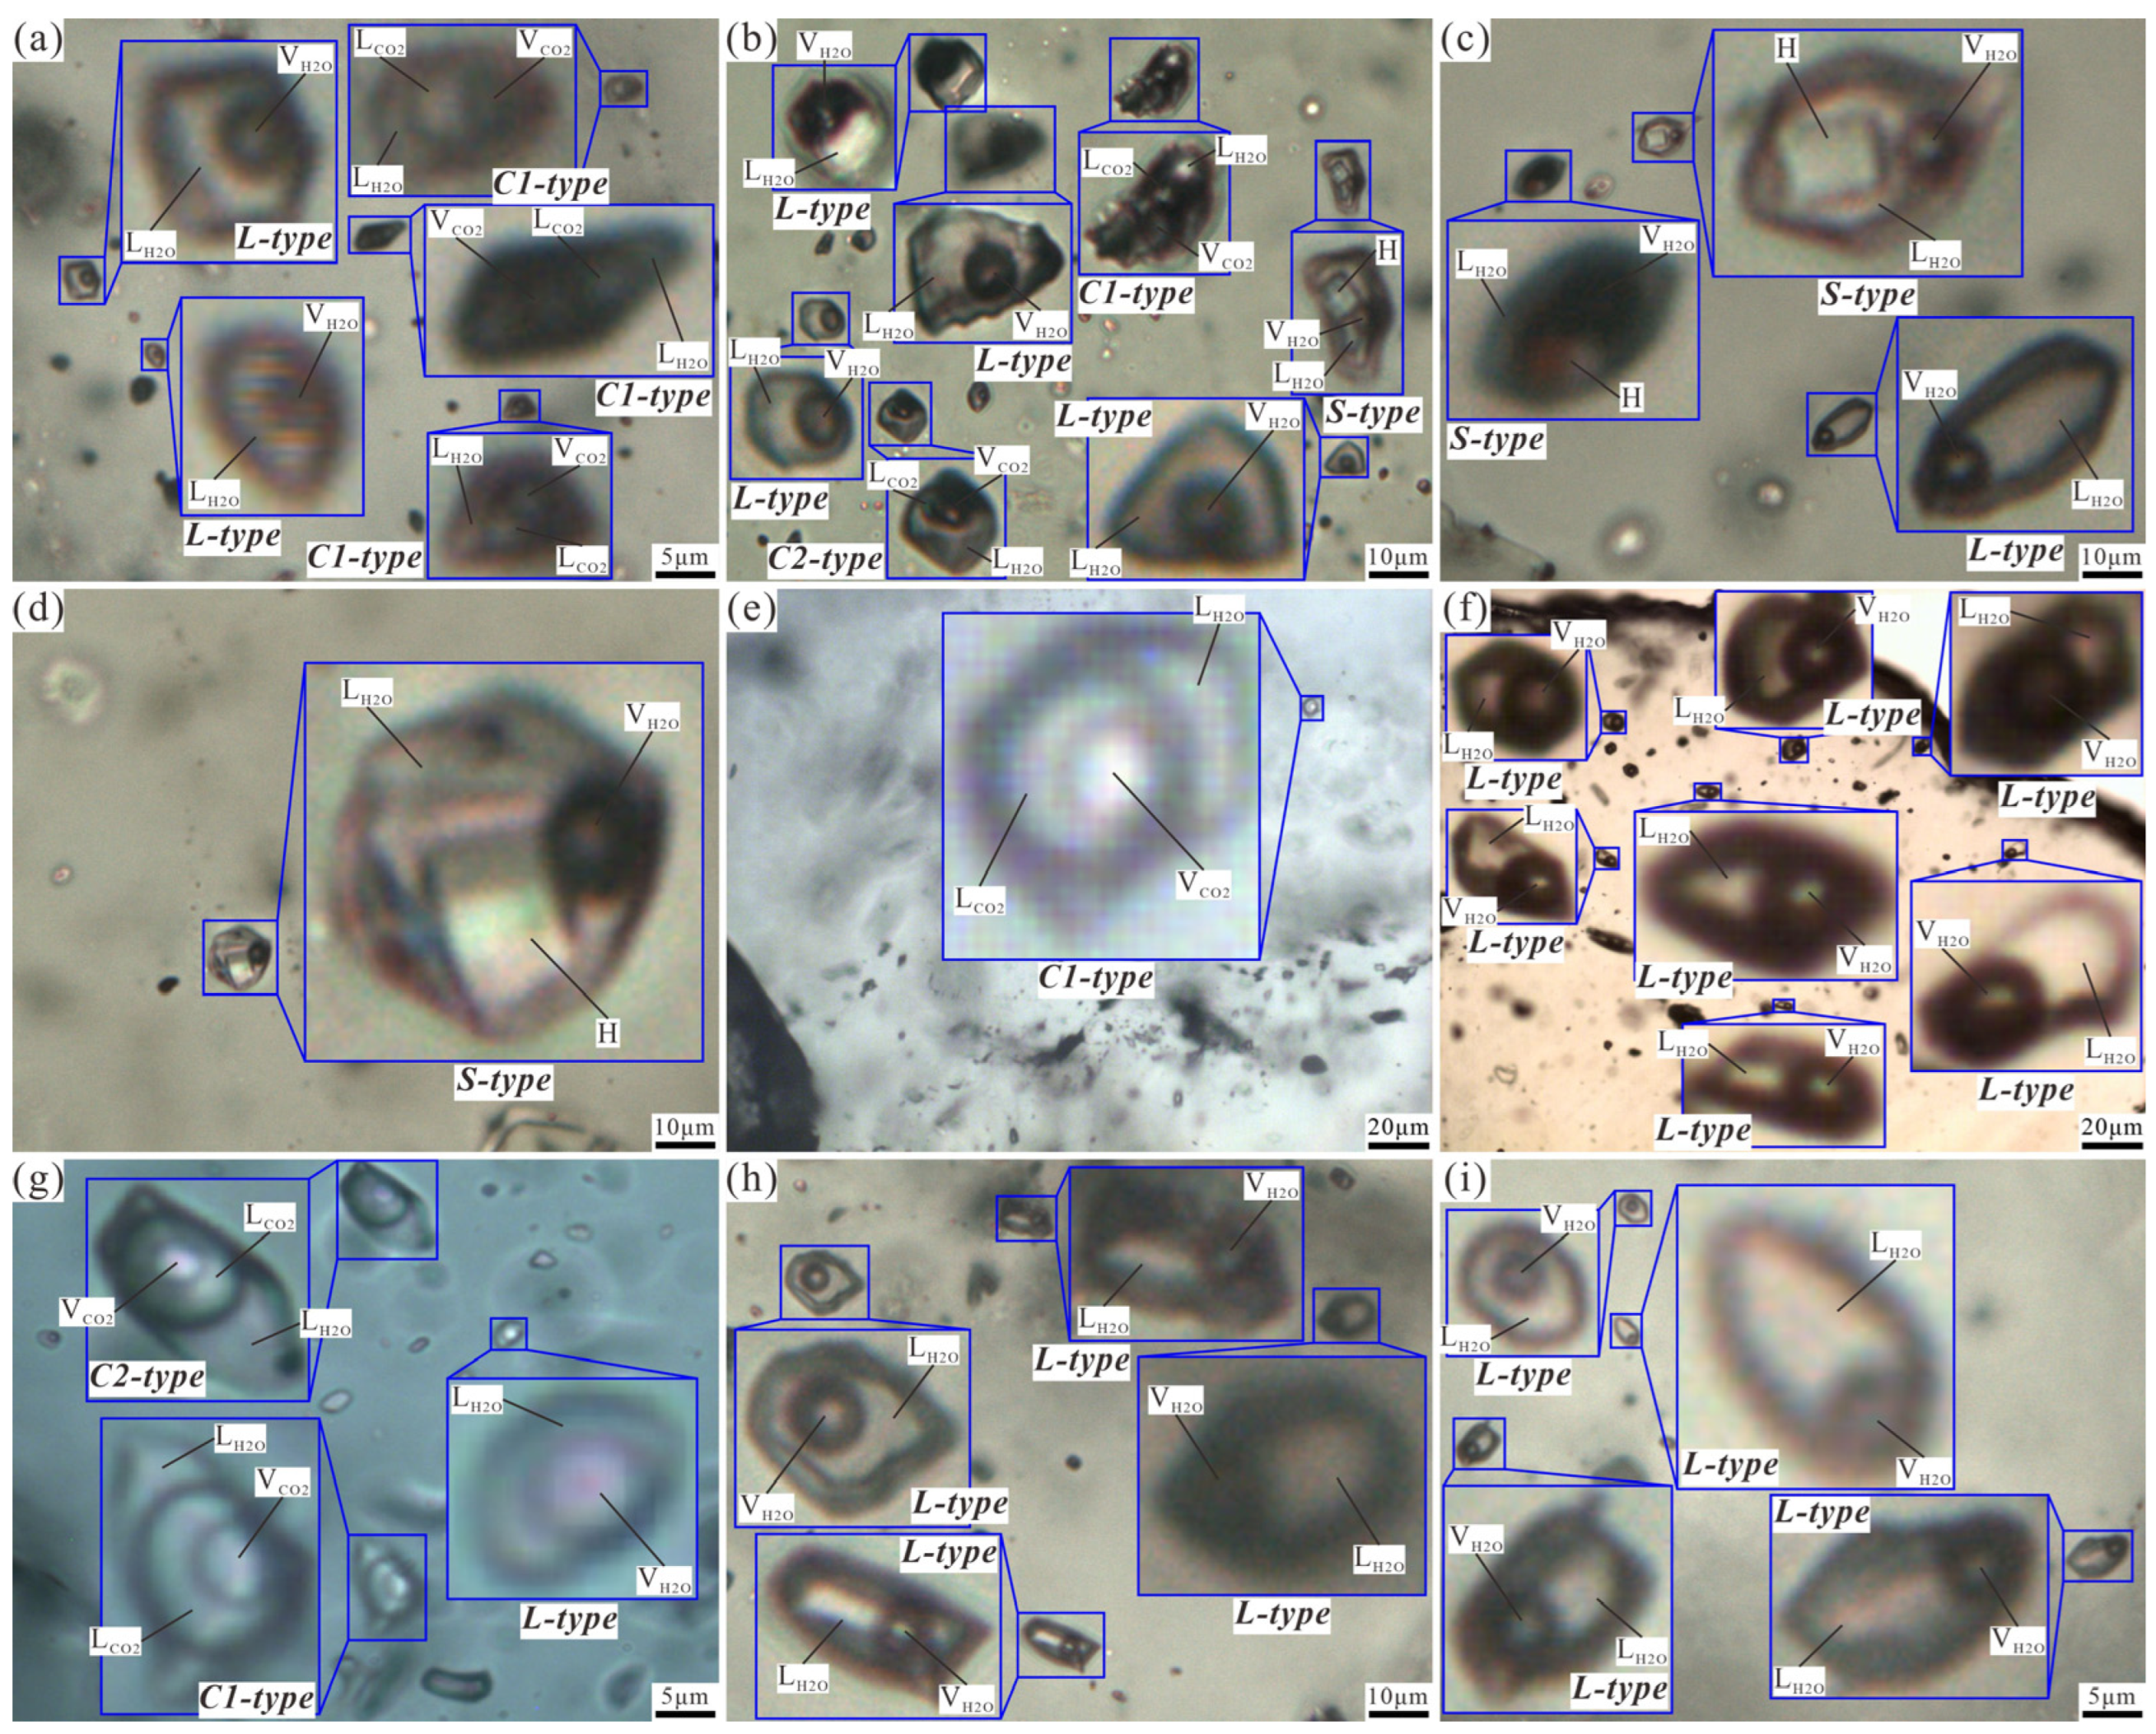
5.2. FI Petrography
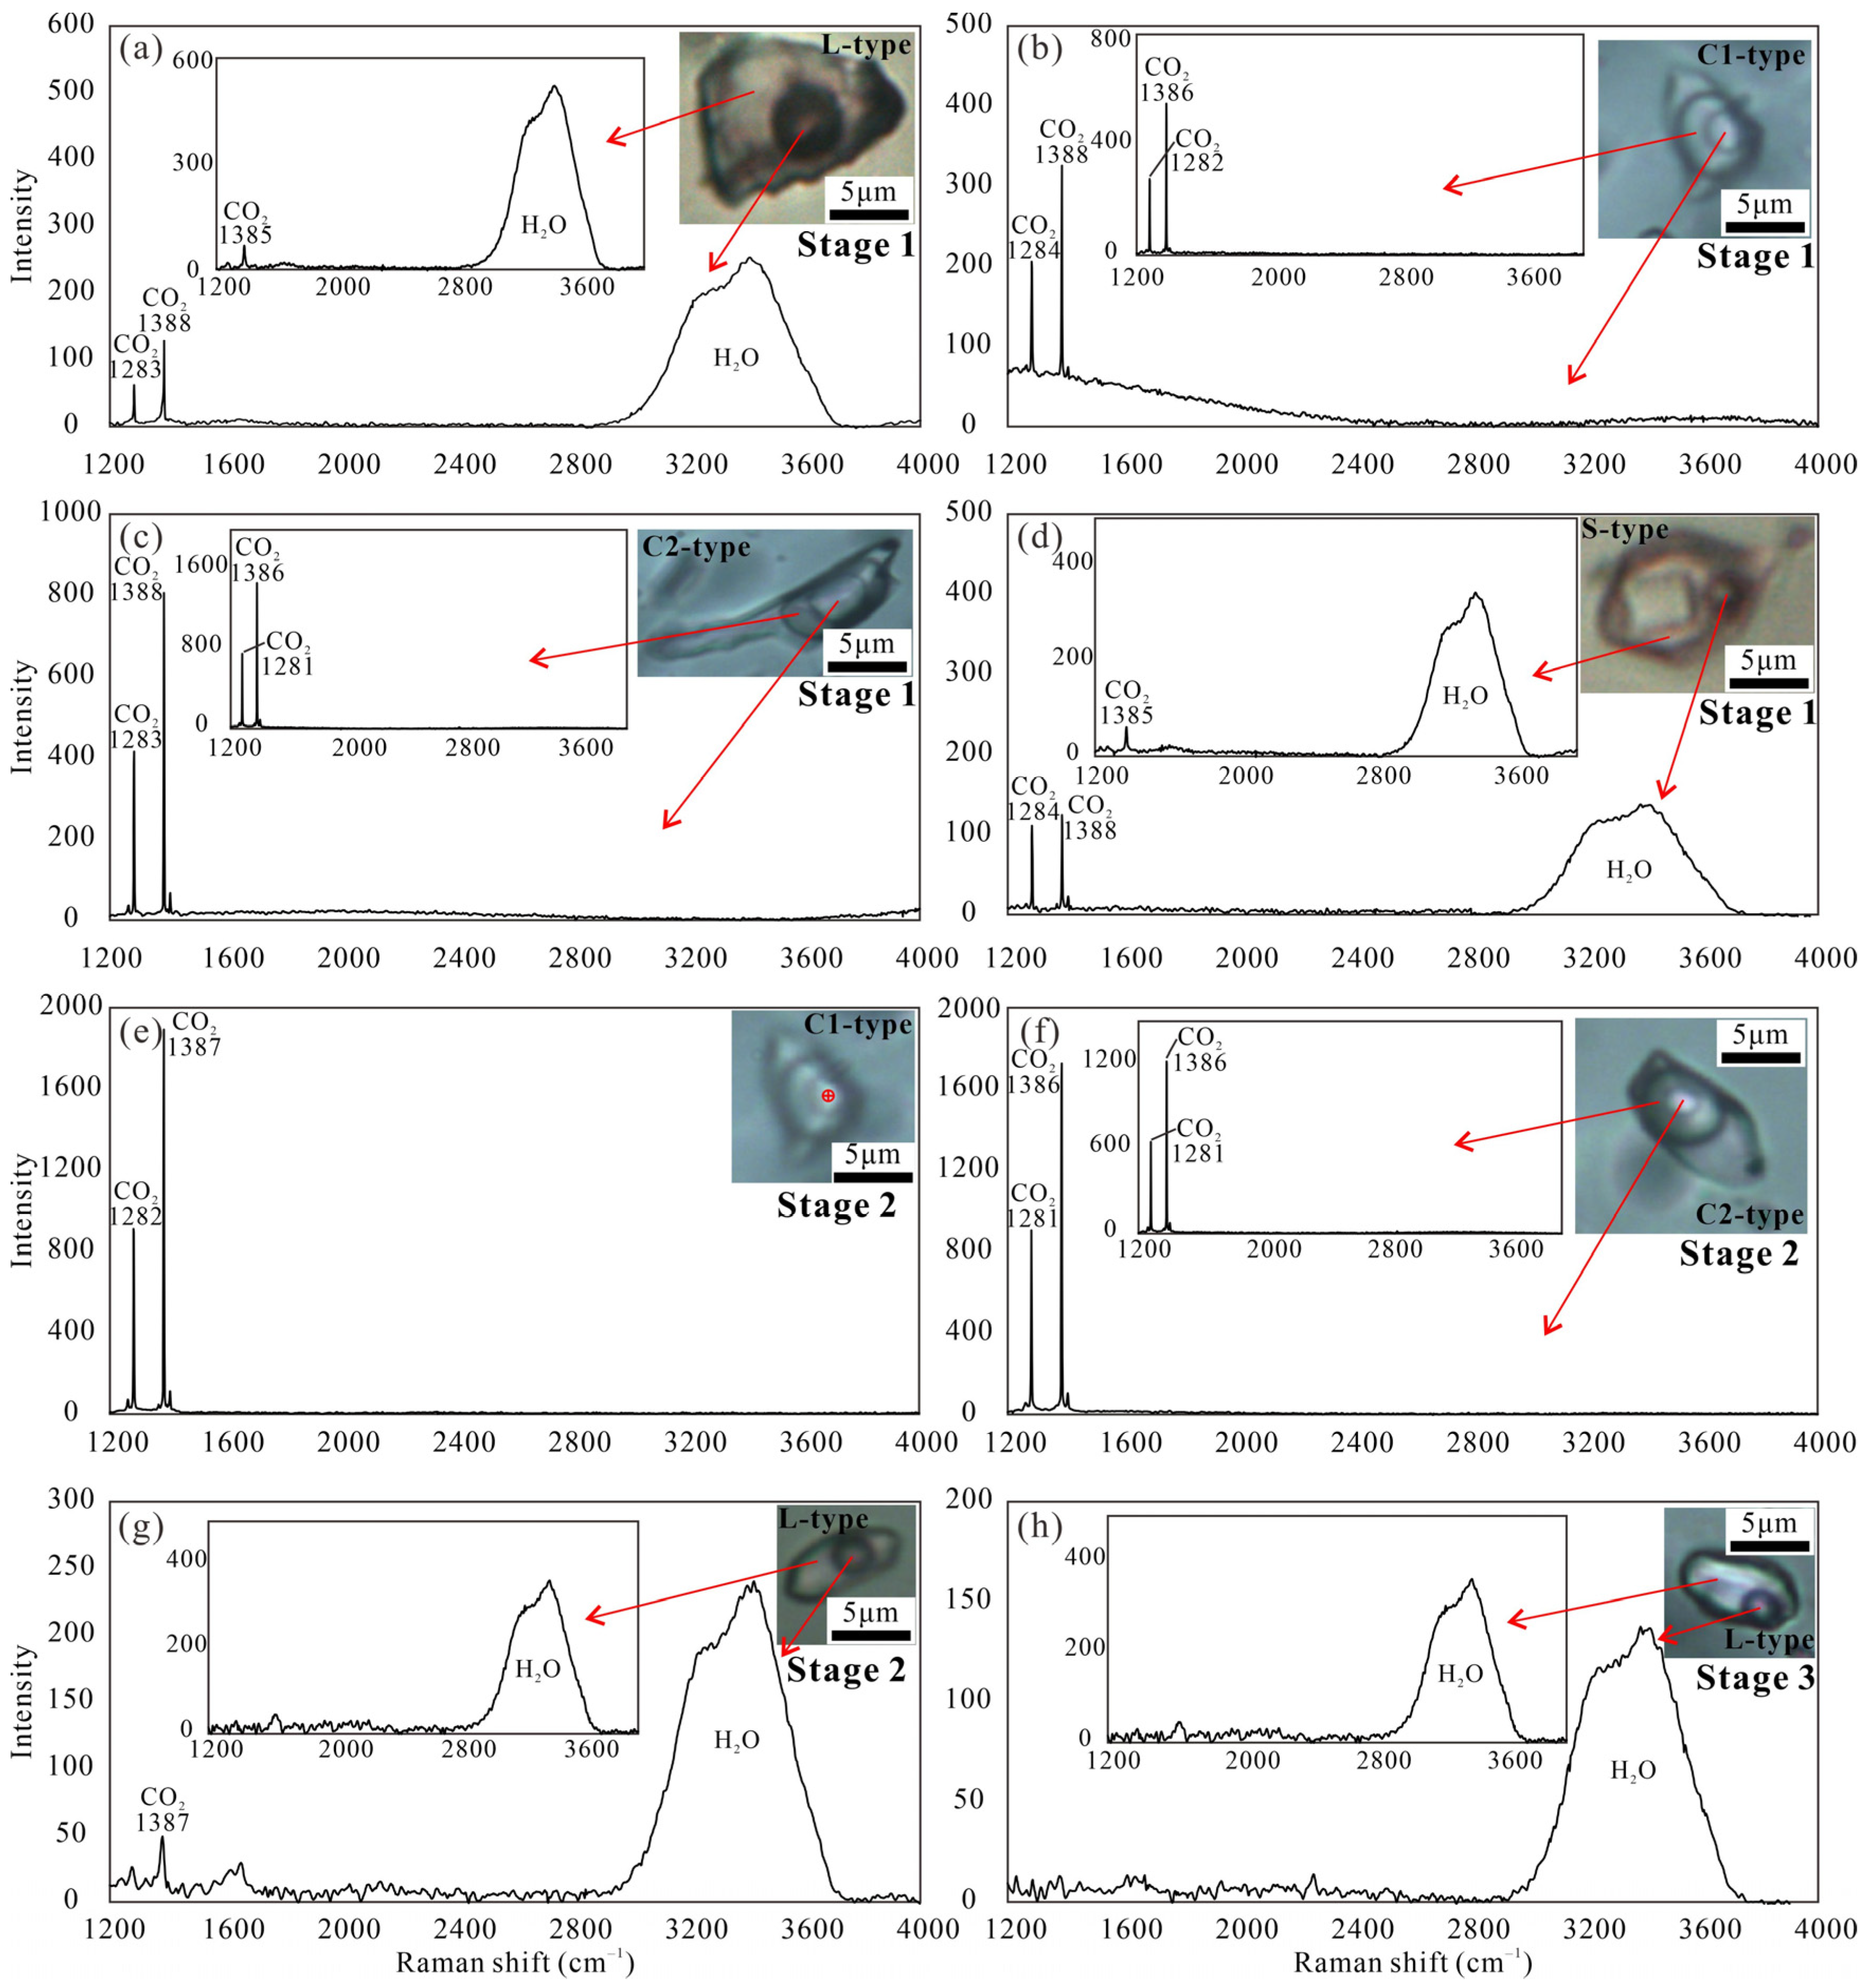
5.3. FI Laser Raman Spectroscopy
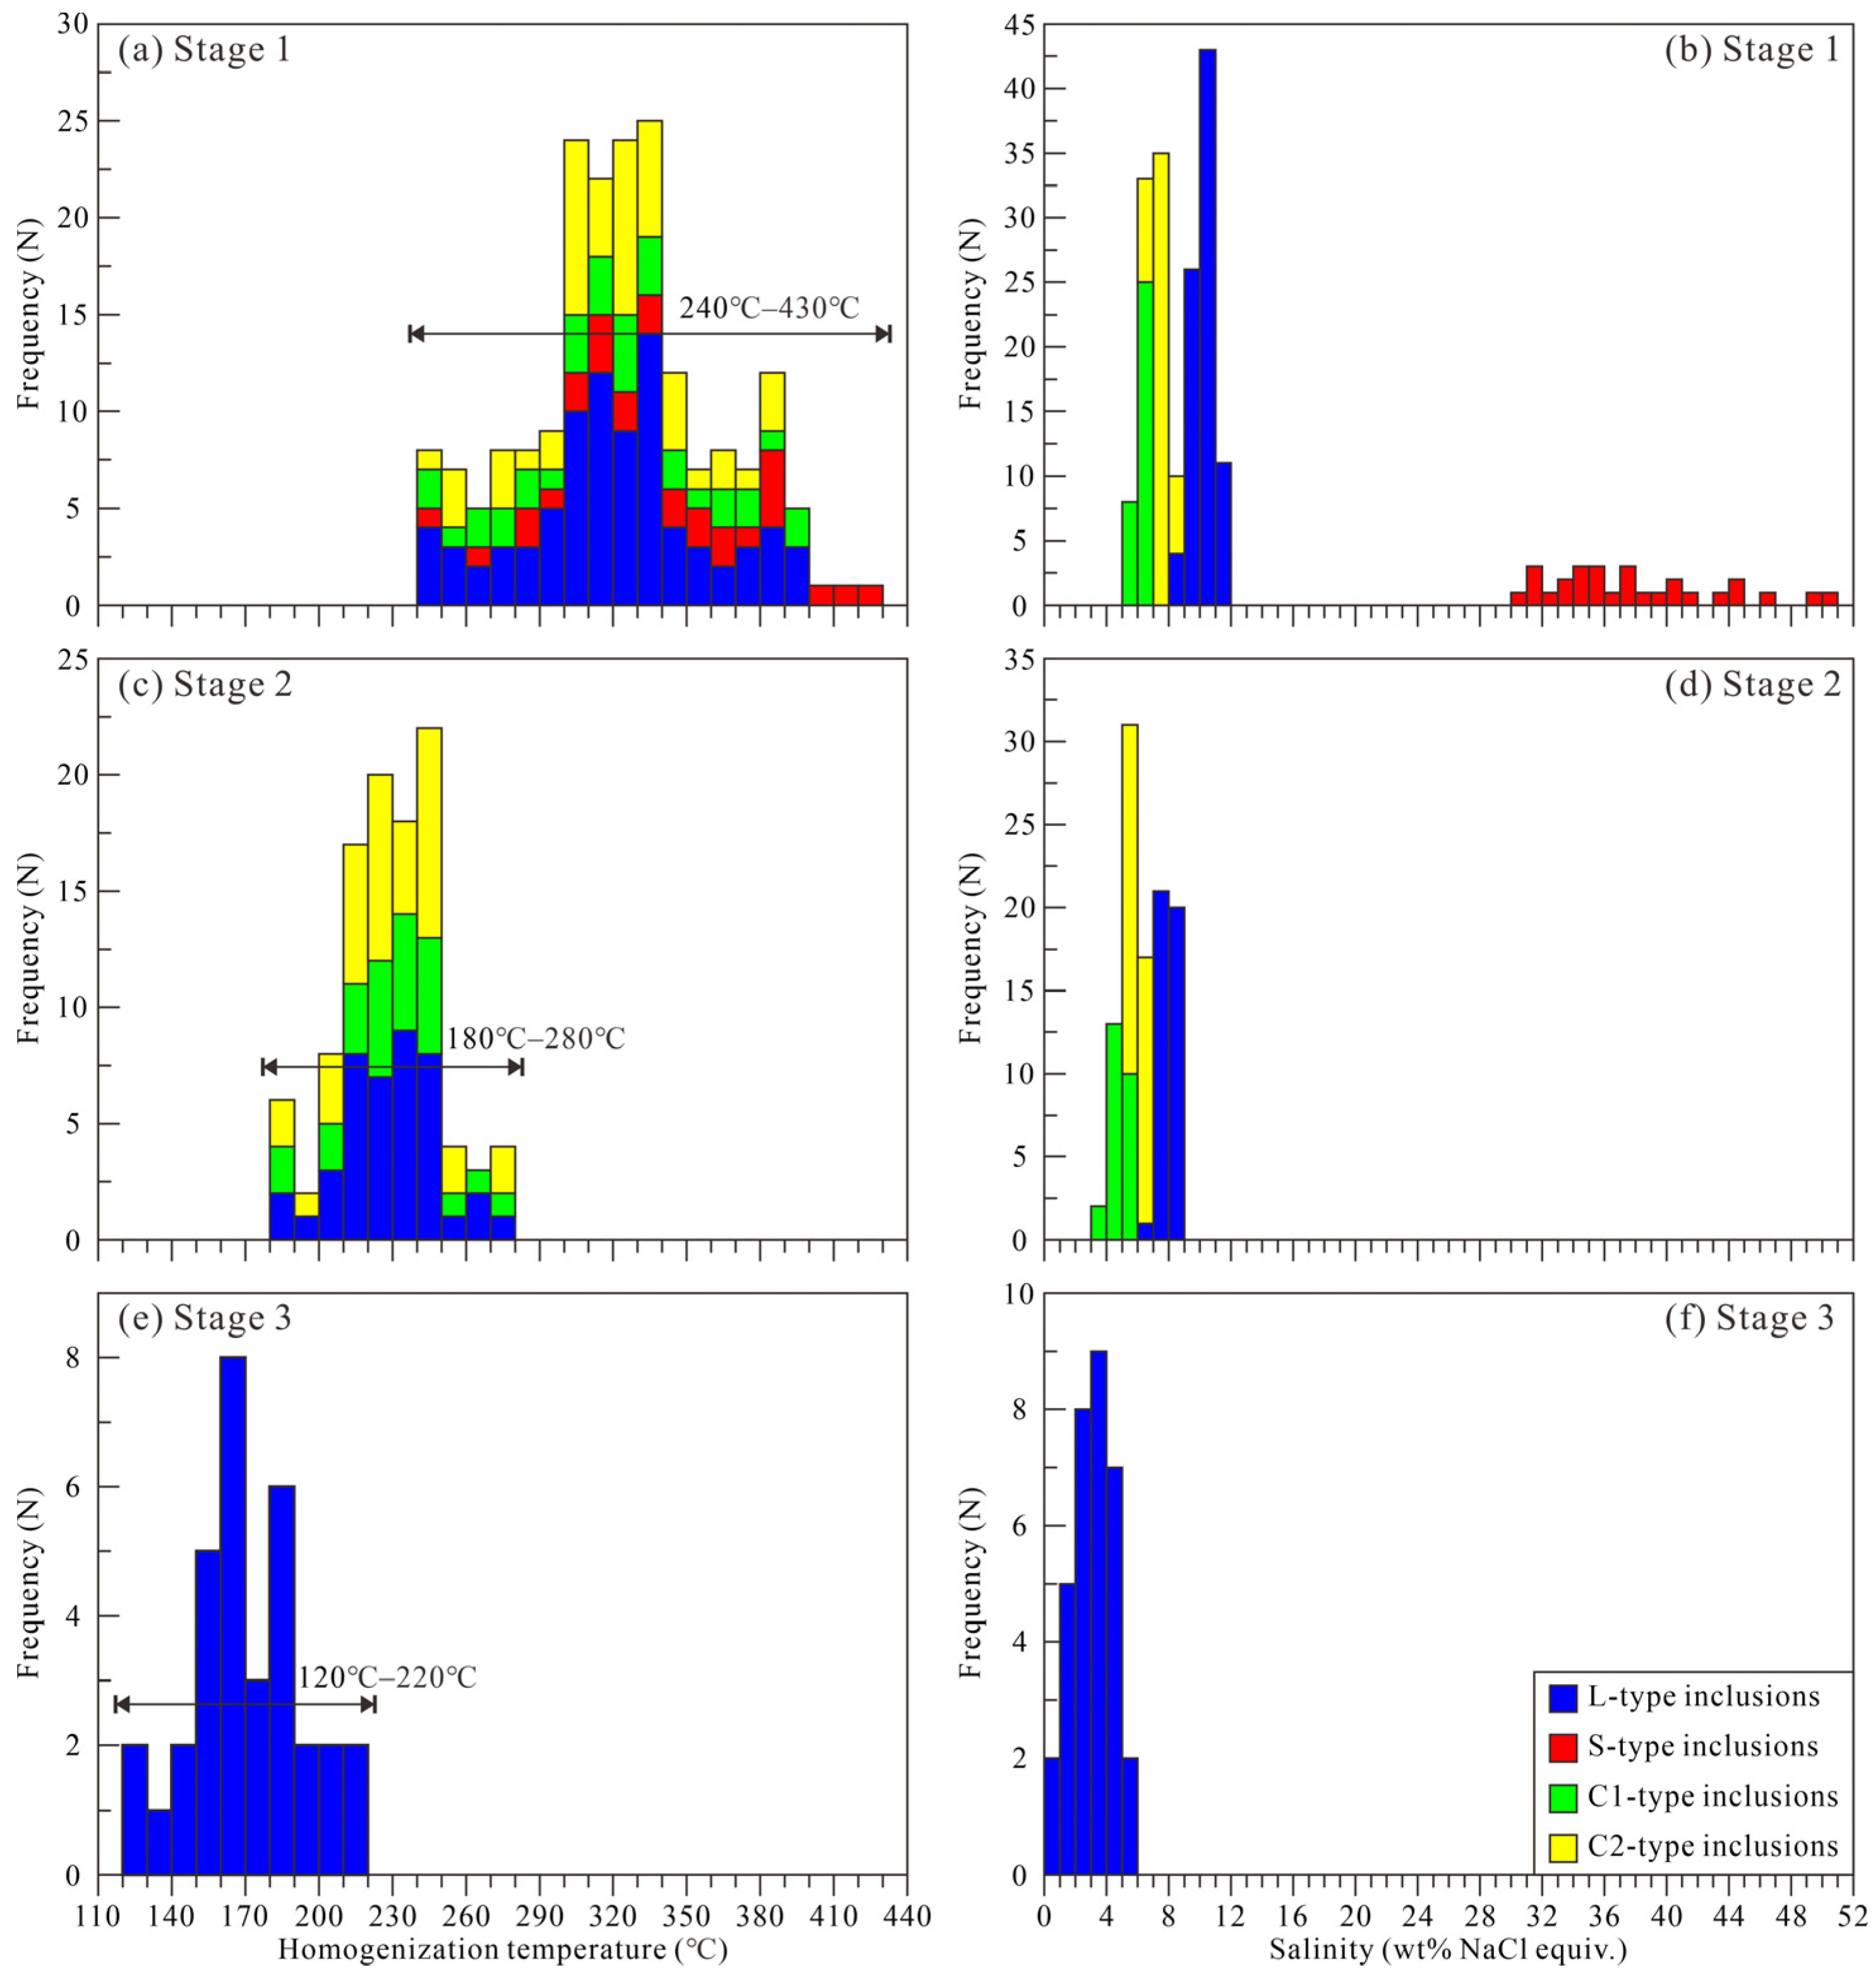
5.4. FI Microthermometry
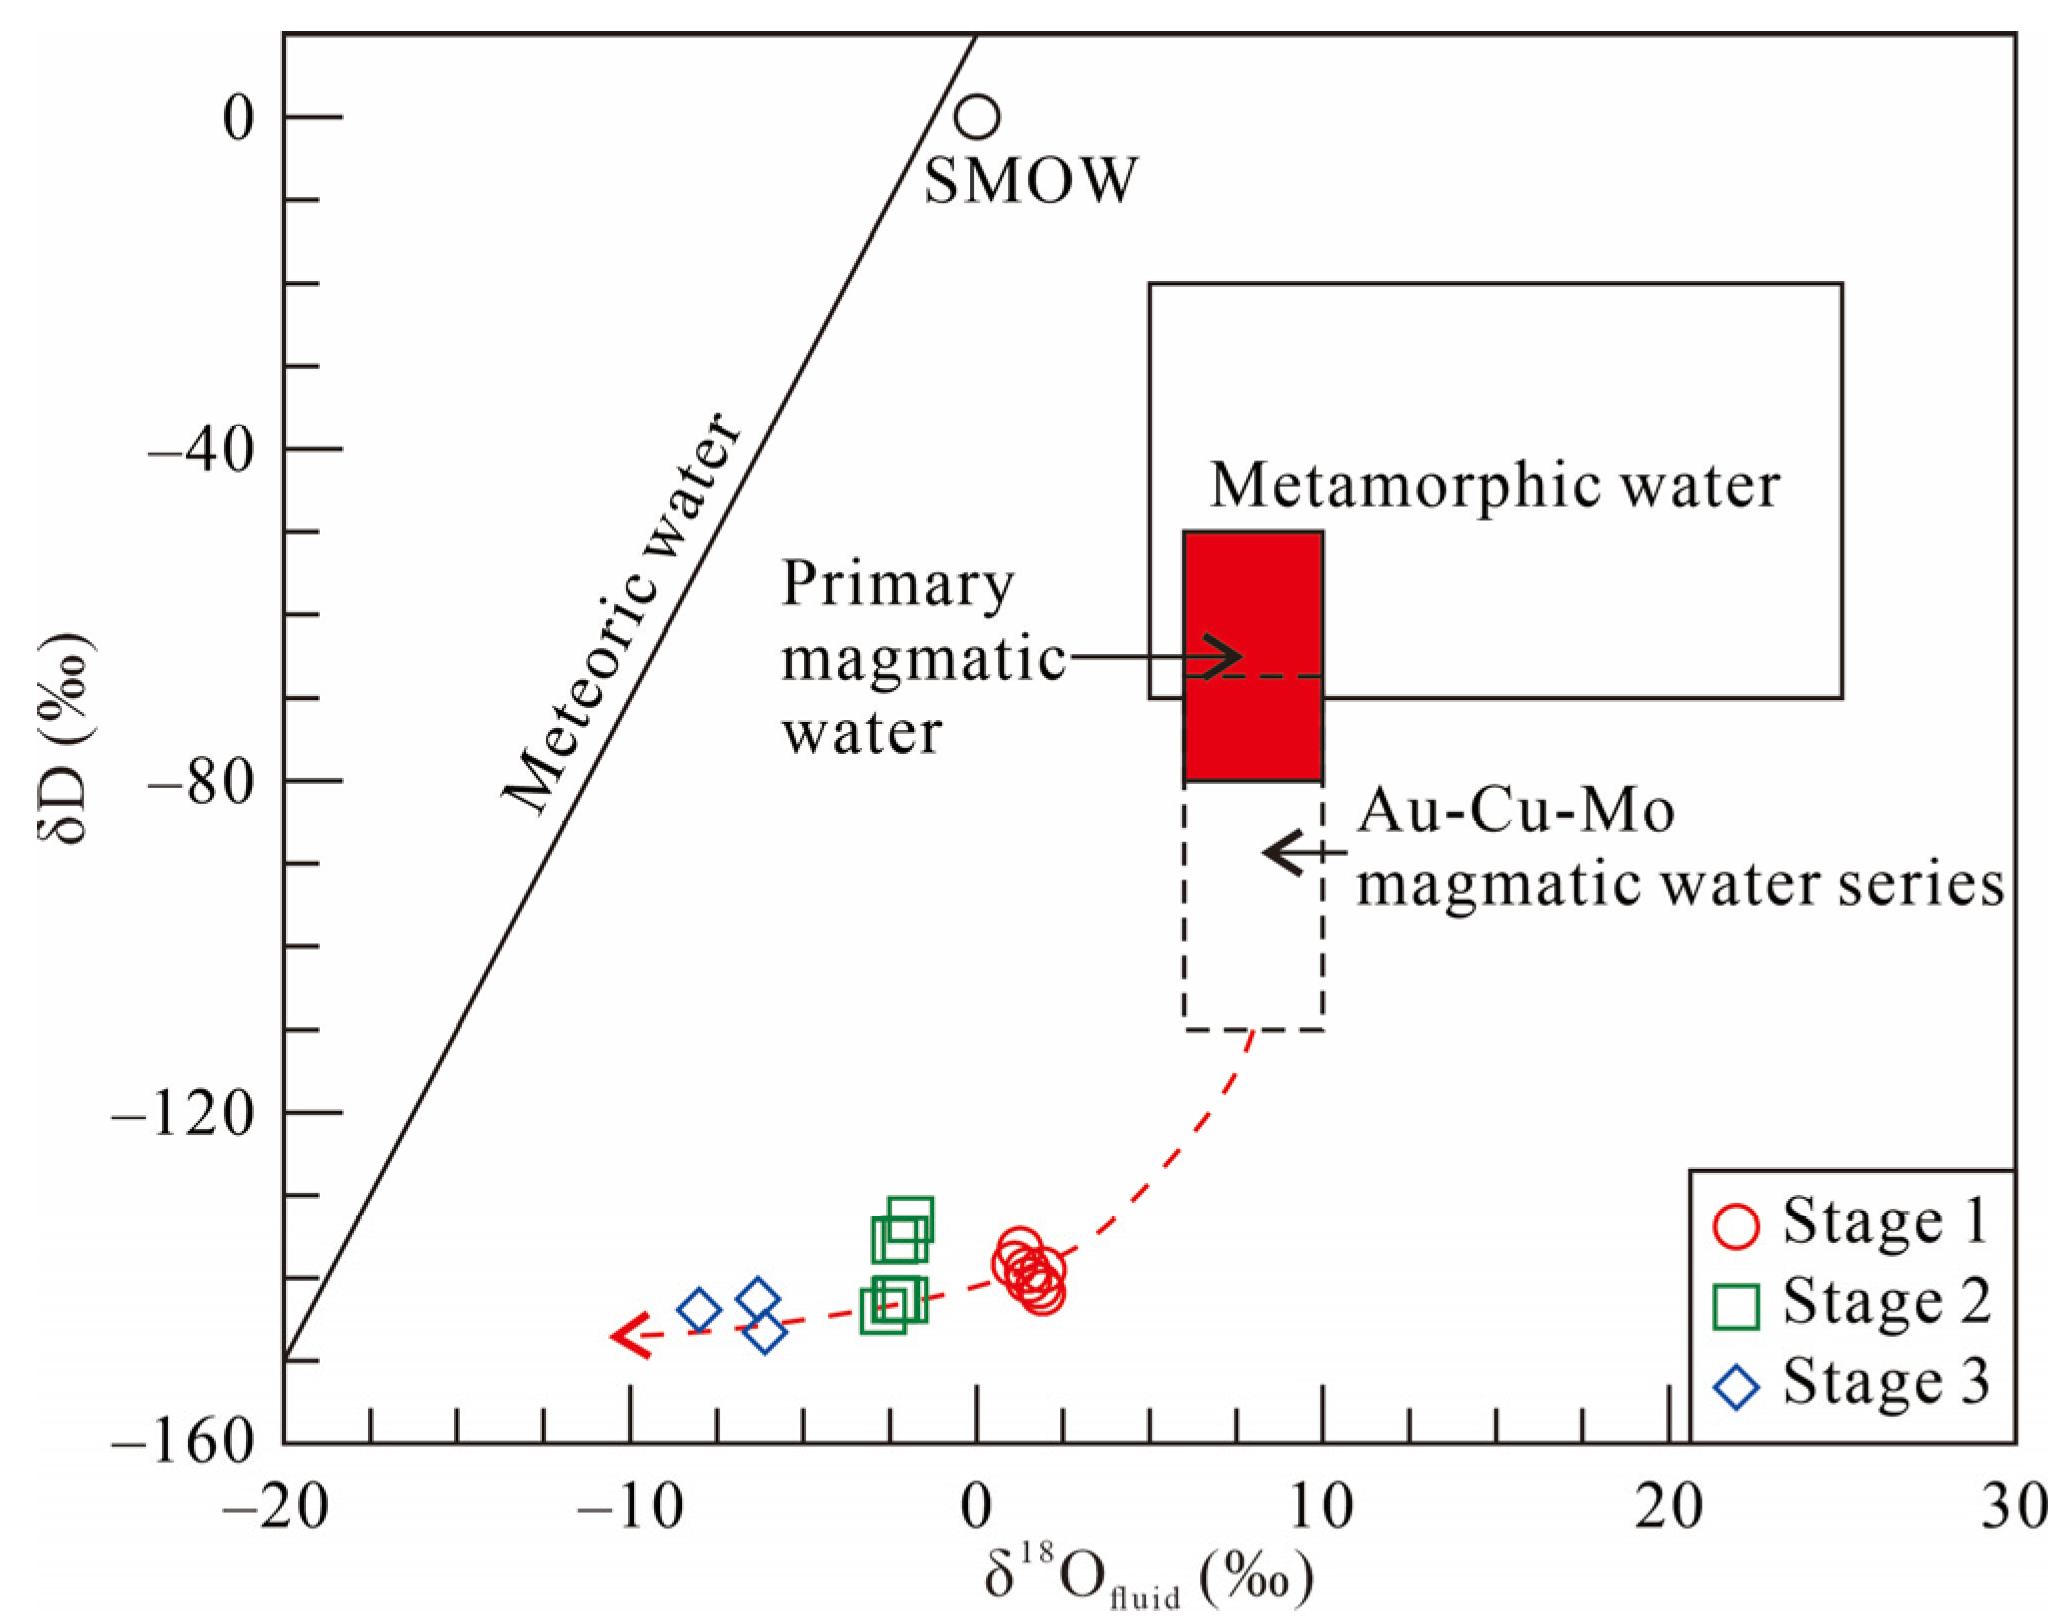
5.5. Quartz H-O Isotopic Compositions
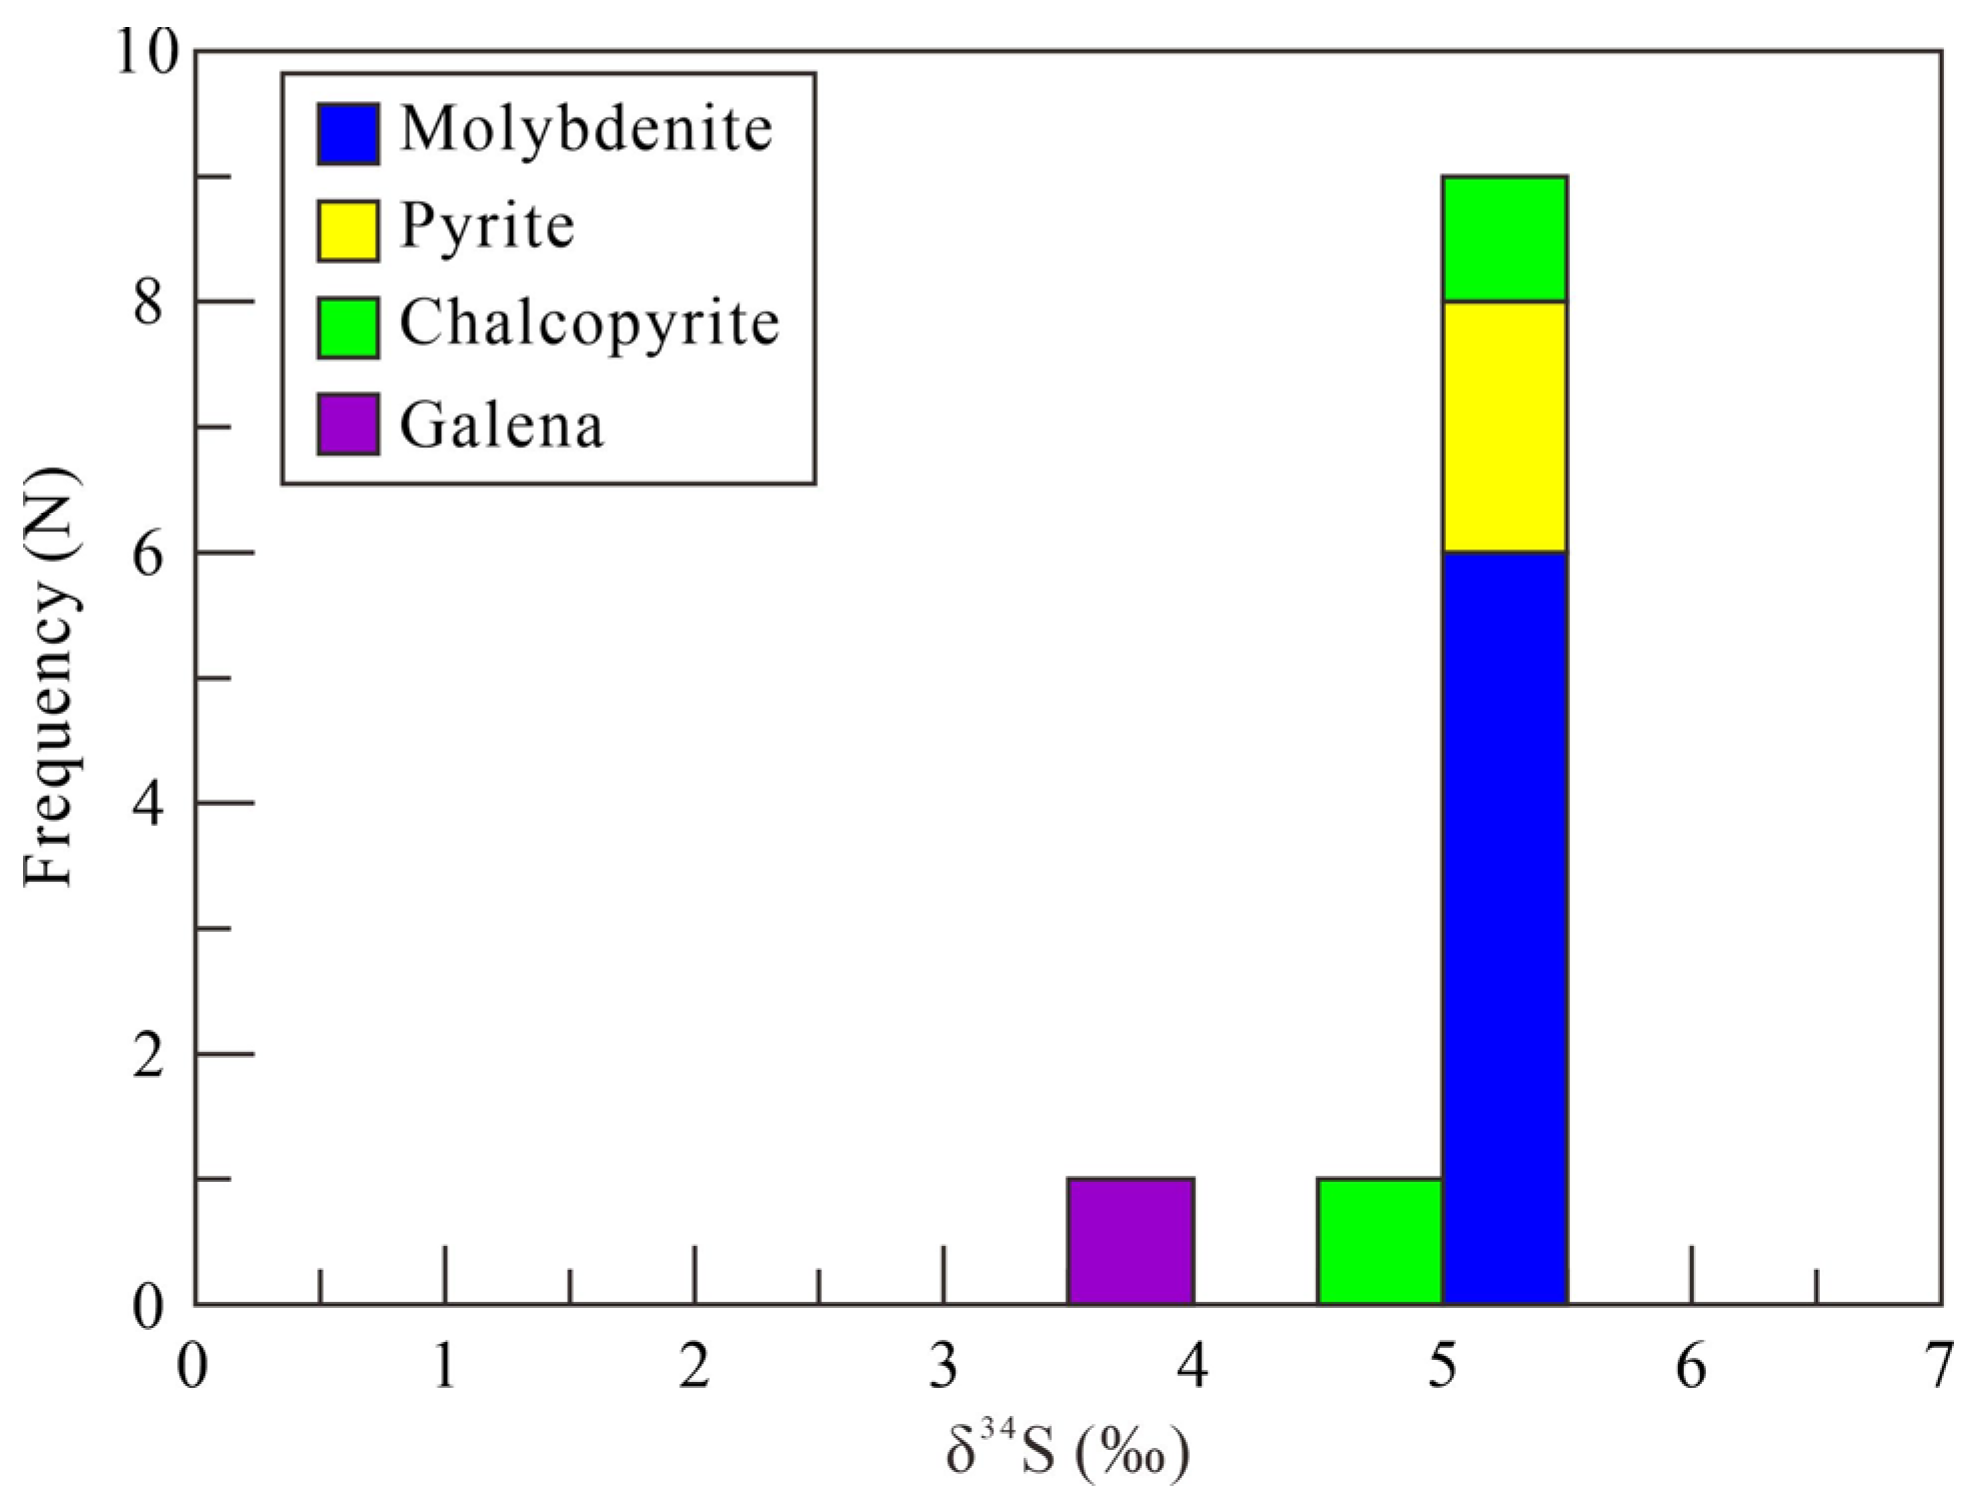
5.6. Sulfide S Isotopic Compositions
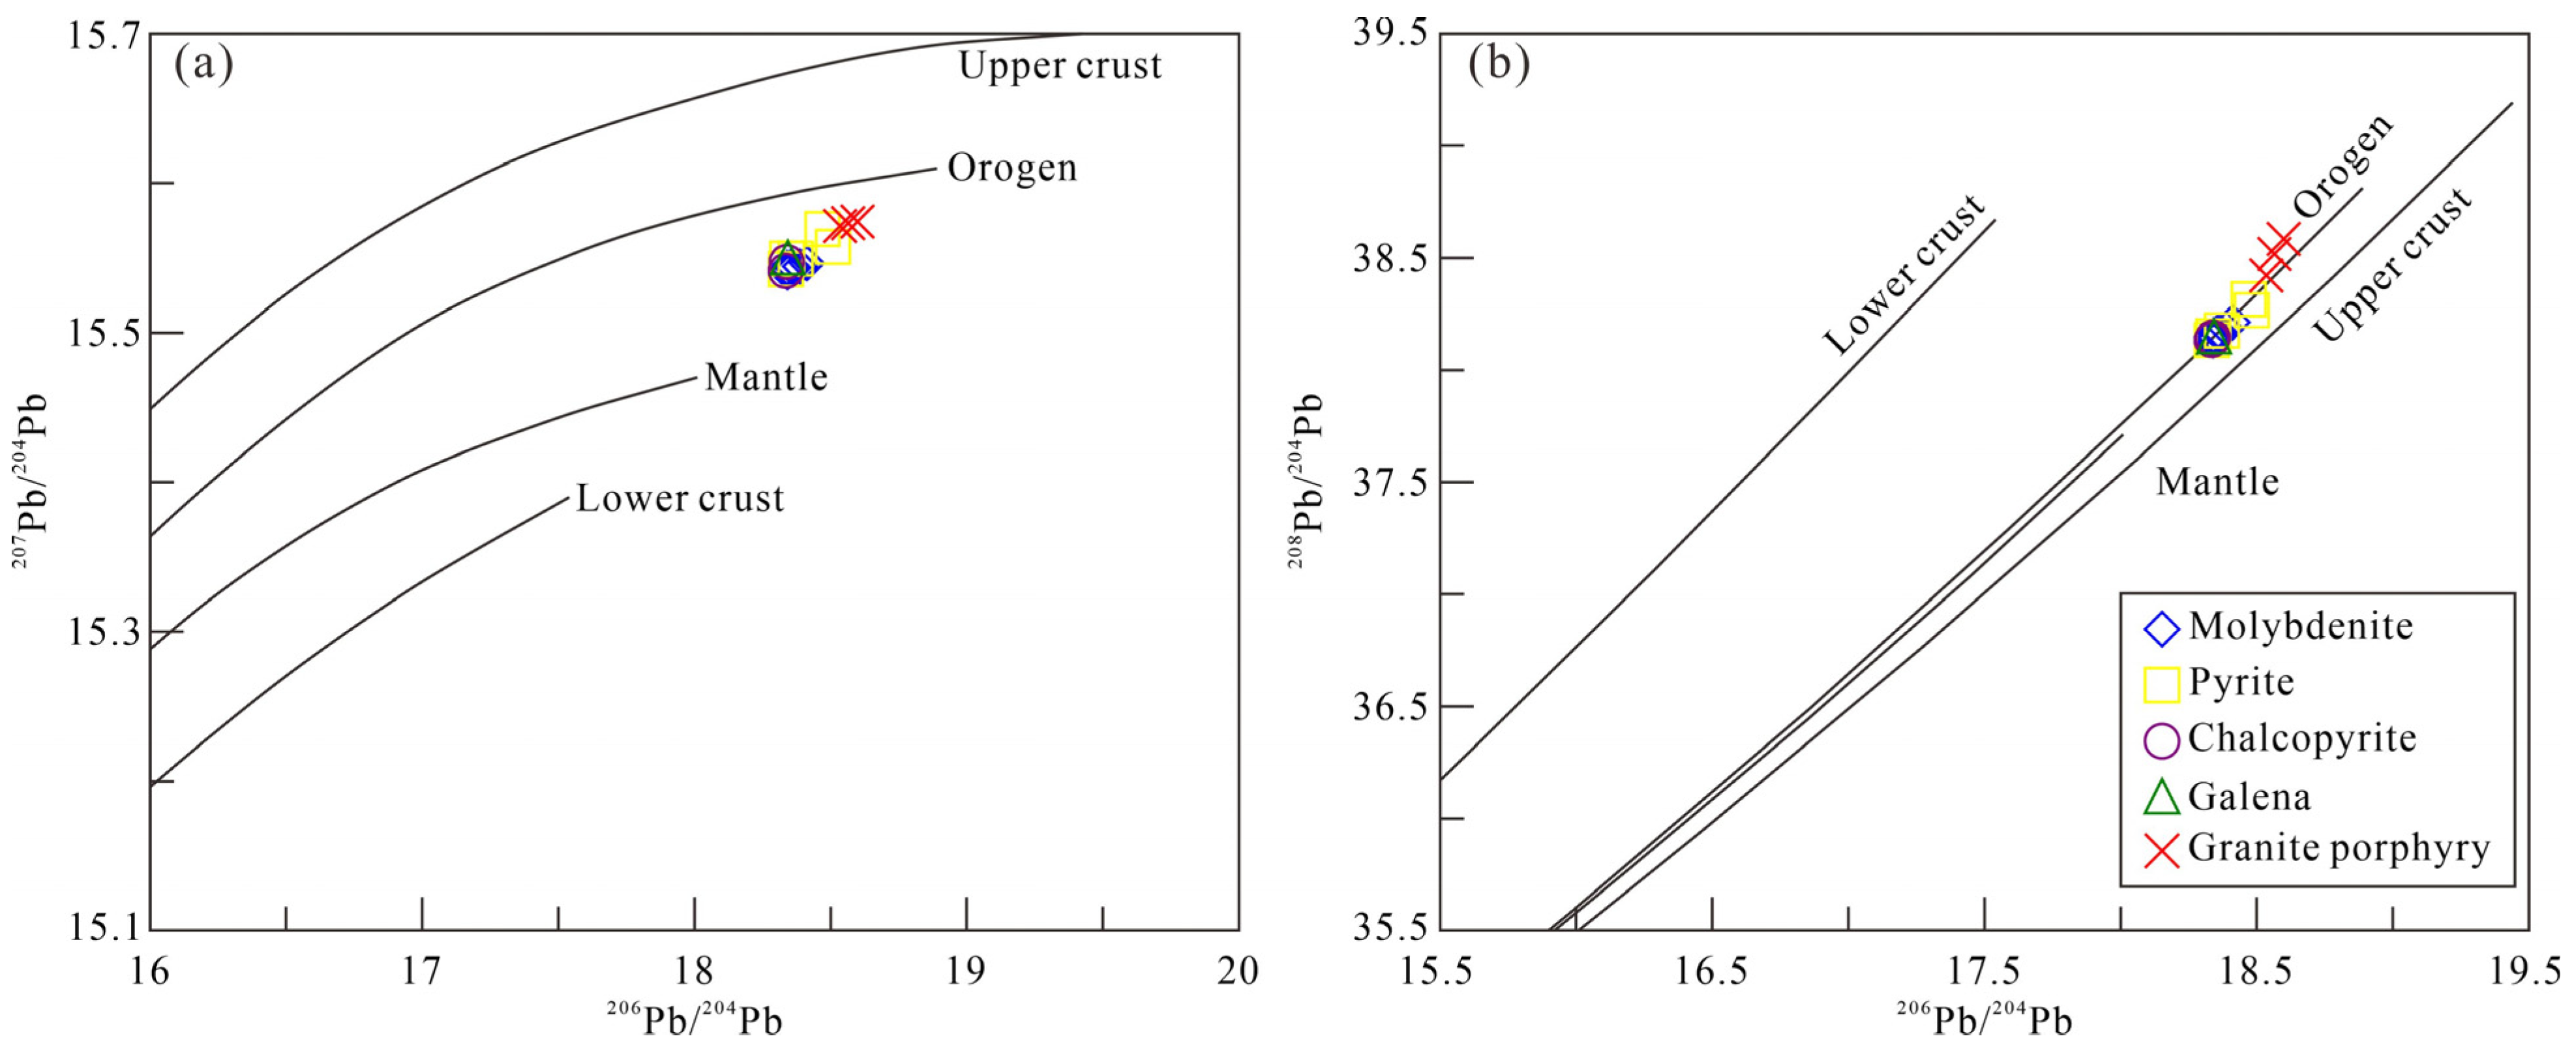
5.7. Sulfides and Whole-Rock Pb Isotopic Compositions
6. Discussion
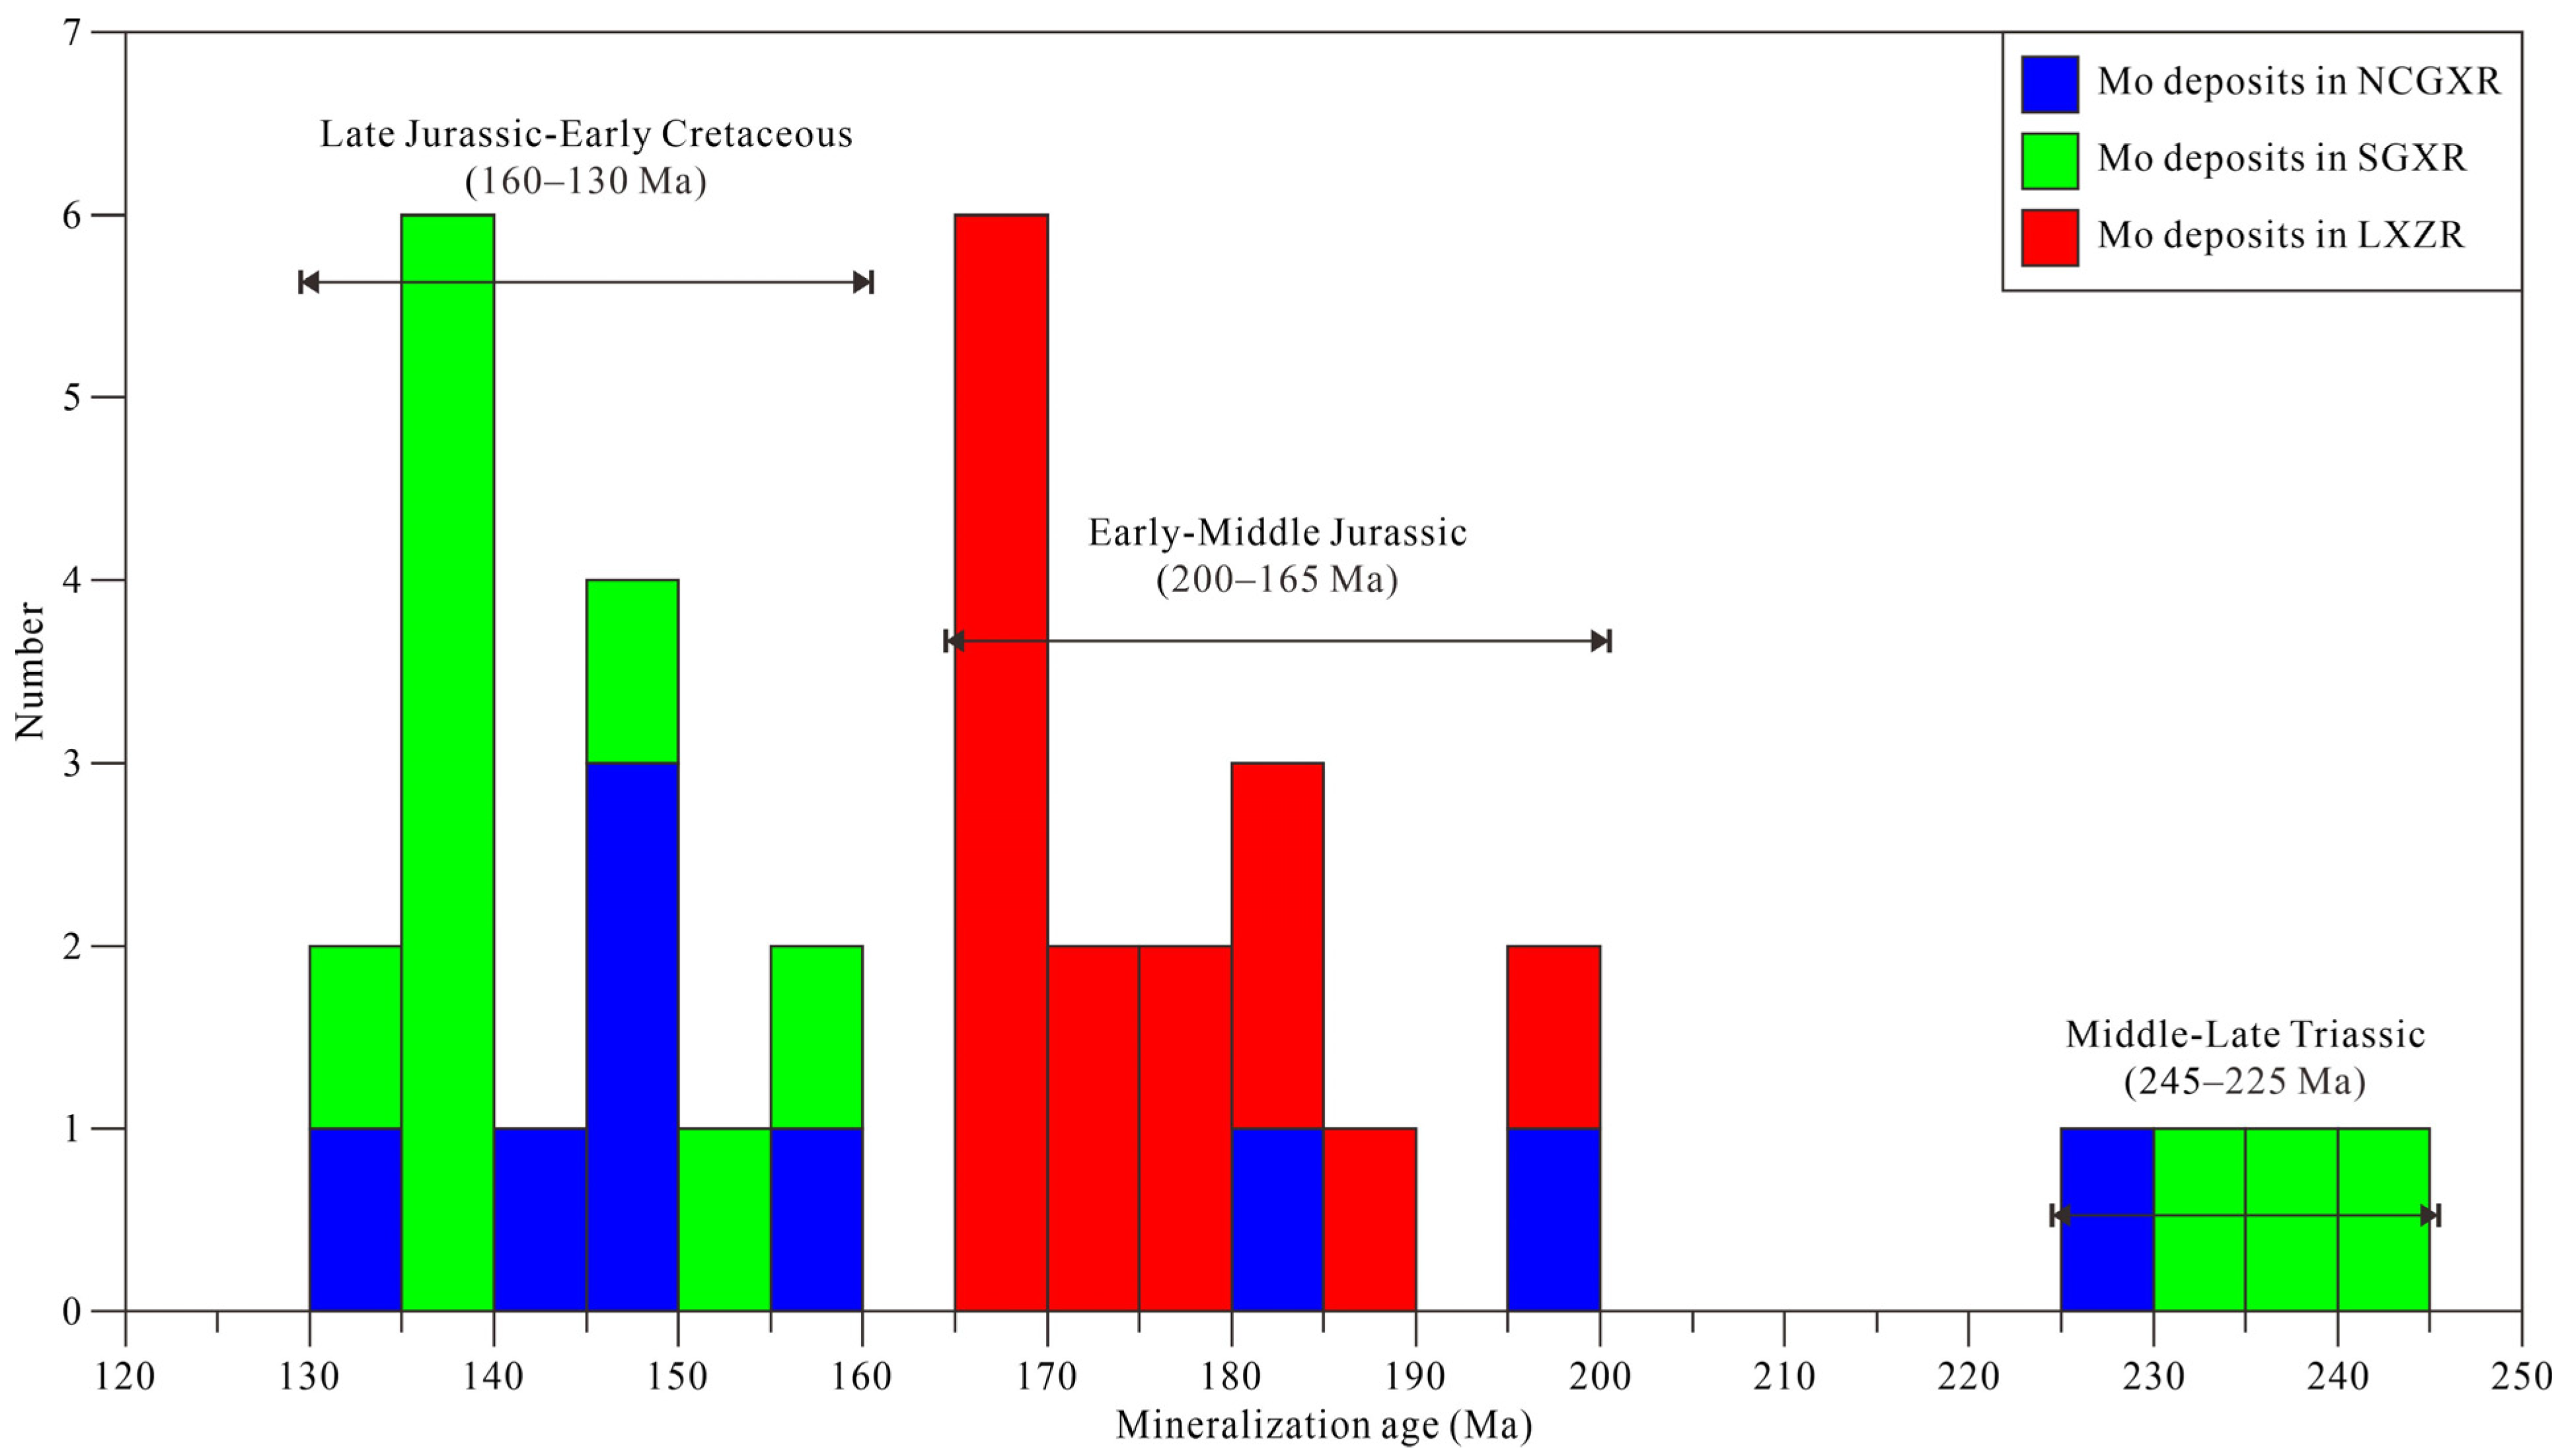
6.1. Timing of Molybdenum Metallogenesis
6.2. Source of Mineralizing Fluids
6.3. Source of Sulfur and Lead
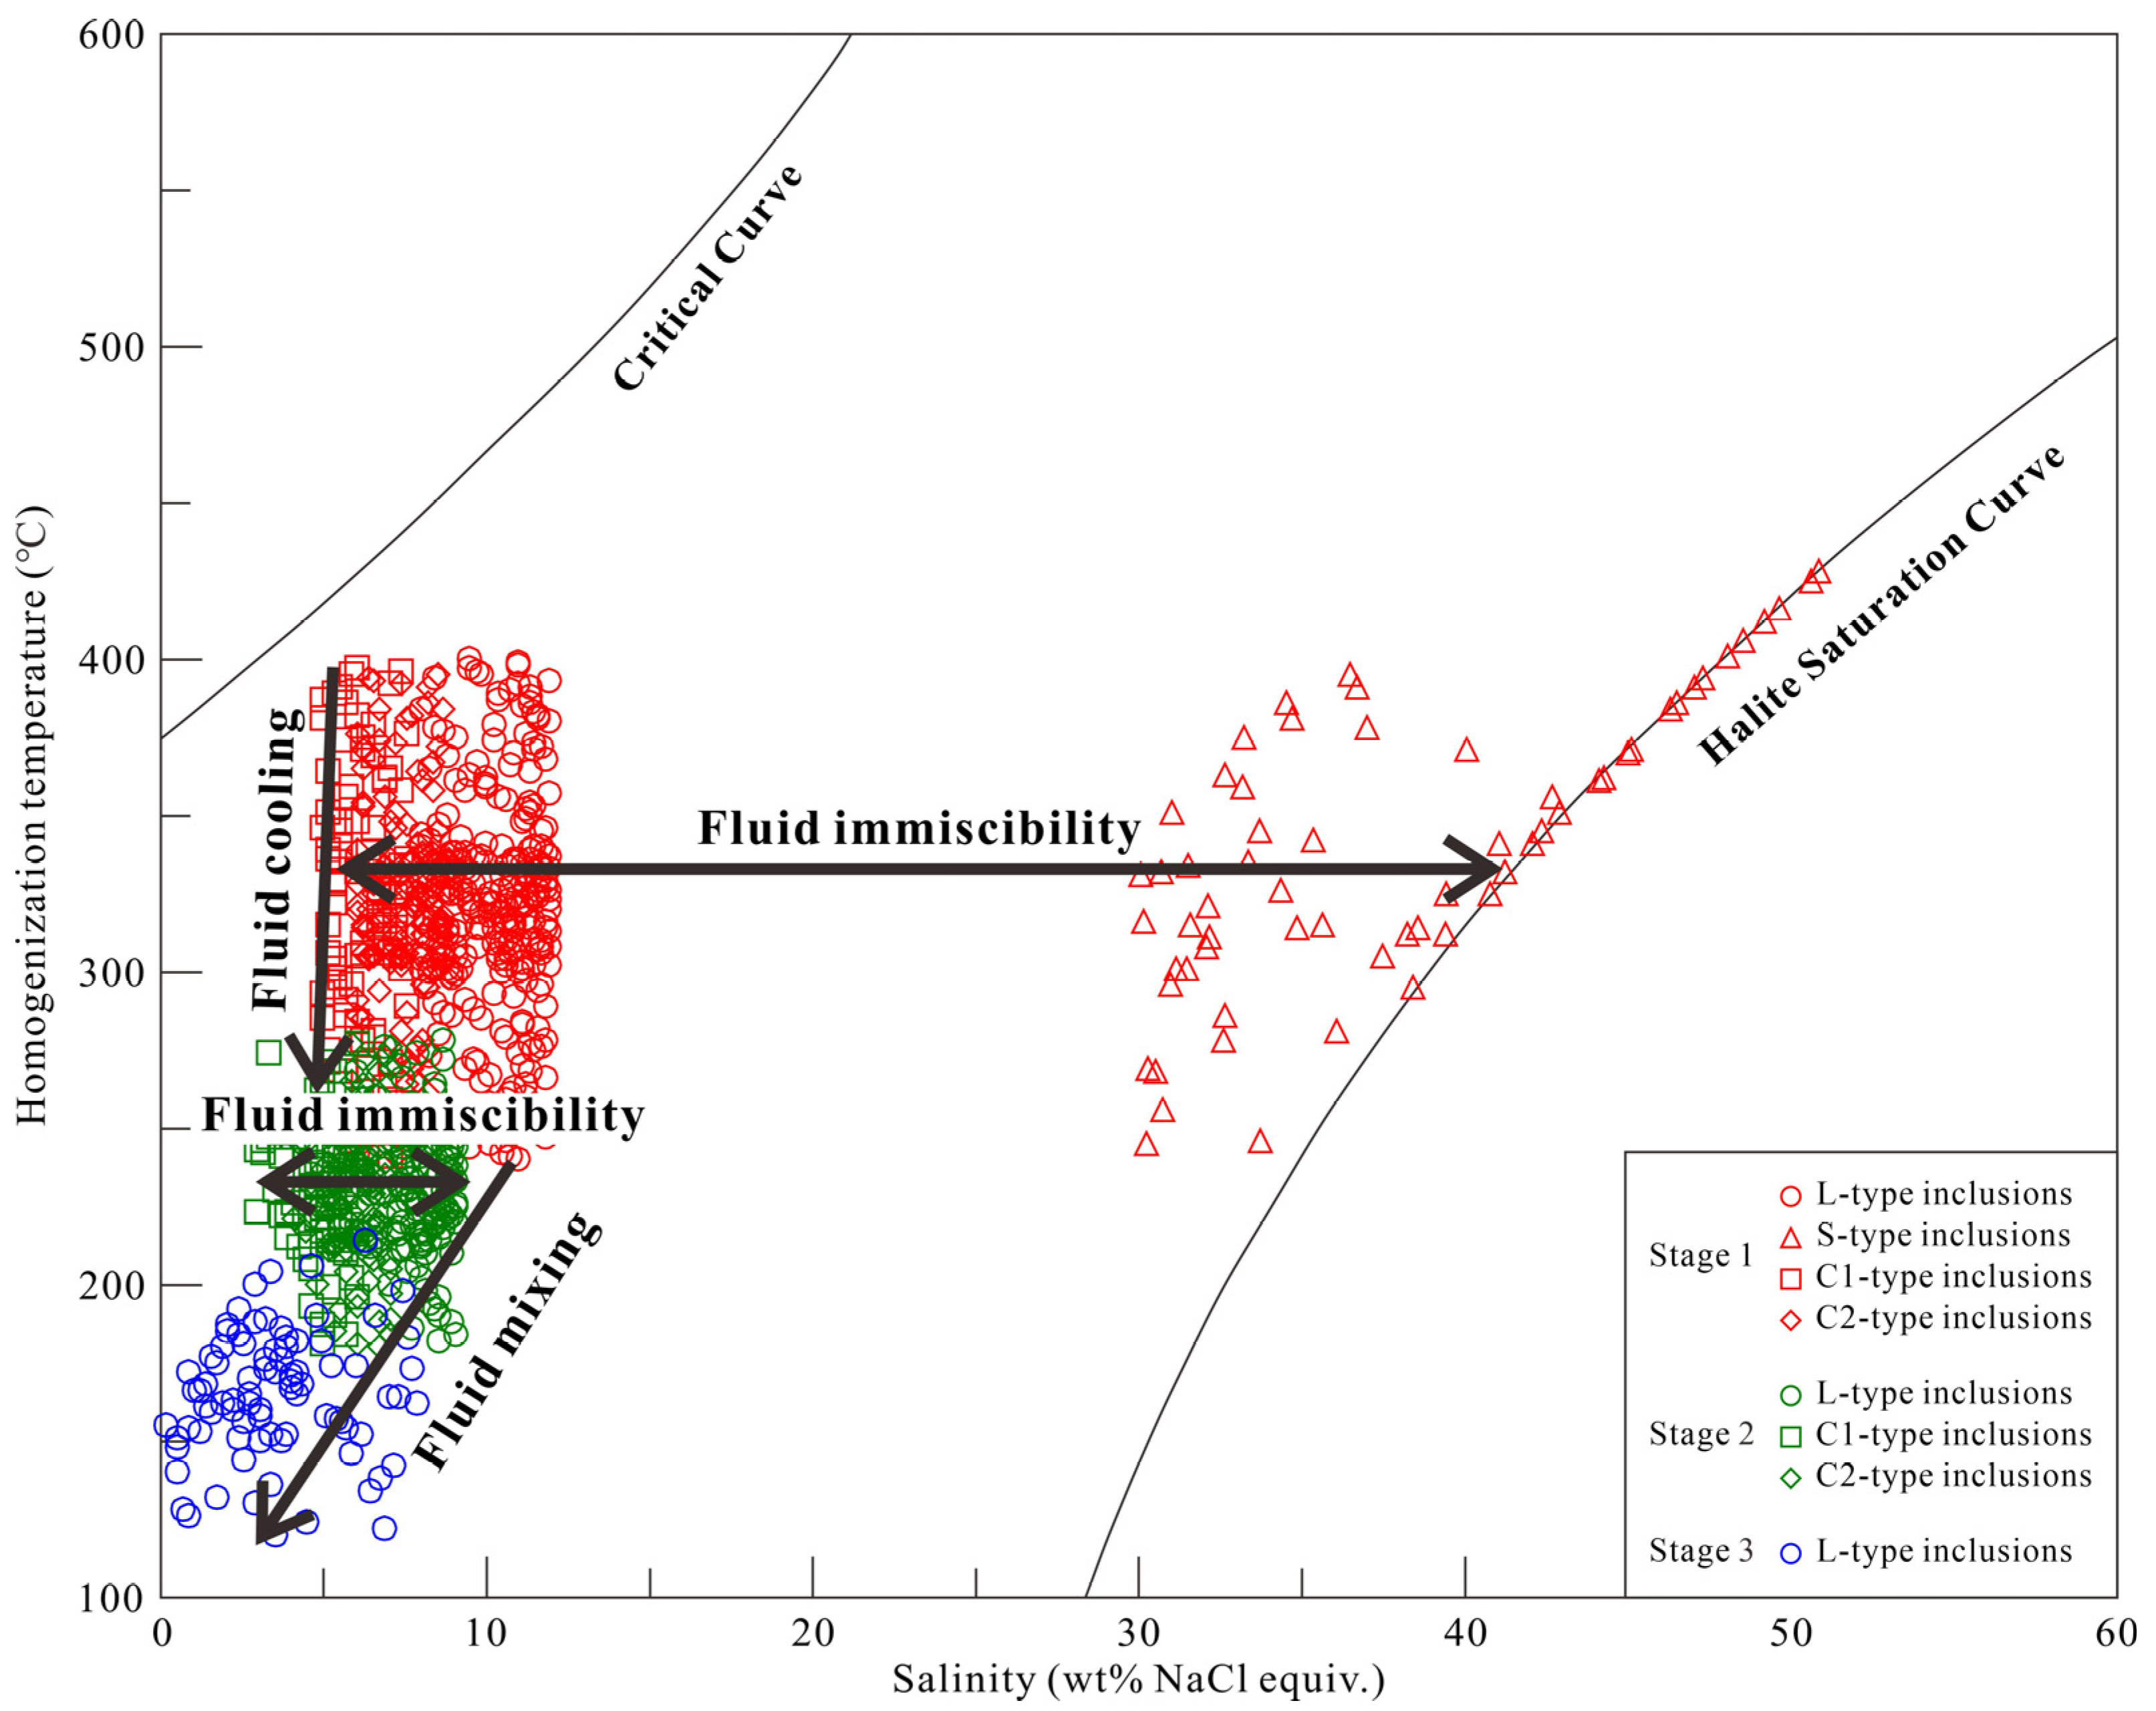
6.4. Metal Precipitation Mechanisms
6.5. Metallogenic Model for the Lower Urgen Magmatic–Hydrothermal System
7. Conclusions
Supplementary Materials
Author Contributions
Funding
Data Availability Statement
Acknowledgments
Conflicts of Interest
References
- Kirkham, R.V. Porphyry deposits. In Report of Activities Part B; Blackadar, R.G., Ed.; Geological Survey of Canada 72-1b: Ottawa, ON, Canada, 1972; pp. 62–64. [Google Scholar]
- Bodnar, R.J. Fluid inclusion evidence for a magmatic source for metals in porphyry copper deposits. Magmas Fluids Ore Depos. Mineral. Assoc. Can. Short. Course 1995, 23, 139–152. [Google Scholar]
- Sinclair, W.D. Porphyry deposits. In Mineral Deposits of Canda: A Synthesis of Major Deposit-Types, District Metallogeny, The Evolution of Geological Provinces, and Exploration Methods; Special Publication 5; Geological Association of Canada, Mineral Deposits Division: St. John’s, NL, Canada, 2007. [Google Scholar]
- Sillitoe, R.H. Porphyry copper systems. Econ. Geol. 2010, 105, 3–41. [Google Scholar] [CrossRef]
- Chen, H.Y.; Wu, C. Metallogenesis and major challenges of porphyry copper systems above subduction zones. Sci. China Earth Sci. 2020, 63, 899–918. [Google Scholar] [CrossRef]
- Kooiman, G.J.A.; McLeod, M.J.; Sinclair, W.D. Porphyry tungsten-molybdenum orebodies, polymetallic veins and replacement bodies, and tin-bearing greisen zones in the Fire Tower Zone, Mount Pleasant, New Brunswick. Econ. Geol. 1986, 81, 1356–1373. [Google Scholar] [CrossRef]
- Weis, P.; Driesner, T.; Heinrich, C.A. Porphyry-copper ore shells form at stable pressure-temperature fronts within dynamic fluid plumes. Science 2012, 338, 1613–1616. [Google Scholar] [CrossRef]
- Audétat, A.; Pettke, T.; Heinrich, C.A.; Bodnar, R.J. The composition of magmatic-hydrothermal fluids in barren and mineralized intrusions. Econ. Geol. 2008, 103, 877–908. [Google Scholar] [CrossRef]
- Audétat, A. Source and evolution of molybdenum in the porphyry Mo (–Nb) deposit at Cave Peak, Texas. J. Petrol. 2010, 51, 1739–1760. [Google Scholar] [CrossRef]
- Klemm, L.M.; Pettke, T.; Heinrich, C.A.; Campos, E. Hydrothermal evolution of the El Teniente deposit, Chile: Porphyry Cu-Mo ore deposition from low-salinity magmatic fluids. Econ. Geol. 2007, 102, 1021–1045. [Google Scholar] [CrossRef]
- Klemm, L.M.; Pettke, T.; Heinrich, C.A. Fluid and source magma evolution of the Questa porphyry Mo deposit, New Mexico, USA. Miner. Depos. 2008, 43, 533. [Google Scholar] [CrossRef]
- Landtwing, M.R.; Furrer, C.; Redmond, P.B.; Pettke, T.; Guillong, M.; Heinrich, C.A. The Bingham Canyon porphyry Cu-Mo-Au deposit. III. Zoned copper-gold ore deposition by magmatic vapor expansion. Econ. Geol. 2010, 105, 91–118. [Google Scholar] [CrossRef]
- Rusk, B.G.; Reed, M.H.; Dilles, J.H.; Klemm, L.; Heinrich, C.A. Compositions of magmatic hydrothermal fluids determined by LA-ICP-MS of fluid inclusions from the porphyry copper-molybdenum deposit at Butte. Montana. Chem. Geol. 2004, 210, 173–199. [Google Scholar] [CrossRef]
- Rusk, B.G.; Reed, M.H.; Dilles, J.H. Fluid inclusion evidence for magmatic-hydrothermal fluid evolution in the porphyry copper-molybdenum deposit at Butte, Montana. Econ. Geol. 2008, 103, 307–334. [Google Scholar] [CrossRef]
- Ulrich, T.; Mavrogenes, J.A. An experimental study of the solubility of molybdenum in H2O and KCl–H2O solutions from 500 °C to 800 °C, and 150 to 300 MPa. Geochim. Cosmochimca Acta 2008, 72, 2316–2330. [Google Scholar] [CrossRef]
- Zhang, L.; Audétat, A.; Dolejs, D. Solubility of molybdenite (MoS2) in aqueous fluids at 600–800 °C, 200 MPa: A synthetic fluid inclusion study. Geochim. Cosmochimca Acta 2012, 77, 175–185. [Google Scholar] [CrossRef]
- Mao, J.W.; Pirajno, F.; Xiang, J.F.; Gao, J.J.; Ye, H.S.; Li, Y.F.; Guo, B.J. Mesozoic molybdenum deposits in the east Qinling-Dabie orogenic belt: Characteristics and tectonic settings. Ore Geol. Rev. 2011, 43, 264–293. [Google Scholar] [CrossRef]
- Zeng, Q.D.; Liu, J.M.; Qin, K.Z.; Fan, H.R.; Chu, S.X.; Wang, Y.B.; Zhou, L.L. Types, characteristics, and time–space distribution of molybdenum deposits in China. Int. Geol. Rev. 2013, 55, 1311–1358. [Google Scholar] [CrossRef]
- Zeng, Q.D.; Liu, J.M.; Yu, C.M.; Ye, J.; Liu, H.T. Metal deposits in the Da Hinggan Mountains, NE China: Styles, characteristics, and exploration potential. Int. Geol. Rev. 2011, 53, 846–878. [Google Scholar] [CrossRef]
- Zeng, Q.D.; Liu, J.M.; Chu, S.X.; Wang, Y.B.; Sun, Y.; Duan, X.X.; Zhou, L.L. Mesozoic molybdenum deposits in the East Xingmeng orogenic belt, northeast China: Characteristics and tectonic setting. Int. Geol. Rev. 2012, 54, 1843–1869. [Google Scholar] [CrossRef]
- Zeng, Q.D.; Qin, K.Z.; Liu, J.M.; Li, G.M.; Zhai, M.G.; Chu, S.X.; Guo, Y.P. Porphyry molybdenum deposits in the Tianshan–Xingmeng orogenic belt, northern China. Int. J. Earth Sci. 2015, 104, 991–1023. [Google Scholar] [CrossRef]
- Ouyang, H.G.; Mao, J.W.; Santosh, M.; Zhou, J.; Zhou, Z.H.; Wu, Y.; Hou, L. Geodynamic setting of Mesozoic magmatism in NE China and surrounding regions: Perspectives from spatio-temporal distribution patterns of ore deposits. J. Asian Earth Sci. 2013, 78, 222–236. [Google Scholar] [CrossRef]
- Ouyang, H.G.; Mao, J.W.; Zhou, Z.H.; Su, H.M. Late Mesozoic metallogeny and intracontinental magmatism, southern Great Xing’an Range, northeastern China. Gondwana Res. 2015, 27, 1153–1172. [Google Scholar] [CrossRef]
- Wang, R.L.; Zeng, Q.D.; Zhang, Z.C.; Zhou, L.L.; Qin, K.Z. Extensive mineralization in the eastern segment of the Xingmeng orogenic belt, NE China: A regional view. Ore Geol. Rev. 2021, 135, 104204. [Google Scholar] [CrossRef]
- Xie, W.; Zeng, Q.D.; Wang, R.L.; Wu, J.J.; Zhang, Z.M.; Li, F.C.; Zhang, Z. Spatial-temporal distribution and tectonic setting of Mesozoic W-mineralized granitoids in the Xing-Meng Orogenic Belt, NE China. Int. Geol. Rev. 2022, 64, 1845–1884. [Google Scholar] [CrossRef]
- Shu, Q.H.; Chang, Z.S.; Lai, Y.; Zhou, Y.T.; Sun, Y.; Yan, C. Regional metallogeny of Mo-bearing Deposits in Northeastern China, with new Re-Os Dates of porphyry Mo Deposits in the Northern Xilamulun District. Econ. Geol. 2016, 111, 1783–1798. [Google Scholar] [CrossRef]
- Feng, Z.Q.; Liu, Y.J.; Li, L.; Jin, W.; Jiang, L.W.; Li, W.M.; Wen, Q.B.; Zhao, Y.L. Geochemical and geochronological constraints on the tectonic setting of the Xinlin ophiolite, northern Great Xing’an Range, NE China. Lithos 2019, 326−327, 213–229. [Google Scholar] [CrossRef]
- Liu, Y.J.; Li, W.M.; Feng, Z.Q.; Wen, Q.B.; Neubauer, F.; Liang, C.Y. A review of the Paleozoic tectonics in the eastern part of Central Asian Orogenic Belt. Gondwana Res. 2017, 43, 123–148. [Google Scholar] [CrossRef]
- Wu, F.Y.; Sun, D.Y.; Ge, W.C.; Zhang, Y.B.; Grant, M.L.; Wilde, S.A.; Jahn, B.M. Geochronology of the Phanerozoic granitoids in northeastern China. J. Asian Earth Sci. 2011, 41, 1–30. [Google Scholar] [CrossRef]
- Zhang, G.L. Metallogenic Regularity and Prospect Estimation of Urgen Au-Ag-Pb-Zn-Mo Polymetallic Ore Field in Erguna, Inner Mongolia. Ph.D. Thesis, Northeastern University, Shenyang, China, 2022. (In Chinese with English Abstract). [Google Scholar]
- Zhang, G.L.; Wen, S.Q.; Li, J.Y.; Xie, W. Petrogenesis and tectonic implications of alkali-rich porphyry in the Urgen ore field, Erguna Block, Inner Mongolia: Constraints from geochronology and geochemistry. Geotecton. Metallog. 2023, 47, 428–448, (In Chinese with English Abstract). [Google Scholar]
- Sengör, A.M.C.; Natal’in, B.A.; Burtman, V.S. Evolution of the Altaid tectonic collage and Paleozoic crustal growth in Eurasia. Nature 1993, 364, 299–307. [Google Scholar] [CrossRef]
- Eizenhöfer, P.R.; Zhao, G.C.; Zhang, J.; Sun, M. Final closure of the Paleo-Asian Ocean along the Solonker suture zone: Constraints from geochronological and geochemical data of Permian volcanic and sedimentary rocks. Tectonics 2014, 33, 441–463. [Google Scholar] [CrossRef]
- Xiao, W.J.; Windley, B.F.; Hao, J.; Zhai, M.G. Accretion leading to collision and the Permian Solonker suture, Inner Mongolia, China: Termination of the central Asian orogenic belt. Tectonics 2003, 22, 288–308. [Google Scholar] [CrossRef]
- Xiao, W.J.; Santosh, M. The western Central Asian Orogenic Belt: A window to accretionary orogenesis and continental growth. Gondwana Res. 2014, 25, 1429–1444. [Google Scholar] [CrossRef]
- Xu, W.L.; Pei, F.P.; Wang, F.; Meng, E.; Ji, W.Q.; Yang, D.B.; Wang, W. Spatial-temporal relationships of Mesozoic volcanic rocks in NE China: Constraints on tectonic overprinting and transformations between multiple tectonic systems. J. Asian Earth Sci. 2013, 74, 167–193. [Google Scholar] [CrossRef]
- Wilde, S.A. Final amalgamation of the Central Asian Orogenic Belt in NE China: Paleo-Asian Ocean closure versus Paleo-Pacific plate subduction–A review of the evidence. Tectonophysics 2015, 662, 345–362. [Google Scholar] [CrossRef]
- Chen, P.W.; Zeng, Q.D.; Wang, Y.B.; Zhou, T.C.; Yu, B.; Chen, J.Q. Petrogenesis of the Dasuji porphyry Mo deposit at the northern margin of North China Craton: Constrains from geochronology, geochemistry and isotopes characteristics. Lithos 2018, 322, 87–103. [Google Scholar] [CrossRef]
- Chen, P.W.; Zeng, Q.D.; Zhou, T.C. Petrogenesis and Mo prospecting significance of Sadaigoumen granites on the northern margin of the North China Craton. J. Geochem. Explor. 2020, 214, 106536. [Google Scholar] [CrossRef]
- Tang, W.H.; Li, J.; Wang, K.Y.; Li, S.D.; Cai, W.Y.; Liu, H.L.; Wang, Y.C. Ore genesis and tectonic setting of the Laojiagou porphyry molybdenum deposit, Inner Mongolia, China: Evidence from geology, fluid inclusions, H–O isotopes, zircon U–Pb geochronology, and geochemistry. Arab. J. Geosci. 2019, 12, 731. [Google Scholar] [CrossRef]
- Duan, X.X.; Zeng, Q.D.; Yang, Y.H.; Liu, J.M.; Chu, S.X.; Sun, Y.; Zhang, Z.L. Triassic magmatism and Mo mineralization in Northeast China: Geochronological and isotopic constraints from the Laojiagou porphyry Mo deposit. Int. Geol. Rev. 2015, 57, 55–75. [Google Scholar] [CrossRef]
- Sun, Q.F.; Wang, K.Y.; Sun, F.Y.; Lai, C.K.; Zhang, M.; Zhao, C.G.; Sun, L.X. Superimposing porphyry Mo and vein-type Cu-Pb-Zn mineralization in the Panjiaduan deposit, Great Xing’an Range (NE China): Perspective from zircon U-Pb and sphalerite Rb-Sr dating, geochemistry and S-Pb isotopes. Ore Geol. Rev. 2021, 139, 104538. [Google Scholar] [CrossRef]
- Zeng, Q.D.; Yang, J.H.; Liu, J.M.; Chu, S.X.; Duan, X.X.; Zhang, Z.L.; Zhang, W.Q.; Zhang, S. Genesis of the Chehugou Mo-bearing granitic complex on the northern margin of the North China Craton: Geochemistry, zircon U-Pb age and Sr-Nd-Pb isotopes. Geol. Mag. 2011, 149, 753–767. [Google Scholar] [CrossRef]
- Chen, Z.G.; Zhang, L.C.; Lu, B.Z.; Li, Z.L.; Wu, H.Y.; Xiang, P.; Huang, S.W. Geochronology and geochemistry of the Taipingchuan copper-molybdenum deposit in Inner Mongolia, and its geological significances. Acta Petrol. Sin. 2010, 26, 1437–1449, (In Chinese with English Abstract). [Google Scholar] [CrossRef]
- Kang, Y.J.; She, H.Q.; Lai, Y.; Wang, Z.Q.; Li, J.W.; Zhang, Z.H.; Xiang, A.P.; Jiang, Z.S. Evolution of Middle-Late Triassic granitic intrusions from the Badaguan Cu-Mo deposit, Inner Mongolia: Constraints from zircon U-Pb dating, geochemistry and Hf isotopes. Ore Geol. Rev. 2018, 95, 195–215. [Google Scholar] [CrossRef]
- Kang, Y.J.; Wang, Y.J.; Huang, G.J.; She, H.Q.; Xiang, A.P.; Tian, J.; Guo, Z.J.; Dong, X.Z. Study of rock-forming and ore-forming ages of Badaguan porphyry Cu-Mo deposit in Inner Mongolia. Miner. Depos. 2014, 33, 795–806, (In Chinese with English Abstract). [Google Scholar]
- Mi, K.F.; Liu, Z.J.; Li, C.F.; Liu, R.B.; Wang, J.P.; Peng, R.M. Origin of the Badaguan porphyry Cu Mo deposit, Inner Mongolia, northeast China: Constraints from geology, isotope geochemistry and geochronology. Ore Geol. Rev. 2017, 81, 154–172. [Google Scholar] [CrossRef]
- Gao, B.Y.; Zhang, L.C.; Jin, X.D.; Li, W.J.; Chen, Z.G.; Zhu, M.T. Geochronology and geochemistry of the Badaguan porphyry Cu–Mo deposit in Derbugan metallogenic belt of the NE China, and their geological significances. Int. J. Earth Sci. 2015, 105, 507–519. [Google Scholar] [CrossRef]
- Wang, Y.H.; Zhao, C.B.; Zhang, F.F.; Liu, J.J.; Wang, J.P.; Peng, R.M.; Liu, B. SIMS zircon U–Pb and molybdenite Re–Os geochronology, Hf isotope, and whole-rock geochemistry of the Wunugetushan porphyry Cu–Mo deposit and granitoids in NE China and their geological significance. Gondwana Res. 2015, 28, 1228–1245. [Google Scholar] [CrossRef]
- Mi, K.F.; Liu, Z.J.; Liu, R.B.; Li, C.F.; Wang, J.P.; Peng, R.M. U–Pb zircon, geochemical and Sr–Nd–Hf isotopic constraints on age and origin of the intrusions from Wunugetushan porphyry deposit, Northeast China: Implication for Triassic–Jurassic Cu–Mo mineralization in Mongolia–Erguna metallogenic belt. Int. Geol. Rev. 2018, 60, 496–512. [Google Scholar] [CrossRef]
- Zhang, X.J.; Zhang, Y.Y.; Liu, K.; He, X.L.; Wang, S.X.; Jia, W.H.; Zhao, Z.N. Zircon U-Pb and Lu-Hf isotopic dating of magmatic rocks in the Wunugetushan porphyry copper-molybdenum deposit, Inner Mongolia. Rock. Miner. Anal. 2022, 41, 774–788, (In Chinese with English Abstract). [Google Scholar]
- Zheng, W.; Yu, X.F. Geochronological and Geochemical Constraints on the Petrogenesis and Geodynamic Setting of the Daheishan Porphyry Mo Deposit, Northeast China. Resour. Geol. 2018, 68, 1–21. [Google Scholar] [CrossRef]
- Zhou, L.L.; Zeng, Q.D.; Liu, J.M.; Friis, H.; Zhang, Z.L.; Duan, X.X. Geochronology of the Xingshan molybdenum deposit, Jilin Province, NE China, and its Hf isotope significance. J. Asian Earth Sci. 2013, 75, 58–70. [Google Scholar] [CrossRef]
- Wang, Z.G.; Wang, K.Y.; Wan, D.; Konare, Y.; Yang, T.N.; Liang, Y.H. Metallogenic age and hydrothermal evolution of the Jidetun Mo deposit in central Jilin Province, northeast China: Evidence from fluid inclusions, isotope systematics, and geochronology. Ore Geol. Rev. 2017, 89, 731–751. [Google Scholar] [CrossRef]
- Zhang, Y.; Sun, J.G.; Xing, S.W.; Zhao, K.Q.; Ma, Y.B.; Zhang, Z.J.; Wang, Y. Ore-forming granites from Jurassic porphyry Mo deposits, east–central Jilin Province, China: Geochemistry, geochronology, and petrogenesis. Int. Geol. Rev. 2016, 58, 1158–1174. [Google Scholar] [CrossRef]
- Hou, X.G.; Sun, D.Y.; Gou, J.; Yang, D.G. The origin of variable-δ18O zircons in Jurassic and Cretaceous Mo-bearing granitoids in the eastern Xing–Meng Orogenic Belt, Northeast China. Int. Geol. Rev. 2019, 61, 129–149. [Google Scholar] [CrossRef]
- Yu, X.F.; Hou, Z.Q.; Qian, Y.; Li, B.L. Ore–forming fluids, stable isotopes and metallogenic epoch of the Fu’anpu molybdenum deposit in Mid–East Jilin Province. Geol. Explor. 2012, 48, 1151–1162, (In Chinese with English Abstract). [Google Scholar]
- Zhang, Y.; Sun, J.G.; Chen, Y.J.; Zhao, K.Q.; Gu, A.L. Re–Os and U–Pb geochronology of porphyry Mo deposits in central Jilin Province: Mo ore-forming stages in northeast China. Int. Geol. Rev. 2013, 55, 1763–1785. [Google Scholar] [CrossRef]
- Zhang, Y.; Xing, S.W.; Sun, J.G.; Zhao, K.Q.; Wang, Y. Re-Os and U-Pb ages of the Sifangdianzi molybdenite deposit in central Jilin Province, NE China. Acta Geol. Sin. Engl. Ed. 2014, 88, 1045–1046. [Google Scholar] [CrossRef] [PubMed]
- Yang, Y.C.; Han, S.J.; Sun, D.Y.; Guo, J.; Zhang, S.J. Geological and geochemical features and geochronology of porphyry molybdenum deposits in the Lesser Xing’an Range-Zhangguangcai Range metallogenic belt. Acta Petrol. Sin. 2012, 28, 379–390, (In Chinese with English Abstract). [Google Scholar]
- Hu, X.L.; Ding, Z.J.; He, M.C.; Yao, S.Z.; Zhu, B.P.; Shen, J.; Chen, B. A porphyry-skarn metallogenic system in the Lesser Xing’an Range, NE China: Implications from U–Pb and Re–Os geochronology and Sr–Nd–Hf isotopes of the Luming Mo and Xulaojiugou Pb–Zn deposits. J. Asian Earth Sci. 2014, 90, 88–100. [Google Scholar] [CrossRef]
- Cheng, G.H.; Wang, R.L.; Zeng, Q.D.; Guo, Y.P.; Duan, X.X.; Wei, J.J.; Zhang, J.S.; Gao, X.H. Zircon U-Pb ages, Hf isotopes of the granitoids and Re-Os ages of the molybdenites in Luming molybdenum ore area, Heilongjiang Province, and its geological significance. Acta Petrol. Sin. 2015, 31, 2450–2464, (In Chinese with English Abstract). [Google Scholar]
- Sun, J.G.; Zhang, Y.; Xing, S.W.; Zhao, K.Q.; Zhang, Z.J.; Bai, L.A.; Ma, Y.B.; Liu, Y.S. Genetic types, ore-forming age and geodynamic setting of endogenic molybdenum deposits in the eastern edge of Xing-Meng orogenic belt. Acta Petrol. Sin. 2012, 28, 1317–1332, (In Chinese with English Abstract). [Google Scholar]
- Hu, X.L.; Yao, S.Z.; Zeng, G.P.; Liu, W.H.; Zhang, Z.J. Multistage magmatism resulting in large-scale mineralizaion: A case from the Huojihe porphyry Mo deposit in NE China. Lithos 2019, 326-327, 397–414. [Google Scholar] [CrossRef]
- Zhang, C.; Li, N. Geochronology and zircon Hf isotope geochemistry of granites in the giant Chalukou Mo deposit, NE China: Implications for tectonic setting. Ore Geol. Rev. 2017, 81, 780–793. [Google Scholar] [CrossRef]
- Liu, Y.F.; Bagas, L.; Jiang, S.H.; Wang, F.X. The Chalukou deposit in the North Great Xing’an Range of China: A protracted porphyry Mo ore-forming system in a long-lived magmatic evolution cycle. Ore Geol. Rev. 2017, 89, 171–186. [Google Scholar] [CrossRef]
- Liu, J.; Mao, J.W.; Wu, G.; Wang, F.; Luo, D.F.; Hu, Y.Q. Zircon U-Pb and molybdenite Re-Os dating of the Chalukou porphyry Mo deposit in the northern Great Xing’an Range, China and its geological significance. J. Asian Earth Sci. 2014, 79, 696–709. [Google Scholar] [CrossRef]
- Li, Z.Z.; Qin, K.Z.; Li, G.M.; Ishihara, S.; Jin, L.Y.; Song, G.X.; Meng, Z.J. Formation of the giant Chalukou porphyry Mo deposit in northern Great Xing’an Range, NE China: Partial melting of the juvenile lower crust in intra-plate extensional environment. Lithos 2014, 202−203, 138–156. [Google Scholar] [CrossRef]
- Hu, X.L.; Yao, S.Z.; He, M.C.; Ding, Z.J.; Cui, Y.B.; Shen, J.; Chen, B.; Zhu, B.P. Geochemistry, U-Pb Geochronology and Hf Isotope Studies of the Daheishan Porphyry Mo Deposit in Heilongjiang Province, NE China. Resour. Geol. 2014, 64, 102–116. [Google Scholar] [CrossRef]
- Deng, C.Z.; Sun, D.Y.; Han, J.S.; Chen, H.Y.; Li, G.H.; Xiao, B.; Li, R.C.; Feng, Y.Z.; Li, C.L.; Lu, S. Late-stage southwards subduction of the Mongol-Okhotsk oceanic slab and implications for porphyry Cu Mo mineralization: Constraints from igneous rocks associated with the Fukeshan deposit, NE China. Lithos 2019, 326–327, 341–357. [Google Scholar] [CrossRef]
- Deng, C.Z.; Li, G.H. The Cu-Mo mineralization of the Late Jurassic Porphyry in the northern Great Xing’an Range: Constraints from zircon U-Pb ages of the ore-causative granites. Acta Geol. Sin. (Engl. Ed.) 2019, 93, 236–237. [Google Scholar] [CrossRef]
- Wang, S.W.; Wang, J.G.; Zhang, D.; Qi, X.J.; Wu, G.G.; Zhao, P.Z.; Yang, Z.F.; Liu, Y.B. Geochronological study on Taipinggou molybdenum deposit in Da Hinggan Mountain. Acta Petrol. Sin. 2009, 25, 2913–2923, (In Chinese with English Abstract). [Google Scholar]
- Wang, Z.L.; Yang, J.Z.; Zhao, K.Q.; Fu, Y.G.; Duan, Z.; Lin, L.J.; Xi, M.J.; Deng, Y.M.; Lu, G.F. Zircon U-Pb age, geochemical characteristics and geological significance of the granite of Jiazishan Mo(Ag) deposit, Inner Mongolia. Earth Sci. 2021. (In Chinese with English Abstract). [Google Scholar]
- Sun, H.R.; Huang, Z.L.; Li, W.B.; Leng, C.B.; Ma, D.Y.; Zhang, X.C. Chronology, geochemistry and Sr–Nd isotope studies of Jurassic intrusions in the Diyanqinamu porphyry Mo mine, central Inner Mongolia, China. J. Asian Earth Sci. 2014, 88, 85–97. [Google Scholar] [CrossRef]
- Zhai, D.G.; Liu, J.J.; Wang, J.P.; Yang, Y.Q.; Zhang, H.Y.; Wang, X.L.; Zhang, Q.B.; Wang, G.W.; Liu, Z.J. Zircon U–Pb and molybdenite Re–Os geochronology, and whole-rock geochemistry of the Hashitu molybdenum deposit and host granitoids, Inner Mongolia, NE China. J. Asian Earth Sci. 2014, 79, 144–160. [Google Scholar] [CrossRef]
- Zeng, Q.D.; Guo, W.K.; Chu, S.X.; Duan, X.X. Late Jurassic granitoids in the Xilamulun Mo belt, Northeastern China: Geochronology, geochemistry, and tectonic implications. Int. Geol. Rev. 2016, 58, 588–602. [Google Scholar] [CrossRef]
- Shang, Z.; Zhou, D.; Chen, Y.Q. Genesis, metallogenetic and tectonic significance of the A-type granites in Hashitu Mo deposit, southern Great Hinggan Range, NE China. Ore Geol. Rev. 2021, 138, 104388. [Google Scholar] [CrossRef]
- Wu, H.Y.; Zhang, L.C.; Wan, B.; Chen, Z.G.; Zhang, X.J.; Xiang, P. Geochronological and geochemical constraints on Aolunhua porphyry Mo–Cu deposit, northeast China, and its tectonic significance. Ore Geol. Rev. 2011, 43, 78–91. [Google Scholar] [CrossRef]
- Ma, X.H.; Chen, B.; Lai, Y.; Lu, Y.H. Petrogenesis and mineralization chronology study on the Aolunhua porphyry Mo deposit, Inner Mongolia, and its geological implications. Acta Petrol. Sin. 2009, 25, 2939–2950, (In Chinese with English Abstract). [Google Scholar]
- Shu, Q.H.; Lai, Y.; Zhou, Y.T.; Xu, J.J.; Wu, H.Y. Zircon U–Pb geochronology and Sr–Nd–Pb–Hf isotopic constraints on the timing and origin of Mesozoic granitoids hosting the Mo deposits in northern Xilamulun district, NE China. Lithos 2015, 238, 64–75. [Google Scholar] [CrossRef]
- Zeng, Q.D.; Liu, J.M. Zircon SHRIMP U-Pb dating and geological significance of the granite porphyry from Banlashan porphyry molybdenum deposit in Xilamulun molybdenum metallogenic belt. J. Jilin Univ. Earth Sci. Ed. 2010, 40, 828–834, (In Chinese with English Abstract). [Google Scholar]
- Zeng, Q.D.; Yang, J.H.; Zhang, Z.L.; Liu, J.M.; Duan, X.X. Petrogenesis of the Yangchang Mo-bearing granite in the Xilamulun metallogenic belt, NE China: Geochemistry, zircon U-Pb ages and Sr-Nd-Pb isotopes. Geol. J. 2014, 49, 1–14. [Google Scholar] [CrossRef]
- Ji, H.W.; Niu, Z.L.; Dong, Q.; Zhang, C. Zircon U-Pb and molybdenite Re-Os dating for Hongshanzi uranium-molybdenum deposit in the Inner Mongolia and its geological significance. Uranium Geol. 2021, 37, 810–822, (In Chinese with English Abstract). [Google Scholar]
- Zeng, Q.D.; Liu, J.M.; Qin, F.; Zhang, Z.L. Geochronology of the Xiaodonggou Porphyry Mo Deposit in Northern Margin of North China Craton. Resour. Geol. 2010, 60, 192–202. [Google Scholar] [CrossRef]
- Zeng, Q.D.; Liu, J.M.; Zhang, Z.L.; Chen, W.J.; Zhang, W.Q. Geology and geochronology of the Xilamulun molybdenum metallogenic belt in eastern Inner Mongolia, China. Int. J. Earth Sci. 2011, 100, 1791–1809. [Google Scholar] [CrossRef]
- Li, Y.; Yang, Y.Q.; Hua, L.; Leng, Y.X.; Xin, J. Geochronology and Tectonic Implications of the Nianzigou Granites and Associated Mo Deposit, Inner Mongolia. Minerals 2022, 12, 791. [Google Scholar] [CrossRef]
- Wu, H.Y.; Zhang, L.C.; Pirajno, F.; Xiang, P.; Wan, B.; Chen, Z.G.; Zhang, X.J. The Jiguanshan porphyry Mo deposit in the Xilamulun metallogenic belt, northern margin of the North China Craton, U–Pb geochronology, isotope systematics, geochemistry and fluid inclusion studies: Implications for a genetic model. Ore Geol. Rev. 2014, 56, 549–565. [Google Scholar] [CrossRef]
- Ge, W.C.; Wu, F.Y.; Zhou, C.Y.; Zhang, J.H. The ore-forming time of porphyry Cu and Mo deposits in eastern segment of the Xing-Meng orogen and its geodynamic significance. Chinese Sci. Bull. 2007, 52, 2407–2417. (In Chinese) [Google Scholar] [CrossRef]
- Ge, W.C.; Wu, F.Y.; Zhou, C.Y.; Abdel Rahman, A.A. Emplacement age of the Tahe granite and its constraints on the tectonic nature of the Ergun block in the northern part of the Da Hinggan Range. Chinese Sci. Bull. 2005, 50, 2097–2105. [Google Scholar] [CrossRef]
- Zhou, J.B.; Wang, B.; Wilde, S.A.; Zhao, G.C.; Cao, J.L.; Zheng, C.Q.; Zeng, W.S. Geochemistry and U–Pb zircon dating of the Toudaoqiao blueschists in the Great Xing’ an Range, northeast China, and tectonic implications. J. Asian Earth Sci. 2015, 97, 197–210. [Google Scholar] [CrossRef]
- Feng, Z.Q.; Liu, Y.J.; Jin, W.; Li, W.M.; Wen, Q.B. Is there the Paleoproterozoic komatiite related to mantle plume in the Jifeng area, Northern Great Xing’an Range, NE China? Int. J. Earth Sci. 2017, 106, 2225–2231. [Google Scholar] [CrossRef]
- Miao, L.C.; Zhang, F.; Jiao, S.J. Age, protoliths and tectonic implications of the Toudaoqiao blueschist, Inner Mongolia, China. J. Asian Earth Sci. 2015, 105, 360–373. [Google Scholar] [CrossRef]
- IMBGMR. Regional Geology of Inner Mongolia; Geological Publishing House: Beijing, China, 1991. (In Chinese) [Google Scholar]
- Zhao, S.; Xu, W.L.; Tang, J.; Li, Y.; Guo, P. Timing of formation and tectonic nature of the purportedly Neoproterozoic Jiageda formation of the Erguna Massif, NE China: Constraints from field geology and U-Pb geochronology of detrital and magmatic zircons. Precambrian Res. 2016, 281, 585–601. [Google Scholar] [CrossRef]
- Li, S.C.; Liu, Z.H.; Xu, Z.Y.; Li, G.; Zhang, C. Age and tectonic setting of volcanic rocks of the Tamulangou Formation in the Great Xing’an Range, NE China. J. Asian Earth Sci. 2015, 113, 471–480. [Google Scholar] [CrossRef]
- Ji, Z.; Ge, W.C.; Wang, Q.H.; Yang, H.; Zhao, G.C.; Bi, J.H.; Dong, Y. Petrogenesis of early Cretaceous volcanic rocks of the Manketouebo formation in the Wuchagou region, central great Xing’an range, NE China, and tectonic implications: Geochronological, geochemical, and Hf isotopic evidence. Int. Geol. Rev. 2016, 58, 556–573. [Google Scholar] [CrossRef]
- Badarch, G.; Cunningham, W.D.; Windley, B.F. A new terrane subdivision for Mongolia: Implications for the Phanerozoic crustal growth of Central Asia. J. Asian Earth Sci. 2002, 21, 87–110. [Google Scholar] [CrossRef]
- Li, S.; Wang, T.; Wilde, S.A.; Tong, Y. Evolution, source and tectonic significance of early Mesozoic granitoid magmatism in the central Asian Orogenic Belt (central segment). Earth-Sci. Rev. 2013, 126, 206–234. [Google Scholar] [CrossRef]
- Gou, J.; Sun, D.Y.; Ren, Y.S.; Liu, Y.J.; Zhang, S.Y.; Fu, C.L.; Wang, T.H.; Wu, P.F.; Liu, X.M. Petrogenesis and geodynamic setting of Neoproterozoic and Late Paleozoic magmatism in the Manzhouli-Erguna area of Inner Mongolia, China: Geochronological, geochemical and Hf isotopic evidence. J. Asian Earth Sci. 2013, 67–68, 114–137. [Google Scholar] [CrossRef]
- Gou, J.; Sun, D.Y.; Yang, D.G.; Tang, Z.Y.; Mao, A.Q. Late Paleozoic igneous rocks of the Great Xing’an Range, NE China: The Tayuan example. Int. Geol. Rev. 2017, 21, 314–340. [Google Scholar]
- Tang, J.; Xu, W.L.; Wang, F.; Wang, W.; Xu, M.J.; Zhang, Y.H. Geochronology and geochemistry of Early-Middle Triassic magmatism in the Erguna Massif, NE China: Constraints on the tectonic evolution of the Mongol-Okhotsk suture belt. Lithos 2014, 184–187, 1–16. [Google Scholar] [CrossRef]
- Sun, D.Y.; Gou, J.; Wang, T.H.; Ren, Y.S.; Liu, Y.J.; Gou, H.Y.; Liu, X.M.; Hu, Z.C. Geochronological and geochemical constraints on the Erguna massif basement, NE China subduction history of the Mongol-Okhotsk oceanic crust. Int. Geol. Rev. 2013, 55, 1801–1816. [Google Scholar] [CrossRef]
- Wang, W.; Tang, J.; Xu, W.L.; Wang, F. Geochronology and geochemistry of Early Jurassic volcanic rocks in the Erguna Massif, northeast China: Petrogenesis and implications for the tectonic evolution of the Mongol–Okhotsk suture belt. Lithos 2015, 218−219, 73–86. [Google Scholar] [CrossRef]
- Tang, J.; Xu, W.L.; Wang, F.; Zhao, S.; Wang, W. Early Mesozoic southward subduction history of the Mongol-Okhotsk oceanic plate: Evidence from geochronology and geochemistry of Early Mesozoic intrusive rocks in the Erguna Massif, NE China. Gondwana Res. 2016, 31, 218–240. [Google Scholar] [CrossRef]
- Du, A.D.; Wu, S.Q.; Sun, D.Z.; Wang, S.X.; Qu, W.J.; Markey, R.; Stein, H.; Morgan, J.; Malinovoskiy, D. Preparation and certification of Re-Os dating reference materials, molybdenite HLP and JDC. Geostand. Geoanalytical Res. 2004, 28, 41–52. [Google Scholar] [CrossRef]
- Shirey, S.B.; Walker, R.J. Carius tube digestion for low-blank Rhenium-Osmium analysis. Anal. Chem. 1995, 67, 2136–2141. [Google Scholar] [CrossRef]
- Smoliar, M.I.; Walker, R.J.; Morgan, J.W. Re–Os ages of group IIA, IIIA, IVA, and IVB iron meteorites. Science 1996, 271, 1099–1102. [Google Scholar] [CrossRef]
- Wopenka, B.; Pasteris, J.D.; Freeman, J.J. Analysis of individual fluid inclusions by Fourier transform infrared and Raman microspectroscopy. Geochim. Cosmochimca Acta 1990, 54, 519–533. [Google Scholar] [CrossRef]
- Goldstein, R.H.; Reynolds, T.J. Systematics of fluid inclusions in diagenetic minerals. Soc. Sediment. Geol. 1994, 31, 199. [Google Scholar]
- Collins, P.L.F. Gas hydrates in CO2-bearing fluid inclusions and the use of freezing data for estimation of salinity. Econ. Geol. 1979, 74, 1435–1444. [Google Scholar] [CrossRef]
- Bodnar, R.J. Revised equation and table for determining the freezing point depression of H2O-NaCl solutions. Geochim. Cosmochimca Acta 1993, 57, 683–684. [Google Scholar] [CrossRef]
- Bodnar, R.J.; Vityk, M.O. Interpretation of microthermometric data for H2O-NaCl fluid inclusions. In Fluid Inclusion in Minerals: Methods and Applications; Springer: Berlin/Heidelberg, Germany, 1994; pp. 117–130. [Google Scholar]
- Brown, P.E.; Lamb, W.M. P-V-T properties of fluids in the system H2O ± CO2 ± NaCl: New graphic presentations and implications for fluid inclusion studies. Geochim. Cosmochimca Acta 1989, 53, 1209–1221. [Google Scholar] [CrossRef]
- Duan, Z.; Moller, N.; Weare, J.H. An Equation of State for the CH4-CO2-H2O System: I. Pure Systems from 0 to 1000 °C and 0 to 8000 Bar. Geochim. Cosmochimca Acta 1992, 56, 2605–2617. [Google Scholar] [CrossRef]
- Duan, Z.; Moller, N.; Weare, J.H. An Equation of State for the CH4-CO2-H2O System: II. Mixtures from 50 to 1000 °C and 0 to 1000 bars. Geochim. Cosmochimca Acta 1992, 56, 2619–2631. [Google Scholar] [CrossRef]
- Clayton, R.N.; O’Neil, J.R.; Mayeda, T.K. Oxygen isotope exchange between quartz and water. J. Geophys. Res. 1972, 77, 3057–3067. [Google Scholar] [CrossRef]
- Robinson, B.W.; Kusakabe, M. Quantitative preparation of sulfur dioxide, for 34S/32S analyses, from sulfides by combustion with cuprous oxide. Anal. Chem. 1975, 47, 1179–1181. [Google Scholar] [CrossRef]
- Todt, W.; Cliff, R.A.; Hanser, A.; Hofmann, A.W. Re-calibration of NBS lead standards using a 202Pb-205Pb double spike. Terra Abstr. 1993, 5, 396. [Google Scholar]
- Roedder, E. Fluid inclusions. Geol. Soc. Am. Bull. 1984, 12, 1–644. [Google Scholar]
- Chi, G.X.; Lu, H.Z. Validation and representation of fluid inclusion microthermometric data using the fluid inclusion assemblage (FIA) concept. Acta Petrol. Sin. 2008, 24, 1945–1953, (In Chinese with English Abstract). [Google Scholar]
- Chi, G.X.; Diamond, L.W.; Lu, H.Z.; Lai, J.Q.; Chu, H.X. Common Problems and Pitfalls in Fluid Inclusion Study: A Review and Discussion. Minerals 2021, 11, 7. [Google Scholar] [CrossRef]
- Davis, D.W.; Lowenstein, T.K.; Spencer, R.J. Melting behavior of fluid inclusions in laboratory-grown halite crystals in the systems NaCl-H2O, NaCl-KCl-H2O, NaCl-MgCl2-H2O, and NaCl-CaCl2-H2O. Geochim. Cosmochimca Acta 1990, 54, 591–601. [Google Scholar] [CrossRef]
- Rosso, K.M.; Bodnar, R.J. Microthermometric and Raman spectroscopic detection limits of CO2 in fluid inclusions and the Raman spectroscopic characterization of CO2. Geochim. Cosmochimca Acta 1995, 59, 3961–3975. [Google Scholar] [CrossRef]
- Audétat, A. A Plea for More Skepticism toward Fluid Inclusions: Part II. Homogenization via Halite Dissolution in Brine Inclusions from Magmatic-Hydrothermal Systems Is Commonly the Result of Postentrapment Modifications. Econ. Geol. 2023, 118, 43–55. [Google Scholar] [CrossRef]
- Zhang, D.H.; Audétat, A. A Plea for More Skepticism toward Fluid Inclusions: Part I. Postentrapment Changes in Fluid Density and Fluid Salinity Are Very Common. Econ. Geol. 2023, 118, 15–41. [Google Scholar] [CrossRef]
- Audétat, A.; Günther, D. Mobility and H2O loss from fluid inclusions in natural quartz crystals. Contrib. Miner. Petr. 1999, 137, 1–14. [Google Scholar] [CrossRef]
- Taylor, H.P. The application of oxygen and hydrogen isotope studies to problems of hydrothermal alteration and ore deposition. Econ. Geol. 1974, 69, 843–883. [Google Scholar] [CrossRef]
- Zhang, L.G. Application of Stable Isotopes in Geological Sciences; Shanxi Science and Technology Press: Xi’an, China, 1985. (In Chinese) [Google Scholar]
- Zartman, R.E.; Doe, B.R. Plumbotectonics: The model. Tectonophysics 1981, 75, 135–162. [Google Scholar] [CrossRef]
- Stein, H.J. Dating and tracing the history of ore formation. In Treatise in Geochemistry, 2nd ed.; Turekian, K.K., Holland, H.D., Scott, S.D., Eds.; Elsevier-Pergamon: Oxford, UK, 2014; Volume 12. [Google Scholar]
- Zhai, D.G.; Williams-Jones, A.E.; Liu, J.J.; Selby, D.; Li, C.; Huang, X.W.; Qi, L.; Guo, D.H. Evaluating the use of the molybdenite Re-Os chronometer in dating gold mineralization: Evidence from the Haigou deposit, northeastern China. Econ. Geol. 2019, 114, 897–915. [Google Scholar] [CrossRef]
- Stein, H.J.; Markey, R.J.; Morgan, J.W.; Hannah, J.L.; Scherstén, A. The remarkable Re-Os chronometer in molybdenite: How and why it works. Terra Nova 2001, 13, 479–486. [Google Scholar] [CrossRef]
- Stein, H.; Schersten, A.; Hannah, J.; Markey, R. Subgrain-scale decoupling of Re and 187Os and assessment of laser ablation ICP-MS spot dating in molybdenite. Geochim. Cosmochim. Acta 2003, 67, 3673–3686. [Google Scholar] [CrossRef]
- Selby, D.; Creaser, R.A. Macroscale NTIMS and microscale LA-MC-ICP-MS Re-Os isotopic analysis of molybdenite: Testing spatial restrictions for reliable Re-Os age determinations, and implications for the decoupling of Re and Os within molybdenite. Geochim. Cosmochim. Acta 2004, 68, 3897–3908. [Google Scholar] [CrossRef]
- Porter, S.J.; Selby, D. Rhenium-Osmium (Re-Os) molybdenite systematics and geochronology of the Cruachan granite skarn mineralization, Etive Complex: Implications for emplacement chronology. Scott. J. Geol. 2010, 46, 17–21. [Google Scholar] [CrossRef]
- Rathkopf, C.; Mazdab, F.; Barton, I.; Barton, M.D. Grain-scale and deposit-scale heterogeneity of Re distribution in molybdenite at the Bagdad porphyry Cu-Mo deposit, Arizona. J. Geochem. Explor. 2017, 178, 45–54. [Google Scholar] [CrossRef]
- Chen, W.T.; Zhou, M.F. Paragenesis, stable isotopes, and molybdenite Re-Os isotope age of the Lala iron-copper deposit, southwest China. Econ. Geol. 2012, 107, 459–480. [Google Scholar] [CrossRef]
- Lawley, C.J.M.; Selby, D. Re-Os geochronology of quartz-enclosed ultrafine molybdenite: Implications for ore geochronology. Econ. Geol. 2012, 107, 1499–1505. [Google Scholar] [CrossRef]
- Li, J.; Xu, L.L.; Bi, X.W.; Tang, Y.Y.; Sheng, X.Y.; Yu, H.J.; Liu, G.; Ma, R. New titanite U–Pb and molybdenite Re–Os ages for a hydrothermal vein-type Cu deposit in the Lanping Basin, Yunnan, SW China: Constraints on regional metallogeny and implications for exploration. Miner. Depos. 2021, 56, 441–456. [Google Scholar] [CrossRef]
- Girei, M.B.; Li, H.; Vincent, V.I.; Algeo, T.J.; Elatikpo, S.M.; Bute, S.I.; Ahmed, H.A.; Amuda, A.K. Genesis and timing of Mo mineralization in the Mada Ring Complex, north-central Nigeria: Insights from whole-rock geochemistry, Nd-Sr isotopes, zircon U-Pb-Hf isotopes, and molybdenite Re-Os systematics. Miner. Depos. 2022, 57, 601–620. [Google Scholar] [CrossRef]
- Qi, H.W.; Hu, R.Z.; Wang, X.F.; Qu, W.J.; Bi, X.W.; Peng, J.T. Molybdenite Re–Os and muscovite 40Ar/39Ar dating of quartz vein-type W–Sn polymetallic deposits in Northern Guangdong, South China. Miner. Depos. 2012, 47, 607–622. [Google Scholar] [CrossRef]
- Huang, X.D.; Huang, D.; Lu, J.J.; Zhang, R.Q.; Ma, D.S.; Jiang, Y.H.; Chen, H.W.; Liu, J.X. Neoproterozoic tungsten mineralization: Geology, chronology, and genesis of the Huashandong W deposit in northwestern Jiangxi, South China. Miner. Depos. 2023, 58, 771–796. [Google Scholar] [CrossRef]
- Wu, H.Y.; Zhang, L.C.; Wan, B.; Chen, Z.G.; Xiang, P.; Pirajno, F.; Du, A.D.; Qu, W.J. Re–Os and 40Ar/39Ar ages of the Jiguanshan porphyry Mo deposit, Xilamulun metallogenic belt, NE China, and constraints on mineralization events. Miner. Depos. 2010, 46, 171–185. [Google Scholar] [CrossRef]
- Zhang, P.; Zhao, Y.; Kou, L.L.; Yang, H.Z.; Yang, F.C. Zircon U–Pb and molybdenite Re–Os geochronology of copper–molybdenum deposits in southeast Liaoning Province, China. Int. Geol. Rev. 2016, 58, 1481–1491. [Google Scholar] [CrossRef]
- Buret, Y.; von Quadt, A.; Heinrich, C.; Selby, D.; Walle, M.; Peytcheva, I. From a long-lived upper-crustal magma chamber to rapid porphyry copper-emplacement: Reading the geochemistry of zircon crystals at Bajo de la Alumbrera (NW Argentina). Earth Planet. Sci. Lett. 2016, 450, 120–131. [Google Scholar] [CrossRef]
- Cernuschi, F.; Dilles, J.H.; Grocke, S.B.; Valley, J.W.; Kitajima, K.; Tepley, F.J. Rapid formation of porphyry copper deposits evidenced by diffusion of oxygen and titanium in quartz. Geology 2018, 46, 611–614. [Google Scholar] [CrossRef]
- Li, Y.; Li, X.H.; Selby, D.; Li, J.W. Pulsed magmatic fluid release for the formation of porphyry deposits: Tracing fluid evolution in absolute time from the Tibetan Qulong Cu-Mo deposit. Geology 2018, 46, 7–10. [Google Scholar] [CrossRef]
- Li, Y.; Allen, M.B.; Li, X.H. Millennial pulses of ore formation and an extra-high Tibetan Plateau. Geology 2022, 50, 665–669. [Google Scholar] [CrossRef]
- Li, Y.; Zhang, R.Q.; He, S.; Chiaradia, M.; Li, X.H. Pulsed exsolution of magmatic ore-forming fluids in tin-tungsten systems: A SIMS cassiterite oxygen isotope record. Miner. Depos. 2022, 57, 343–352. [Google Scholar] [CrossRef]
- Von Quadt, A.; Erni, M.; Martinek, K.; Moll, M.; Peytcheva, I.; Heinrich, C.A. Zircon crystallization and the lifetimes of ore-forming magmatic-hydrothermal systems. Geology 2011, 39, 731–734. [Google Scholar] [CrossRef]
- Chiaradia, M.; Schaltegger, U.; Spikings, R.; Wotzlaw, J.F.; Ovtcharova, M. How accurately can we date the duration of magmatic-hydrothermal events in porphyry systems?—An invited paper. Econ. Geol. 2013, 108, 565–584. [Google Scholar] [CrossRef]
- Cathles, L.M.; Erendi, A.H.J.; Barrie, T. How long can a hydrothermal system be sustained by a single intrusive event? Econ. Geol. 1997, 92, 766–771. [Google Scholar] [CrossRef]
- Zhang, L.C.; Wu, H.Y.; Wan, B.; Chen, Z.G. Ages and geodynamic settings of Xilamulun Mo–Cu metallogenic belt in the northern part of the North China Craton. Gondwana Res. 2009, 16, 243–254. [Google Scholar] [CrossRef]
- Li, C.F.; Liu, Z.J.; Mi, K.F.; Wang, J.P.; Liu, R.B.; Zou, J.Y.; Wang, Z.B. Metallogenic age and ore genesis of the Badaguan porphyry copper-molybdenum deposit in Inner Mongolia. Geol. China 2014, 41, 1253–1269, (In Chinese with English Abstract). [Google Scholar]
- Han, C.M.; Xiao, W.J.; Windley, B.F.; Zhao, G.C.; Su, B.X.; Ao, S.J.; Zhang, J.E.; Zhang, Z.Y.; Wan, B.; Cui, B.; et al. Re-Os Age of Molybdenite from the Daheishan Mo Deposit in the Eastern Central Asian Orogenic Belt, NE China. Resour. Geol. 2014, 64, 379–386. [Google Scholar] [CrossRef]
- Wang, C.H.; Song, Q.H.; Wang, D.H.; Li, L.X.; Yu, C.; Wang, Z.G.; Qu, W.J.; Du, A.D.; Ying, L.J. Re-Os isotopic dating of molybdenite from the Daheishan molybdenum deposit of Jilin Province and its geological significance. Rock. Miner. Anal. 2009, 28, 269–273, (In Chinese with English Abstract). [Google Scholar]
- Wang, Z.G.; Wang, K.Y.; Konare, Y.; Yang, T.N.; Liang, Y.H. Metallogenesis and hydrothermal evolution of Middle Jurassic porphyry Mo deposits in the southern Zhangguangcai Range, NE China: Evidence from fluid inclusions, H–O–S isotopes, and Re–Os geochronology. Int. Geol. Rev. 2017, 59, 1391–1412. [Google Scholar] [CrossRef]
- Li, L.X.; Song, Q.H.; Wang, D.H.; Wang, C.H.; Qu, W.J.; Wang, Z.G.; Bi, S.Y.; Yu, C. Re-Os isotopic dating of molybdenite from the Fu’anpu molybdenum deposit of Jilin Province and discussion on its metallogenesis. Rock. Miner. Anal. 2009, 28, 283–287, (In Chinese with English Abstract). [Google Scholar]
- Zhang, Y. Research on Characteristics of Geology, Geochemistry and Metallogenic Mechanism of the Jurassic Molybdenum Deposits in the Mid-East Area of Jilin. Ph.D. Thesis, Jilin University, Changchun, China, 2013. (In Chinese with English Abstract). [Google Scholar]
- Zhang, Y.; Sun, J.G.; Xing, S.W.; Zhao, K.Q.; Ma, Y.B. Geochronology and metallogenesis of porphyry Mo deposits in east-central Jilin province, China: Constraints from molybdenite Re–Os isotope systematics. Ore Geol. Rev. 2015, 71, 363–372. [Google Scholar] [CrossRef]
- Ju, N.; Ren, Y.S.; Wang, C.; Wang, H.; Zhao, H.L.; Qu, W.J. Ore genesis and molybdenite Re-Os dating of Dashihe molybdenum deposit in Dunhua, Jilin. Glob. Geol. 2012, 31, 68–76, (In Chinese with English Abstract). [Google Scholar]
- Wang, H.; Ren, Y.S.; Zhao, H.L.; Ju, N.; Qu, W.J. Re-Os dating of molybdenite from the Liushengdian molybdenum deposit in Antun area of Jilin Province and its geological significance. Acta Geosci. Sin. 2011, 32, 707–715, (In Chinese with English Abstract). [Google Scholar]
- Chen, Z.G.; Zhang, L.C.; Wan, B.; Wu, H.Y.; Cleven, N. Geochronology and geochemistry of the Wunugetushan porphyry Cu-Mo deposit in NE China, and their geological significance. Ore Geol. Rev. 2011, 43, 92–105. [Google Scholar] [CrossRef]
- Zhang, L.C.; Gao, B.Y.; Li, W.J.; Chen, Z.G.; Sakyi, P.A.; Jin, X.D. Early Mesozoic tectono-magmatic activity and mineralization in Northeast China: Evidence from Re–Os to U–Pb studies of the Taipingchuan porphyry Cu–Mo deposit in the Derbugan metallogenic belt. Int. Geol. Rev. 2014, 56, 1837–1851. [Google Scholar] [CrossRef]
- Zhai, D.G.; Liu, J.J.; Wang, J.P.; Peng, R.M.; Wang, S.G.; Li, Y.N.; Chang, Z.Y. Re-Os isotopic chronology of molybdenite from the Taipinggou porphyry-type molybdenum deposit in Inner Mongolia and its geological significance. Geoscience 2009, 23, 262–268, (In Chinese with English Abstract). [Google Scholar]
- Wang, Z.L.; Zhao, K.Q.; Yang, J.Z.; Fu, Y.G.; Xi, M.J.; Li, C.; Deng, Y.M.; Lu, G.F. The molybdenite Re-Os dating of the Jiazishan Mo (Ag) deposit, Inner Mongolia and its geological significance. Acta Geol. Sin. 2021, 95, 3768–3777, (In Chinese with English Abstract). [Google Scholar]
- Leng, C.B.; Zhang, X.C.; Huang, Z.L.; Huang, Q.Y.; Wang, S.X.; Ma, D.Y.; Luo, T.Y.; Li, C.; Li, W.B. Geology, Re-Os ages, sulfur and lead isotopes of the Diyanqinamu porphyry Mo deposit, Inner Mongolia, NE China. Econ. Geol. 2015, 110, 557–574. [Google Scholar] [CrossRef]
- Shu, Q.H.; Jiang, L.; Lai, Y.; Lu, Y.H. Geochronology and fluid inclusion study of the Aolunhua porphyry Cu-Mo deposit in Arhorqin area, Inner Mongolia. Acta Petrol. Sin. 2009, 25, 2601–2614, (In Chinese with English Abstract). [Google Scholar]
- Zeng, Q.D.; Liu, J.M.; Zhang, Z.L. Re-Os geochronology of porphyry molybdenum deposit in south segment of Da Hinggan Mountains, Northeast China. J. Earth Sci.-China 2010, 21, 392–401. [Google Scholar] [CrossRef]
- Nie, F.J.; Zhang, W.Y.; Du, A.D.; Jiang, S.H.; Liu, Y. Re-Os isotopic dating on molybdenite separates from the Xiaodonggou porphyry Mo deposit, Hexigten Qi, Inner Mongolia. Acta Geol. Sin. 2007, 81, 898–905, (In Chinese with English Abstract). [Google Scholar]
- Chen, W.J.; Liu, J.M.; Liu, H.T.; Sun, X.G.; Zhang, R.B.; Zhang, Z.L.; Qin, F. Geochronology and fluid inclusion study of the Jiguanshan porphyry Mo deposit, Inner Mongolia. Acta Petrol. Sin. 2010, 26, 1423–1436, (In Chinese with English Abstract). [Google Scholar]
- Hedenquist, J.W.; Lowenstern, J.B. The role of magmas in the formation of hydrothermal ore deposits. Nature 1994, 370, 519–527. [Google Scholar] [CrossRef]
- Zhang, L.G. Theory of Diagenesis and Metallogenesis and Ore Prospecting; Beijing University of Technology Press: Beijing, China, 1989. (In Chinese) [Google Scholar]
- Barnes, H.L. Geochemistry of Hydrothermal Ore Deposits; Wiley: New York, NY, USA, 1979; p. 781. [Google Scholar]
- Kodera, P.; Lexa, J.; Rankin, A.H.; Fallick, A.E. Epithermal gold veins in a caldera setting: Banska Hodrusa, Slovakia. Miner. Depos. 2005, 39, 921–943. [Google Scholar] [CrossRef]
- Rye, R.O.; Ohmoto, H. Sufur and carbon isotopes and ore genesis: A review. Econ. Geol. 1974, 69, 826–842. [Google Scholar] [CrossRef]
- Seal, R.R. Sulfur Isotope Geochemistry of Sulfide Minerals. Rev. Mineral. Geochem. 2006, 61, 633–677. [Google Scholar] [CrossRef]
- Zhu, D.C.; Zhao, Z.D.; Niu, Y.L.; Mo, X.X.; Chung, S.L.; Hou, Z.Q.; Wang, L.Q.; Wu, F.Y. The Lhasa Terrane: Record of a microcontinent and its histories of drift and growth. Earth Planet. Sci. Lett. 2011, 301, 241–255. [Google Scholar] [CrossRef]
- Ohmoto, H.; Rye, R.O. Isotope of sulfur and carbon. In Geochemistry of Hydrothermal Ore Deposits, 2nd ed.; Barnes, H.L., Ed.; John Wiley and Sons: New York, NY, USA, 1979. [Google Scholar]
- Ohmoto, H. Stable isotope geochemistry of ore deposits. Rev. Mineral. Geochem. 1986, 16, 491–559. [Google Scholar]
- Pass, H.E.; Cooke, D.R.; Davidson, G.; Maas, R.; Dipple, G.; Rees, C.; Ferreira, L.; Taylor, C.; Deyell, C.L. Isotope geochemistry of the Northeast Zone, Mount Polley Alkalic Cu-Au-Ag Porphyry Deposit, British Columbia: A case for carbonate assimilation. Econ. Geol. 2014, 109, 859–890. [Google Scholar] [CrossRef]
- Guo, F.; Fan, W.M.; Gao, X.F.; Li, C.W.; Miao, L.C.; Zhao, L.; Li, H.X. Sr-Nd-Pb isotope mapping of Mesozoic igneous rocks in NE China: Constraints on tectonic framework and Phanerozoic crustal growth. Lithos 2010, 120, 563–578. [Google Scholar] [CrossRef]
- Doe, B.R.; Zartman, R.E. Plumbotectonics I, the Phanerozoic. In Geochemistry of Hydrothermal Ore Deposits, 2nd ed.; Barnes, H.L., Ed.; John Wiley & Sons Inc.: New York, NY, USA, 1979; pp. 22–70. [Google Scholar]
- Cooke, D.R.; Hollings, P.; Walsh, J.L. Giant porphyry deposits: Characteristics, distribution, and tectonic controls. Econ. Geol. 2005, 100, 801–818. [Google Scholar] [CrossRef]
- Xiong, Y.Q.; Shao, Y.J.; Mao, J.W.; Wu, S.C.; Zhou, H.D.; Zheng, M.H. The polymetallic magmatic-hydrothermal Xiangdong and Dalong systems in the W–Sn–Cu–Pb–Zn–Ag Dengfuxian orefield, SE China: Constraints from geology, fluid inclusions, H–O–S–Pb isotopes, and sphalerite Rb–Sr geochronology. Miner. Depos. 2019, 54, 1101–1124. [Google Scholar] [CrossRef]
- Cline, J.S.; Bodnar, R.J. Direct evolution of brine from crystallizing silicic melt at the Questa, New Mexico, Molybdenum deposit. Econ. Geol. 1994, 89, 1780–1802. [Google Scholar] [CrossRef]
- Ulrich, T.; Günther, D.; Heinrich, C.A. The evolution of a porphyry Cu-Au deposit, based on LA-ICP-MS analysis of fluid inclusions: Bajo de la Alumbrera. Argentina. Econ. Geol. 2002, 97, 1889–1920. [Google Scholar] [CrossRef]
- Goldfarb, R.J.; Ayuso, R.A.; Miller, M.L.; Ebert, S.; Marsh, E.E.; Petsel, S.A. The late Cretaceous Donlin Creek gold deposit, southwestern Alaska: Controls on epizonal ore formation. Econ. Geol. 2004, 99, 643–671. [Google Scholar] [CrossRef]
- Shepherd, T.J.; Rankin, A.H.; Alderton, D.H.M. A Practical Guide to Fluid Inclusion Studies; Chapman & Hall: London, UK, 1985; p. 239. [Google Scholar]
- Wei, W.F.; Hu, R.Z.; Bi, X.W.; Peng, J.T.; Su, W.C.; Song, S.Q.; Shi, S.H. Infrared microthermometric and stable isotopic study of fluid inclusions in wolframite at the Xihuashan tungsten deposit, Jiangxi province, China. Miner. Depos. 2012, 47, 589–605. [Google Scholar] [CrossRef]
- Kwak, T.A.P. Fluid inclusions in skarns (carbonate replacement deposits). J. Metamorph. Geol. 1986, 4, 363–384. [Google Scholar] [CrossRef]
- Lu, H.Z.; Fan, H.R.; Ni, P.; Ou, G.X.; Shen, K.; Zhang, W.H. Fluid Inclusions; Science Press: Beijing, China, 2004; p. 444. (In Chinese) [Google Scholar]
- Roedder, E.; Bodnar, R.J. Geologic pressure determinations from fluid inclusion studies. Annu. Rev. Earth Planet. Sci. 1980, 8, 263–301. [Google Scholar] [CrossRef]
- Chen, Y.J.; Wang, P.; Li, N.; Yang, Y.F.; Pirajno, F. The collision-type porphyry Mo deposits in Dabie Shan. China. Ore Geol. Rev. 2017, 81, 405–430. [Google Scholar] [CrossRef]
- Hagemann, S.; Lüders, V. P-T-X conditions of hydrothermal fluids and precipitation mechanism of stibnite-gold mineralization at the Wiluna lode-gold deposits, Western Australia: Conventional and infrared microthermometric constraints. Miner. Depos. 2003, 38, 936–952. [Google Scholar] [CrossRef]
- Lowenstern, J.B. Carbon dioxide in magmas and implications for hydrothermal systems. Miner. Depos. 2001, 36, 490–502. [Google Scholar] [CrossRef]
- Soloviev, S.G.; Kryazhev, S.G.; Dvurechenskaya, S.S. Geology, mineralization, and fluid inclusion characteristics of the Meliksu reduced tungsten skarn deposit, Alai Tien Shan, Kyrgyzstan: Insights into conditions of formation and regional links to gold mineralization. Ore Geol. Rev. 2019, 111, 103003. [Google Scholar] [CrossRef]
- Xue, L.W.; Wang, G.W.; Tang, L.; Cao, Y.; Du, J.G.; Du, Y.S.; Luo, L.P.; Cheng, H.T. Genesis and hydrothermal evolution of the Zhazigou skarn W (Mo) deposit, East Qinling, China: Constraints from fluid inclusions and H-O-S-Pb isotopes. Ore Geol. Rev. 2021, 138, 104374. [Google Scholar] [CrossRef]
- Pirajno, F. Hydrothermal Mineral Deposits; Springer: Dordrecht, The Netherlands, 2009; p. 1250. [Google Scholar]
- Putnis, A. Mineral replacement reactions. Rev. Mineral. Geochem. 2009, 70, 87–124. [Google Scholar] [CrossRef]
- Chen, P.W.; Zeng, Q.D.; Zhou, T.C.; Wang, Y.B.; Yu, B.; Chen, J.Q. Evolution of fluids in the Dasuji porphyry Mo deposit on the northern margin of the North China Craton: Constraints from Microthermometric and LA-ICP-MS analyses of fluid inclusions. Ore Geol. Rev. 2019, 104, 26–45. [Google Scholar] [CrossRef]
- Guillemette, N.; Williams-Jones, A.E. Genesis of the Sb-W-Au deposits at Ixtahuacan, Guatemala: Evidence from fluid inclusions and stable isotopes. Miner. Depos. 1993, 28, 167–180. [Google Scholar] [CrossRef]
- Chen, P.W.; Zeng, Q.D.; Zhou, L.L.; Zhou, T.C. Fluid inclusion evidence for hydrothermal evolution of the Sadaigoumen porphyry Mo deposit on the northern margin of the north China Craton. Ore Geol. Rev. 2021, 134, 104145. [Google Scholar] [CrossRef]
- Zhao, X.Y.; Zhong, H.; Hu, R.Z.; Mao, W.; Bai, Z.J.; Lan, T.G.; Xue, K. Evolution of Multistage Hydrothermal Fluids in the Luoboling Porphyry Cu-Mo Deposit, Zijinshan Ore Field, Fujian Province, China: Insights from LA-ICP-MS Analyses of Fluid Inclusions. Econ. Geol. 2021, 116, 581–606. [Google Scholar] [CrossRef]
- Xie, W.; Zeng, Q.D.; Huang, L.L.; Zhou, L.L.; Fan, H.R.; Wu, J.J.; Wang, R.L.; Zhu, H.P. Composition and evolution of ore-forming fluids in the Sansheng porphyry W-Mo deposit, Inner Mongolia, NE China: Evidence from LA-ICP-MS analysis of fluid inclusions. Ore Geol. Rev. 2023, 158, 105481. [Google Scholar] [CrossRef]
- Hu, D.L.; Jiang, S.Y.; Xiong, S.F.; Dong, J.X.; Wang, K.X. Genesis of the Maogongdong deposit in the Dahutang W-Cu-(Mo) ore field of northern Jiangxi Province, South China: Constraints from mineralogy, fluid inclusions, and H-O-C-S isotopes. Miner. Depos. 2022, 57, 1449–1468. [Google Scholar] [CrossRef]
- Baker, T.; Van Achterberg, E.; Ryan, C.G.; Lang, J.R. Composition and evolution of ore fluids in a magmatic-hydrothermal skarn deposit. Geology 2004, 32, 117–120. [Google Scholar] [CrossRef]
- Seward, T.M.; Barnes, H.L. Geochemistry of Hydrothermal Ore Deposits; John Wiley & Sons: New York, NY, USA, 1997. [Google Scholar]
- Shu, Q.H.; Chang, Z.S.; Hammerli, J.; Lai, Y.; Huizenga, J.M. Composition and Evolution of Fluids Forming the Baiyinnuo’er Zn-Pb Skarn Deposit, Northeastern China: Insights from Laser Ablation ICP-MS Study of Fluid Inclusions. Econ. Geol. 2017, 112, 1441–1460. [Google Scholar] [CrossRef]
- Shu, Q.H.; Chang, Z.S.; Mavrogenes, J. Fluid compositions reveal fluid nature, metal deposition mechanisms, and mineralization potential: An example at the Haobugao Zn-Pb skarn, China. Geology 2021, 49, 473–477. [Google Scholar] [CrossRef]
- Stoffell, B.; Appold, M.S.; Wilkinson, J.J.; McClean, N.A.; Jeffries, T.E. Geochemistry and evolution of mississippi valley-type mineralizing brines from the tri-state and northern arkansas districts determined by LA-ICP-MS microanalysis of fluid inclusions. Econ. Geol. 2008, 103, 1411–1435. [Google Scholar] [CrossRef]
- Hedenquist, J.W.; Arribas, A.; Reynolds, T.J. Evolution of an intrusion centered hydrothermal system: Far Southest-Lepanto porphyry and epithermal Cu-Au deposit. Econ. Geol. 1998, 93, 373–404. [Google Scholar] [CrossRef]
- Fritzell, E.H.; Bull, A.L.; Shephard, G.E. Closure of the Mongol-Okhotsk Ocean: Insights from seismic tomography and numerical modelling. Earth Planet. Sci. Lett. 2016, 445, 1–12. [Google Scholar] [CrossRef]
- Wang, Z.H.; Ge, W.C.; Yang, H.; Zhang, Y.L.; Bi, J.H.; Tian, D.X.; Xu, W.L. Middle Jurassic oceanic island igneous rocks of the Raohe accretionary complex, northeastern China: Petrogenesis and tectonic implications. J. Asian Earth Sci. 2015, 111, 120–137. [Google Scholar] [CrossRef]
- Gou, J.; Sun, D.Y.; Qin, Z. Late Jurassic–Early Cretaceous tectonic evolution of the Great Xing’an Range: Geochronological and geochemical evidence from granitoids and volcanic rocks in the Erguna Block, NE China. Int. Geol. Rev. 2019, 61, 1842–1863. [Google Scholar] [CrossRef]
- Feng, Z.; Sun, D.Y.; Yue, Y.; Mao, A.Q.; Tian, L.; Sun, C.; Gou, J. Petrogenesis of highly differentiated I-type volcanic rocks: Reinjection of high-temperature magma-An example from Suolun silicic volcanic rocks, central Great Xing’an Range, China. Geol. J. 2020, 55, 6677–6695. [Google Scholar] [CrossRef]
- Zhang, G.L.; Xie, W.; Wen, S.Q.; Gong, E.P.; Guo, R.R.; Tang, T.Q. Petrogenesis and tectonic implications of Late Mesozoic volcanic rocks in the northern and central Great Xing’an Range, NE China: Constraints from geochronology and geochemistry. Geol. J. 2020, 55, 8282–8308. [Google Scholar] [CrossRef]
- Deng, C.Z.; Sun, D.Y.; Han, J.S.; Li, G.H.; Feng, Y.Z.; Xiao, B.; Li, R.C.; Shi, H.L.; Xu, G.Z.; Yang, D.G. Ages and petrogenesis of the Late Mesozoic igneous rocks associated with the Xiaokele porphyry Cu–Mo deposit, NE China and their geodynamic implications. Ore Geol. Rev. 2019, 107, 417–433. [Google Scholar] [CrossRef]
- Rudnick, R.L.; Gao, S. 3.01−Composition of the continental crust. Treatise Geochem. 2003, 3, 1–64. [Google Scholar]


| Sample No. | Re (ppb) | Os (ppb) | 187Re (ppb) | 187Os (ppb) | Model Age (Ma) | |||||
|---|---|---|---|---|---|---|---|---|---|---|
| Re | 1σ | Os | 1σ | 187Re | 1σ | 187Os | 1σ | Age | 1σ | |
| G5 | 43,934 | 1558 | 0.083 | 0.008 | 27,503 | 975 | 64.540 | 0.698 | 141.2 | 1.5 |
| LE-1 | 31,202 | 528 | 0.128 | 0.015 | 19,468 | 231 | 47.958 | 0.523 | 147.7 | 1.7 |
| Sample No. | Stage | Mineral | δD (‰) | δ18Oquartz (‰) | T (°C) | δ18Ofluid (‰) |
|---|---|---|---|---|---|---|
| B16-1 | Stage 1 | Quartz | –140.2 | 7.6 | 323 | 1.5 |
| B16-2 | Stage 1 | Quartz | –138.3 | 7.2 | 323 | 1.1 |
| B16-3 | Stage 1 | Quartz | –136.5 | 7.4 | 323 | 1.3 |
| B16-4 | Stage 1 | Quartz | –140.9 | 7.9 | 323 | 1.8 |
| B16-5 | Stage 1 | Quartz | –139.0 | 8.0 | 323 | 1.9 |
| B16-6 | Stage 1 | Quartz | –141.8 | 8.0 | 323 | 1.9 |
| B16-7 | Stage 1 | Quartz | –139.1 | 7.6 | 323 | 1.5 |
| D14-1 | Stage 2 | Quartz | –142.7 | 7.9 | 229 | –2.1 |
| D16-1 | Stage 2 | Quartz | –135.5 | 7.6 | 229 | –2.4 |
| D16-4 | Stage 2 | Quartz | –142.5 | 7.7 | 229 | –2.3 |
| D16-6 | Stage 2 | Quartz | –135.4 | 7.9 | 229 | –2.1 |
| D16-7 | Stage 2 | Quartz | –129.9 | 8.1 | 229 | –1.9 |
| D16-8 | Stage 2 | Quartz | –142.7 | 7.6 | 229 | –2.4 |
| D16-9 | Stage 2 | Quartz | –144.1 | 7.3 | 229 | –2.7 |
| G8-1 | Stage 3 | Quartz | –146.6 | 7.7 | 170 | –6.1 |
| G10-1 | Stage 3 | Quartz | –143.9 | 5.8 | 170 | –8.0 |
| G11-1 | Stage 3 | Quartz | –142.6 | 7.5 | 170 | –6.3 |
| Sample No. | Stage | Mineral | δ34S (‰) |
|---|---|---|---|
| LU16-1 | Stage 1 | Molybdenite | 5.5 |
| LU16-2 | Stage 1 | Molybdenite | 5.4 |
| LU16-3 | Stage 1 | Molybdenite | 5.5 |
| LU16-4 | Stage 1 | Molybdenite | 5.5 |
| LU16-5 | Stage 1 | Molybdenite | 5.5 |
| LU16-6 | Stage 1 | Molybdenite | 5.5 |
| LU16-7 | Stage 2 | Pyrite | 5.4 |
| LU16-8 | Stage 2 | Pyrite | 5.4 |
| LU16-9 | Stage 2 | Chalcopyrite | 5.4 |
| LU16-10 | Stage 2 | Chalcopyrite | 4.8 |
| LU16-11 | Stage 2 | Galena | 3.9 |
| Sample No. | Stage | Mineral | 206Pb/204Pb | 2σ | 207Pb/204Pb | 2σ | 208Pb/204Pb | 2σ | μ |
|---|---|---|---|---|---|---|---|---|---|
| D17-2 | 1 | Molybdenite | 18.340 | 0.0004 | 15.542 | 0.0003 | 38.137 | 0.0008 | 9.36 |
| D17-3 | 1 | Molybdenite | 18.340 | 0.0005 | 15.543 | 0.0005 | 38.153 | 0.0011 | 9.36 |
| D17-4 | 1 | Molybdenite | 18.355 | 0.0004 | 15.544 | 0.0004 | 38.164 | 0.0009 | 9.36 |
| D17-5 | 1 | Molybdenite | 18.343 | 0.0004 | 15.540 | 0.0004 | 38.135 | 0.0009 | 9.35 |
| D17-7 | 1 | Molybdenite | 18.340 | 0.0004 | 15.540 | 0.0004 | 38.130 | 0.0009 | 9.35 |
| D0A1-1 | 1 | Molybdenite | 18.412 | 0.0004 | 15.546 | 0.0004 | 38.212 | 0.0009 | 9.36 |
| D0A1-2 | 1 | Molybdenite | 18.387 | 0.0004 | 15.544 | 0.0004 | 38.183 | 0.0010 | 9.36 |
| D0a1-1 | 1 | Molybdenite | 18.363 | 0.0004 | 15.543 | 0.0003 | 38.170 | 0.0009 | 9.36 |
| G10-2 | 2 | Pyrite | 18.373 | 0.0005 | 15.549 | 0.0004 | 38.174 | 0.0010 | 9.37 |
| G11-2 | 2 | Pyrite | 18.510 | 0.0004 | 15.557 | 0.0004 | 38.249 | 0.0010 | 9.37 |
| G13 | 2 | Pyrite | 18.471 | 0.0004 | 15.569 | 0.0003 | 38.312 | 0.0008 | 9.40 |
| G14 | 2 | Pyrite | 18.341 | 0.0003 | 15.549 | 0.0003 | 38.148 | 0.0008 | 9.37 |
| D17-1 | 2 | Pyrite | 18.336 | 0.0003 | 15.542 | 0.0002 | 38.131 | 0.0006 | 9.36 |
| D17-2 | 2 | Chalcopyrite | 18.336 | 0.0005 | 15.541 | 0.0004 | 38.131 | 0.0011 | 9.36 |
| G8-2 | 2 | Chalcopyrite | 18.340 | 0.0004 | 15.547 | 0.0003 | 38.143 | 0.0008 | 9.37 |
| G8-3 | 2 | Galena | 18.343 | 0.0004 | 15.550 | 0.0004 | 38.149 | 0.0009 | 9.37 |
| T0a1-1 | – | Granite porphyry | 18.599 | 0.0005 | 15.574 | 0.0005 | 38.583 | 0.0013 | 9.40 |
| T0a1-2 | – | Granite porphyry | 18.565 | 0.0005 | 15.573 | 0.0004 | 38.515 | 0.0012 | 9.40 |
| T16-1 | – | Granite porphyry | 18.535 | 0.0004 | 15.571 | 0.0004 | 38.419 | 0.0010 | 9.39 |
Disclaimer/Publisher’s Note: The statements, opinions and data contained in all publications are solely those of the individual author(s) and contributor(s) and not of MDPI and/or the editor(s). MDPI and/or the editor(s) disclaim responsibility for any injury to people or property resulting from any ideas, methods, instructions or products referred to in the content. |
© 2023 by the authors. Licensee MDPI, Basel, Switzerland. This article is an open access article distributed under the terms and conditions of the Creative Commons Attribution (CC BY) license (https://creativecommons.org/licenses/by/4.0/).
Share and Cite
Zhang, G.; Xie, W.; Wen, S.; Zeng, Q.; Zhou, L.; Wang, H.; Zhang, K.; Tang, T.; Ma, P. Ore Genesis of the Lower Urgen Porphyry Molybdenum Deposit in the Northern Great Xing’an Range, Northeast China: Constraints from Molybdenite Re-Os Dating, Fluid Inclusions, and H-O-S-Pb Isotopes. Minerals 2023, 13, 1189. https://doi.org/10.3390/min13091189
Zhang G, Xie W, Wen S, Zeng Q, Zhou L, Wang H, Zhang K, Tang T, Ma P. Ore Genesis of the Lower Urgen Porphyry Molybdenum Deposit in the Northern Great Xing’an Range, Northeast China: Constraints from Molybdenite Re-Os Dating, Fluid Inclusions, and H-O-S-Pb Isotopes. Minerals. 2023; 13(9):1189. https://doi.org/10.3390/min13091189
Chicago/Turabian StyleZhang, Guangliang, Wei Xie, Shouqin Wen, Qingdong Zeng, Lingli Zhou, Hui Wang, Kailun Zhang, Tieqiao Tang, and Pengcheng Ma. 2023. "Ore Genesis of the Lower Urgen Porphyry Molybdenum Deposit in the Northern Great Xing’an Range, Northeast China: Constraints from Molybdenite Re-Os Dating, Fluid Inclusions, and H-O-S-Pb Isotopes" Minerals 13, no. 9: 1189. https://doi.org/10.3390/min13091189
APA StyleZhang, G., Xie, W., Wen, S., Zeng, Q., Zhou, L., Wang, H., Zhang, K., Tang, T., & Ma, P. (2023). Ore Genesis of the Lower Urgen Porphyry Molybdenum Deposit in the Northern Great Xing’an Range, Northeast China: Constraints from Molybdenite Re-Os Dating, Fluid Inclusions, and H-O-S-Pb Isotopes. Minerals, 13(9), 1189. https://doi.org/10.3390/min13091189