Article

A Modeling Approach for Beach-Bar Sand Reservoirs Based on Depositional Mode and Sandbody Volume

1
School of Geosciences, Yangtze University, Wuhan 430100, China
2
Geological Scientific Research Institute of Shengli Oilfield, Sinopec, Dongying 257000, China
*
Author to whom correspondence should be addressed.
Minerals 2022, 12(8), 950; https://doi.org/10.3390/min12080950
Submission received: 29 June 2022 / Revised: 24 July 2022 / Accepted: 26 July 2022 / Published: 28 July 2022
(This article belongs to the Special Issue Reservoir Geology and Oil & Gas Reservoir Characterization)

Abstract

:
Beach-bar sand in lacustrine facies represents one of the most significant reservoirs. Depending on the depositional characteristics, it can be further divided into two different sedimentary microfacies, beach sand and the bar sand. Favorable reservoirs are often developed in bar sand. The lower section of the upper part of the 4th member of the Shahejie Formation in the Gao89-1 block is a typical nearshore shallow water beach-bar deposit. Oil distribution is influenced by lithofacies and physical properties. In order to better characterize the heterogeneity within beach-bar sandbodies, a modeling method based on the depositional mode and sandbody volume is proposed. Firstly, a sandbody model is established. On this basis, an algorithm for distinguishing between beach and bar sand based on vertical thickness is proposed. The model is post processed based on the sandbody volume to remove unreasonable sandbodies. The method allows for a more realistic three-dimensional geological model of the beach-bar sands in the study area than the classical two-point geostatistical, object-based, and multi-point simulation method. A facies-controlled modeling approach is used to establish a petrophysical property model on this foundation; the result shows that the property models better reflect the characteristics of the petrophysical distribution in the Gao89-1 block.

1. Introduction

A sedimentary model is a semi-quantitative characterization of the sedimentary pattern of an area in a specific geological period [1,2,3]. The reservoir model can quantitatively depict the distribution of reservoir sandbodies by establishing a three-dimensional grid. Generally speaking, the 3D geological model should conform to the distribution law of sedimentary facies reflected by the deposition mode and the actual geological understanding. In other words, the reservoir model is constrained by the sedimentary model [4,5]. The research ideas of structural modeling, 3D facies controlling modeling and mode guidance were adopted and our predecessors have summarized the sedimentary models of different regions under the conditions of a few wells [6] and dense well patterns [7], and established 3D geological models under the guidance of these modes. The constraint of these modes on modeling is mainly to provide guidance for the selection of modeling parameters. The development of multi-point geostatistical modeling technology provides a new technical means for describing complex geological bodies, the core of which is the construction of three-dimensional training images [8,9]. Xu [10] used Google Earth to establish a modern outcrop geological knowledge database, combined with dense well pattern data to establish the channel bar architecture mode in the working area. Under its guidance, a geological body carving method was used to build a three-dimensional channel bar training image. The deposition mode constraint modeling was more directly used in the modeling process, and the model better integrated the understanding of geological research. Therefore, modeling based on sedimentary mode constraint can improve the modeling accuracy, which has considerable guiding significance for improving the prediction accuracy of inter-well sandbodies.
With the growth of exploration and development of oil and gas fields and the development of geological modeling technology, it is of great significance to correctly understand the shape and volume of sandbodies for studying reservoir heterogeneity and the distribution of remaining oil. Reservoir research also takes quantifying the volume of the geological body as the ultimate goal [11,12,13,14]. In order to accurately predict the distribution of reservoir sandbodies in 3D space, it is necessary to establish a geological knowledge database as a fine reference. On the basis of core and well logging data, guided by modern sedimentation and outcrop research [15,16,17,18], many scholars have analyzed the genesis and sedimentary characteristics of different levels of architecture units, discussed their quantitative characterization methods and established quantitative relations for calculating the volume of architecture units. Through the application to the actual study area, their rationality was verified, which has certain reference significance for reservoir characterization. Therefore, the establishment of a quantitative knowledge database of a reservoir sandbody based on prior geological knowledge can provide constraints and guidance for reservoir modeling research.
A beach-bar sandbody, which is developed in a shore-shallow lake, is a very essential type of sedimentary facies and oil and gas reservoir. The formation of beach-bar reservoirs is mainly affected by waves and coastal currents. It is the general name of “beach sand” and “bar sand” [19,20], which are two special geomorphic elements formed under different sea-level change stages. Although beach sand and bar sand are often superimposed on each other in the vertical direction, it is difficult to distinguish them. The difference in sedimentary environments has a great impact on geomorphic changes in fact [21,22], which will lead to obvious differences in sedimentary mechanisms and sedimentary characteristics between the two. Beach sand is formed on relatively flat terrain under weak hydrodynamic conditions. It is a wide strip or sheet sandbody parallel to the coastline, with a large distribution area, fine sandstone particle size, frequent sand mud interbedding and small thickness. Bar sand is often developed at the protruding position of the coastline, and the hydrodynamic conditions are strong when it is formed. It has a small distribution area on the plane and is irregular and strip distributed. There is less mud content in the layers, and the number of sandstone layers is small but the thickness of a single layer is relatively large [23,24,25,26]. In terms of planar distribution, the bar sand is located in the center of the sandstone, and the beach is mainly surrounded around the bar sand in the form of sheet, that is, the beach is between and outside the bar [19,27]. For this reason, there are obvious differences in reservoir petrophysical properties and heterogeneity between beach sand and bar sand [28]. Previous studies on beach-bar sandbodies have been carried out in depth, and rich achievements have been achieved in the aspects of sedimentary environment, characteristics and mode [29,30,31,32,33,34], but there are few works on beach-bar sandbody modeling. Yang [35] and Zhao et al. [36] respectively established a 3D geological model of a beach-bar sandbody in the Gao89 block by using the deterministic modeling method and sequential indicator simulation method. However, deterministic modeling can only obtain one certain prediction result between the wells, and cannot describe the uncertainty caused by incomplete data. In addition, sequential indicator simulation is prone to “noise”, which means that it is difficult to reproduce the geometric shape of the geological body and to describe the depositional mode of beach-bar sand.
Based on these, this paper proposes a reservoir modeling method based on the sedimentary mode and sandbody volume. The application research is carried out on the beach-bar sand reservoir in the Gao89-1 block of Boxing Subsag in Dongying Sag, and compared with the traditional sequential indication simulation, object-based modeling and multi-point geostatistics methods. The results show that the modeling method presented in this paper can better reproduce the sedimentary mode of beach-bar and reasonably describe the volume of bar sand.

2. Geological Settings

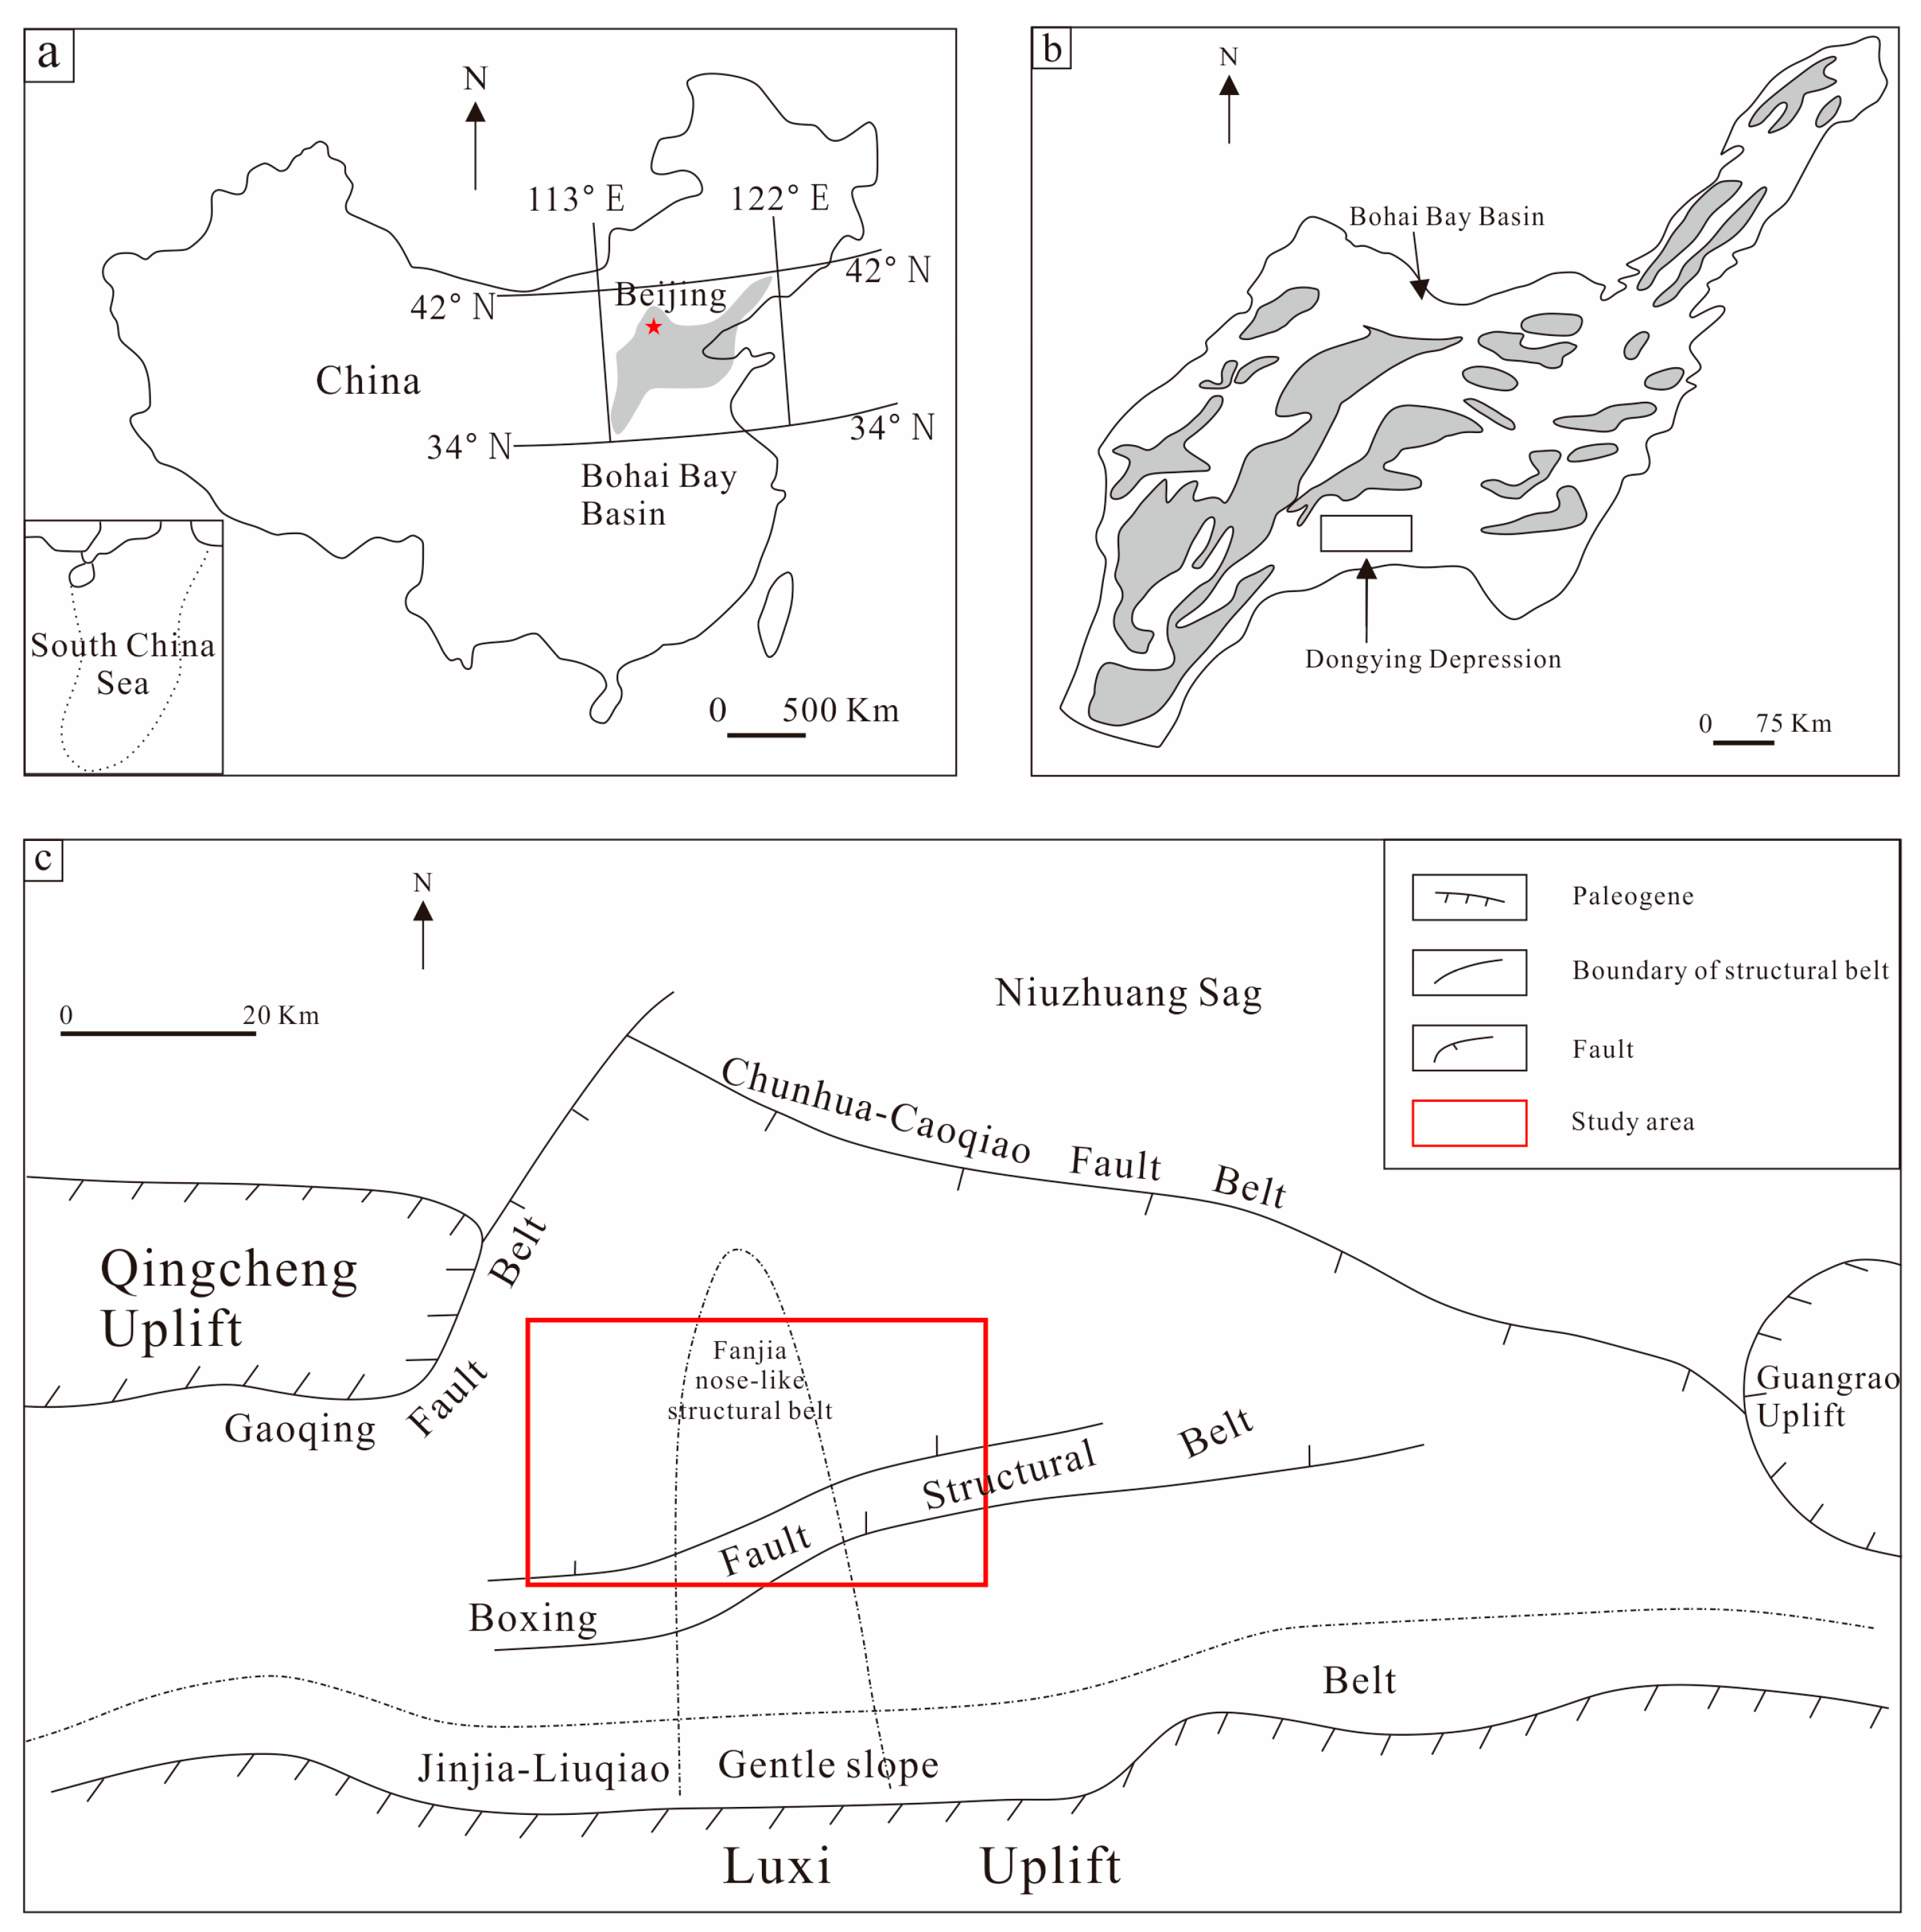
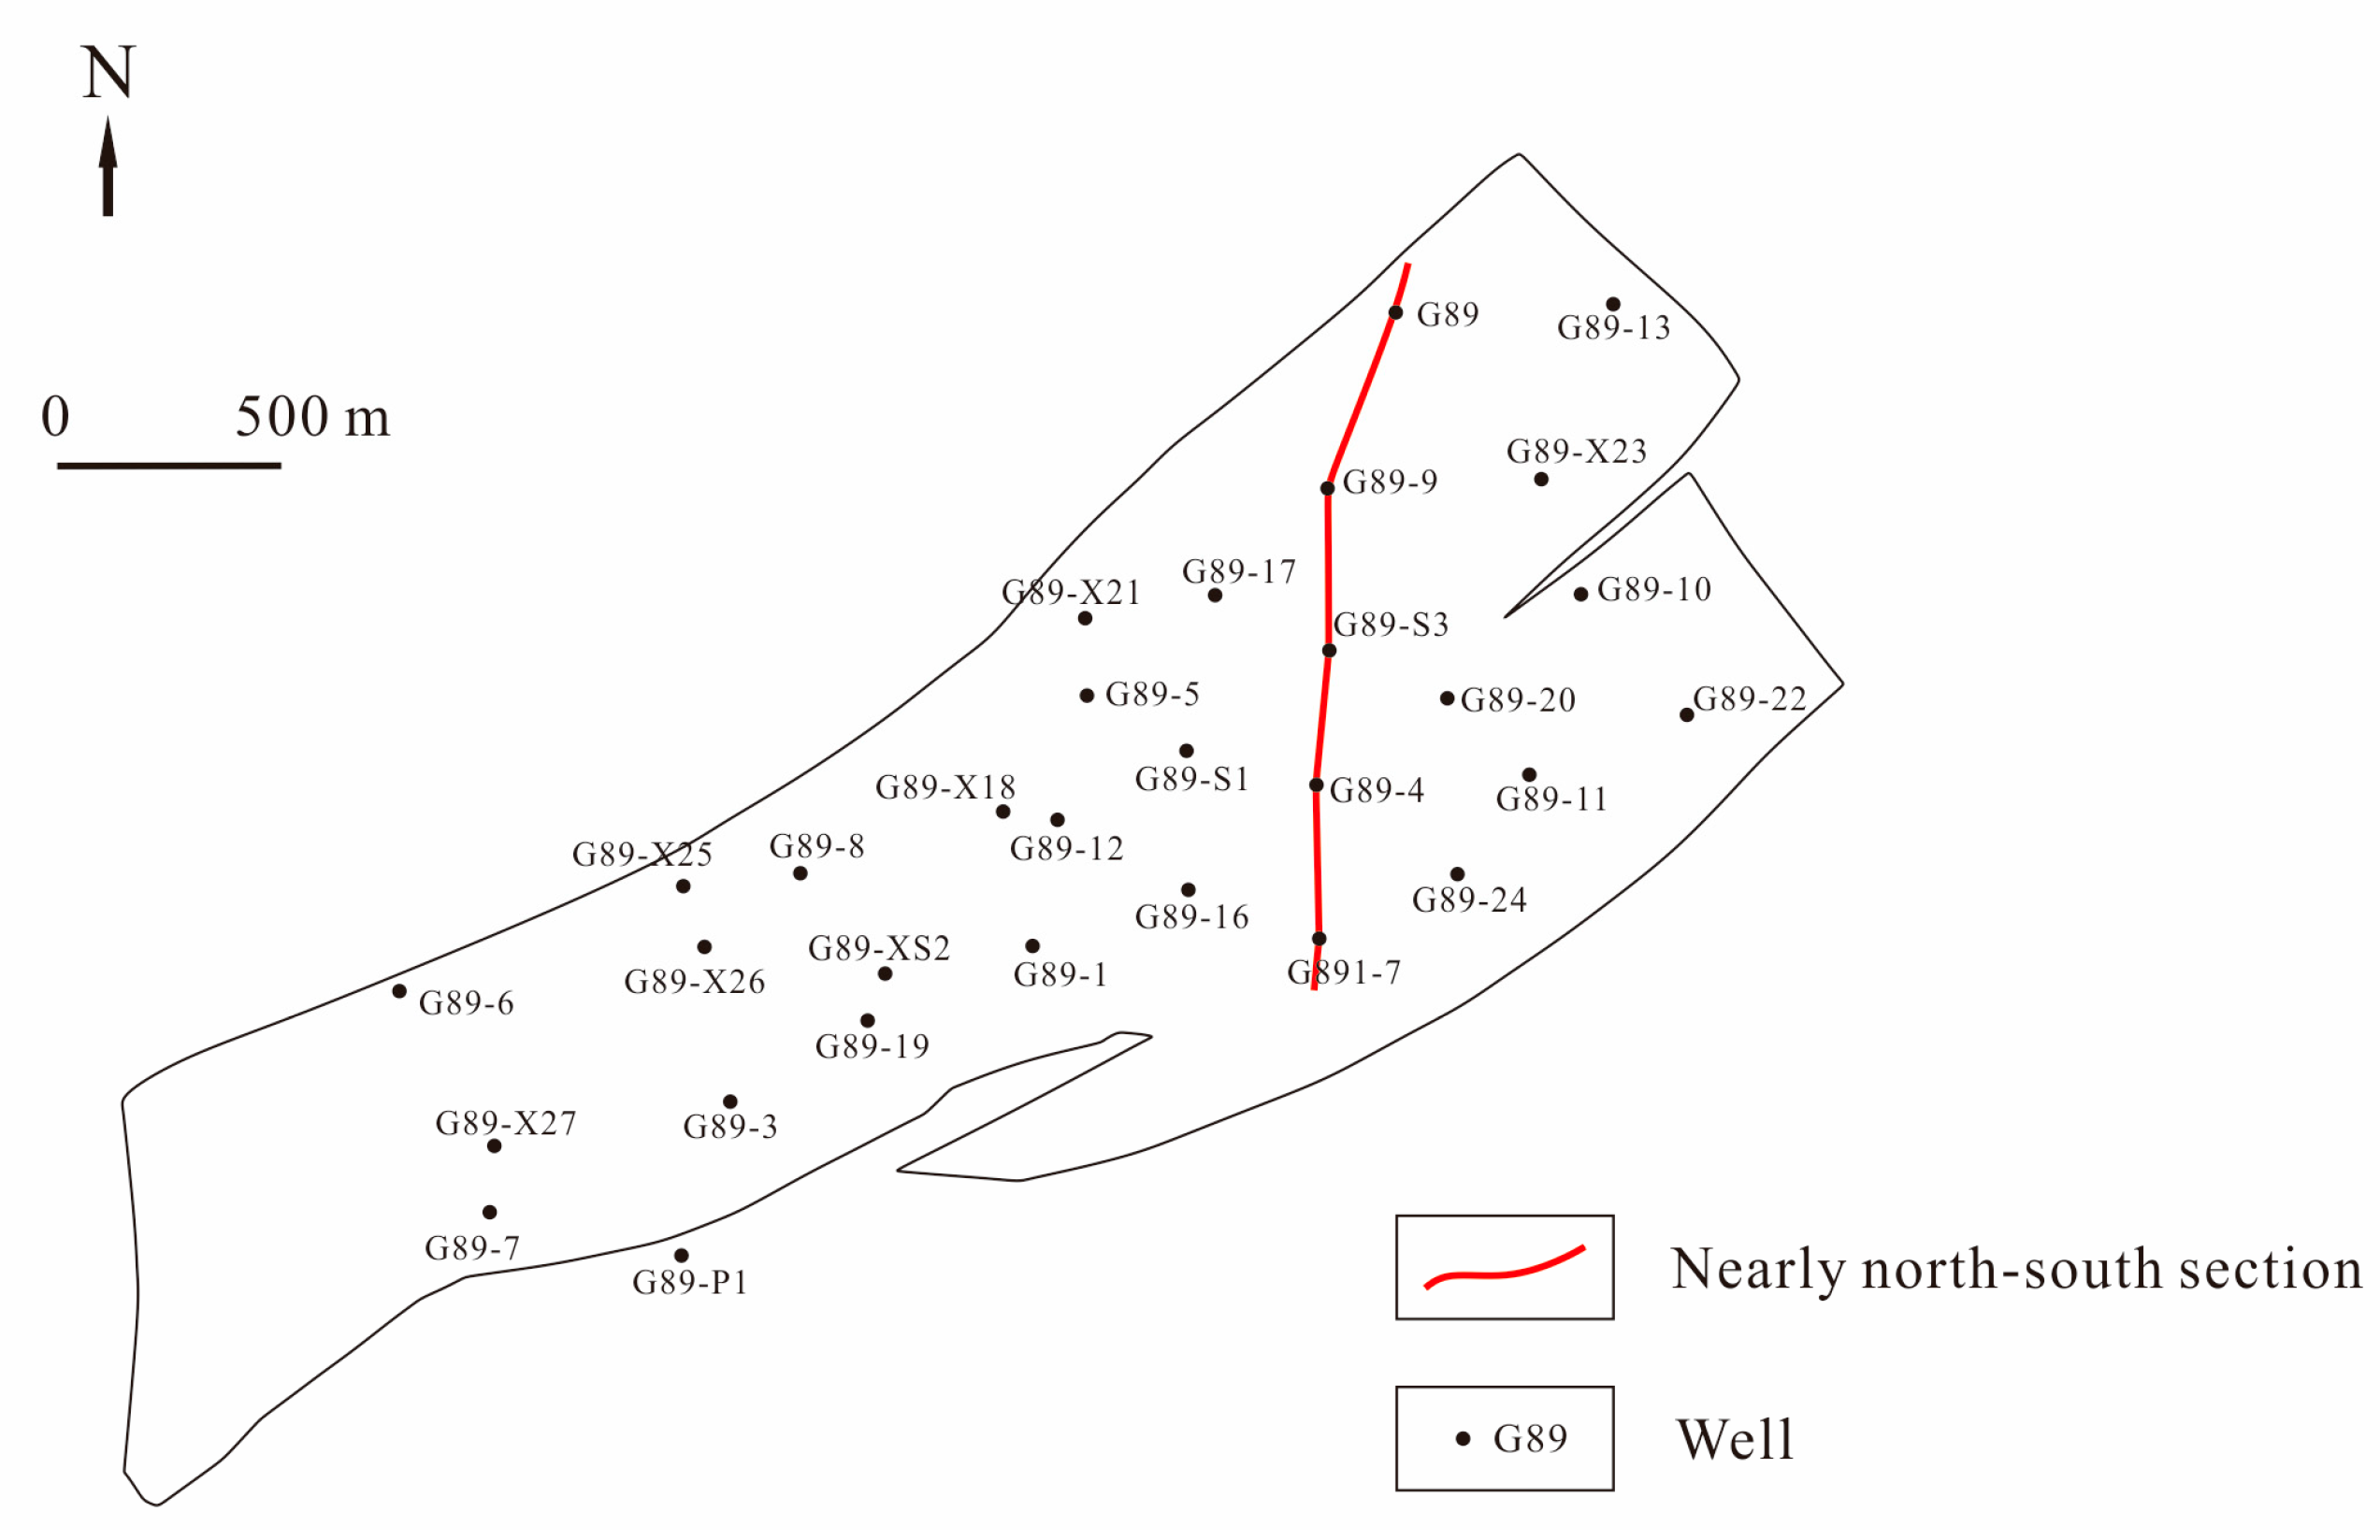
2.1. Structural and Stratigraphic Characteristics

The Gao 89-1 block is located in Gaoqing County, Shandong Province. It is seated in the north of Zhenglizhuang oilfield, in the middle of the Jinjia-Zhenglizhuang-Fanjia nose-like structural belt in Boxing Subsag, Dongying Sag, Jiyang Depression [36,37] (Figure 1). This block is a stratified structural lithologic reservoir, dominated by lithologic control and supplemented by structural control. The reservoir is buried with the depth of 2800~3200 m, and the main oil-bearing series is the lower section of the upper part of the fourth member of the Shahejie Formation (Es4). The structure as a whole is a near monoclinal structure, with southwest uplifting and northeast plunging in this area, and a series of NE trending faults are developed. The stratum in the southwest is higher and lower in the northeast, and the stratum dip angle is 5°~8° (Figure 2). The main target interval in the study area is the lower section of the upper part of Es4. According to the results of sedimentary cycles and marker beds research, this interval can be divided into 4 sand groups and 15 small layers, including 31 single sandbodies and 6 main sandbodies. The oil rocks are mainly concentrated in sand groups 1 and 2, which can be divided into 8 layers and 17 sandbodies. It includes the oil well section of 50~70 m, buried depth of 2800~3200 m, and stratum thickness is about 120~170 m. The reservoir lithologies are mainly gray siltstone, siltstone and argillaceous siltstone.

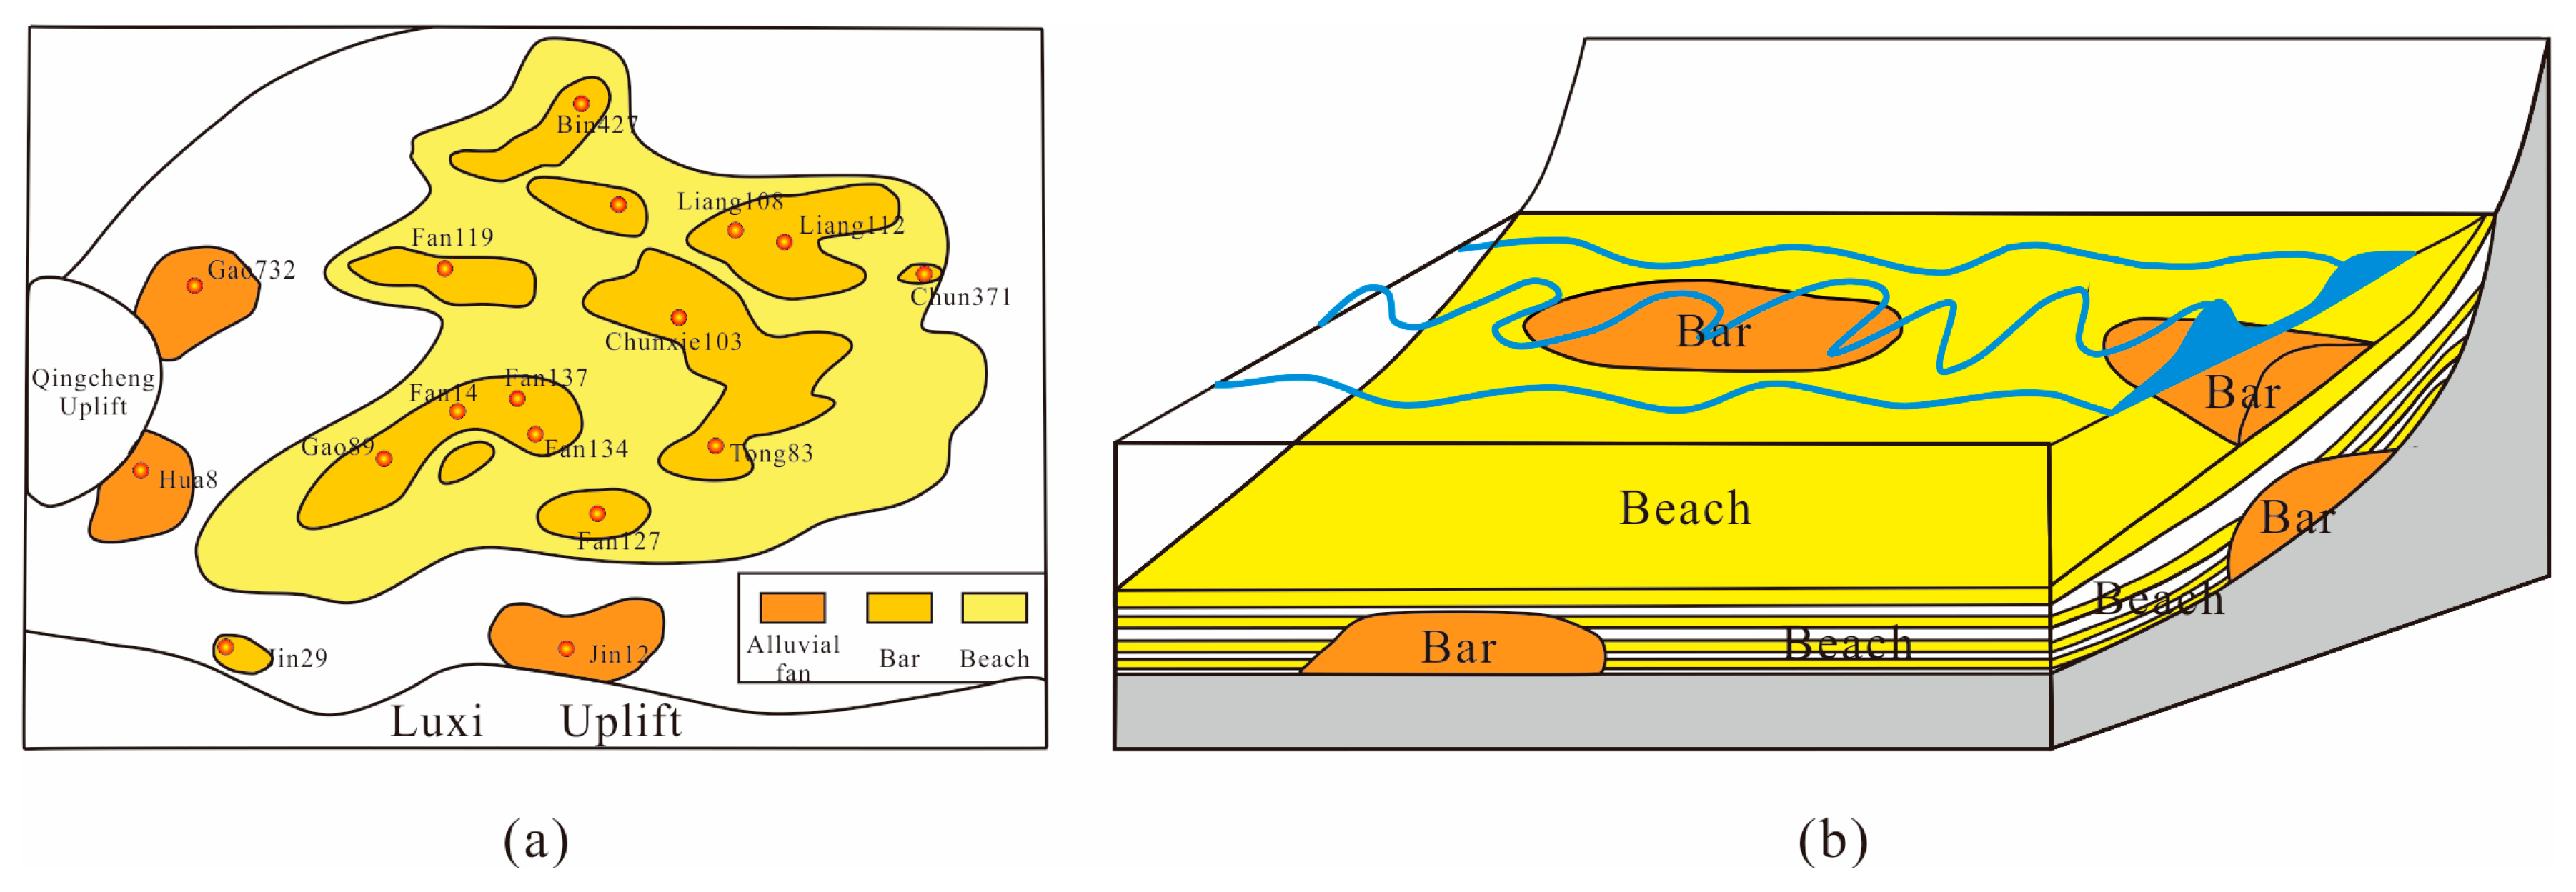
2.2. Sedimentary Characteristics

The fourth member of the Shahejie Formation in the study area was deposited in the early stage of faulted lake basin deposition, with little difference in paleotopography. The Luxi uplift in the southwest of the lake basin is the provenance area. The water is widely distributed but the water depth is shallow, and the study area is developed into nearshore shallow water beach-bar deposit at this time. The beach-bar sandbody can be divided into beach sand and bar sand, in accordance with the hydrodynamic conditions and the sandstone morphology. The vertical thickness of a single sandbody on the beach is thin, and the thickness of a single layer is generally less than 2 m. Sandstone is silty, with higher shale content. Ripple bedding and lenticular bedding can be observed in the beach sand, and bioturbation is a common feature. Sedimentary structures, such as wave ripple marks, can be observed on the layers. The beach sand shows a dense combination of thin fingers with high amplitude on the logging curves, and a single sand layer usually has finger-like characteristics of medium and high amplitude (as shown in Figure 3a, Well Gao891). While the bar sand is thick, the lithology is mainly fine sandstone to medium-grained sandstone. Its lithology is relatively pure, and the maturity of the structure and composition is high. Vertically, the number of sandstone layers is small, but the thickness of a single sandbody is large, generally between 2 and 5 m. Cross bedding can be observed on the core, and biological fossils are poorly developed. The logging curve of bar sand is mostly characterized by box-shapes and toothed box-shapes with middle and high amplitude (as shown in Figure 3b, Well Gao89-8).
The outcrop, core data and logging curve characteristics of modern sediments show that the bar and beach sand are adjacent to each other vertically. According to the “principle of facies sequence”, the microfacies that appear successively in the vertical direction without interruption have the characteristics of similar genesis and are closely connected on the plane. The beach sand in the study area is distributed in sheets, and the bar sand is formed in the main part of the beach-bar sandstone and distributed sporadically. The bar sand is connected to the surrounding beach sand. The bar sand is dotted on the beach in the plane view, and the beach sand is in lateral contact with the bar sand on the profile (Figure 4).

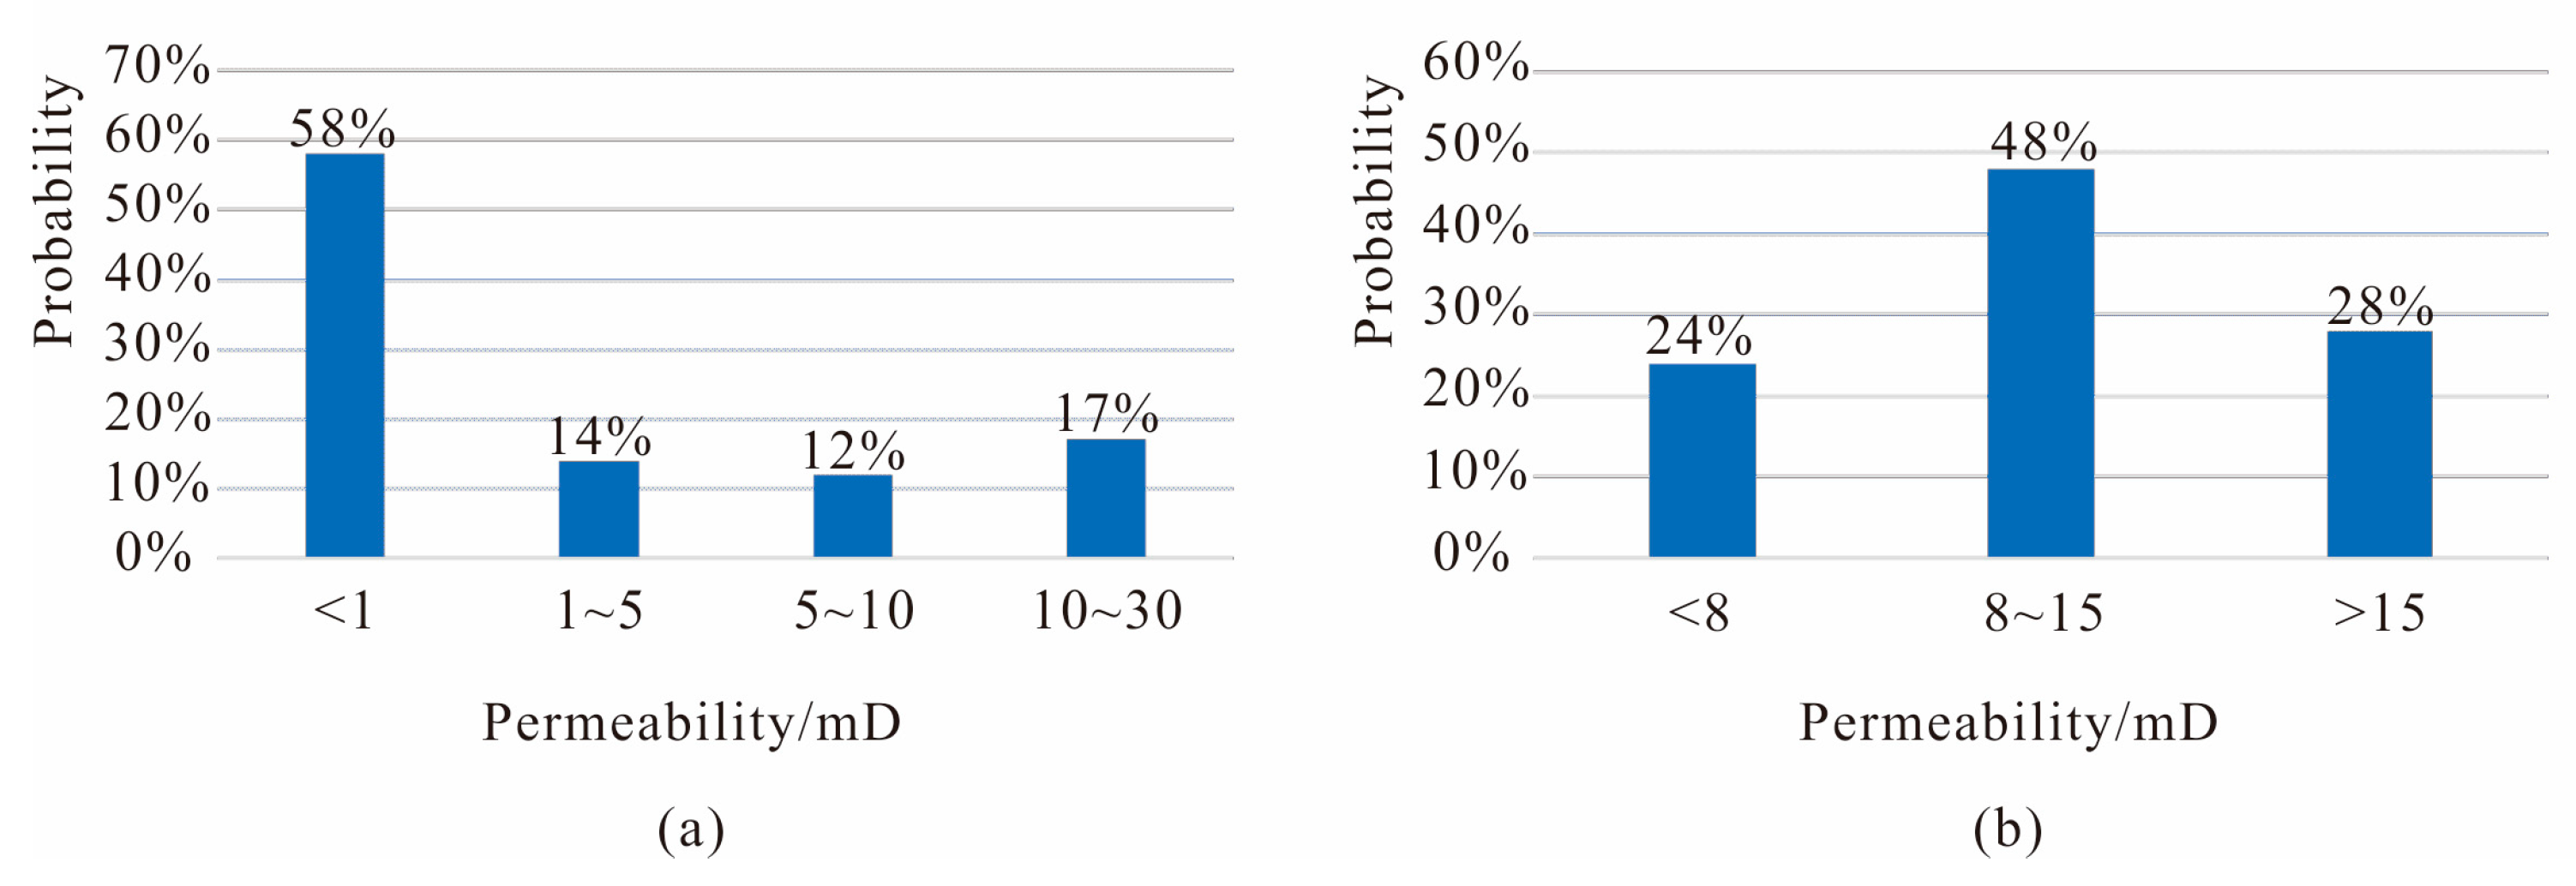
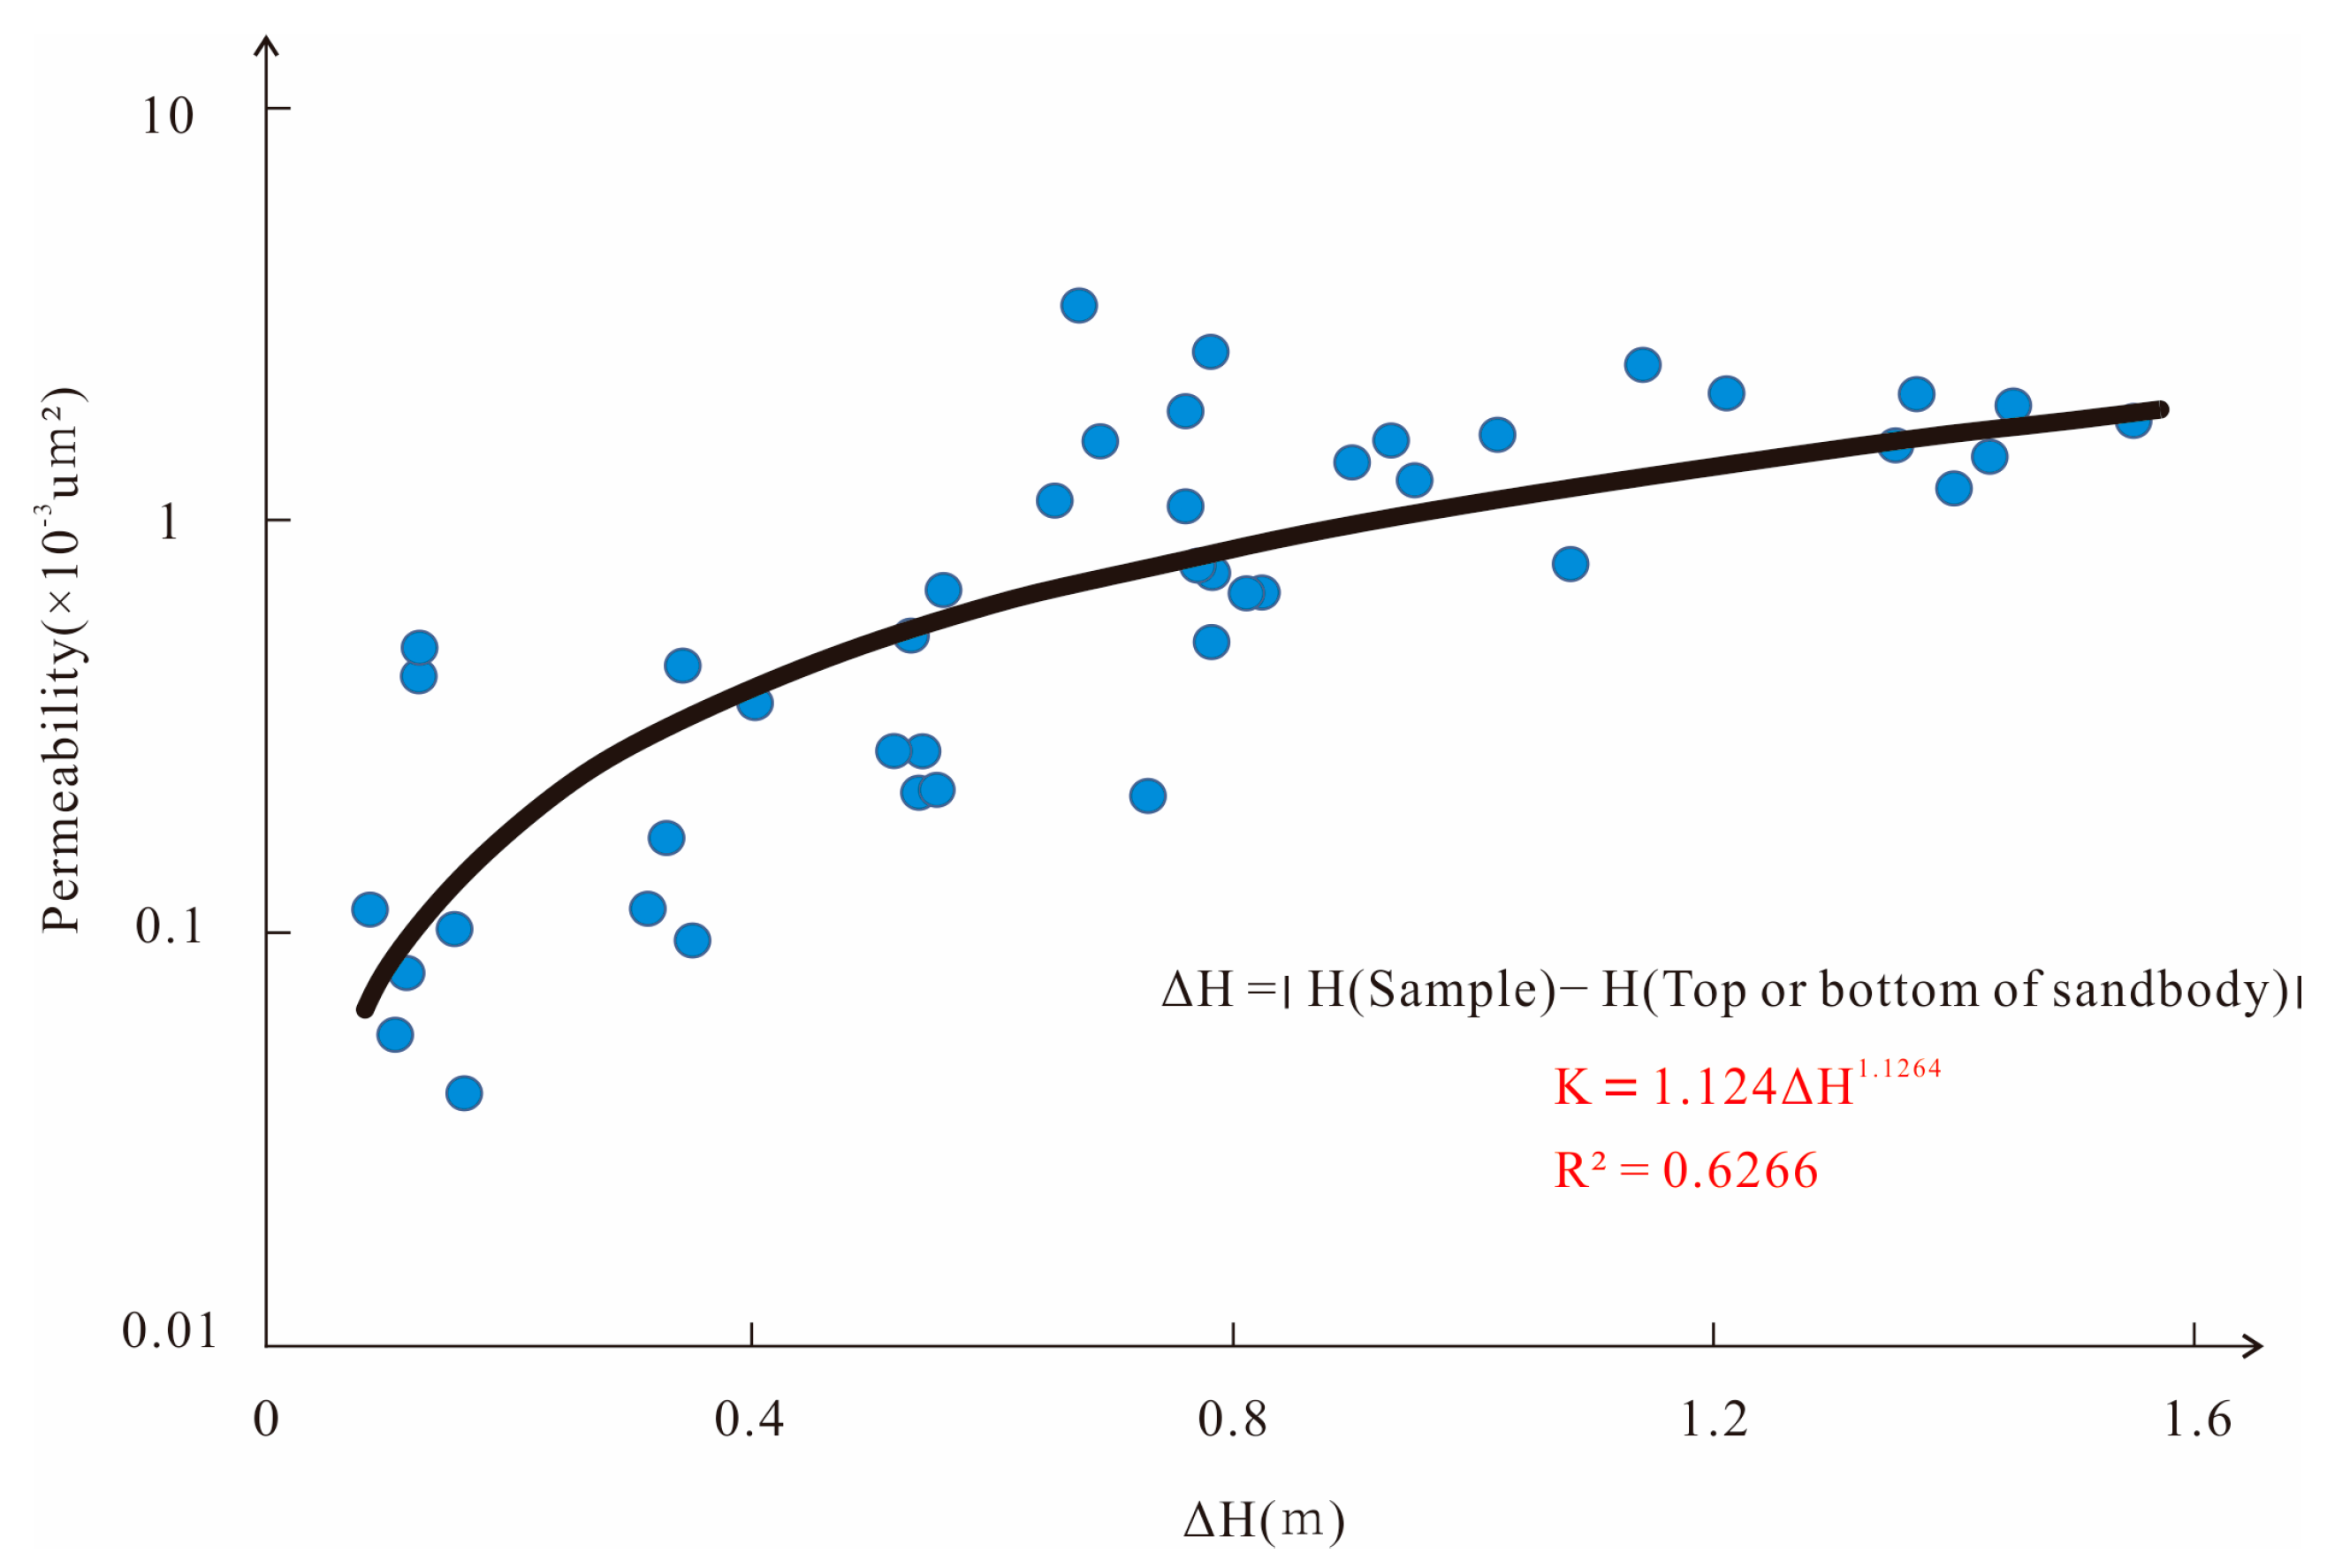
2.3. Reservoir Petrophysical Properties

There are two coring wells in Es4 of the Gao89-1 block. The average porosity is 11.8% and the average permeability is 4mD in this block, as per the analysis of physical property data of coring wells (Table 1), so the reservoir has low porosity and especially low permeability.
The average permeability of beach sand is 1.5 mD, while the bar sand is 8.5 mD (Figure 5). It can be observed that the physical property of bar sand is obviously better than that of beach sand, which is a favorable reservoir development area.

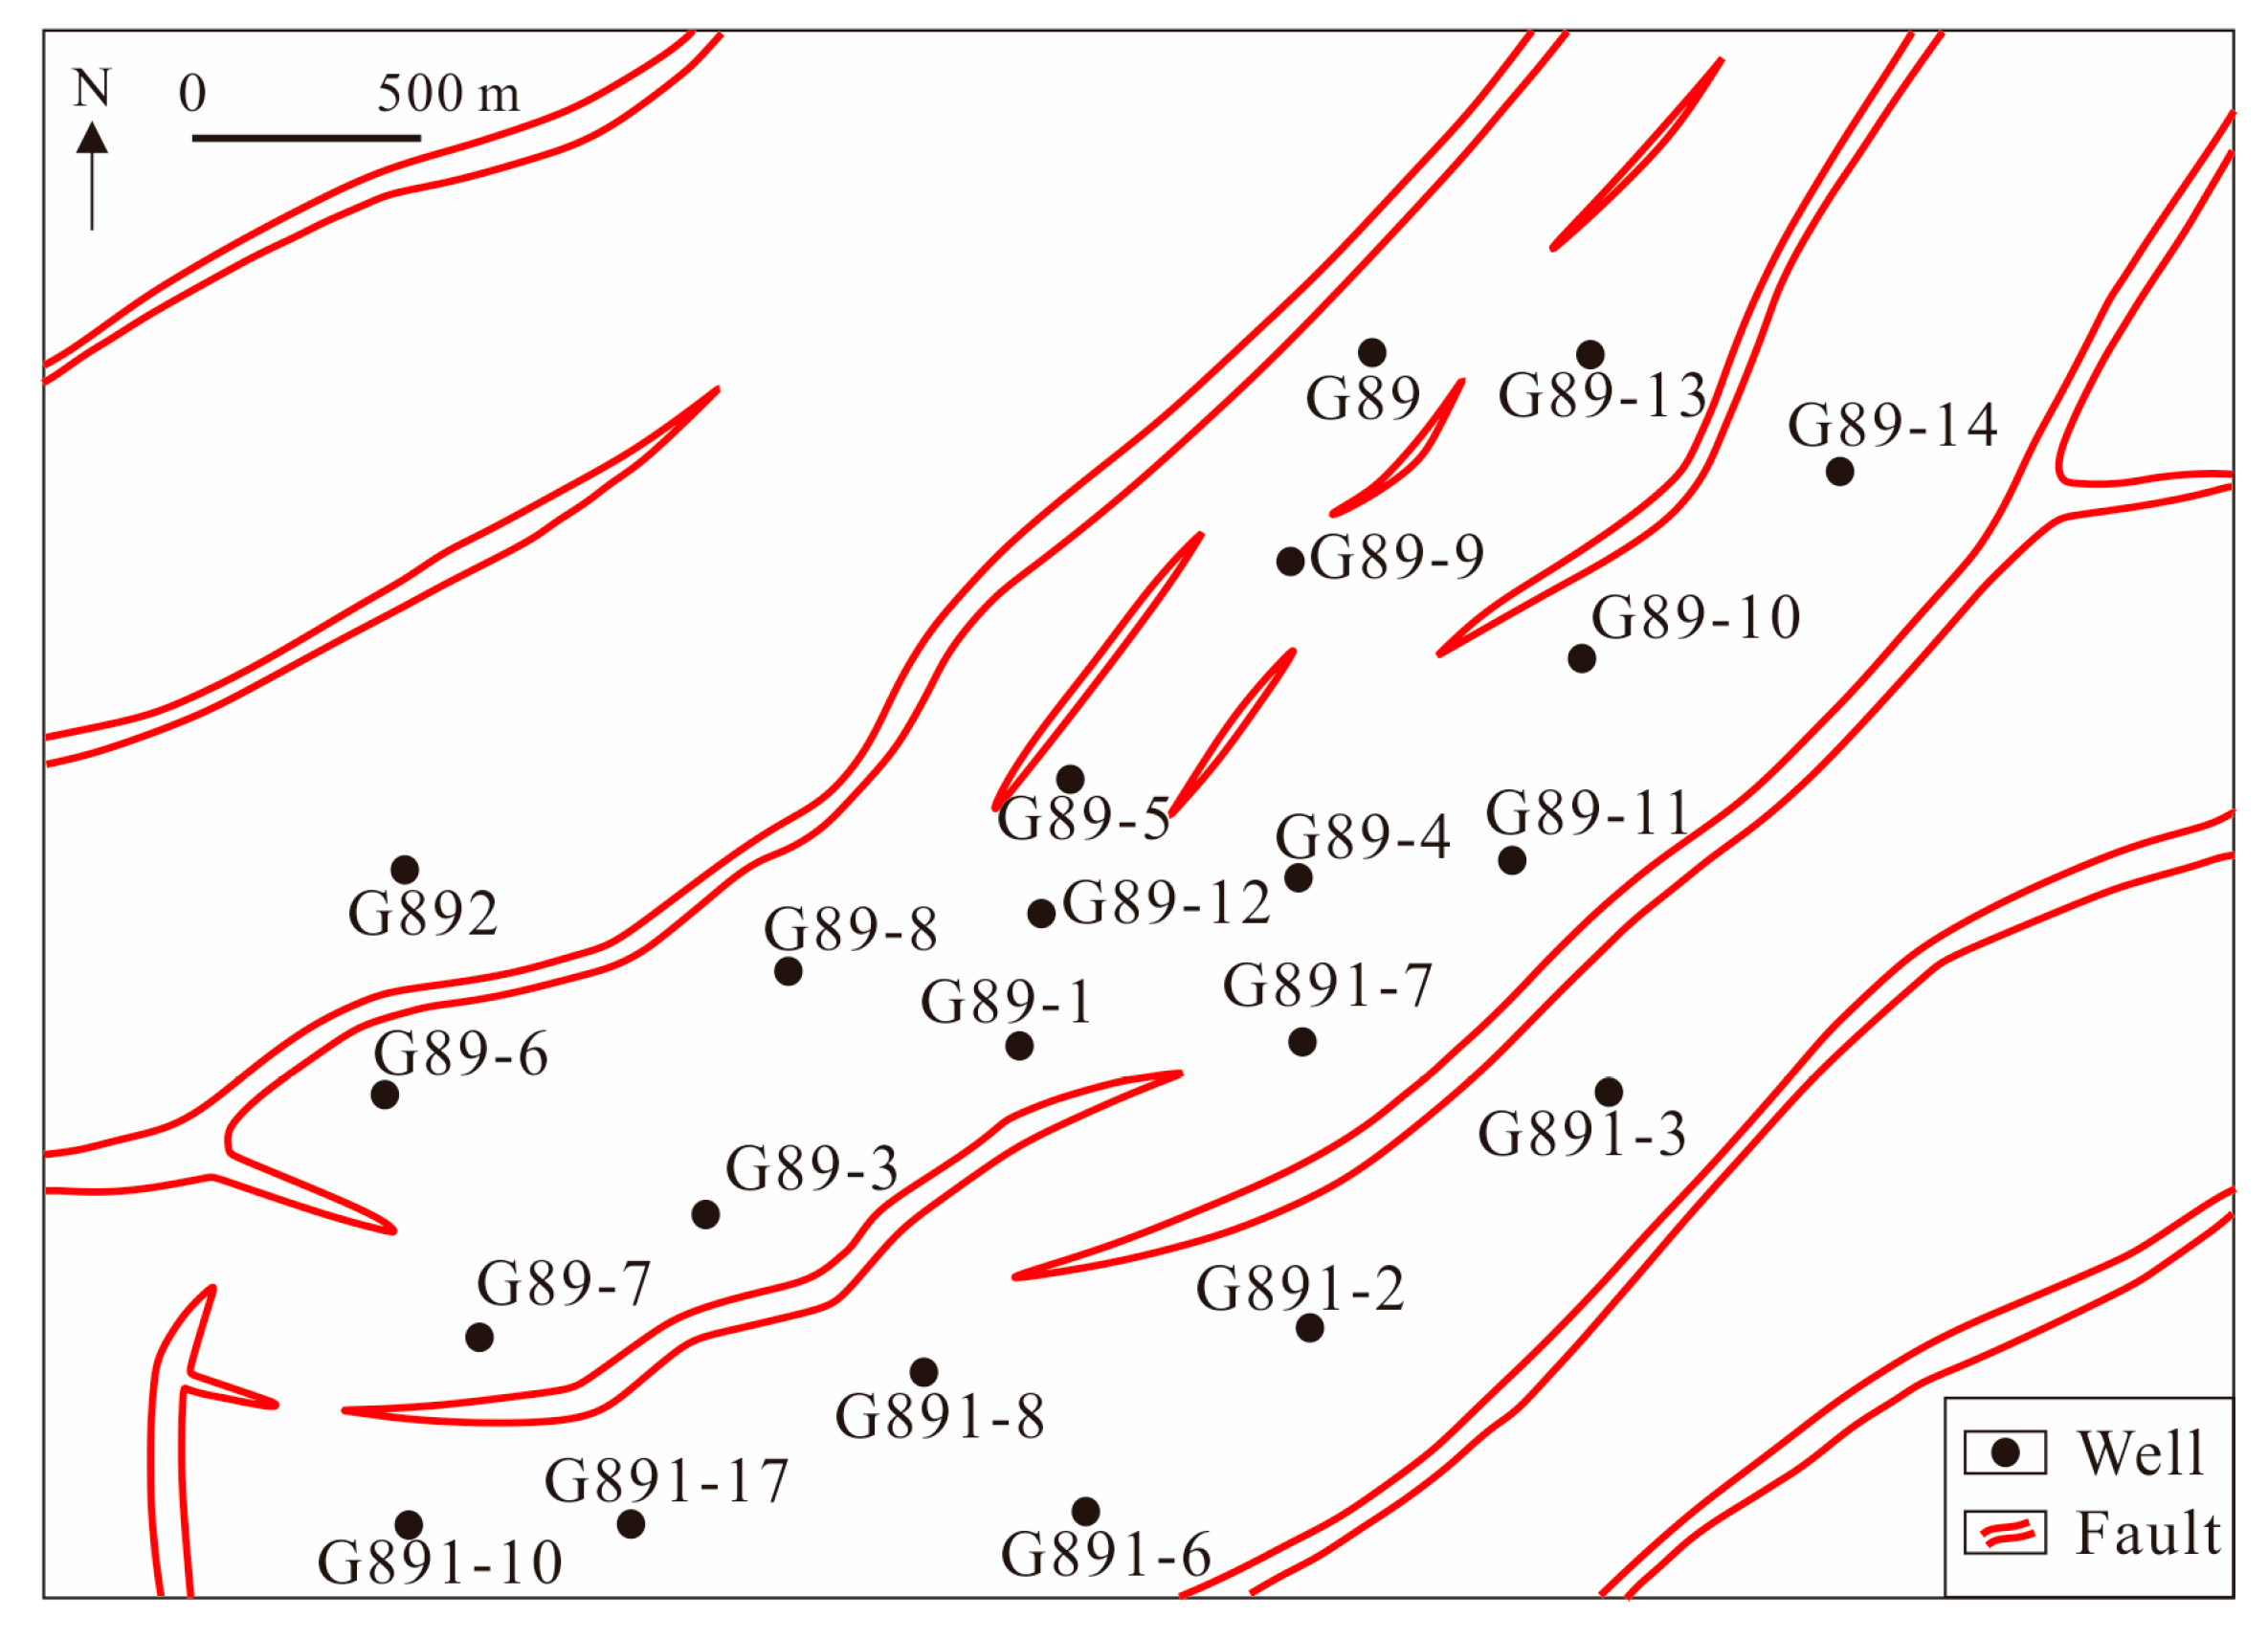
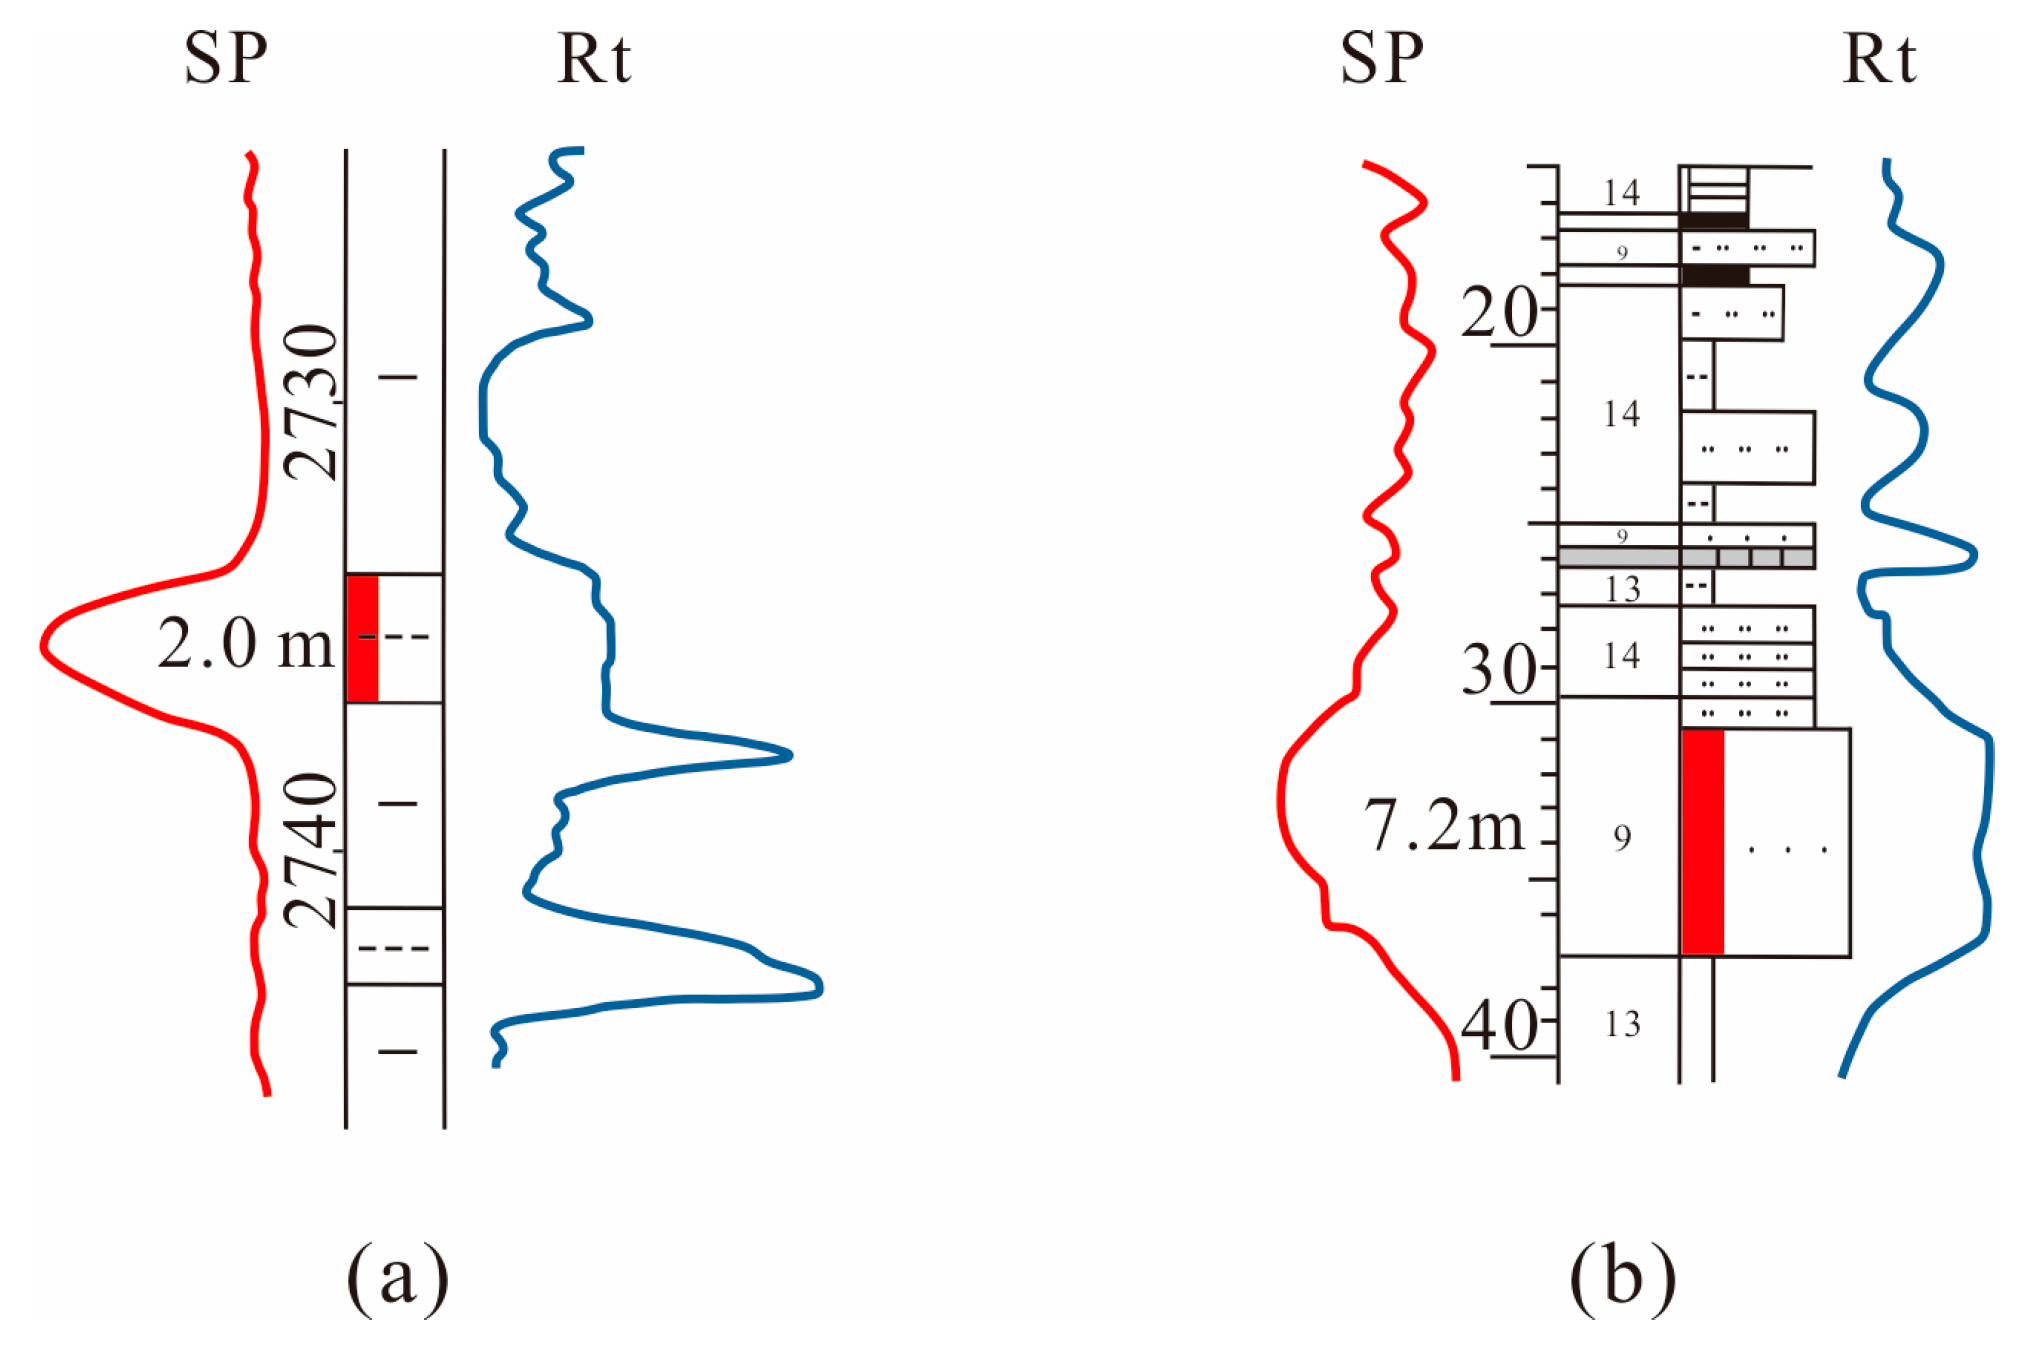
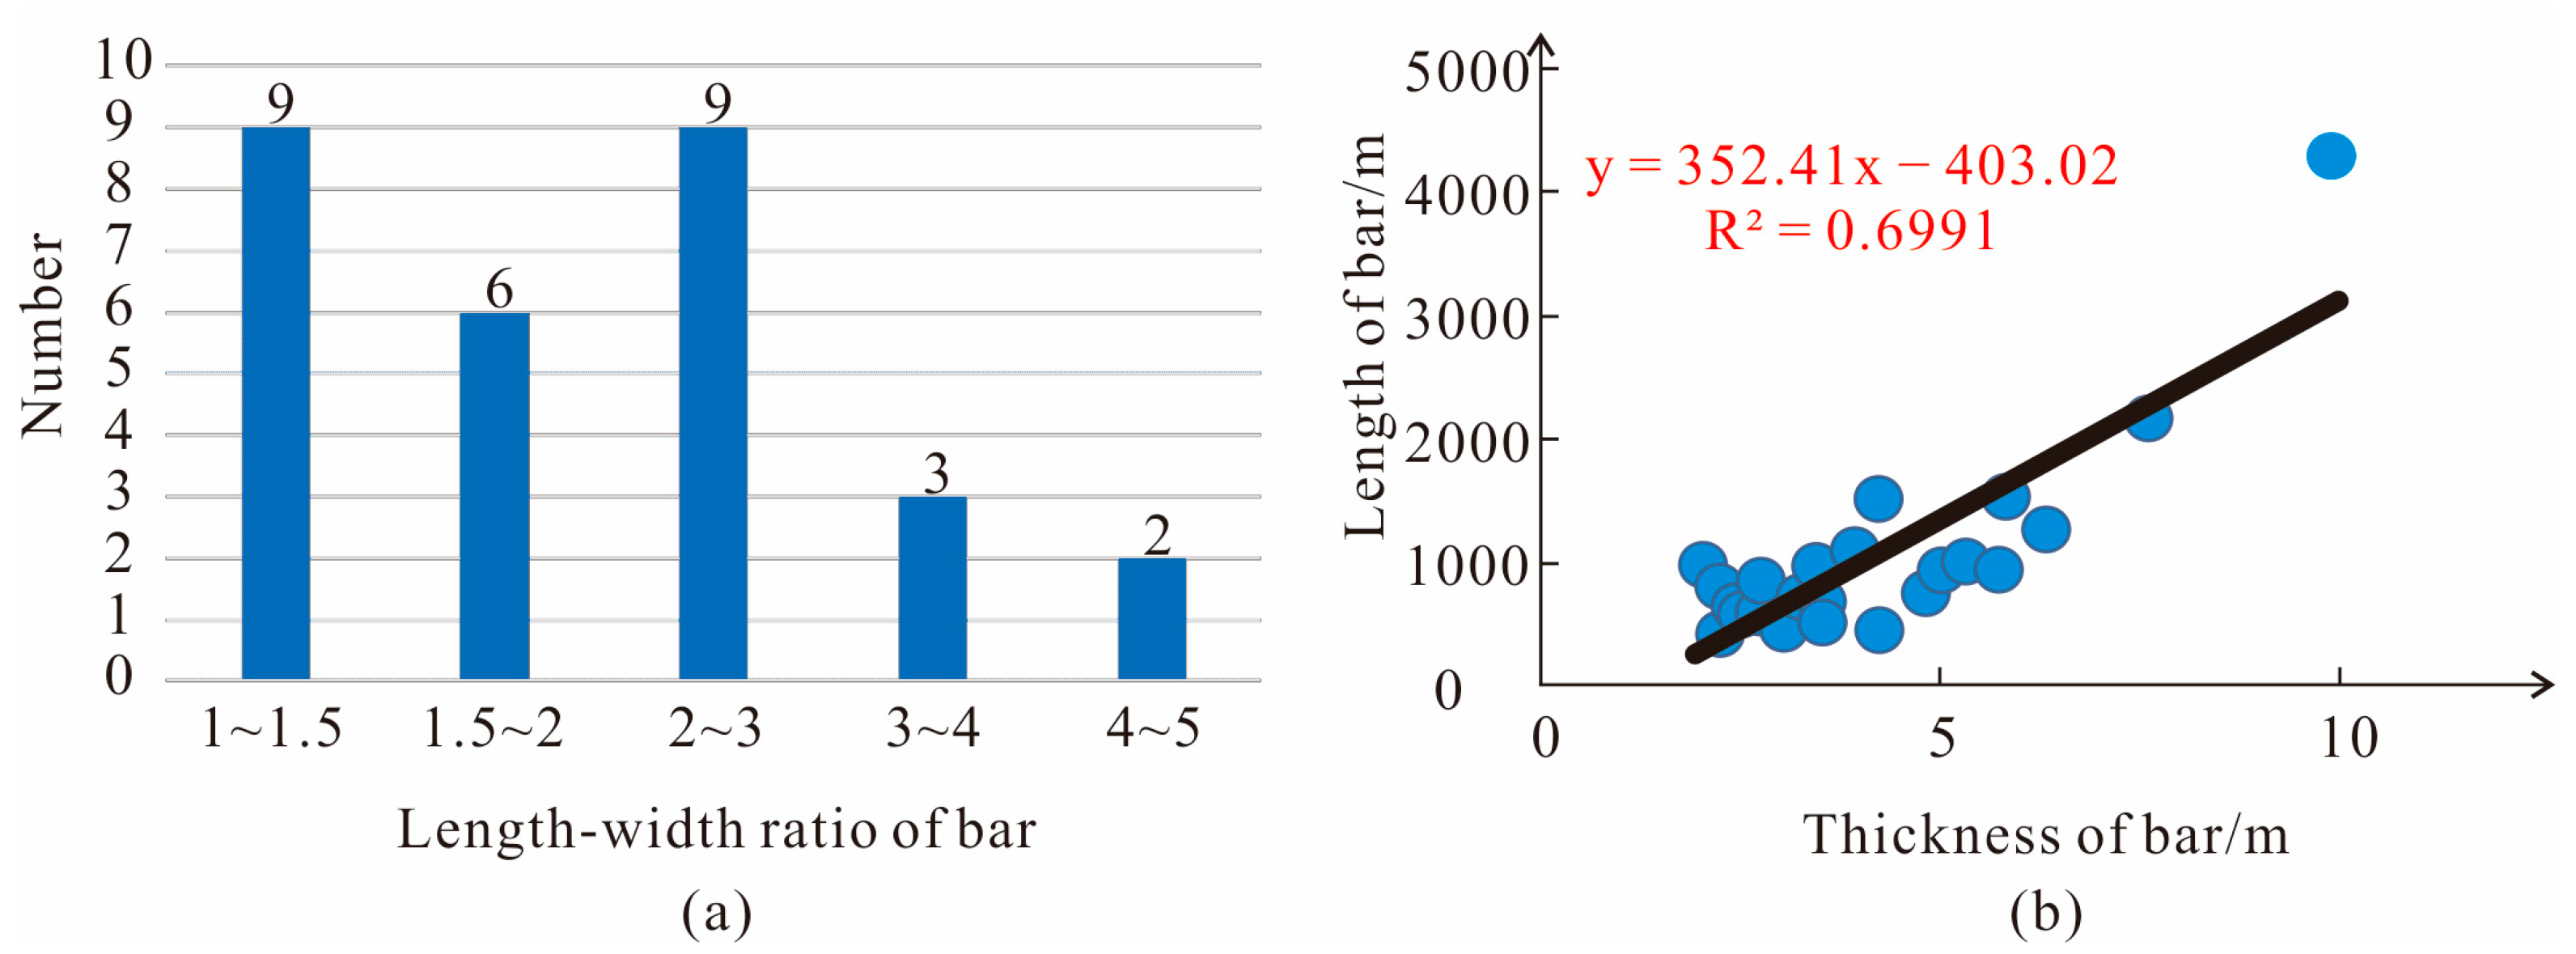
2.4. Sandbody Volume

A total of 30 wells were drilled in the study area. Combined with modern sedimentation and outcrop measurement, the volume of bar sand has been quantitatively characterized. Through the measurement of the length and width of bar sand, it is found that its length varies greatly, but usually does not exceed 3000 m. The average length of bar sand is about 1200 m, and the average width is about 500 m. The length-width ratio of bar sand in the working area is between 1 and 5, mainly in the range of 1~3, and the average length-width ratio is 2.1 (Figure 6a). According to the thickness statistics of sandbodies, the thickness of bar sand in the area is between 2 and 10 m and mostly is 2~5 m. In general, there is a good correlation between the length and thickness of bar sand. The sandbody is thicker, and its length is greater (Figure 6b). The empirical relationship between length and thickness of the bar sandbodies is obtained due to statistical analysis using the following equation:
y = 352.41 x 403.02
where y is the length of bar sand and x is the thickness. Taking the length as a bridge, the length is predicted according to the sandbody thickness, and then the sandbody width is predicted based on the length-width ratio. A distribution range of sandbody volume can be obtained. In the process of sandbody modeling, the bar sand volume can be used as a constraint.

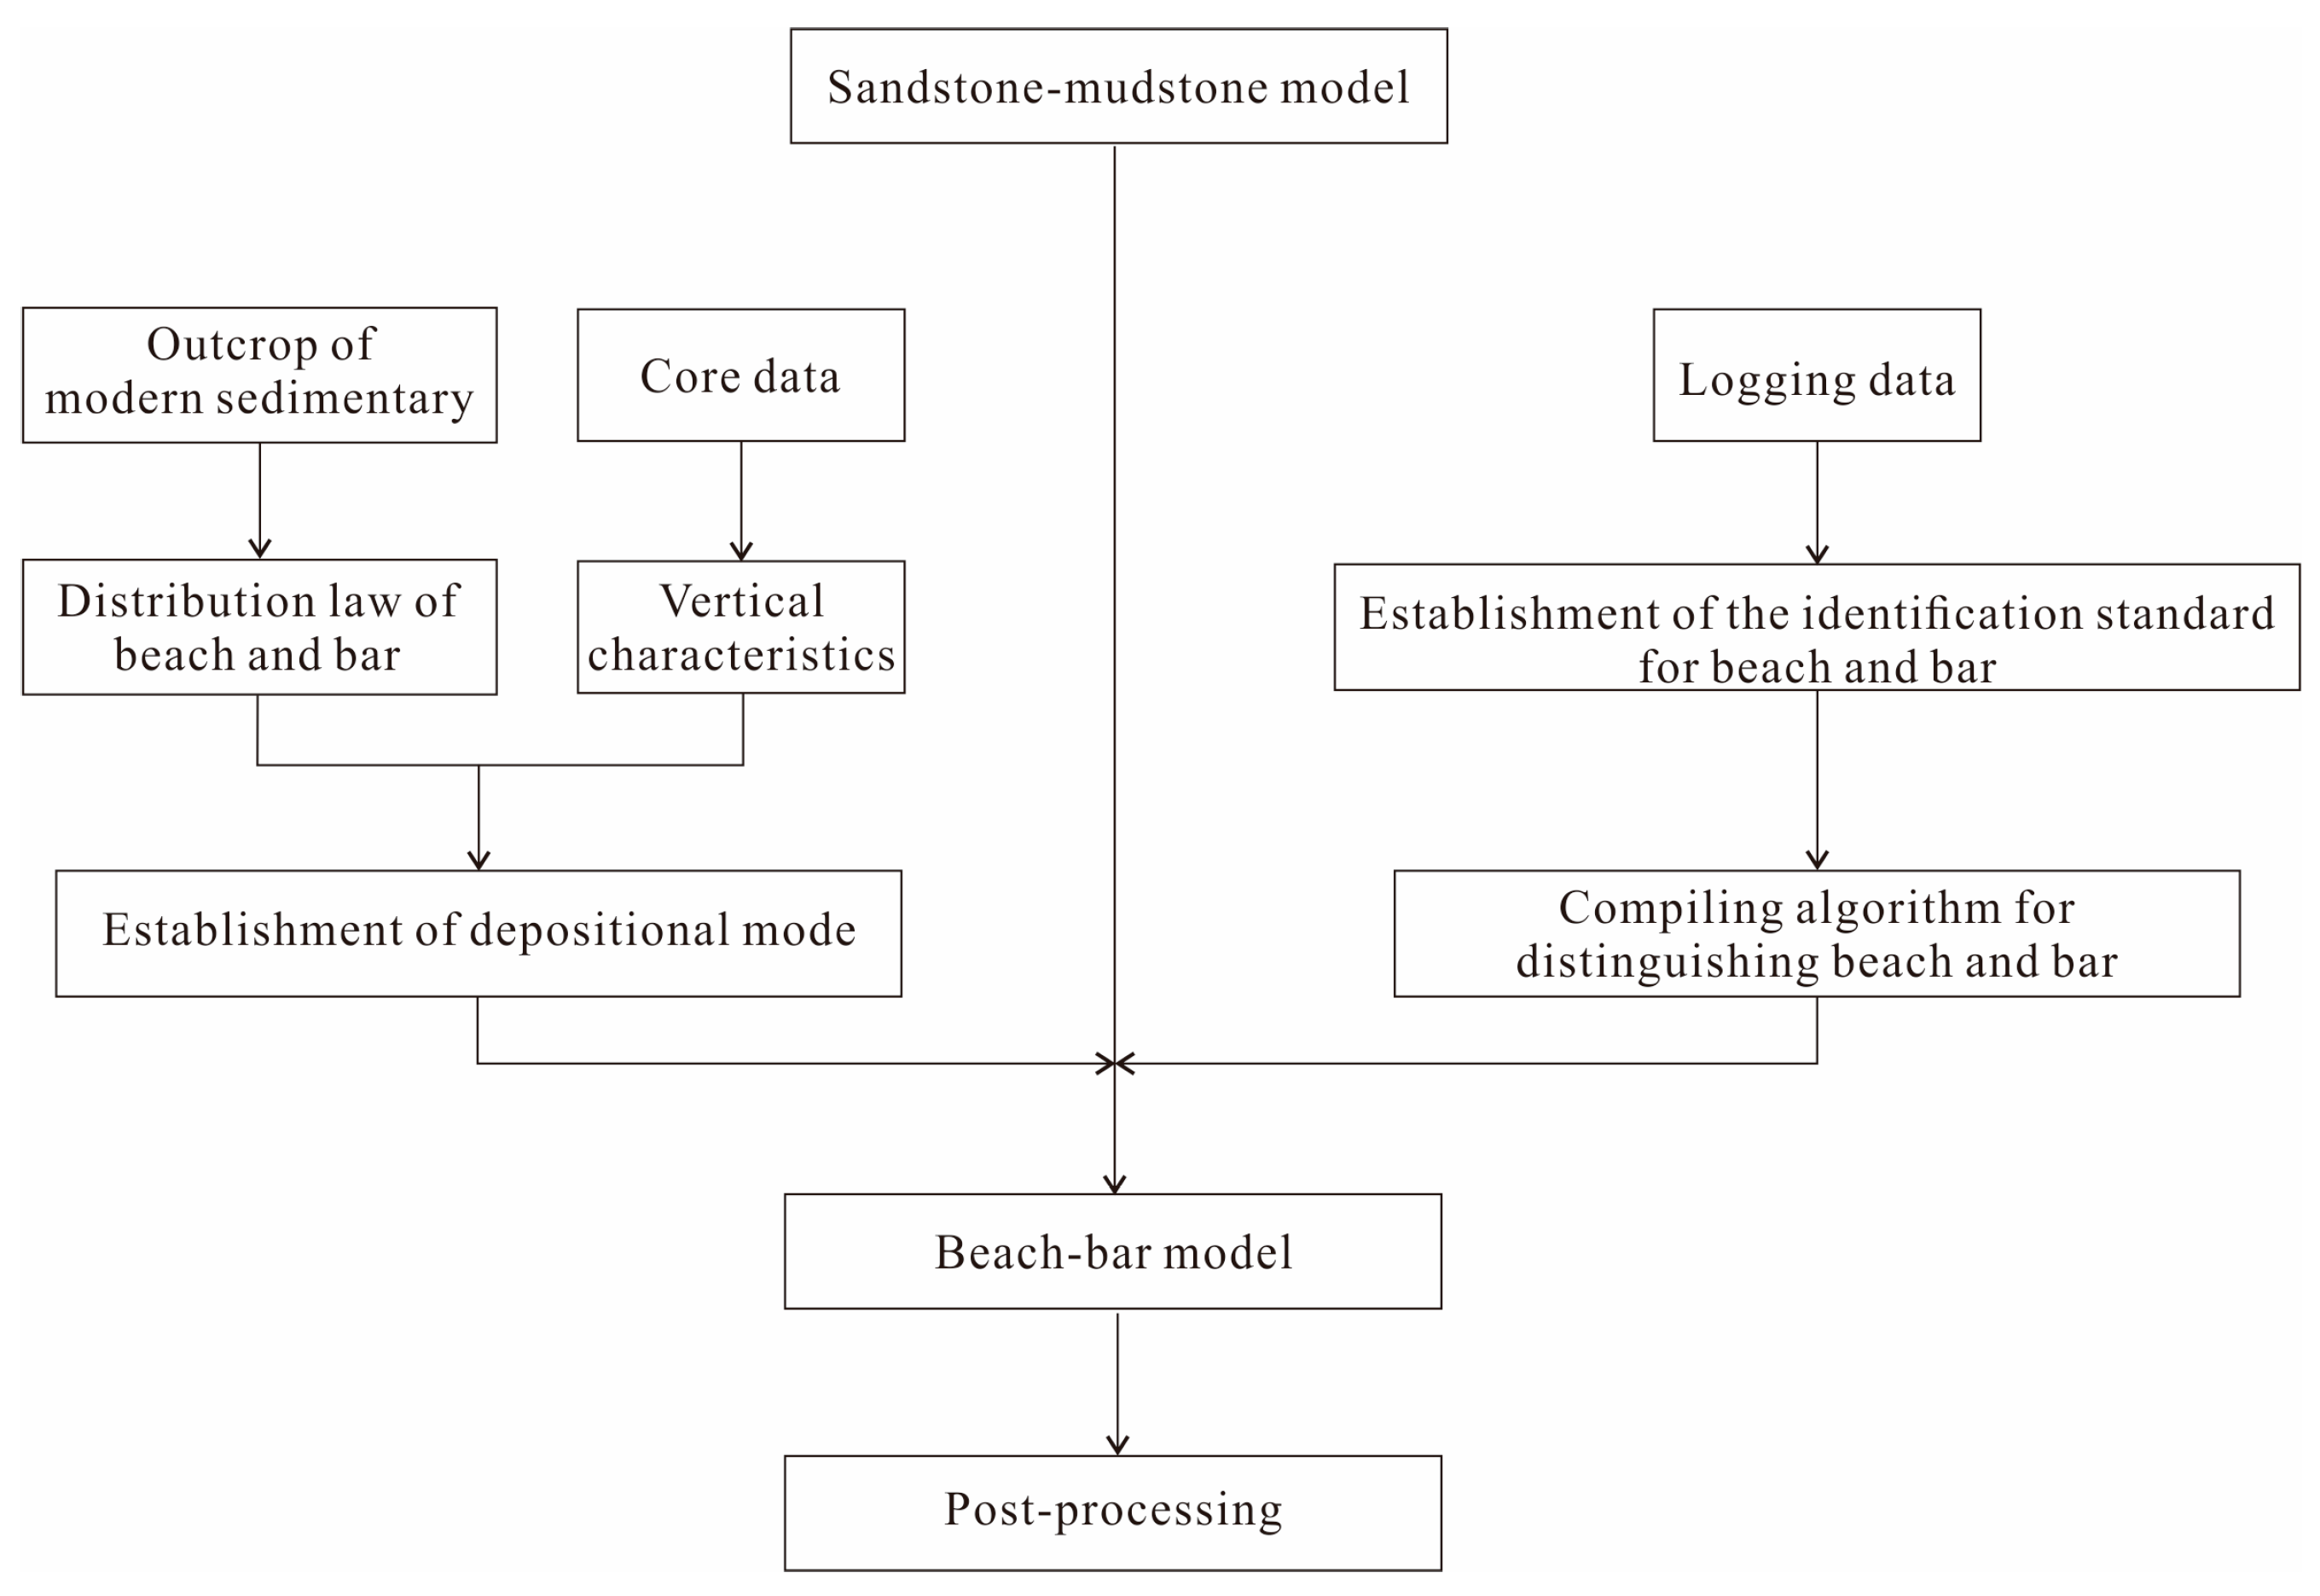
3. Modeling Method Based on Depositional Mode and Sandbody Volume

Modeling based on the depositional mode and sandbody volume refers to establishing beach and bar sandbody models based on the thickness of a single sandbody, according to the relative position and connectivity of these two types of sand and using the previously established bar sand volume information to constrain the model. The main process includes the following steps: (1) establishing a sand-shale model that does not distinguish between beach and bar sand; (2) bar sand and beach sand are divided as per the sedimentary model and sandbody volume; (3) the model is post processed according to the sandbody volume of bar sand (Figure 7).

3.1. Sand-Mud Lithofacies Model

Depending on whether the simulation unit is a single grid or a group of grids, the reservoir stochastic modeling method can be divided into pixel-based, object-based and pattern-based modeling [38,39]. Pixel-based methods usually describe the correlation between two spatial points through a variogram, and are more suitable for establishing reservoir models in the case of abundant data in the oilfield development stage [12]. The simulated geological body is required to have a geometric shape that is easy to parameterize when using object-based modeling methods, so the volume of a single geological body can be clearly controlled. The pattern-based simulation methods take training images as the basic tool, which can reflect the correlation between spatial multiple points, and can integrate geological knowledge into training images [40]. However, the object-based method has the problem of difficult conditionalization under the condition of dense well patterns [41,42]. The pixel-based or pattern-based modeling methods have greater advantages in data conditionalization than the object-based modeling method, but it is difficult to characterize the internal relationship between geological bodies with different origins [43]. Sequential indicator simulation (SIS) is a stochastic modeling method based on indicator kriging, and the established model can be faithful to well data and maintain its spatial structure using this approach [44]. In this study, the sequential indicator simulation method is used to establish a sand-mud lithofacies model without distinguishing between beach and bar sandbodies. In the sandstone-mudstone model, the code of mudstone is 0 and the sandstone is 1.

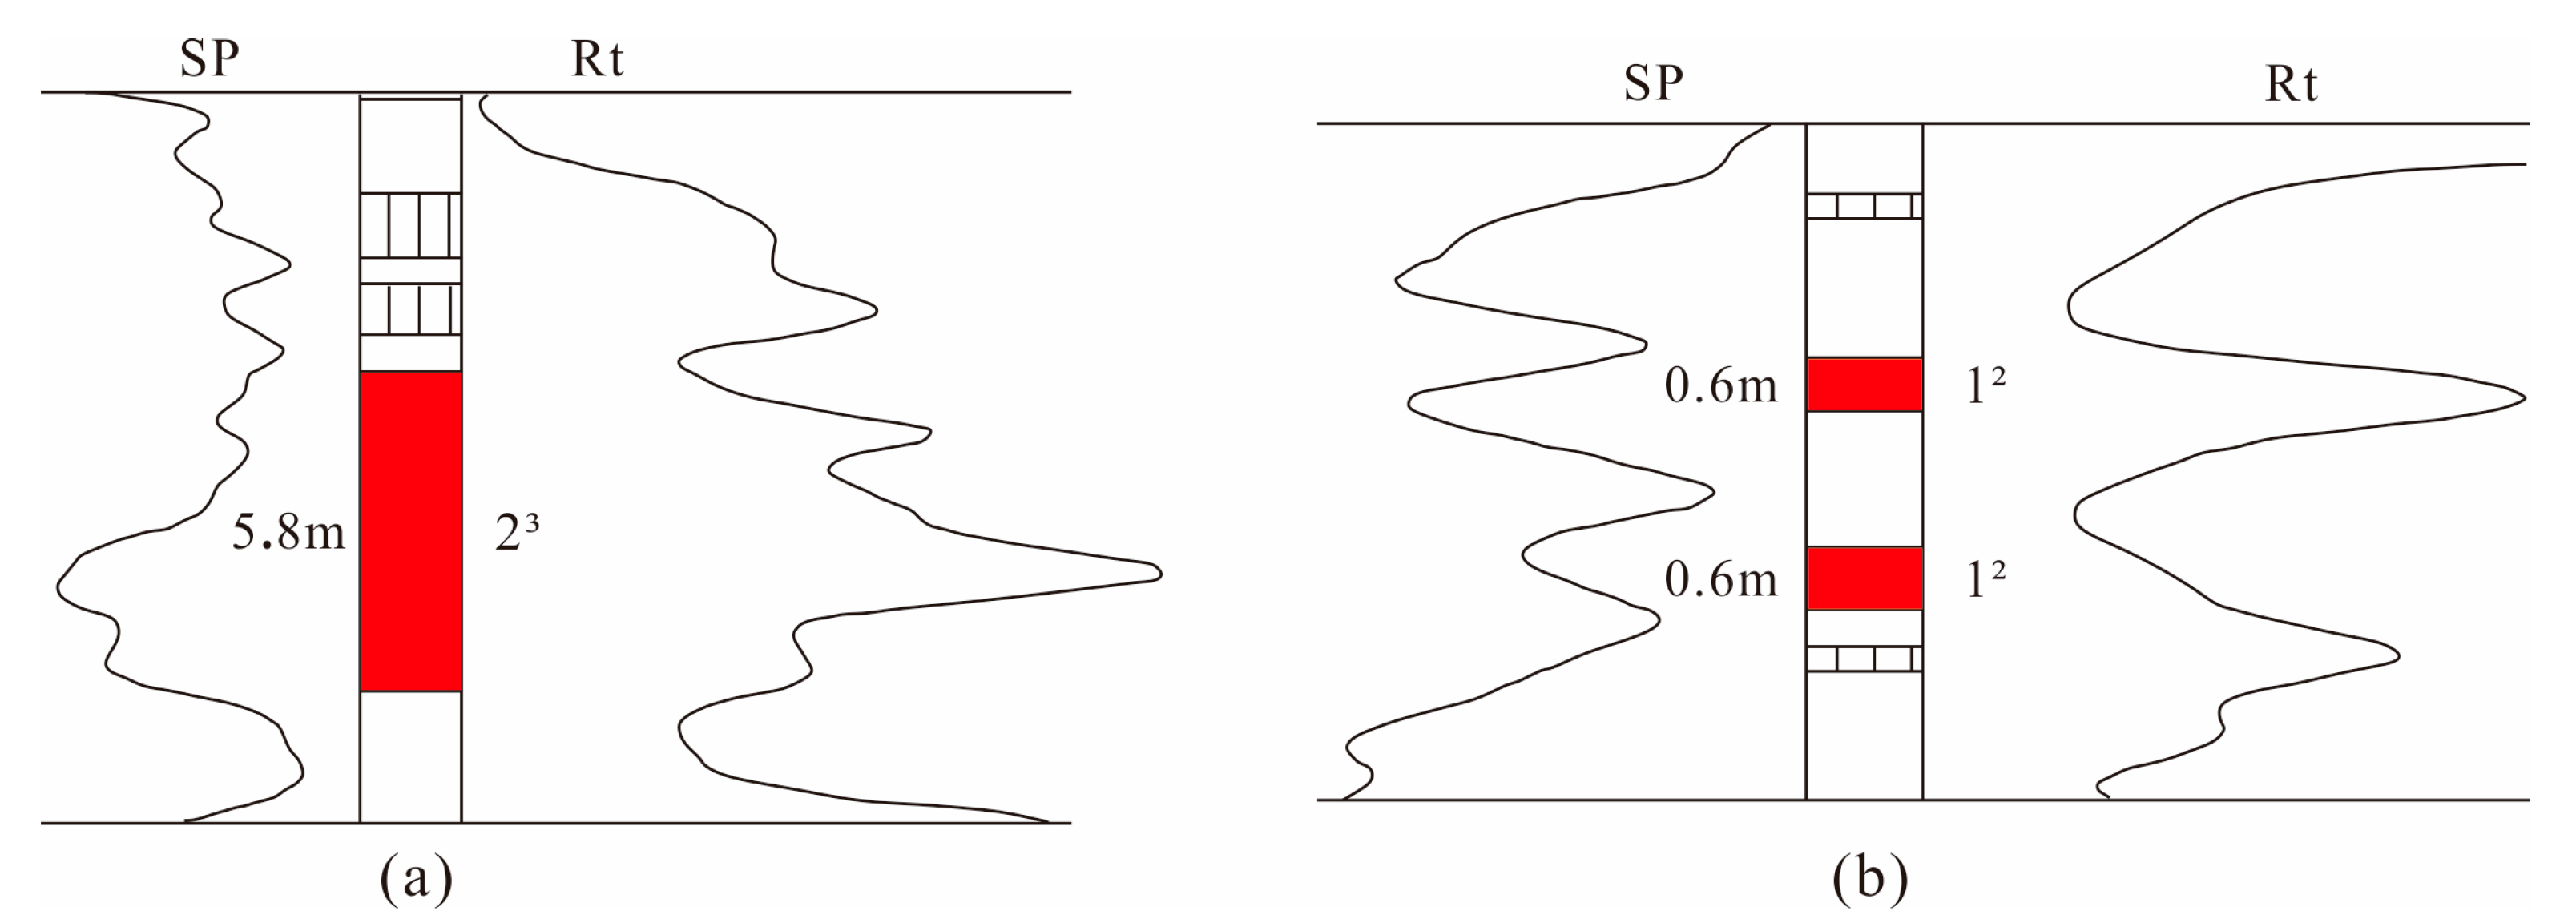
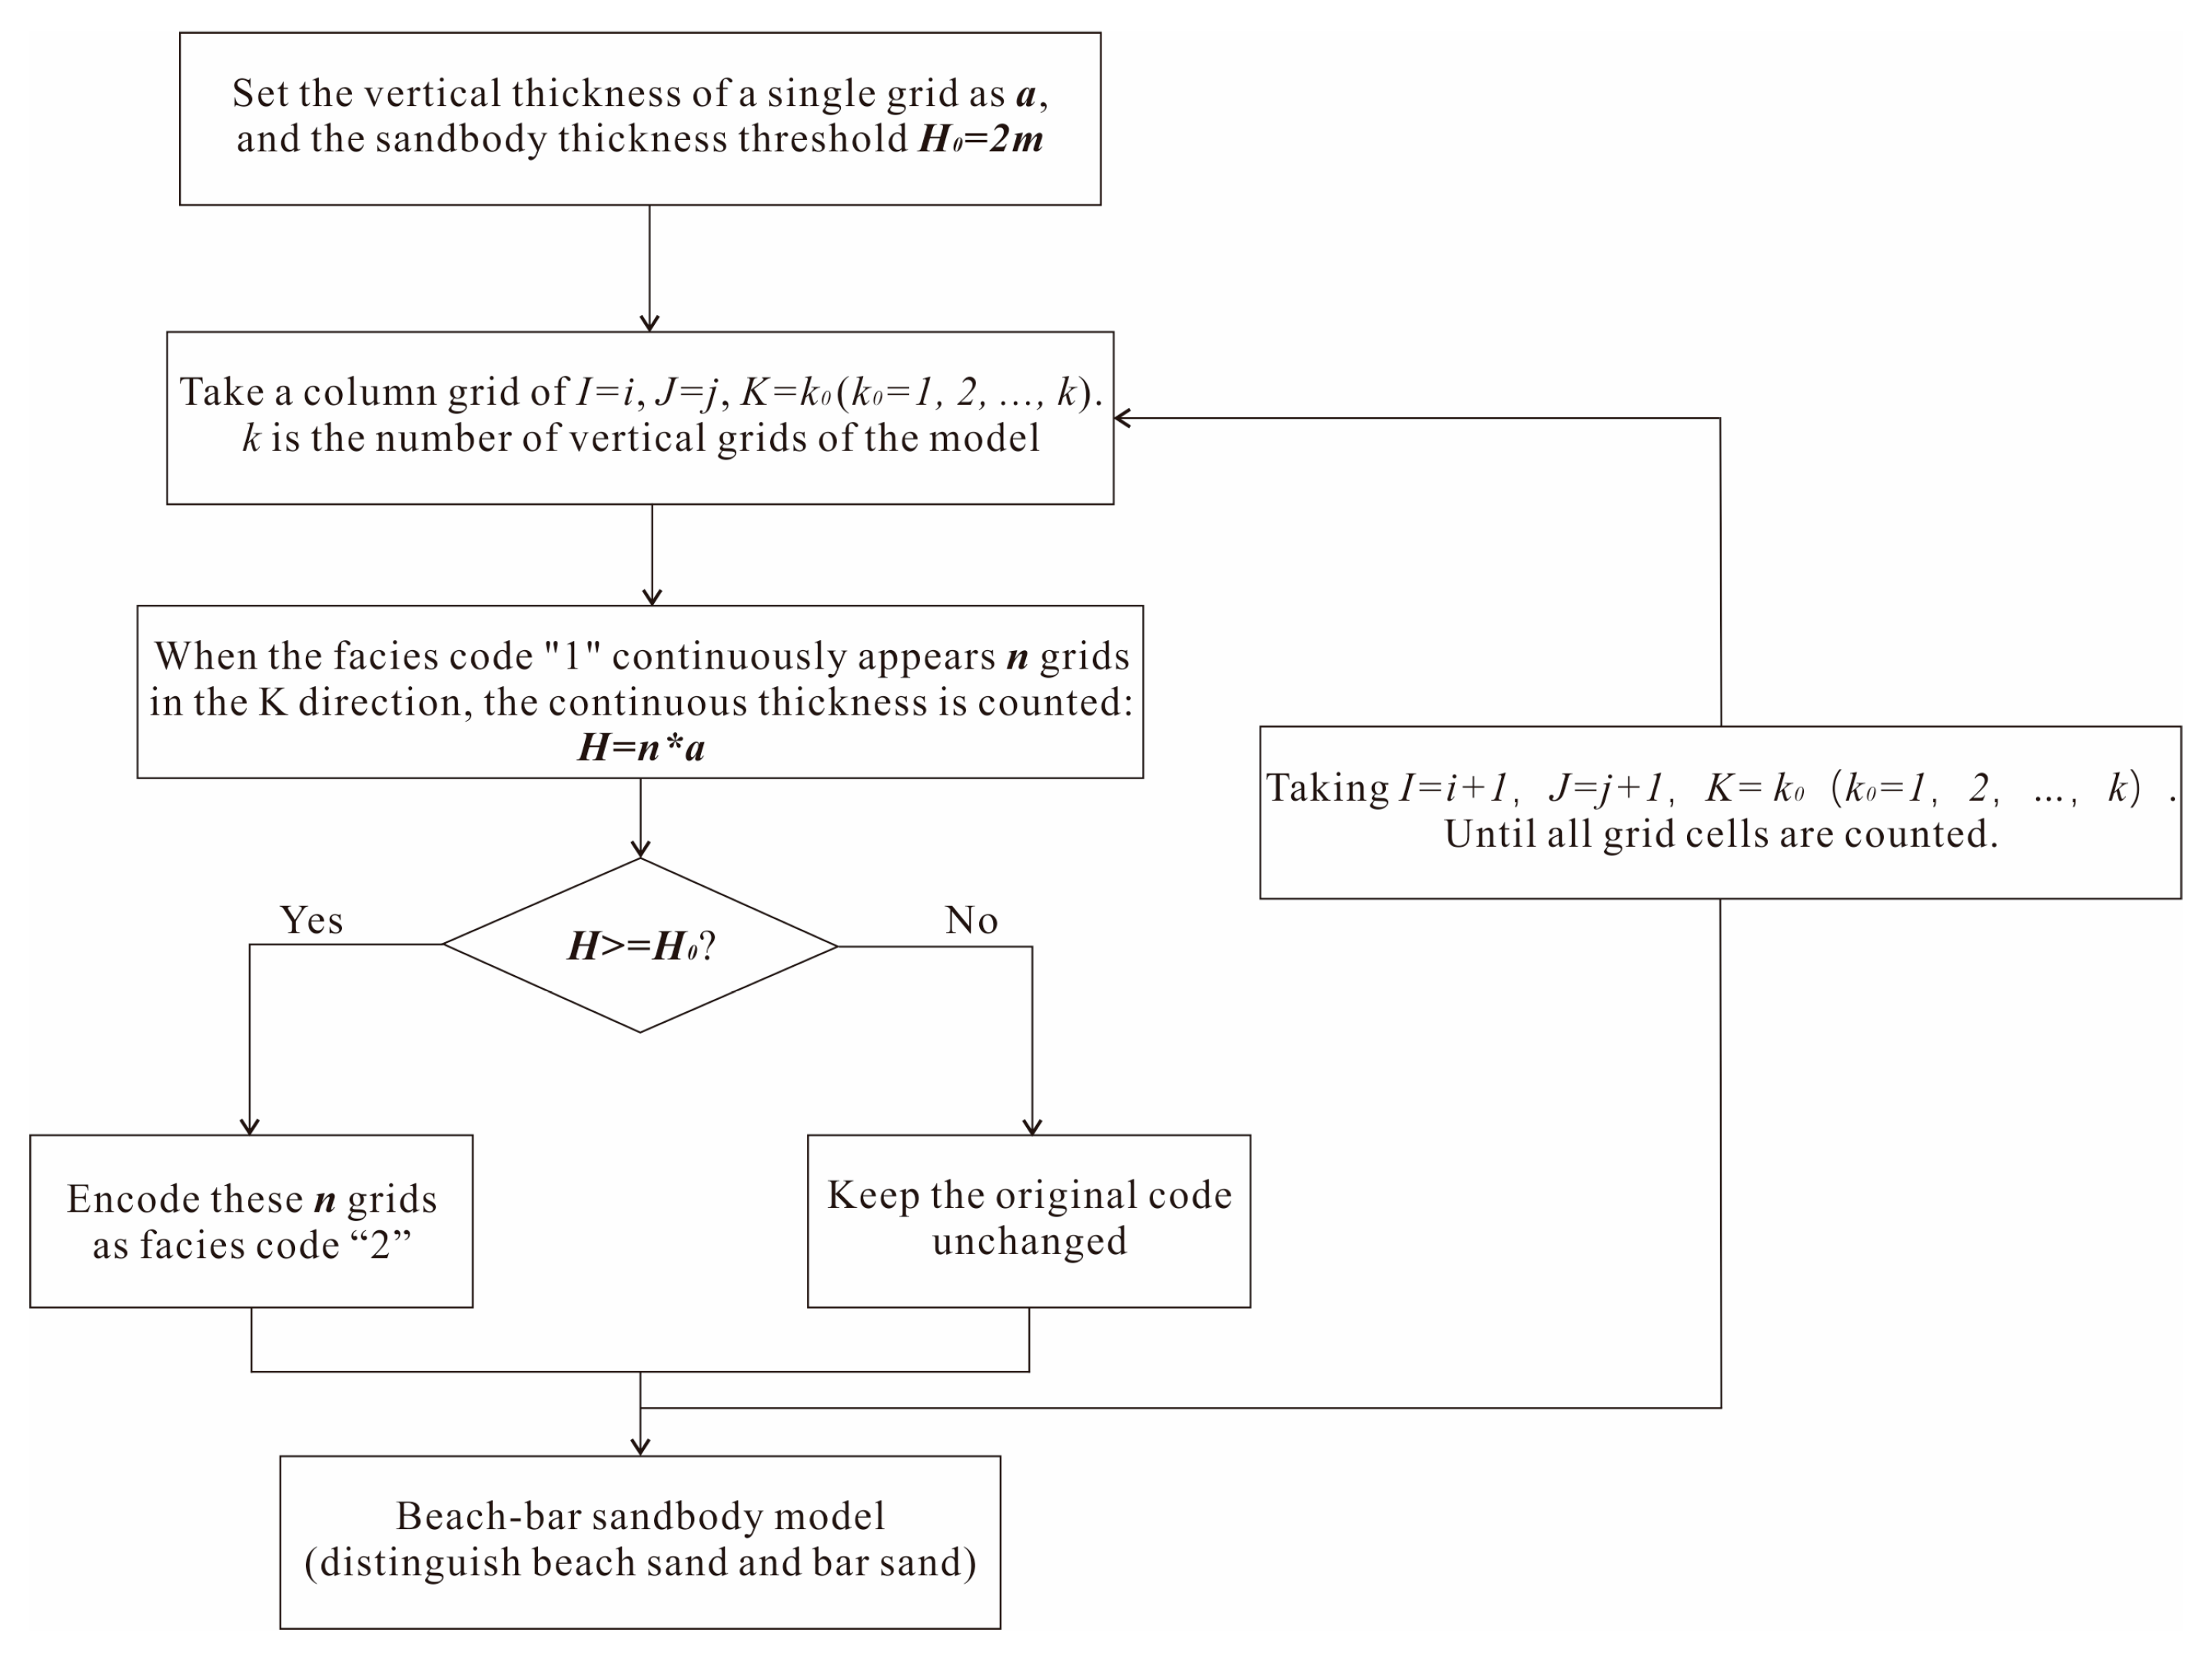
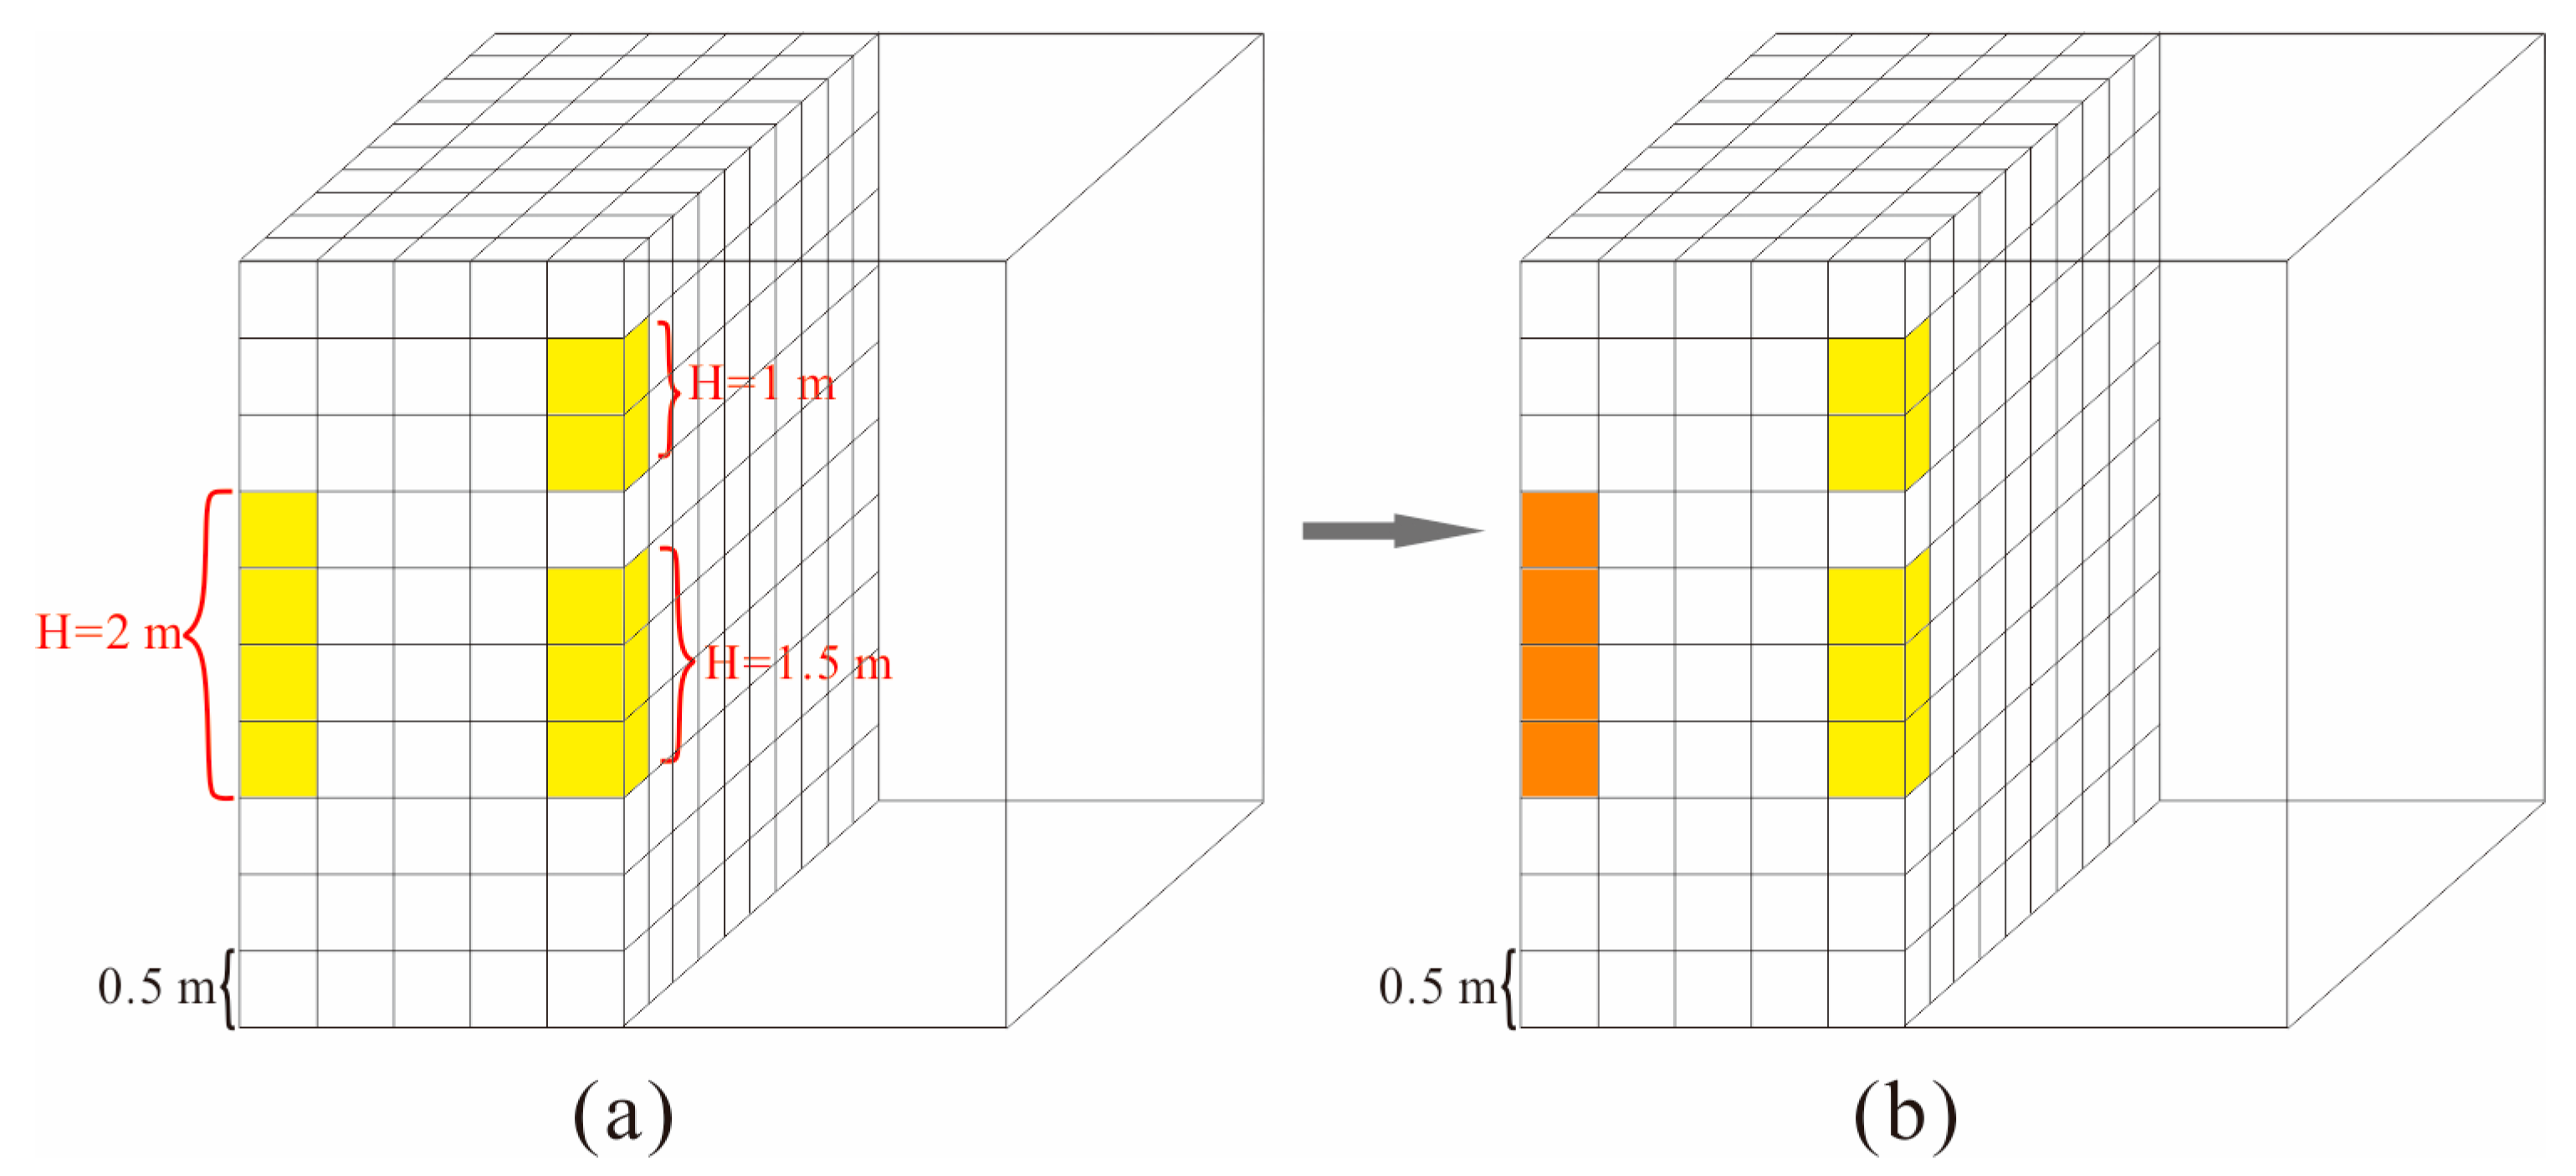
3.2. Division of Bar Sand and Beach Sand

Based on the outcrop characteristics of modern sediments, core, well logging and other data, it is determined that the beach and bar are close to each other longitudinally, and symbiotic horizontally and the bar sand is distributed in the middle of the beach sand in an irregular strip shape. The beach-bar sand can be divided into bar sand and beach sand, due to the different vertical thicknesses through the previous research results. In the light of coring data, the Gao89-1 block in the study area can retain better petrophysical properties at the center of the 2 m sandbody (Figure 8), and beach sand and bar sand can also be identified according to the curve characteristics in the logging data (Figure 9). The thickness of a bar sandbody is generally more than 2 m, whose SP logging curve is box-shaped, and the thickness of beach sand is generally less than 2 m and the SP curve is finger-shaped.
Therefore, an algorithm is written to divide bar sand and beach sand according to the vertical thickness of a single sandbody, which takes into account whether the thickness is greater than 2 m as the standard (the algorithm flow is shown in Figure 10). For the initial sandstone-mudstone model, the mudstone is coded as 0 and the sandstone is coded as 1. One must set the threshold ( H 0 ) of continuous sandstone thickness to 2 m to analyze the thickness of the initial model. When the grid cells coded as 1 vertically appear successively and the continuous thickness is not less than 2 m, all continuous cells are recoded as 2. This means that the sandbody with a thickness greater than or equal to 2 m is regarded as bar sand. As shown in Figure 11a, it is assumed that the thickness of each grid in the vertical direction is 0.5 m. When n grids with code 1 appear continuously, the thickness of the continuous sandbody H = 0.5 n . If H H 0 , one must recode the n grids as 2. On the contrary, one must keep the original code unchanged. The grid after recoding is shown in Figure 11b. Thus, the original sandstone-mudstone model can be transformed into a lithofacies model with bar sand, beach sand and mudstone. The transformed beach-bar sand model is consistent with the established sedimentary mode, but due to the grid-by-grid processing, there will be abnormal volumes of bar sand.

3.3. Post-Processing

Using the outcrop data, empirical relationships between length and width, length and thickness of the bar sand are established. Combined with the minimum thickness, the minimum volume of bar sand is determined, and the distribution range of bar sandbody volume also can be defined. Based on the previously established beach-bar sand model, the volume of the individual bar sandbody is calculated, in addition to sandbodies whose volumes are smaller than the minimum bar volume that are converted to beach sand. A beach-bar sand model with a bar sand volume constraint is, therefore, achieved.

4. Application and Discussion

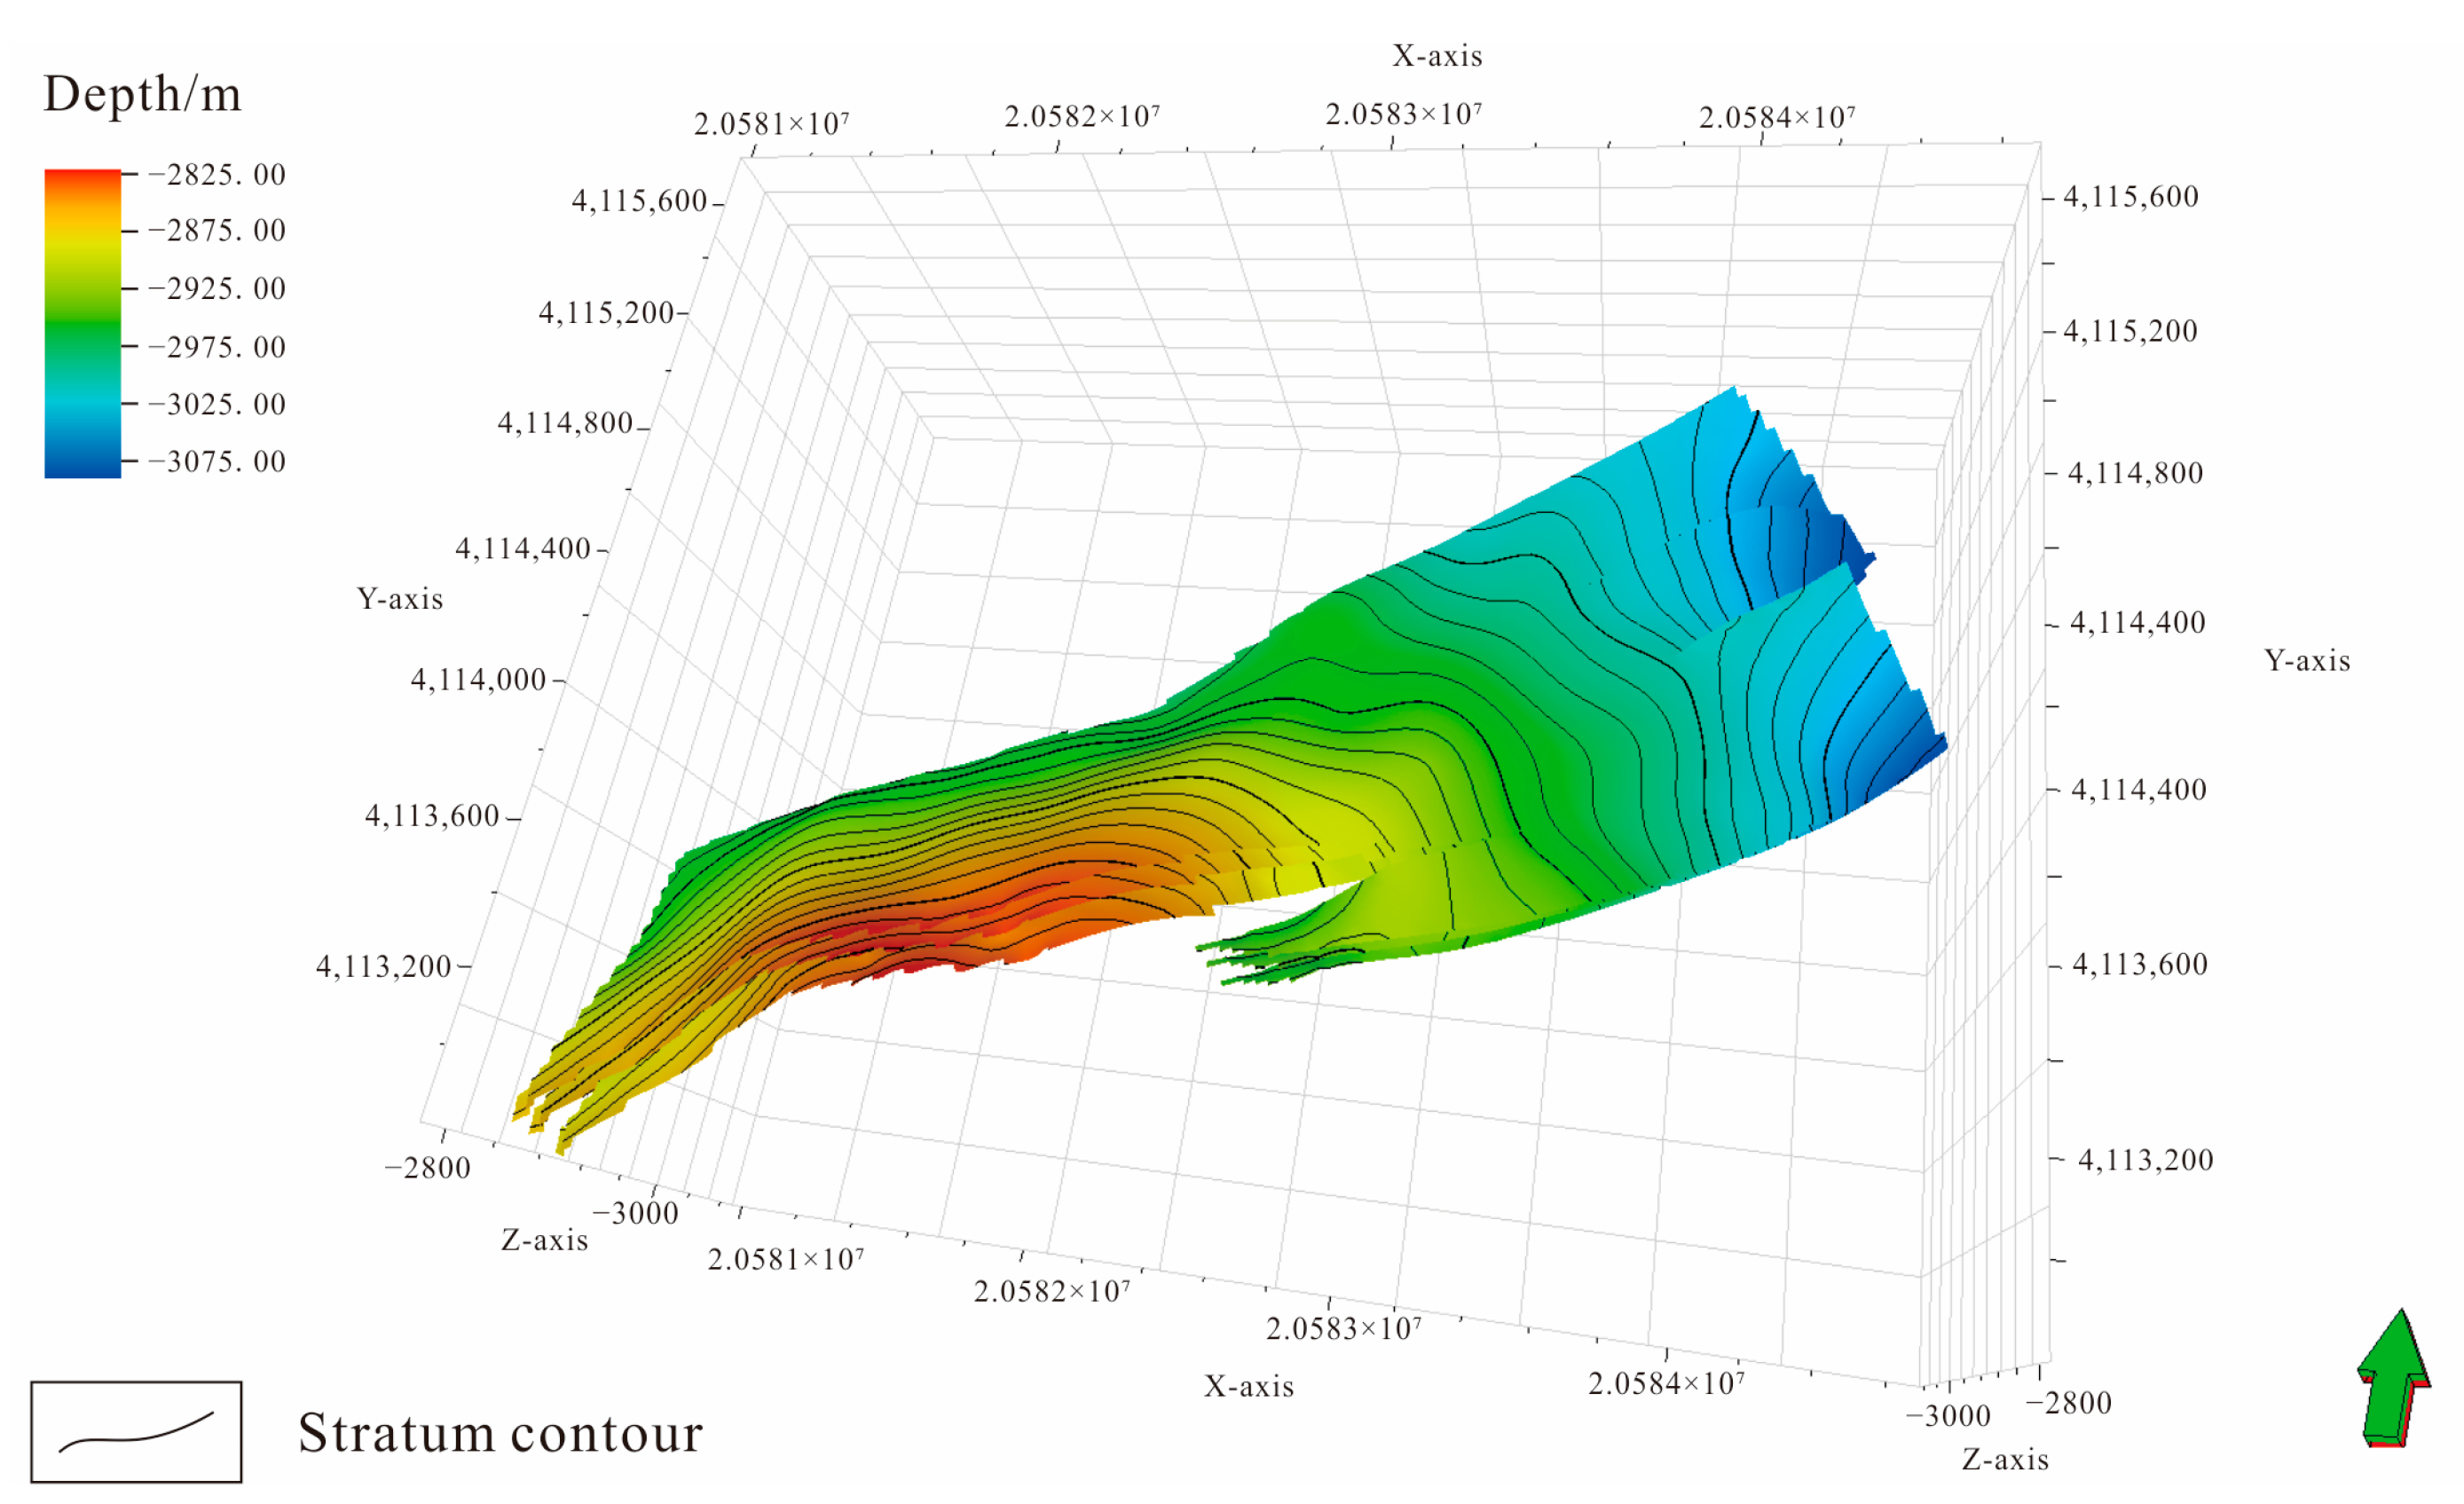
4.1. Structure Model

The fault relationships within the Gao89-1 area are simple and no complex fault contact relationships exist. The grid size in the plane is set to 30 m × 30 m, with the grid number of 140 × 54. In the vertical direction, the grid is divided into equal proportions about 0.5 m accordingly, which is divided into 100 grids. The total number of grids in the working area is 756,000. Figure 12 shows the horizon model of this area, and it can be made out that the overall structure of this area is characterized as high in the southwest and low in the northeast.

4.2. Beach-Bar Sand Model

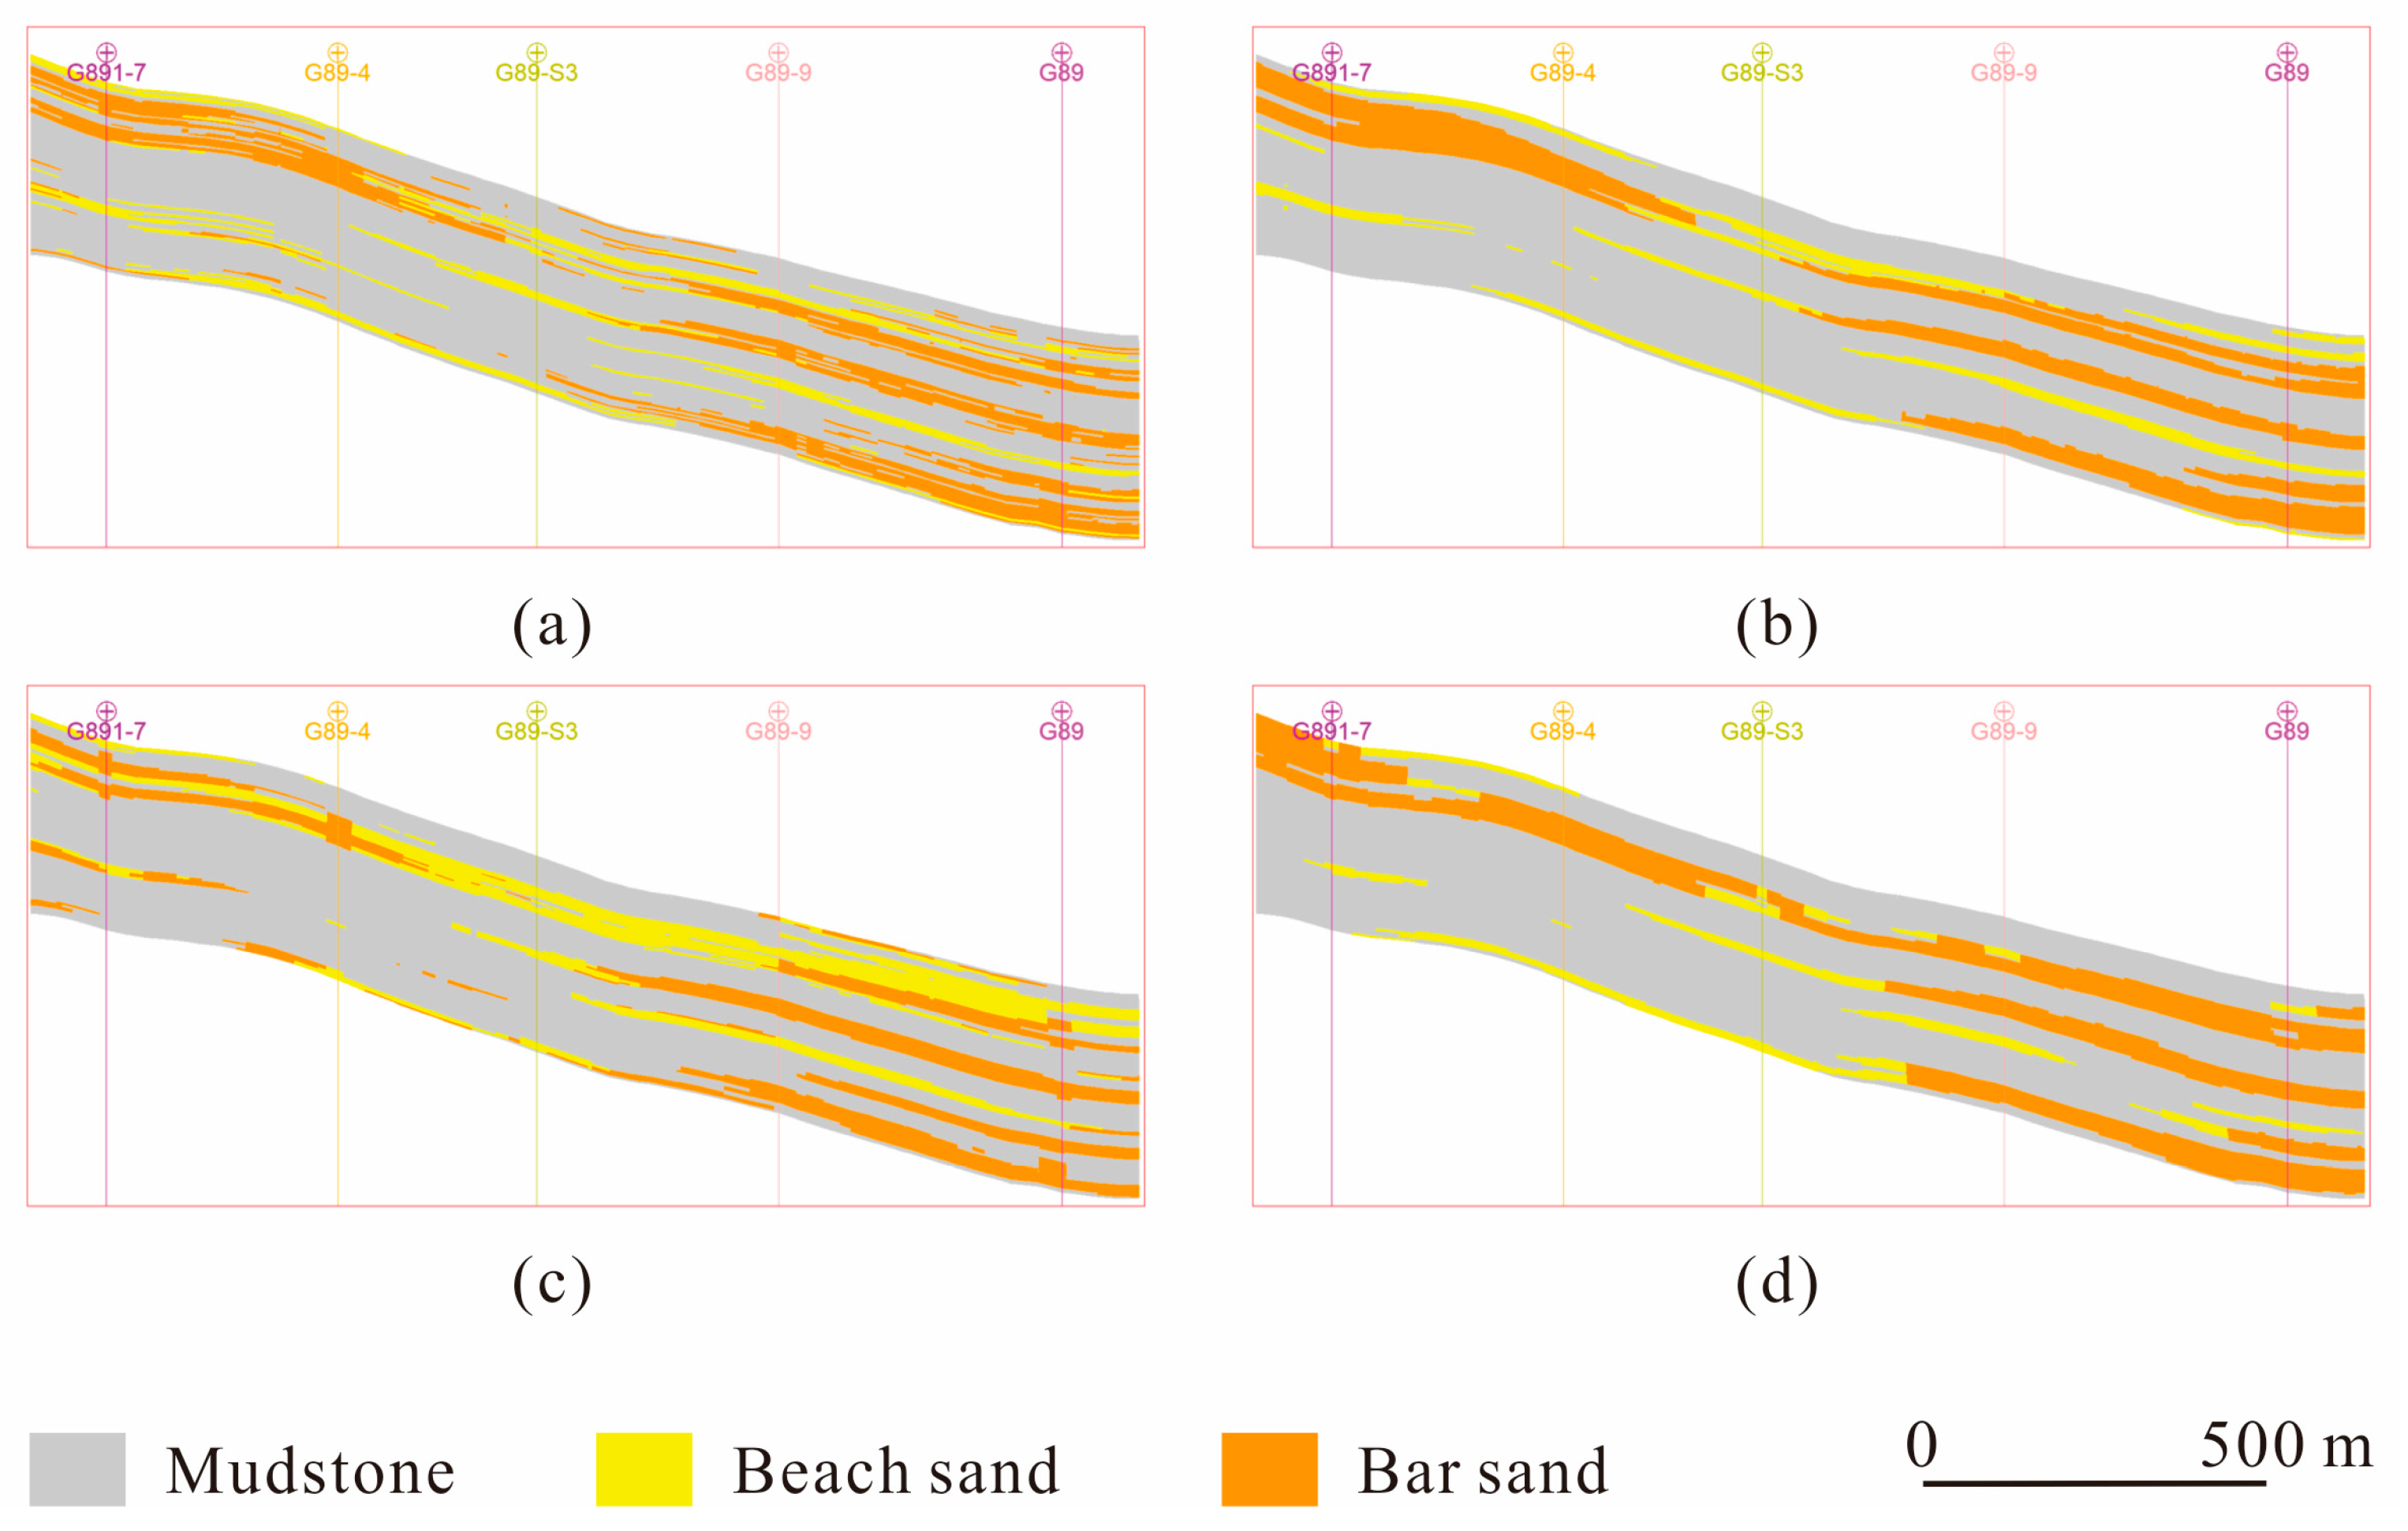
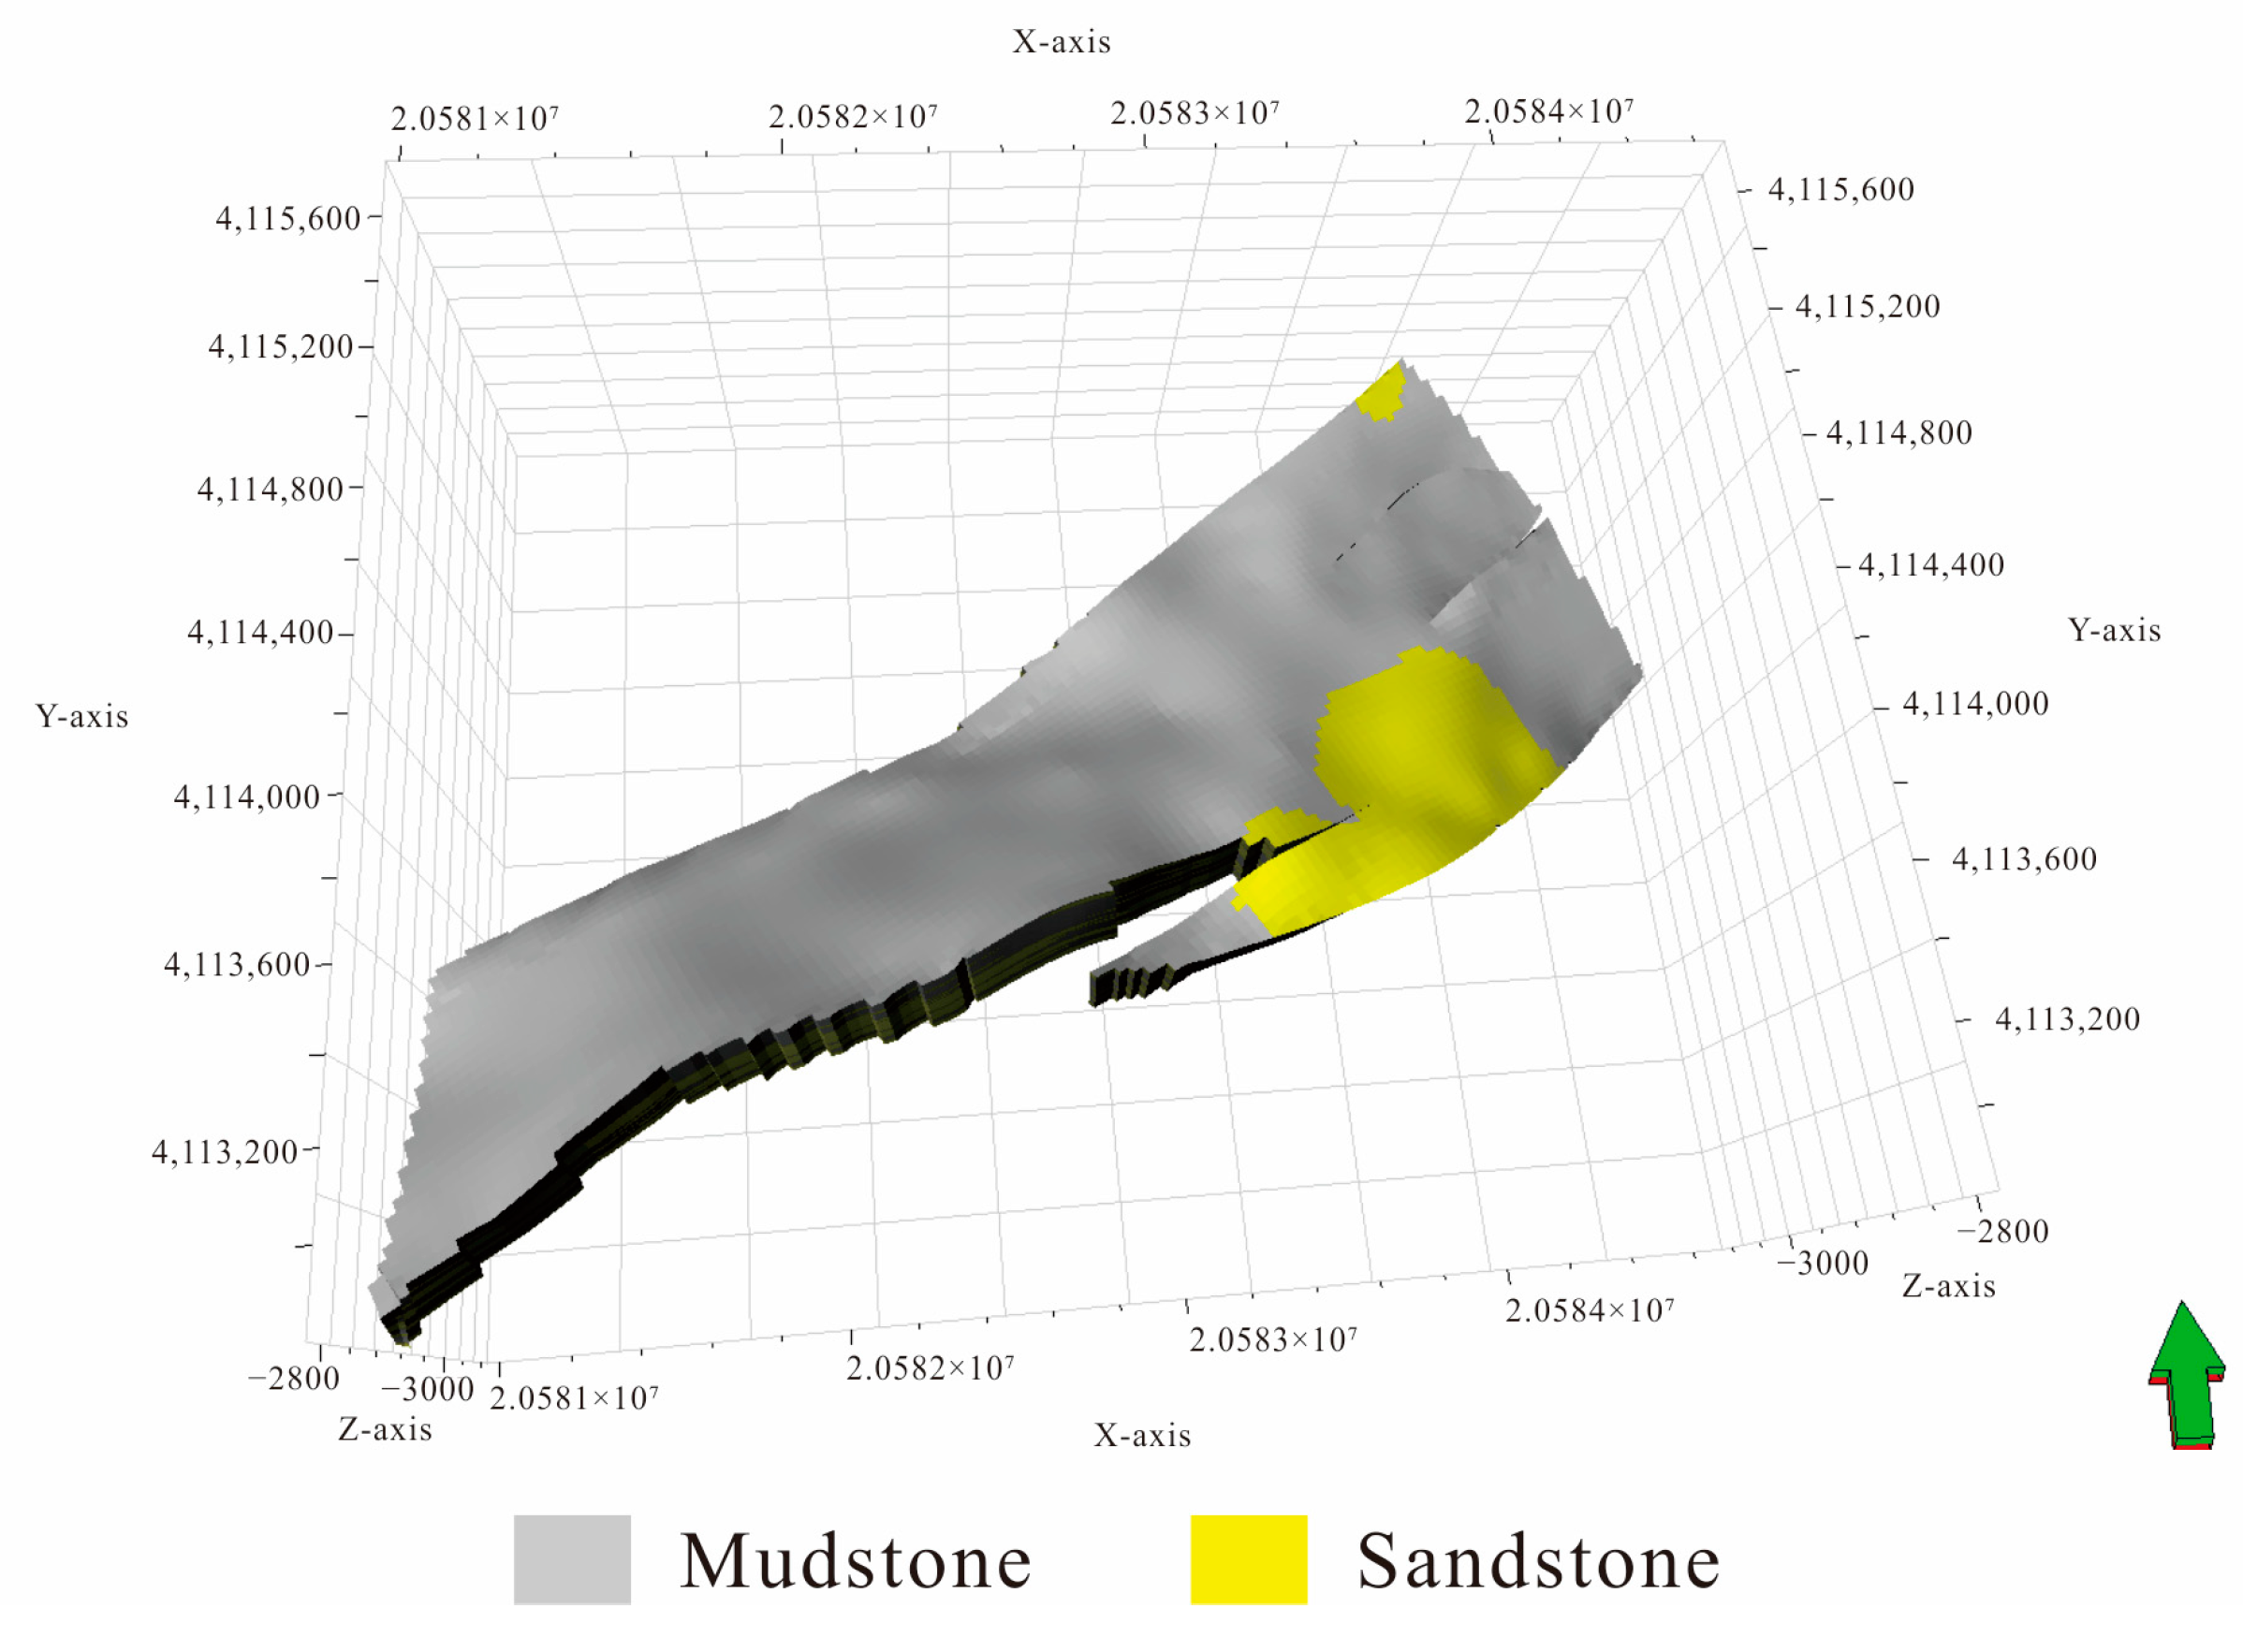
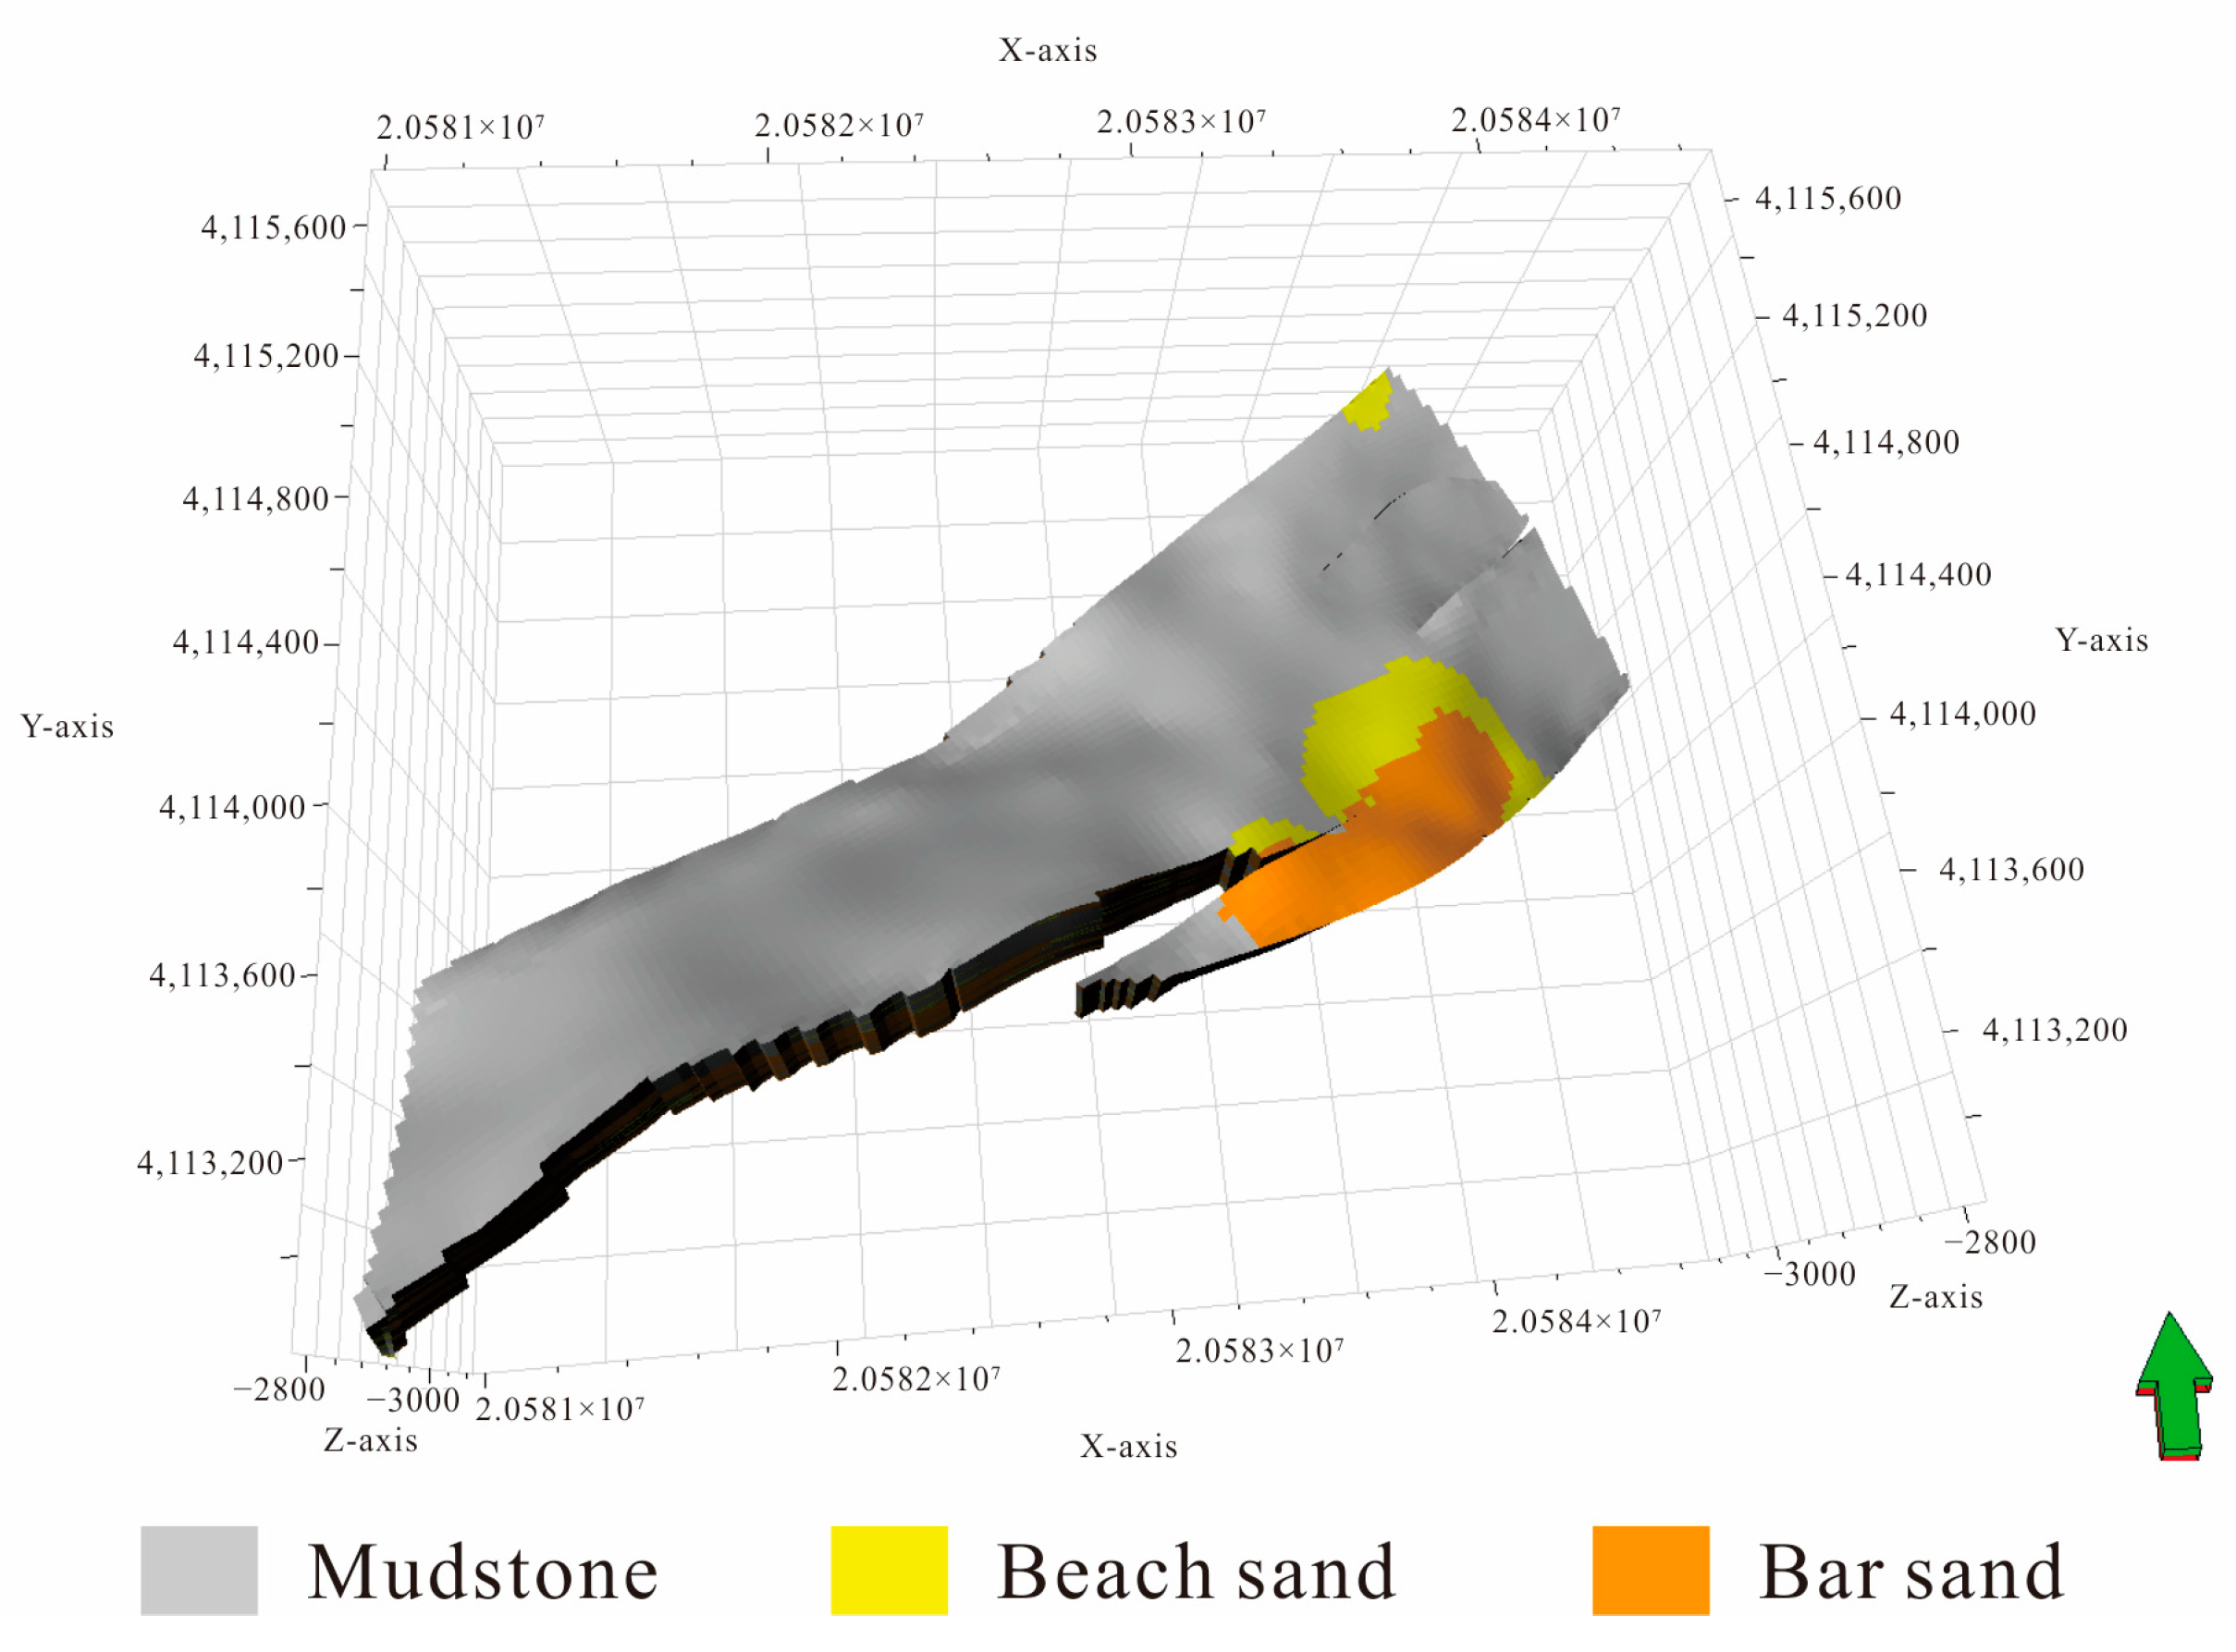
4.2.1. Modeling with New Methods

On the basis of comprehensive research, according to the well data in the study area, the lithofacies in the working area are divided into sandstone and mudstone firstly. At this time, beach sand and bar sand are not distinguished, and only sand and mud are used to characterize the sandbodies in the Gao89-1 block. The data analysis of the lithofacies logging curves was carried out and the sandstone model was established using the sequential indicator simulation method (Figure 13).
On the foundation of the sandstone-mudstone model, the vertical thickness discrimination algorithm for a single sandbody is applied. The sandbody with thickness greater than or equal to 2 m is used as bar sand, and the sandbody with thickness less than 2 m is used as beach sand. The distribution range of beach and bar sand in Gao89-1 is identified, and the sandstone-mudstone model is further transformed into a beach-bar sandbody model. The distribution range of bar sand thickness is 2~10 m through the data of the working area. In line with the empirical relationship of bar sand length and thickness in Gao89-1, the length range of bar sand is about 297~3121 m. The sandbody average length-width ratio of bar sand is 2.1, so the calculated sandbody width is 141~1486 m. Thus, it can be computed that the distribution area of a single sandbody of bar sand is about 83,754~46,378,060 m3. The beach-bar sandbody model is converted into a connected body model, then the bar sand is screened and its volume is calculated. The beach-bar sandbody model is post-processed using the minimum volume of the bar sandbody obtained from the empirical formula in the study area, and the sandbodies in bar sand with a volume less than the minimum volume are converted into beach sand, so as to obtain the final beach-bar sandbody model (Figure 14).

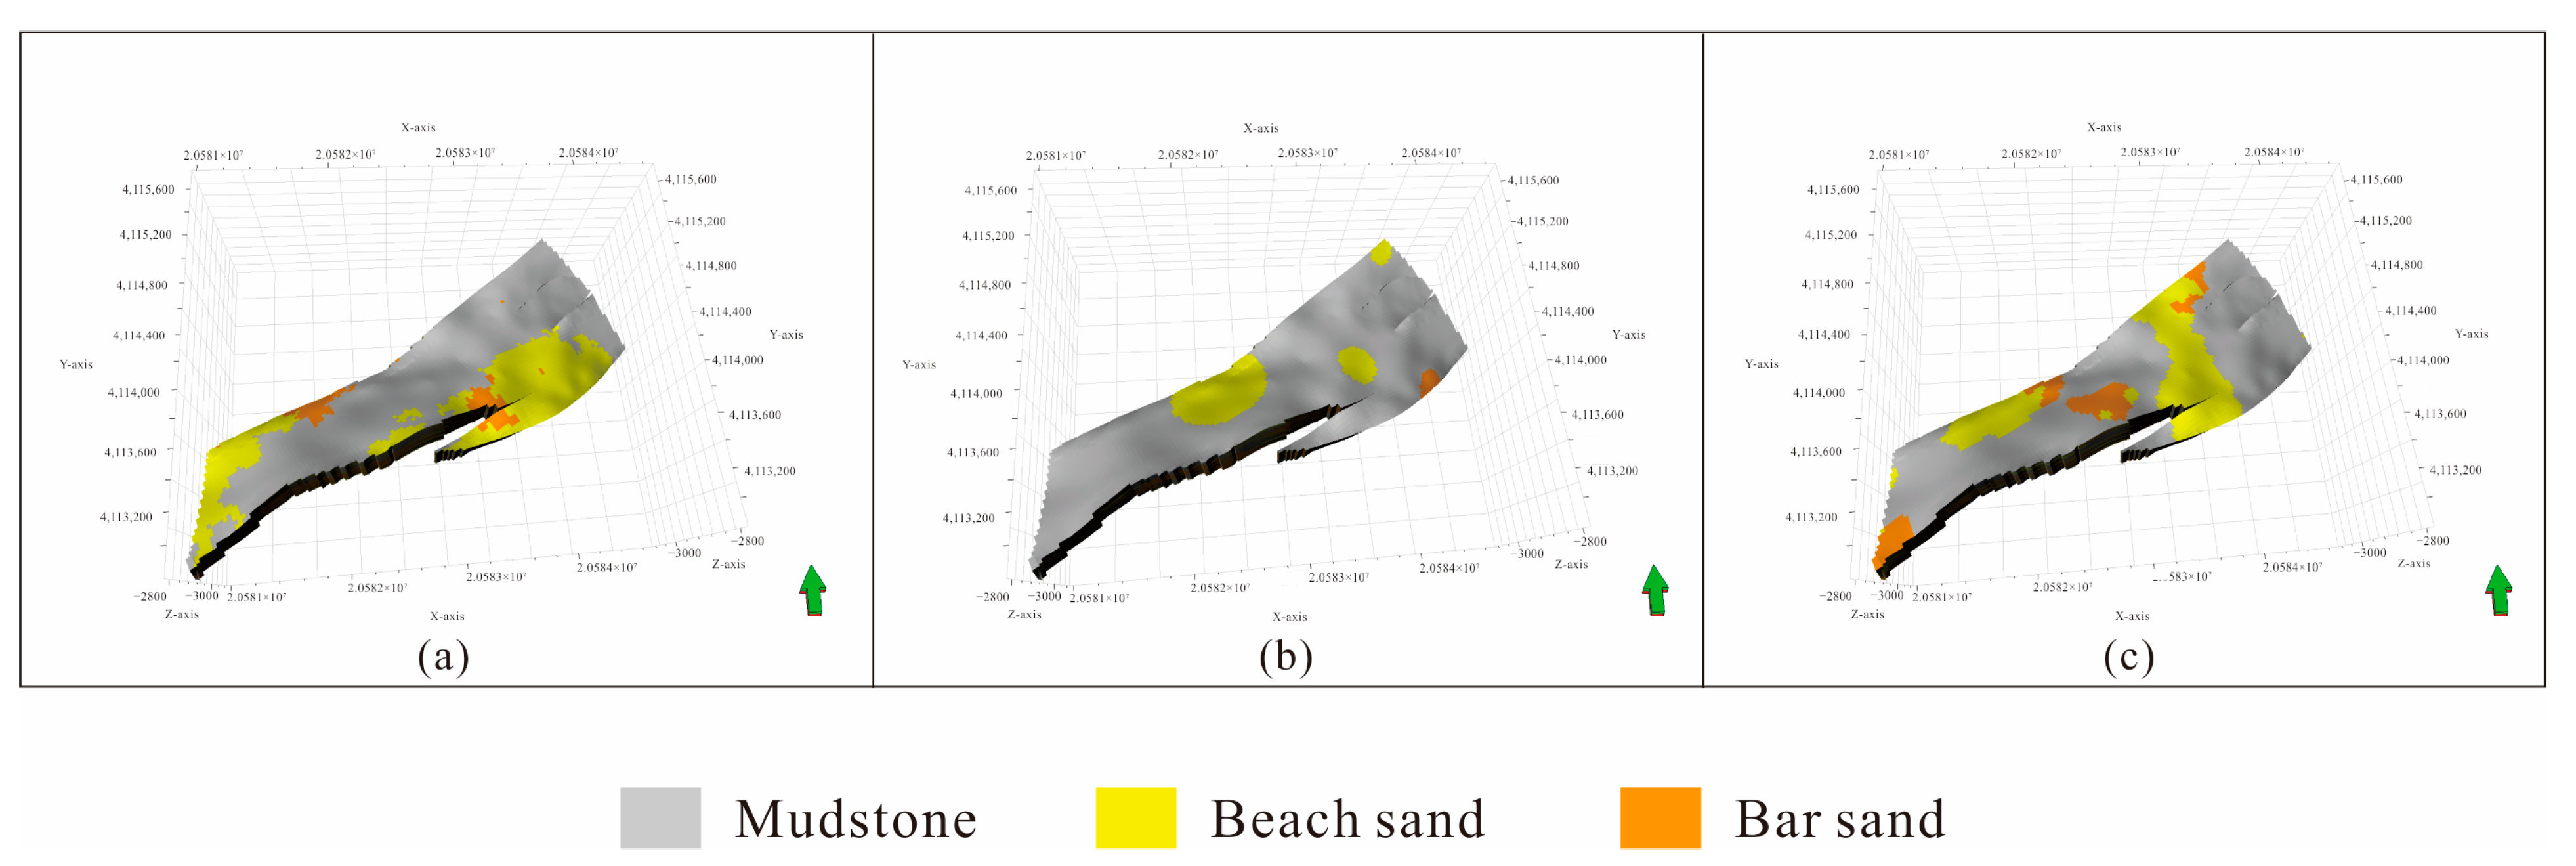
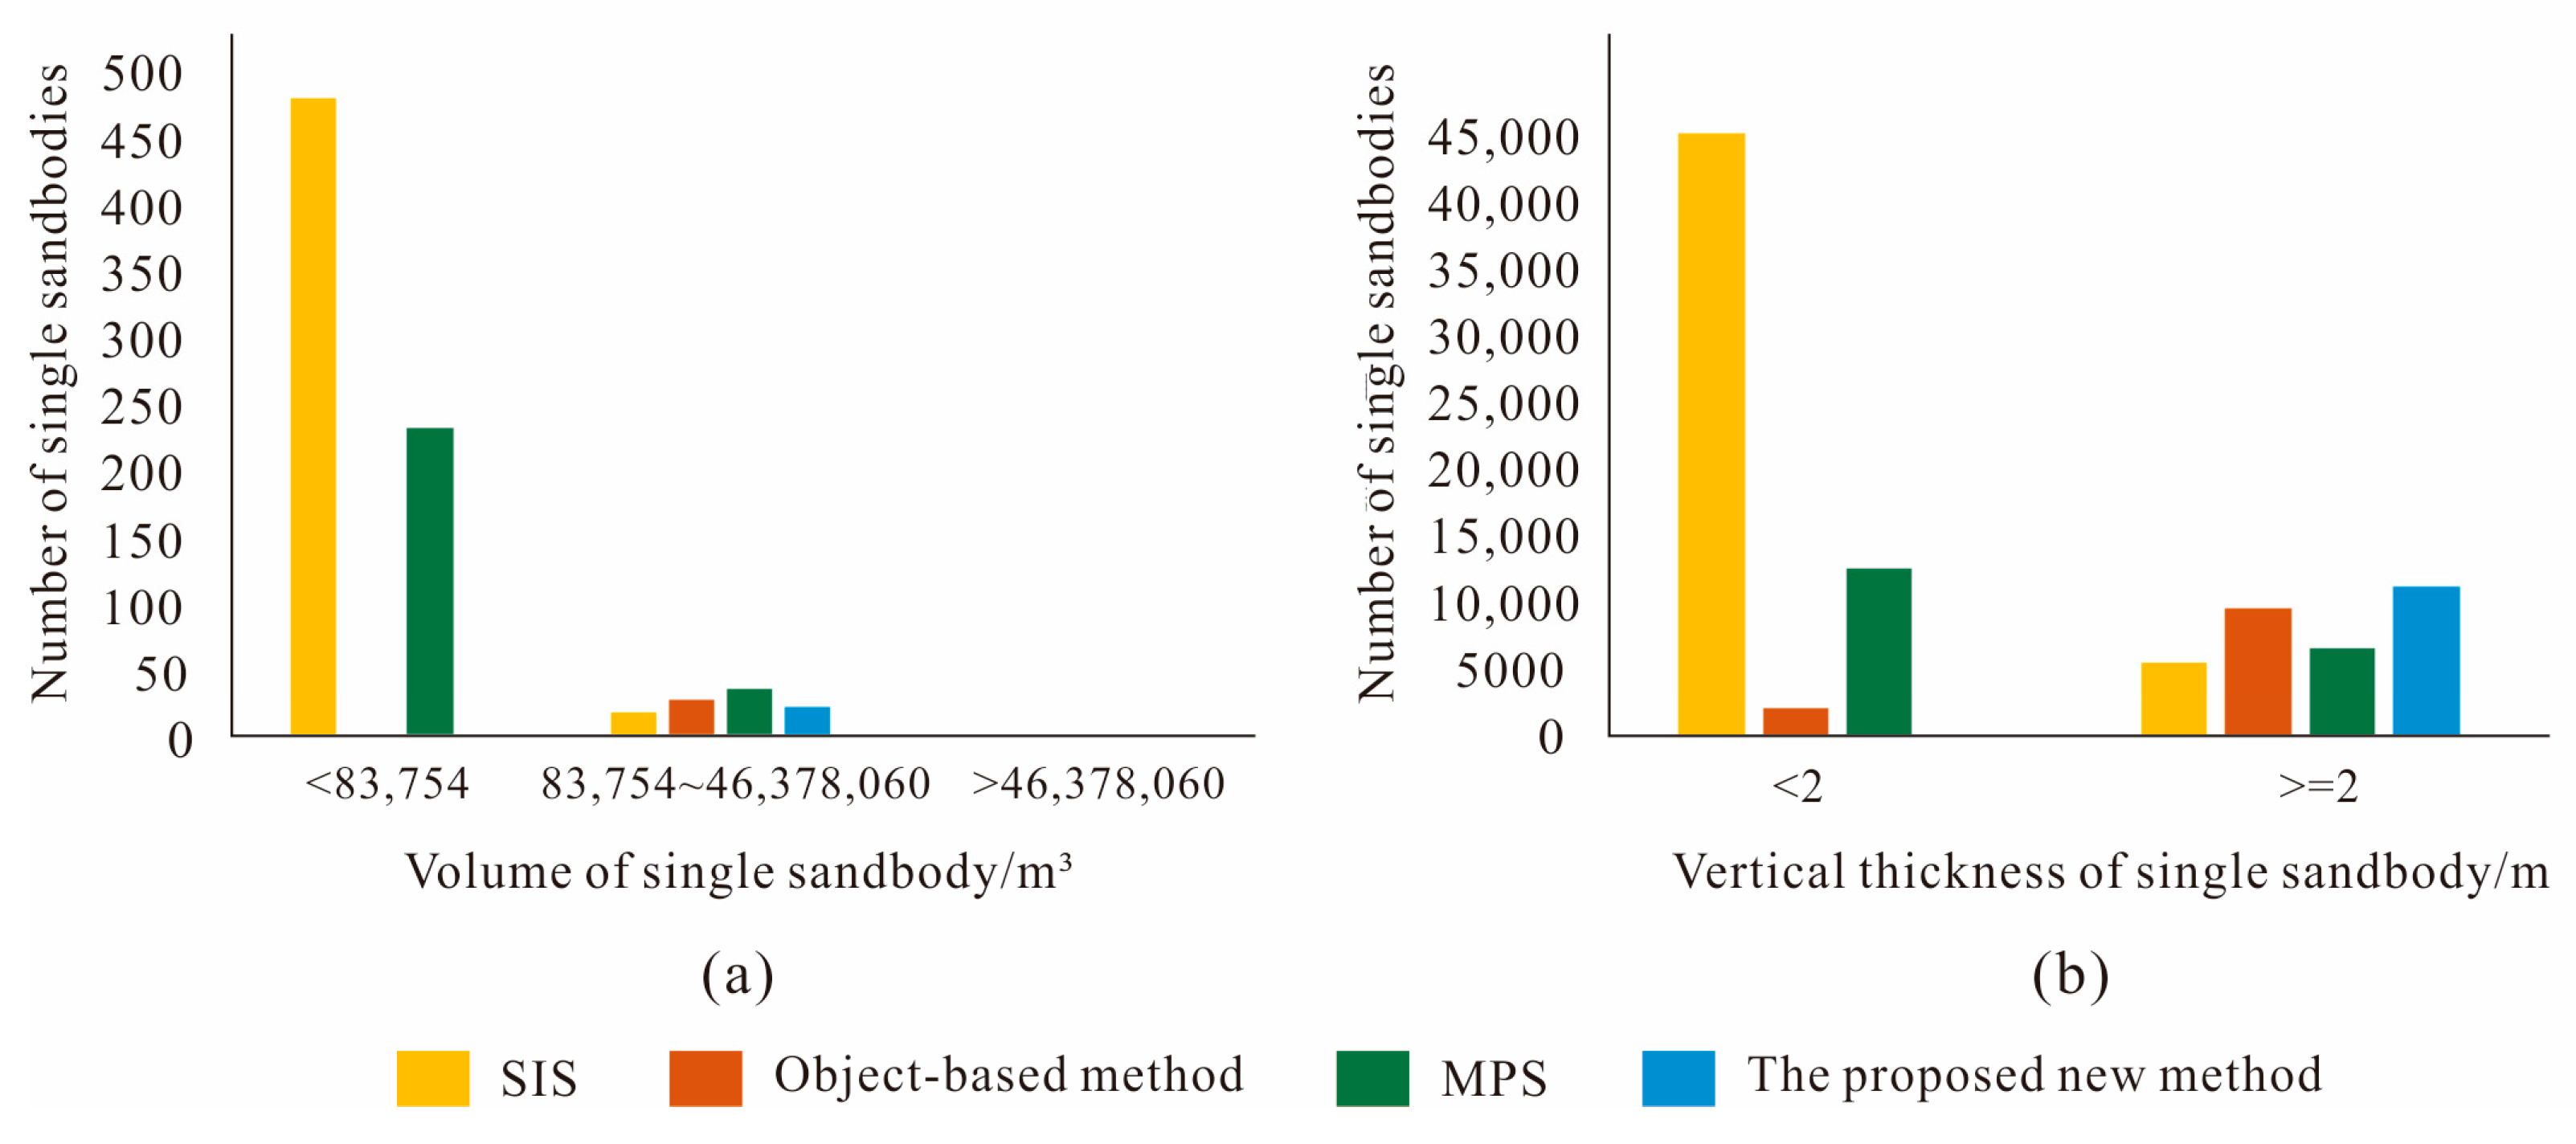
4.2.2. Comparison and Discussion

In addition to using the proposed new method for modeling, this manuscript also compares the simulation results of the following three common methods: sequential indicator simulation, object-based modeling and multiple point geostatistics (MPS). The simulation using the sequential indicator and object-based method is a one-step simulation, which means that the beach sand and bar sand are generated at the same time. The MPS simulation adopts the idea of hierarchical simulation. Firstly, the sandstone-mudstone model is established, and then the beach-bar sandbody model is built under the constraint of the sandstone-mudstone model. The simulation results are shown in Figure 15. The simulation results based on sedimentary mode and sandbody volume method are compared with those of common facies modeling methods, and the situation of beach-bar sandbody is analyzed.
It can be found from the plane and north-south section (the section position is shown in Figure 16) of the simulation results, the simulation results of various methods have certain differences in the deposition mode. The simulation results of the sequential indicator method (Figure 15a and Figure 17a) can meet the well data, and also characterize the distribution characteristics of the beach-bar sandbody on the plane, but the distribution of bar sand is relatively discrete. Through the simulation results of the multi-point statistical method (Figure 15c and Figure 17c), the bar sand is distributed in the beach sand and is relatively concentrated. However, some small-volume independently distributed bar sand is also produced in this approach, which is inconsistent with the bar sand volume established above. Among the three common modeling methods, the bar sand shape simulated based on the object-method is relatively the best (Figure 15b and Figure 17b). Yet, for the produced beach-bar sand model, it is difficult to reproduce the sedimentary mode of this block, and the model is not fully conditioned. The model established with the presented new methodology (Figure 14 and Figure 17d) can not only meet the requirements of conditionalization, but also better reproduce the morphology, volume and sedimentation mode of bar and beach sand.
The thickness and volume of a single sandbody simulated by different modeling methods are further compared (Figure 18). When SIS is used, the bar sand is mainly a thin layer, and the amount of small-volume bar sandbody is large. When the MPS method is adopted for simulation, the amount of bar sand that is larger than 2 m increases slightly, but the distribution of sandbodies in bar sand is still relatively discrete and their volumes are small. When the object-based simulation method is employed, the geological knowledge can be integrated into the model by controlling the geometric parameters of beach and bar sand, so as to control the thickness and volume of bar sand within a reasonable range. At this time, the geometric shape of the semi-ellipsoid is used to simulate the bar sand, and the thickness calculation involves each part of one sandbody, so there will be some statistics that are less than the minimum bar sand thickness. In addition, the object-based modeling method cannot guarantee complete conditionalization. When the method proposed in this paper is used for simulation, the realizations can meet the geological understanding in terms of thickness and single sandbody volume and can be completely conditioned.

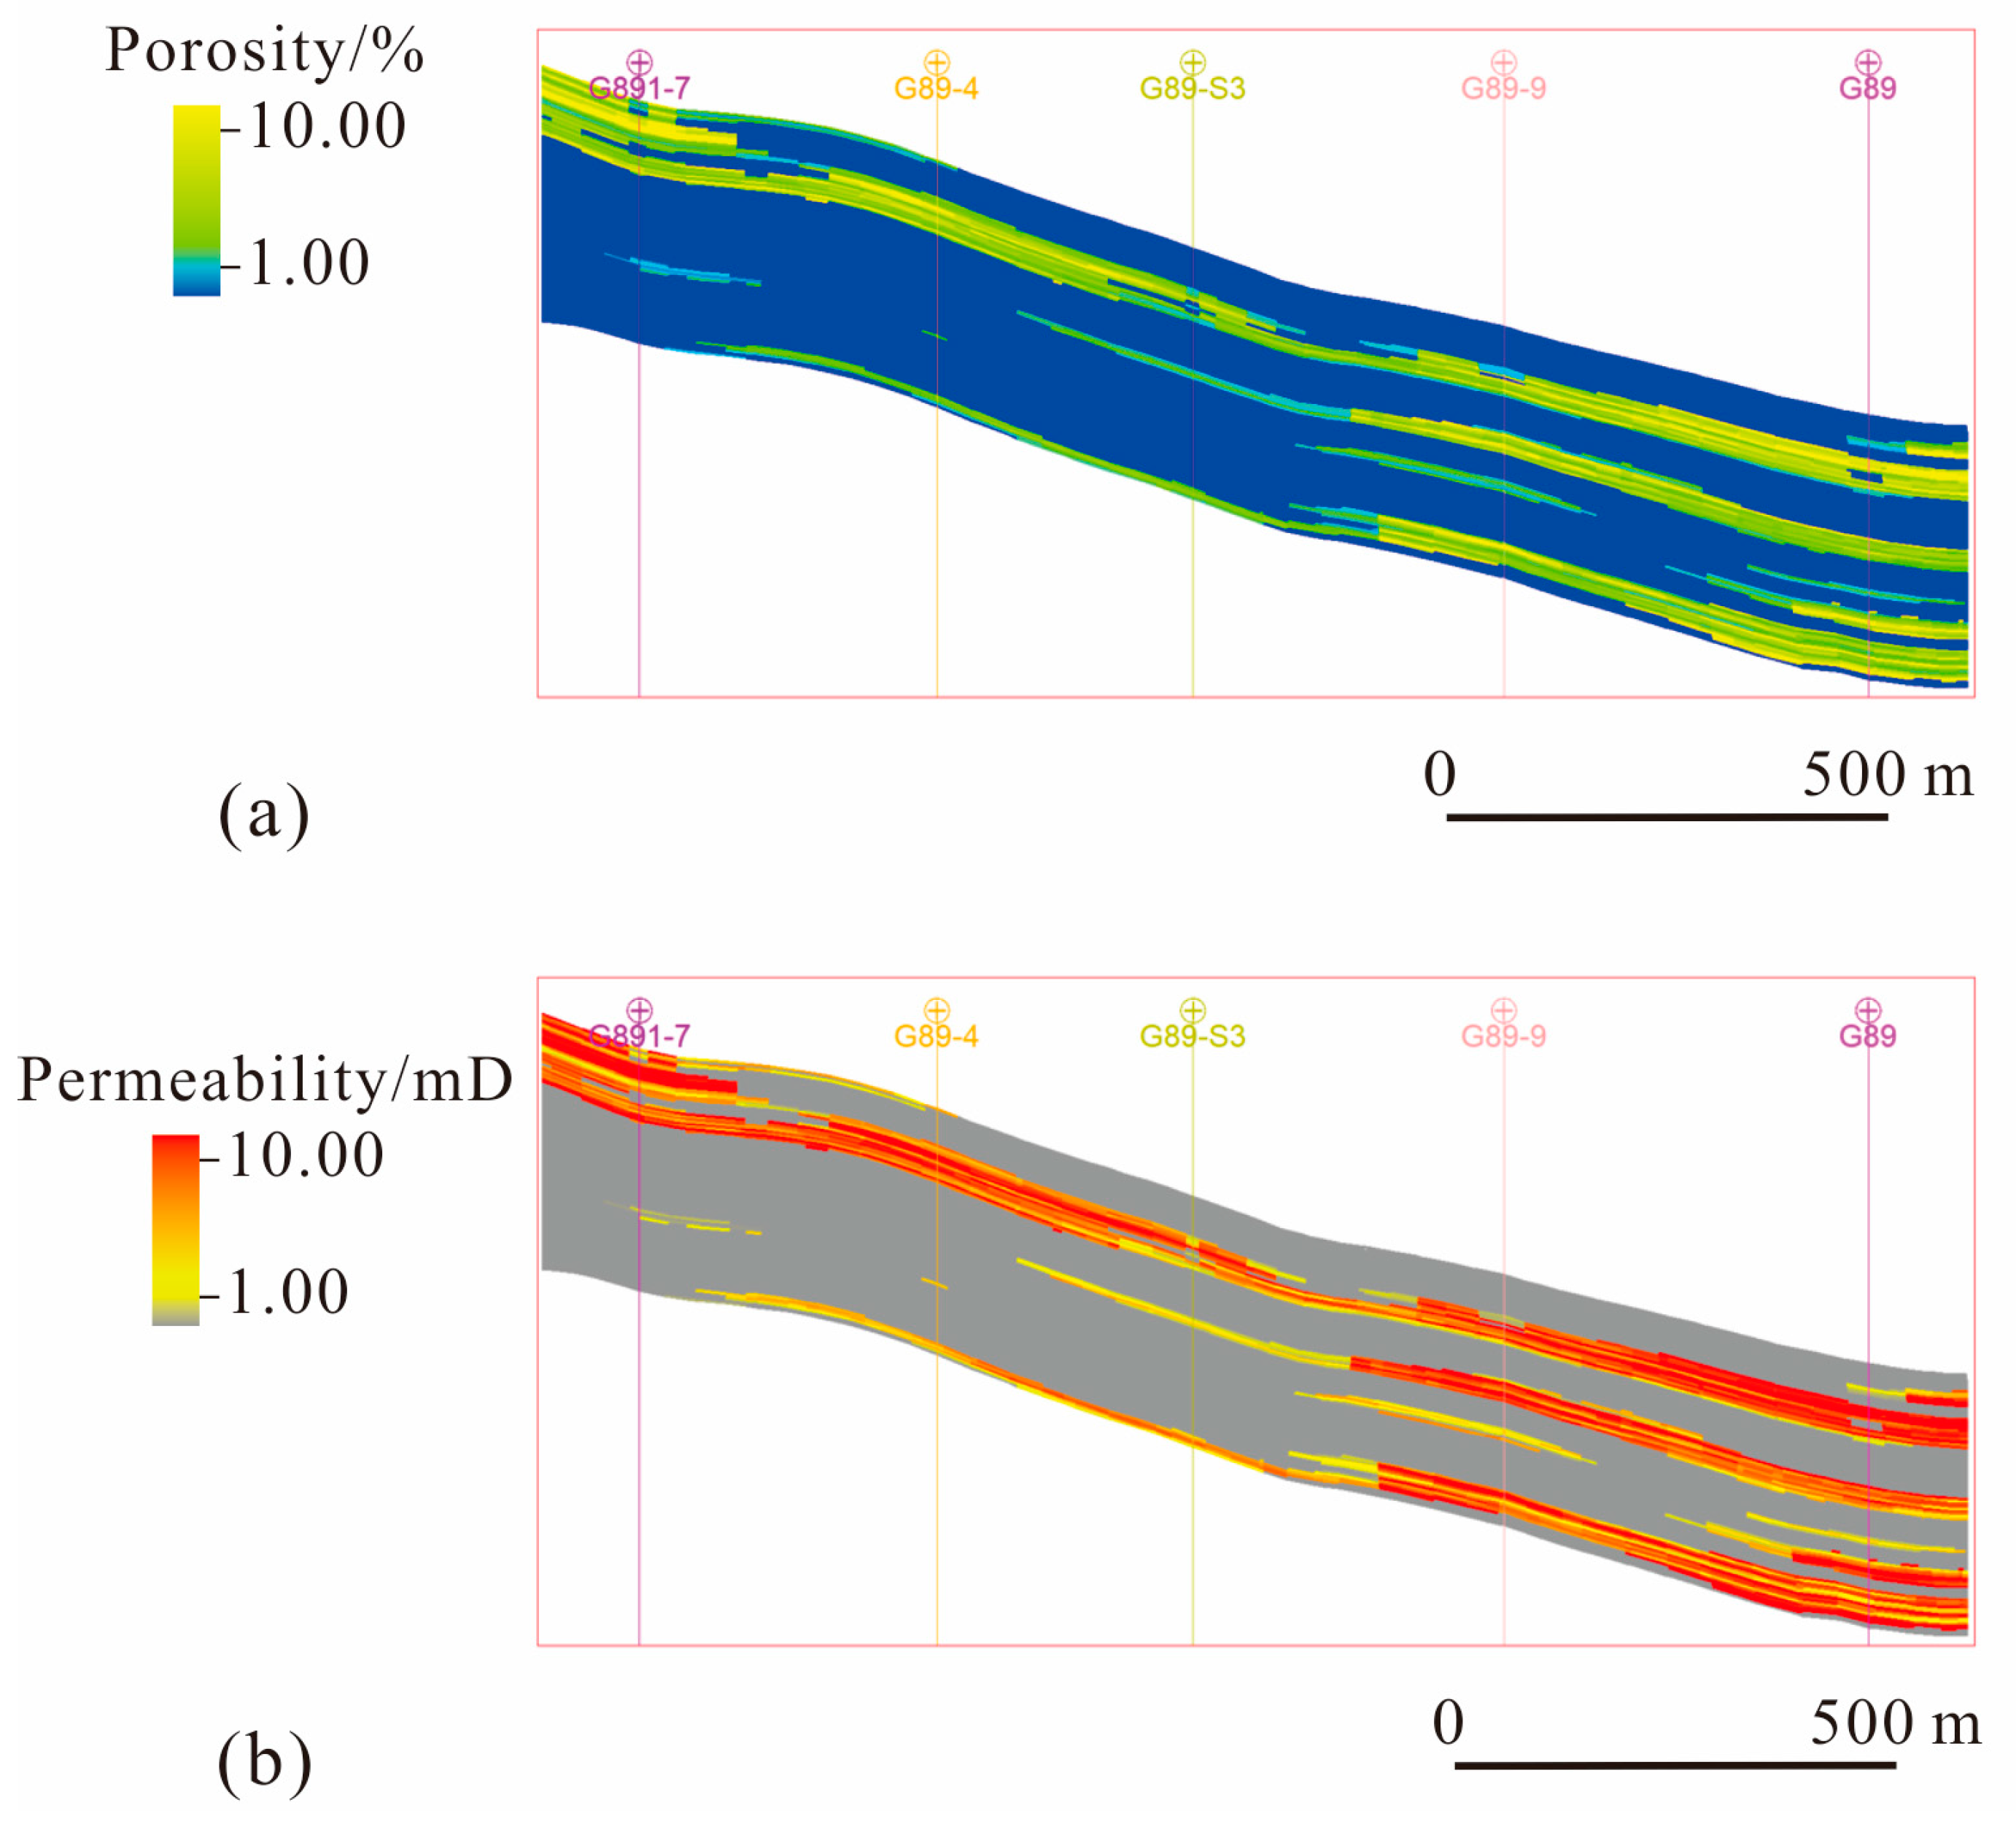
4.3. Property Models

Generally speaking, lithofacies is closely related to reservoir physical properties, and the distribution of lithofacies can better indicate the physical property differences within the reservoir [45,46,47,48] and there is a certain correlation between reservoir porosity and permeability [49,50]. Therefore, on the basis of the three-dimensional models, which can distinguish between beach and bar sand, facies-controlled modeling technology is used to simulate the physical properties of different microfacies, respectively. Firstly, the porosity model is established, and then based on the porosity model, the permeability model of the study area is built by using the idea of co-simulation. From the profile of porosity and permeability model (Figure 19), it can be observed that the petrophysical property models established on the basis of the beach-bar model can better describe the differences of beach and bar sand. The thickness of the sandbody is thicker, the porosity and permeability are higher and the physical properties are better. Starting from the center of the sandbody, the porosity and permeability from the bar sand to the outer edge beach sand decrease and the petrophysical properties become worse. The facies-controlled property models based on the beach-bar sand model can more rationally represent the spatial distribution characteristics of reservoir heterogeneity.

5. Conclusions

A beach-bar reservoir is an important type of sandbody in lacustrine basins. In the process of sedimentary evolution, beach sand and bar sand often overlap and coexist. However, the two types of sandbodies have obvious differences in the depositional mode and sandbody volume. Based on these differences, a new modeling method of beach-bar sandbodies is proposed in this paper. Firstly, a sandstone-mudstone model is directly established without distinguishing between beach and bar sands. Then, in view of whether the vertical thickness of a single sandbody is equal to or greater than the specified threshold (in the Gao89-1 block, this is set as 2 m), the algorithm for distinguishing the two types of sand is compiled using the thickness differentiation. Through the application of the self-made algorithm and the post-processing thought, a beach-bar sandbody model is built based on the sandstone-mudstone model, which is consistent with the beach-bar sand deposition model, and reflects the division standard of beach-bar sand thickness determined by geological research. Based on the facies model of the beach-bar model, the petrophysical property models of the Gao89-1 block are established by using the idea of facies-controlled modeling and co-simulation. The property models display good correlation with the facies model, which reflects the differences and distribution characteristics of the properties between beach sand and bar sand in the study area.

Author Contributions

Conceptualization, S.L.; methodology, S.L.; validation, M.D.; data curation, M.D.; writing—original draft preparation, W.L.; writing—review and editing, S.L.; visualization, W.L.; supervision, Q.Q., H.Z. and J.Z.; project administration, Q.Q., H.Z. and J.Z. All authors have read and agreed to the published version of the manuscript.

Funding

This research was supported by the National Natural Science Foundation of China (No. 42172172).

Data Availability Statement

All data can be obtained from the corresponding author.

Conflicts of Interest

We declare that we have no financial or personal relationships with other people or organizations that could have an inappropriate effect on our work.

References

  1. He, S.; Lan, Z.; Men, C. New braided river model in Sulige Gas Field of Ordos Basin. Acta Pet. Sin. 2005, 26, 25–29. [Google Scholar]
  2. Zhou, L.; Sun, Z.; Tang, G.; Xiao, D.; Cai, Z.; Wang, H.; Su, J.; Hua, S.; Ge, W.; Chen, C.; et al. Pliocene hyperpycnal flow and its sedimentary pattern in D block of Rakhine Basin in Bay of Bengal. Pet. Explor. Dev. 2020, 47, 318–330. [Google Scholar] [CrossRef]
  3. Richards, D.; Konsoer, K.; Langendoen, E.; Ursic, M.; José, C. Depositional patterns of slowly plugging neck cutoffs from core analysis and estimates of bedload transport, White River, Arkansas. Sedimentology 2021, 69, 568–591. [Google Scholar] [CrossRef]
  4. Wu, S.; Zhang, Y.; Li, S.; Wu, Z.; Ringas, J.E. Geological constraint principles in reservoir stochastic modeling. J. Pet. Univ. (Ed. Nat. Sci.) 2001, 25, 55–58+4. [Google Scholar]
  5. Yu, X.; Chen, J.; Zhang, Z.; Li, S.; Hou, G. Stochastic modeling for characteristics of petroleum reservoir constrained by facies. Earth Sci. Front. 2005, 12, 237–244. [Google Scholar]
  6. Chen, S.; Lin, C.; Ren, L.; Liu, W.; Chen, H.; Huang, W. Establishment of the depositional model of sandy braided river: A case from the H Block in Orinoco Heavy Oil Belt, Venezuela. Acta Sedimentol. Sin. 2015, 33, 965–971. [Google Scholar]
  7. Niu, B.; Gao, X.; Zhao, Y.; Song, B.; Zhang, D.; Deng, X. Architecture characterization and modeling of channel bar in paleo-braided river: A case study of dense well pattern area of Sazhong in Daqing oilfield. Acta Pet. Sin. 2015, 36, 89–100. [Google Scholar]
  8. Liu, J.; Xu, W.; Song, L.; Bu, F.; Zou, J.; Zhang, X.; Fang, L. Study on multi-point geostatistical modeling method based on sedimentary model: An example of X oilfield in East African Rift Valley. In Abstracts of the 15th National Conference on Paleogeography and Sedimentology; Southwest Petroleum University: Chengdu, China, 2018; p. 443. [Google Scholar]
  9. Yin, Y.; Zhang, C.; Li, S.; Wang, J.; Song, D.; Gong, W. A pattern-based multiple point geostatistics method. Geol. Rev. 2014, 60, 216–221. [Google Scholar]
  10. Xu, D.; Sun, Z.; Ren, Y.; Yang, C. Geological modeling of braided river tight reservoir based on geological knowledge database. Fault-Block Oil Gas Field 2018, 25, 57–61. [Google Scholar]
  11. Jia, A.; Guo, Z.; Guo, J.; Yan, H. Reaearch achievements on reservoir geological modeling of China in the past three decades. Acta Pet. Sin. 2021, 42, 1506–1515. [Google Scholar]
  12. Zhang, W.; Duan, T.; Liu, Y.; Wang, M.; Lian, P.; Zhao, L. Application status and development trend of quantitative geological modeling. Geol. Sci. Technol. Inf. 2019, 38, 264–275. [Google Scholar]
  13. Li, S.; Hu, X.; Wang, J.; Song, D.; Shi, J. Quantitative characterization of single mouth bar. Lithol. Reserv. 2015, 27, 1–5. [Google Scholar]
  14. Wang, J.; Xie, J. Seismic recognition and quantitative characterization of siliciclastic–carbonate mixed sedimentary rocks in the Bohaiwan Basin, Northeast of China. Carbonates Evaporites 2020, 35, 1–15. [Google Scholar] [CrossRef]
  15. Shi, S.; Hu, S.; Feng, W.; Liu, W. Building geological knowledge database based on Google Earth software. Acta Sedimentol. Sin. 2012, 30, 869–878. [Google Scholar]
  16. Sun, T.; Mu, L.; Zhao, G. Classification and characterization of barrier-intercalation in sandy braided river reservoirs: Taking Hegli Oilfield of Muglad Basin in Sudan as an example. Pet. Explor. Dev. 2014, 41, 112–120. [Google Scholar] [CrossRef]
  17. Wu, X.; Su, H.; Zhang, S.; Feng, L.; Wang, J.; Yin, S. Architecture anatomy and hierarchical modeling of sand-gravel braide river reservoirs: A case study of Zhong32 wells area, Qigu Formation reservoir, Fengceng oilfield. Acta Sedimentol. Sin. 2020, 38, 933–945. [Google Scholar]
  18. Yue, D.; Wu, S.; Liu, J. An accurate method for antomizing architecture of subsurface reservoir in point bar of meandering river. Acta Pet. Sin. 2007, 28, 99–103. [Google Scholar]
  19. Jiang, Z.; Wang, J.; Zhang, Y. Advances in beach-bar research: A review. J. Palaeogeogr. 2015, 17, 427–440. [Google Scholar]
  20. Hou, Q.; Liu, X.; Han, H.; Liu, H.; Wei, G.; Wang, Y. Classification and evaluation of beach bar reservoir sandbody in Boxing Sag. Geol. Rev. 2021, 67, 227–228. [Google Scholar]
  21. Distefano, S.; Gamberi, F.; Baldassini, N.; Di Stefano, A. Quaternary evolution of coastal plain in response to sea-level changes: Example from south-east Sicily (Southern Italy). Water 2021, 13, 1524. [Google Scholar] [CrossRef]
  22. Distefano, S.; Gamberi, F.; Borzì, L.; Di Stefano, A. Quaternary Coastal Landscape Evolution and Sea-Level Rise: An Example from South-East Sicily. Geosciences 2021, 11, 506. [Google Scholar] [CrossRef]
  23. Cao, Y.; Wang, J.; Liu, H.; Jia, G.; Wan, N. Sedimentary characteristics and models of beach-bar sandbodies in the upper part of the fourth member of Paleogene in the south slope of Dongying depression. J. China Univ. Pet. (Ed. Nat. Sci.) 2009, 33, 5–10. [Google Scholar]
  24. Shang, X.; Duan, T.; Hou, J.; Li, Y. Spatial configuration of sand and mud in the lacustrine nearshore sand bar deposits and its geological implications. Pet. Explor. Dev. 2019, 46, 902–915. [Google Scholar] [CrossRef]
  25. Tian, J.; Jiang, Z. Sequence stratigraphy characteristics and sedimentary system evolution of upper Es4 in the Dongying Depression. Acta Geol. Sin. 2009, 83, 836–846. [Google Scholar]
  26. Yang, Y.; Qiu, L.; Jiang, Z.; Yin, X. A depositional pattern of beach bar in continental rift lake basins: A case study on the upper part of the fourth member of the Shahejie Formation in the Dongying Sag. Acta Pet. Sin. 2011, 32, 417–423. [Google Scholar]
  27. Li, G.; Jiang, Z.; Wang, S.; Zhou, H.; Wang, T.; Zhang, Y. The quantitative prognosis of thin interbedded beach-bar sadbodies: A case study of the upper 4th submember of the Paleogene Shahejie Formation in Dongying Sag. Geol. China 2010, 37, 1659–1671. [Google Scholar]
  28. Zeng, F.; Dong, C.; Song, H.; Chen, L. Reservoir heterogeneity and remaining oil distribution in beach bar reservoirs with low permeability. J. Pet. Univ. (Ed. Nat. Sci.) 1998, 22, 42–45+48. [Google Scholar]
  29. Chen, S.; Yang, J.; Cao, Y. Sedimentary characteristics of two kinds of beach-bar of Oligocene Shahejie Formation in western Huimin Depression, China. Coal Geol. Explor. 2000, 28, 1–4. [Google Scholar]
  30. Tian, J.; Jiang, Z. Comparison and analysis of beach bars sedimentary characteristics of upper Es4 in Huimin and Dongying Depression. J. Jilin Univ. (Earth Sci. Ed.) 2012, 42, 612–623. [Google Scholar]
  31. Wang, Y.; Liu, H.; Gao, Y.; Tian, M.; Tang, D. Sandbody genesis and hydrocarbon accumulation mechanism of beach-bar reservoir in faulted-lacustrine-basins: A case study from the upper of the fourth member of Shahejie Formation, Dongying Sag. Earth Sci. Front. 2012, 19, 100–107. [Google Scholar]
  32. Yin, L.; Feng, W.; Yin, Y.; Lei, C.; Xu, Q.; He, Y. Process and model of sedimentation of sandy beach bar due to wave action: An experimental study based on sink sedimentation simulation. Acta Sedimentol. Sin. 2021, 147, 1–18. [Google Scholar]
  33. Zhao, D.; Zhu, X.; Dong, Y.; Wu, D.; Zhu, M. Application of seismic sedimentology to prediction of beach and bar sandbodies in gentle slope of lacustrine basin: A case study of the Low Cretaceous in Chepaizi area, Junggar Basin, NW China. Pet. Explor. Dev. 2014, 41, 55–61. [Google Scholar] [CrossRef]
  34. Clifton, H.E. Supply, segregation, successions, and significance of shallow marine conglomeratic deposits. Bull. Can. Pet. Geol. 2003, 51, 370–388. [Google Scholar] [CrossRef]
  35. Yang, M. Study on geological modeling technology of beach bar sand reservoir by CO2 flooding in Gao89 area of Shengli Oilfield. Inn. Mong. Petrochem. Ind. 2015, 41, 116–118. [Google Scholar]
  36. Zhao, J.; Zeng, J.; Zhang, Y.; Huang, L. Study on sandstone transport system of the upper part of the fourth member of Shahejie Formation in Gao89 block of Boxing Subsag. Lithol. Reserv. 2013, 25, 111–115. [Google Scholar]
  37. Tian, Y. Study on Pore Structure of Tight Sandstone of the 4th Member of Shahejie Formation in G89 Area, Dongying Sag. Master’s Thesis, Chengdu University of Technology, Chengdu, China, 2017. [Google Scholar]
  38. Li, S.; Zhang, C.; Yin, Y. Analysis of Reservoir Modeling Algorithm; Petroleum Industry Press: Beijing, China, 2012. [Google Scholar]
  39. Yu, S.; Li, S.; He, Y.; Duan, T.; Lian, P.; Tao, J.; Bao, X. Multiple-point geostatistics algorithm based on pattern scale-down cluster. Acta Pet. Sin. 2016, 37, 1403–1409. [Google Scholar]
  40. Wang, K.; Xiao, F. Multiple-pints geostatistics: A review of theories, methods and applications. Geol. Sci. Technol. Inf. 2019, 38, 256–268. [Google Scholar]
  41. Deutsch, C.V.; Tran, T.T. FLUVSIM: A program for object-based stochastic modeling of fluvial depositional systems. Comput. Geosci. 2002, 28, 525–535. [Google Scholar] [CrossRef]
  42. Deutsch, C.V.; Wang, L. Hierarchical object-based stochastic modeling of fluvial reservoirs. Math. Geol. 1996, 28, 857–880. [Google Scholar] [CrossRef]
  43. Li, S.; Liu, X.; Wang, J.; Gong, W.; Lu, W. Improvement of the Alluvsim algorithm modeling based on depositional processes. Acta Pet. Sin. 2013, 34, 140–144. [Google Scholar]
  44. Li, S.; Zhang, C.; Yin, Y. Several stochastic modeling methods for fluvial reservoirs. J. Xi’an Pet. Inst. (Earth Sci. Ed.) 2003, 18, 10–16+97. [Google Scholar]
  45. Dou, M.; Li, S.; Wang, J.; Li, Z.; Guo, S.; Yang, M. A method and application of partitioned coupling modeling of multi-source reservoirs. Pet. Geol. Recovery Effic. 2021, 28, 63–70. [Google Scholar]
  46. Sauvageau, M.; Gloaguen, E.; Claprood, M.; Lefebvre, R.; Bêche, M. Multimodal reservoir porosity simulation: An application to a tight oil reservoir. J. Appl. Geophys. 2014, 107, 71–79. [Google Scholar] [CrossRef]
  47. Nazarpour, A.; Shadizadeh, S.R.; Zargar, G. Geostatistical Modeling of Spatial Distribution of Porosity in the Asmari Reservoir of Mansuri Oil Field in Iran. Pet. Sci. Technol. 2014, 32, 1274–1282. [Google Scholar] [CrossRef]
  48. Li, S.; Shi, J.; Yu, J.; Wang, J.; Zhou, C.; Yu, S. Application of SinGAN method in sedimentary facies modeling. Pet. Geol. Recovery Effic. 2022, 29, 37–45. [Google Scholar]
  49. Maniscalco, R.; Fazio, E.; Punturo, R.; Cirrincione, R.; Stefano, A.D.; Distefano, S.; Forzese, M.; Lanzafame, G.; Leonardi, G.S.; Montalbano, S. The Porosity in Heterogeneous Carbonate Reservoir Rocks: Tectonic versus Diagenetic Imprint–A Multi-Scale Study from the Hyblean Plateau (SE Sicily, Italy). Geosciences 2022, 12, 149. [Google Scholar] [CrossRef]
  50. Rashid, F.; Glover, P.W.J.; Lorinczi, P.; Collier, R.; Lawrence, J. Porosity and permeability of tight carbonate reservoir rocks in the north of Iraq. J. Petrol. Sci. Eng. 2015, 133, 147–161. [Google Scholar] [CrossRef] [Green Version]
Figure 1. Structural distribution map of study area. (a) Location of Bohai Bay Basin; (b) location of Dongying depression in Bohai Bay Basin; (c) study area in Dongying depression.
Minerals 12 00950 g001
Figure 2. Top structure of sand group 1 of the lower section of the upper part of Es4 in Gao89-1 block.
Minerals 12 00950 g002
Figure 3. Well logs of beach-bar sand. (a) Cross section of beach sand in Well Gao891; (b) cross section of bar sand in Well Gao89-8.
Minerals 12 00950 g003
Figure 4. (a) The plane distribution of sedimentary facies in the lower section of the upper part of Es4; (b) connectivity model of beach-bar sand.
Minerals 12 00950 g004
Figure 5. Probability diagram of permeability distribution. (a) Beach sand; (b) bar sand.
Minerals 12 00950 g005
Figure 6. (a) Statistical diagram of length-width ratio of bar sand; (b) relationship between length and thickness of bar sand.
Minerals 12 00950 g006
Figure 7. Flow chart of modeling based on depositional mode and sandbody volume.
Minerals 12 00950 g007
Figure 8. Relationship between sandbody thickness and permeability.
Minerals 12 00950 g008
Figure 9. Identification standard of bar sand and beach sand on well log. (a) Bar sand in Well Fan142-4-2; (b) beach sand in Well Gao891-1.
Minerals 12 00950 g009
Figure 10. Algorithm flow of distinguishing between beach sand and bar sand according to continuous thickness.
Minerals 12 00950 g010
Figure 11. Analysis of the algorithm. The grid cells marked with yellow represent sandstone, and are coded as 1; while the grid elements marked with orange represent bar sand, and are coded as 2. (a) Original sandstone-mudstone model; (b) the beach-bar sandbody model which is converted from the original sandstone-mudstone model using the new algorithm.
Minerals 12 00950 g011
Figure 12. Horizon model of Gao89-1 block.
Minerals 12 00950 g012
Figure 13. Sandstone-mudstone model of undifferentiated beach and bar sand in Gao89-1 block.
Minerals 12 00950 g013
Figure 14. Beach-bar model that distinguished between beach and bar sand in Gao89-1 block.
Minerals 12 00950 g014
Figure 15. Beach-bar model established by common simulation methods. (a) Sequential indication simulation; (b) object-based simulation; (c) multipoint geostatistical simulation.
Minerals 12 00950 g015
Figure 16. Well distribution and the nearly north-south section position in the study area.
Minerals 12 00950 g016
Figure 17. North-south sectional view of beach-bar model. The models are obtained by (a) sequential indication simulation; (b) object-based simulation; (c) multipoint geostatistical simulation; (d) the proposed new approach.
Minerals 12 00950 g017
Figure 18. Comparison of simulation results corresponding to different methods. (a) Comparison diagram of bar sand volume; (b) comparison diagram of bar sand thickness.
Minerals 12 00950 g018
Figure 19. Cross sections of property models in the nearly north-south direction (see Figure 16 for the section location). (a) Porosity model; (b) permeability model.
Minerals 12 00950 g019
Table 1. Physical property data sheet of coring wells.
WellPorosity (%)Permeability (mD)Carbonate Content (%)
SamplesAverageSamplesAverageSamplesAverage
Gao89119.15100.27318.2
Gao89-84312.5424.91515.8
Total5411.85241816.1
Publisher’s Note: MDPI stays neutral with regard to jurisdictional claims in published maps and institutional affiliations.

